Emission Rate Approach for Evaluating the Differences in ... Rate Approach for Evaluating the...
34
Emission Rate Approach for Evaluating the Differences in Emissions Between CNG and Diesel Busses By Joon H. Byun, Ph.D. Air Quality Modeling Specialist Federal Highway Administration
Transcript of Emission Rate Approach for Evaluating the Differences in ... Rate Approach for Evaluating the...
Emission Rate Approach for Evaluating the Differences in Emissions
Between CNG and Diesel Busses
By Joon H. Byun, Ph.D.
Air Quality Modeling Specialist Federal Highway Administration

Background Information (MOBILE vs. MOVES)
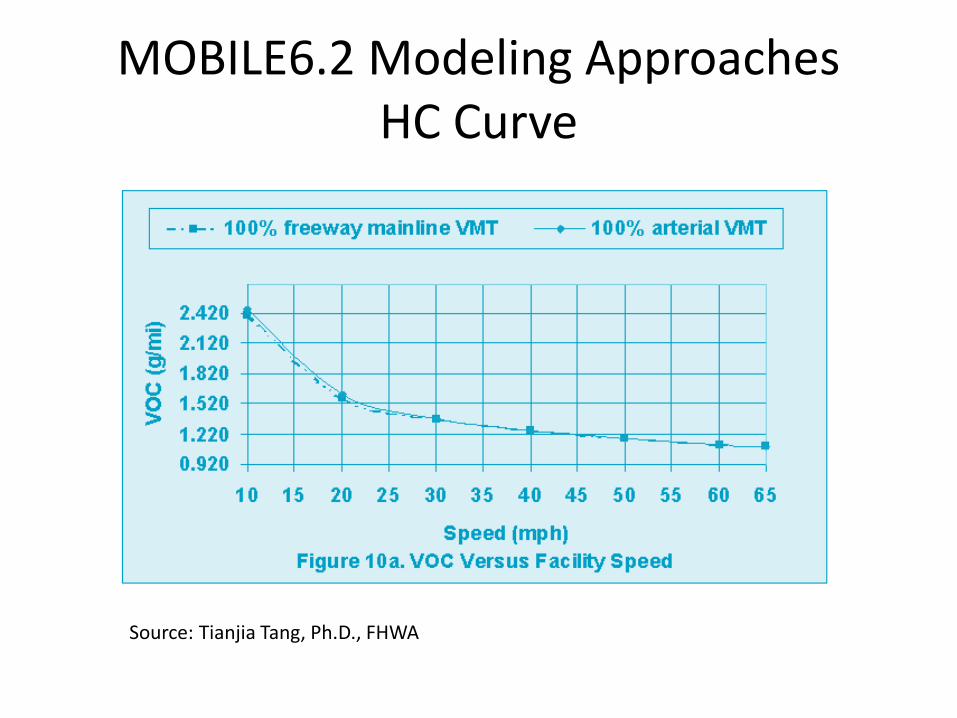
MOBILE6.2 Modeling Approaches HC Curve
Source: Tianjia Tang, Ph.D., FHWA
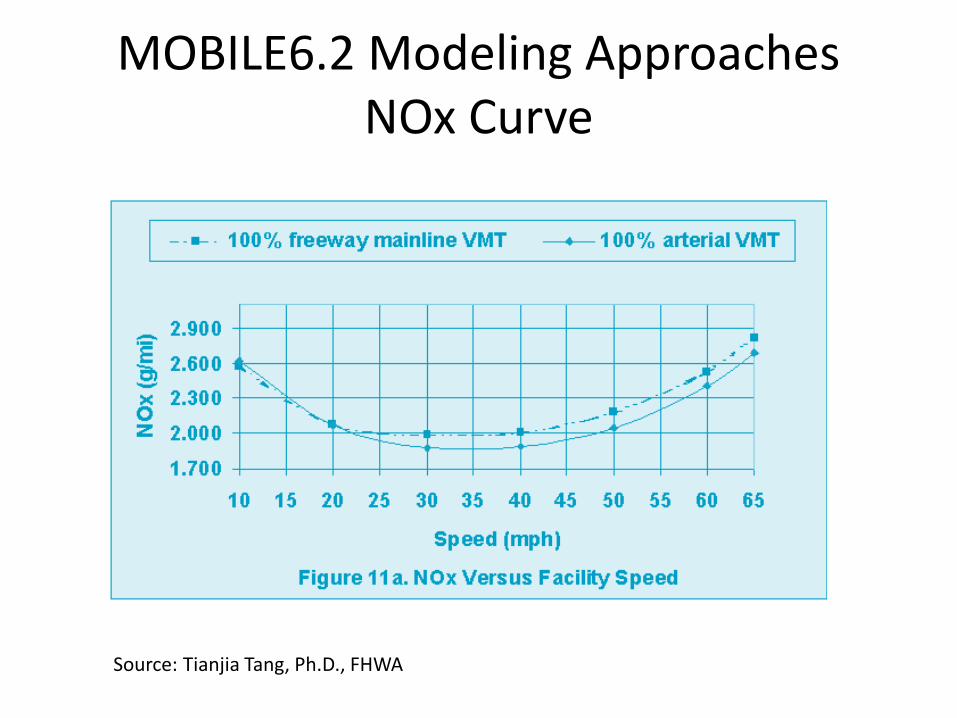
MOBILE6.2 Modeling Approaches NOx Curve
Source: Tianjia Tang, Ph.D., FHWA
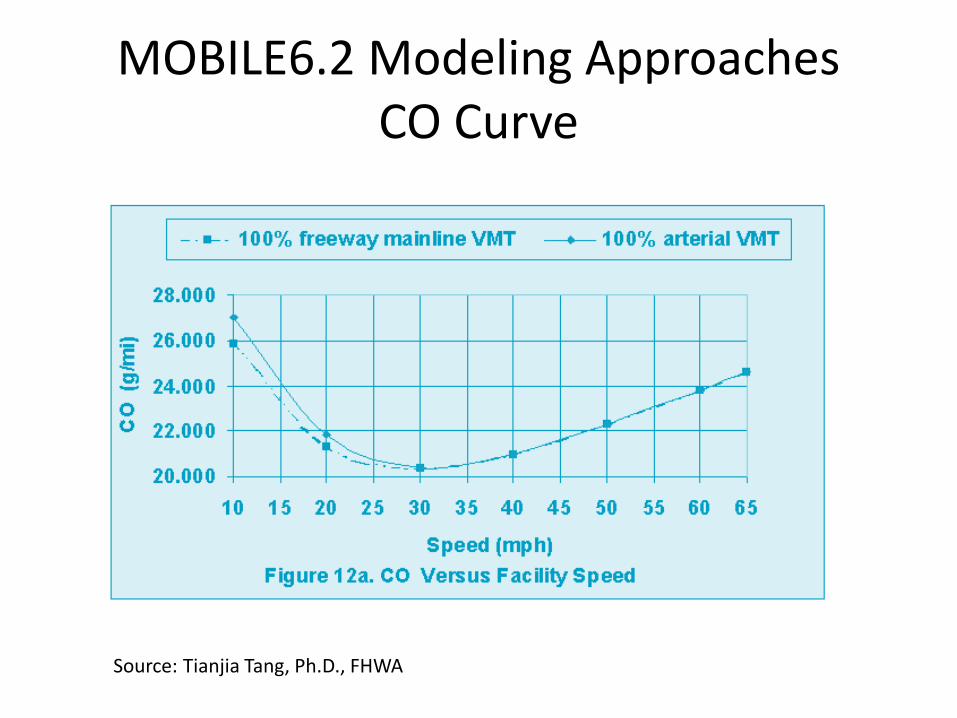
MOBILE6.2 Modeling Approaches CO Curve
Source: Tianjia Tang, Ph.D., FHWA
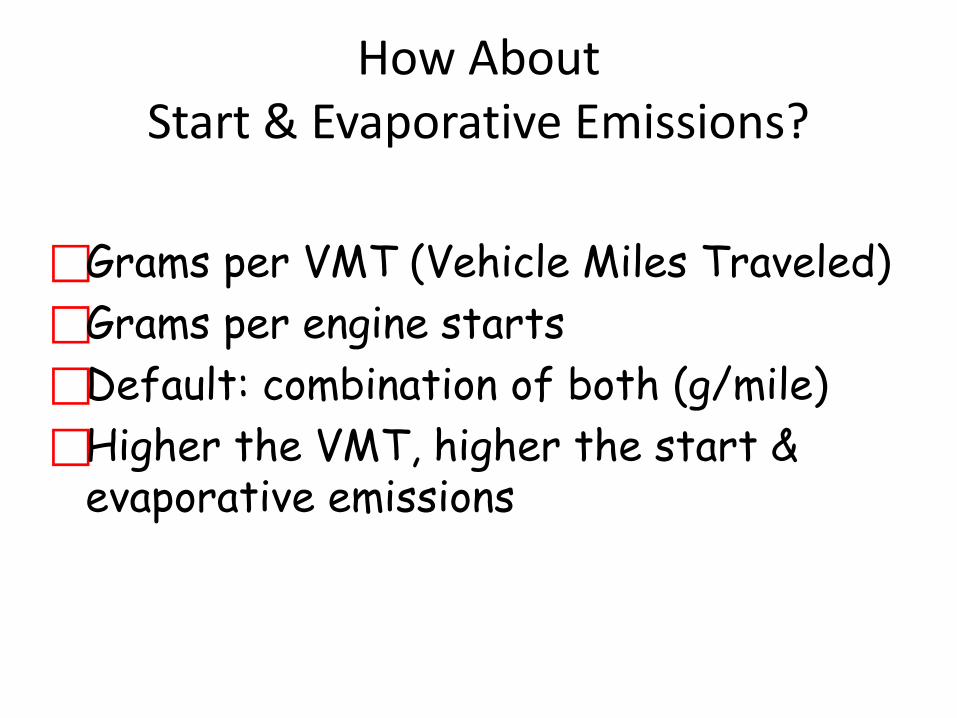
How About Start & Evaporative Emissions?
Grams per VMT (Vehicle Miles Traveled) Grams per engine starts Default: combination of both (g/mile) Higher the VMT, higher the start &
evaporative emissions
7
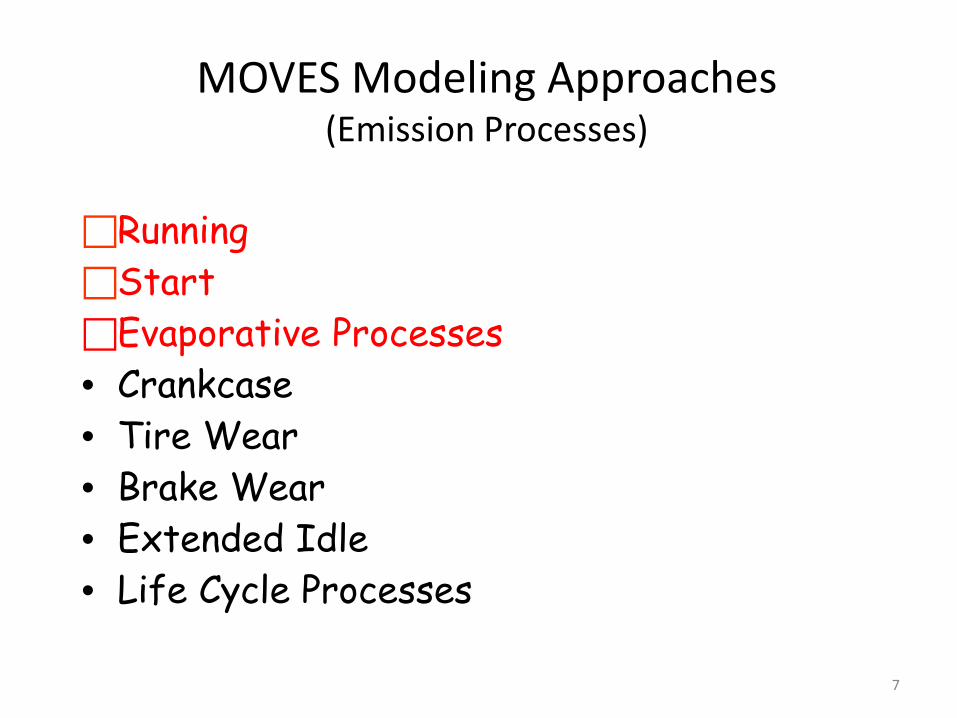
MOVES Modeling Approaches (Emission Processes)
Running Start Evaporative Processes • Crankcase • Tire Wear • Brake Wear • Extended Idle • Life Cycle Processes
8
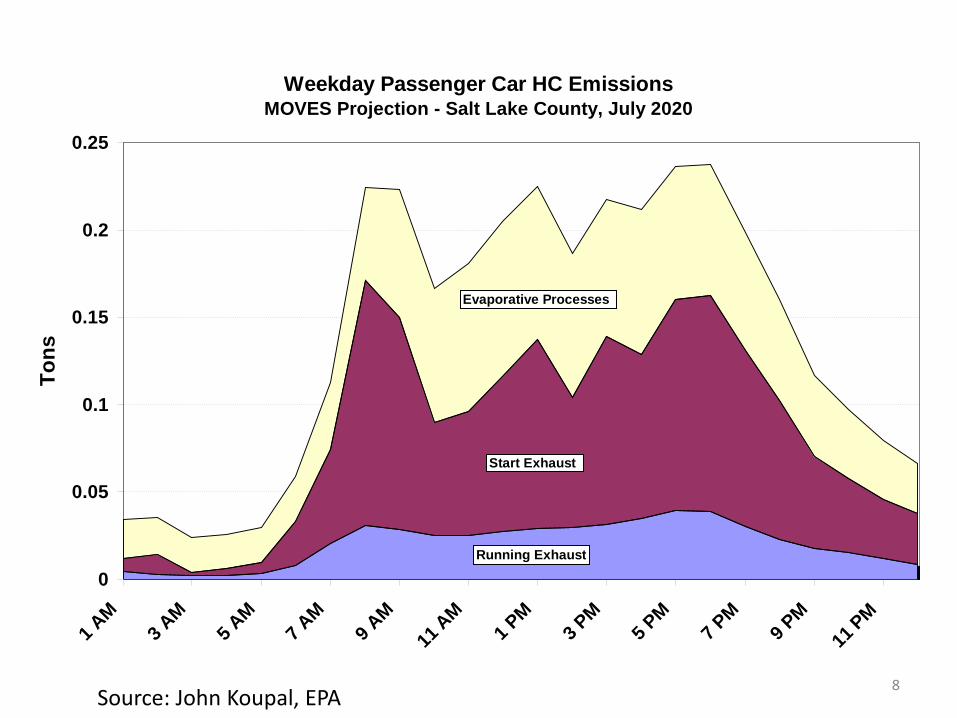
Weekday Passenger Car HC EmissionsMOVES Projection - Salt Lake County, July 2020
0
0.05
0.1
0.15
0.2
0.25
1 AM
3 AM
5 AM
7 AM
9 AM
11 A
M1 P
M3 P
M5 P
M7 P
M9 P
M11
PM
Tons
Running Exhaust
Start Exhaust
Evaporative Processes
Source: John Koupal, EPA
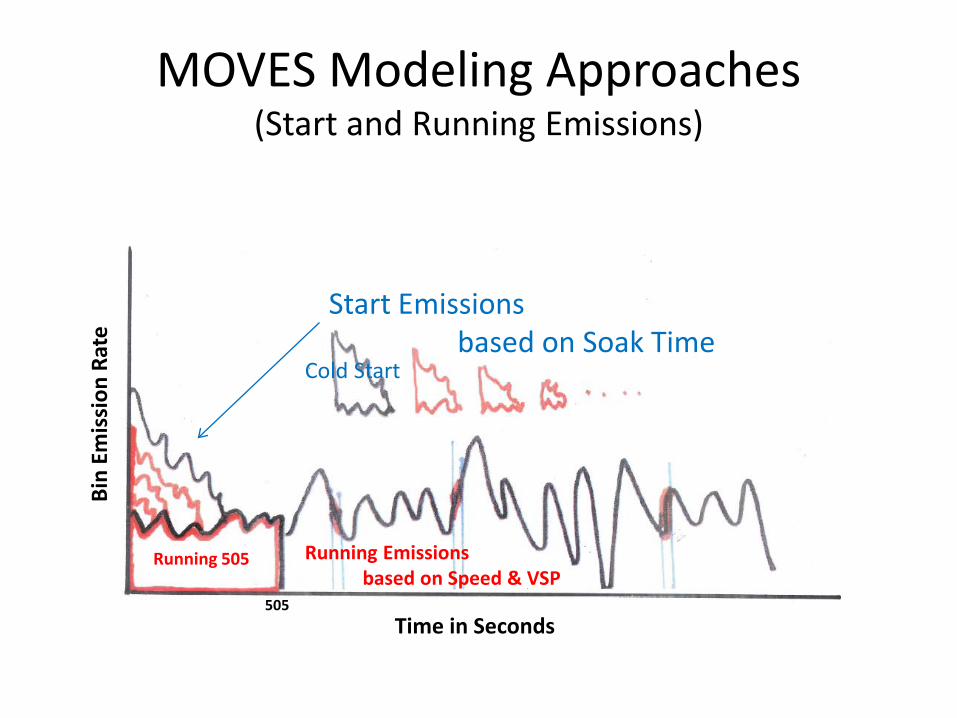
MOVES Modeling Approaches (Start and Running Emissions)
Start Emissions based on Soak Time
Cold Start
Time in Seconds
Running 505 Running Emissions based on Speed & VSP
Bin
Emis
sion
Rat
e
505
10
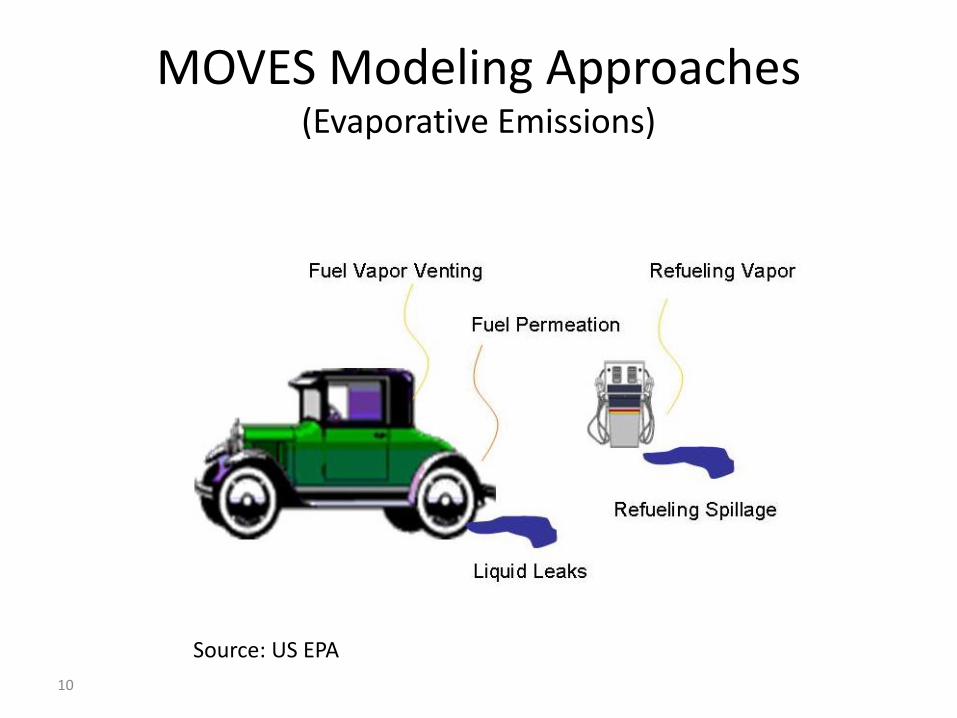
MOVES Modeling Approaches (Evaporative Emissions)
Source: US EPA
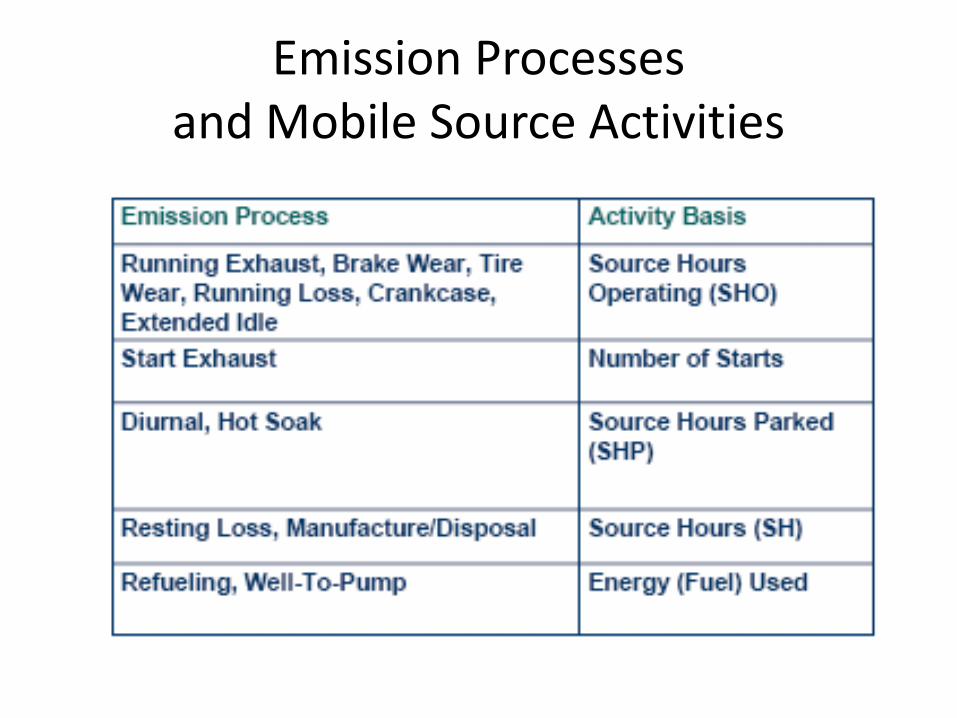
Emission Processes and Mobile Source Activities
12
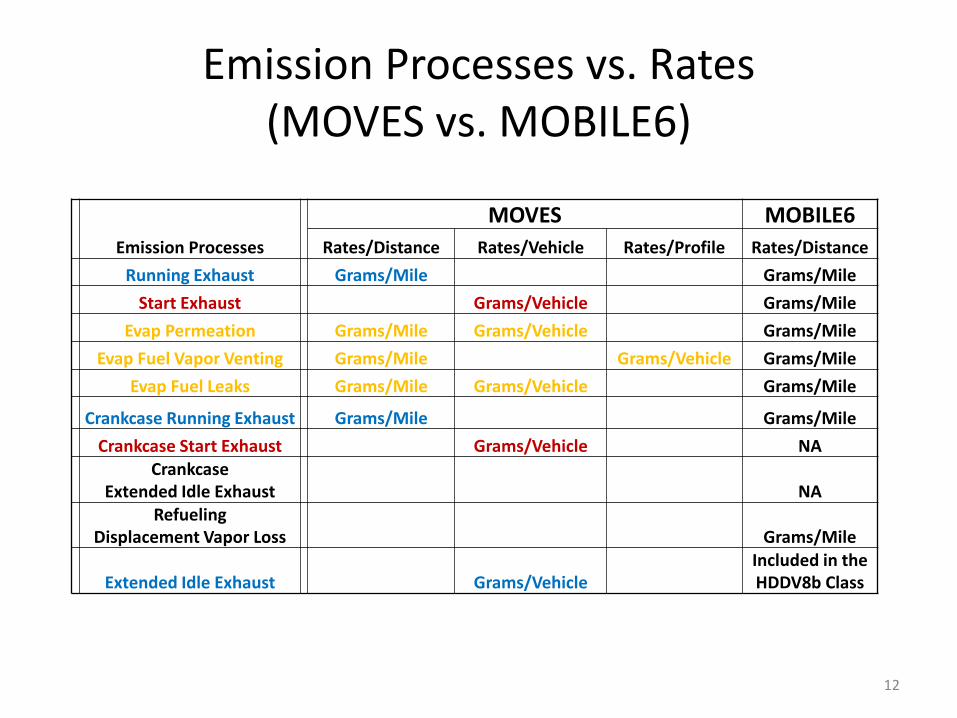
Emission Processes
MOVES MOBILE6 Rates/Distance Rates/Vehicle Rates/Profile Rates/Distance
Running Exhaust Grams/Mile Grams/Mile Start Exhaust Grams/Vehicle Grams/Mile
Evap Permeation Grams/Mile Grams/Vehicle Grams/Mile Evap Fuel Vapor Venting Grams/Mile Grams/Vehicle Grams/Mile
Evap Fuel Leaks Grams/Mile Grams/Vehicle Grams/Mile
Crankcase Running Exhaust Grams/Mile Grams/Mile Crankcase Start Exhaust Grams/Vehicle NA
Crankcase Extended Idle Exhaust NA
Refueling Displacement Vapor Loss Grams/Mile
Extended Idle Exhaust Grams/Vehicle Included in the HDDV8b Class
Emission Processes vs. Rates (MOVES vs. MOBILE6)
Running Emissions
Grams/Mile by Temperature
14
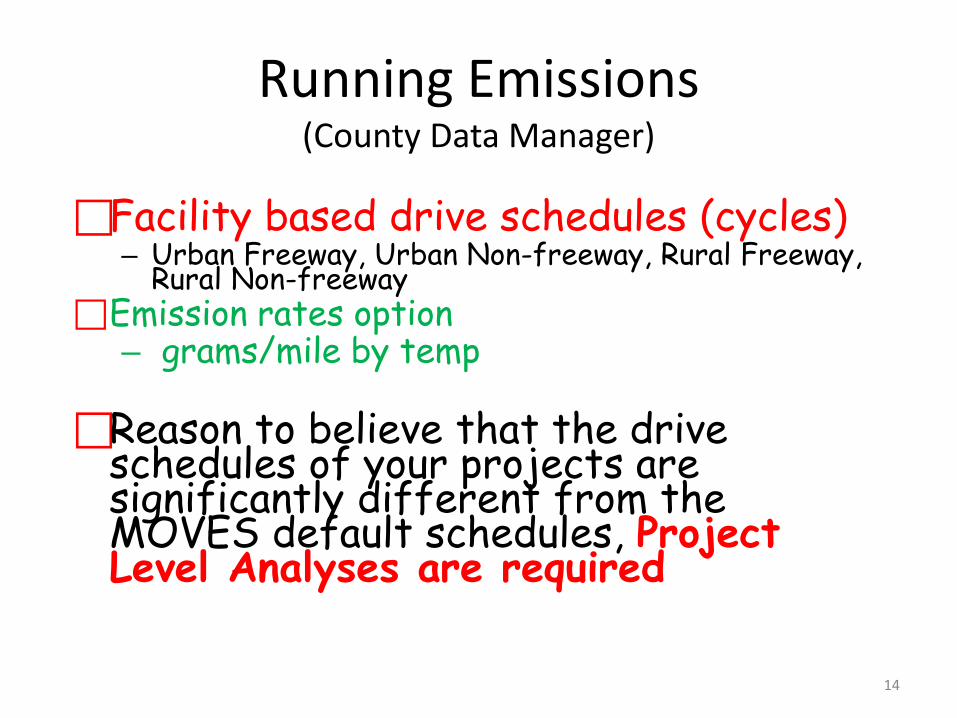
Running Emissions (County Data Manager)
Facility based drive schedules (cycles) – Urban Freeway, Urban Non-freeway, Rural Freeway,
Rural Non-freeway Emission rates option
– grams/mile by temp
Reason to believe that the drive schedules of your projects are significantly different from the MOVES default schedules, Project Level Analyses are required
15
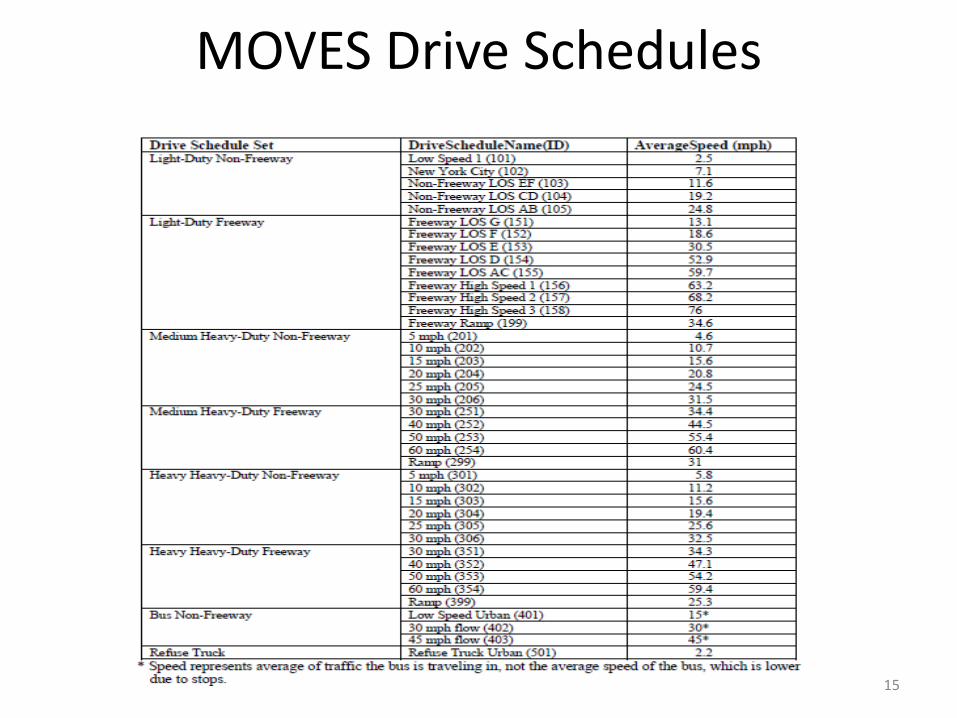
MOVES Drive Schedules
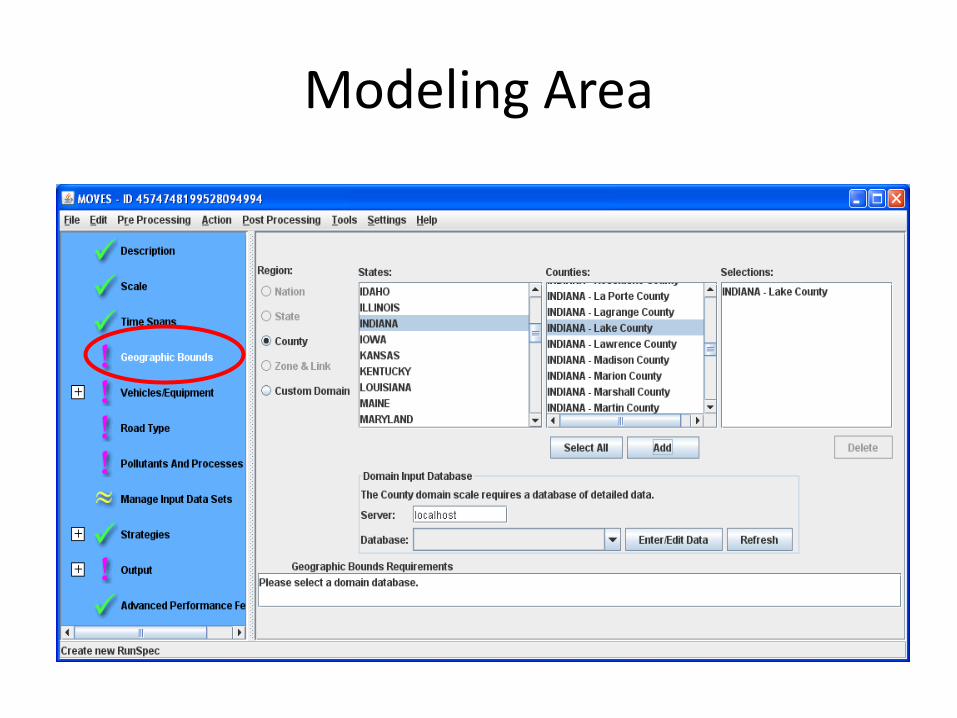
Modeling Area
Start Emissions
Grams/Vehicle by Hours
18
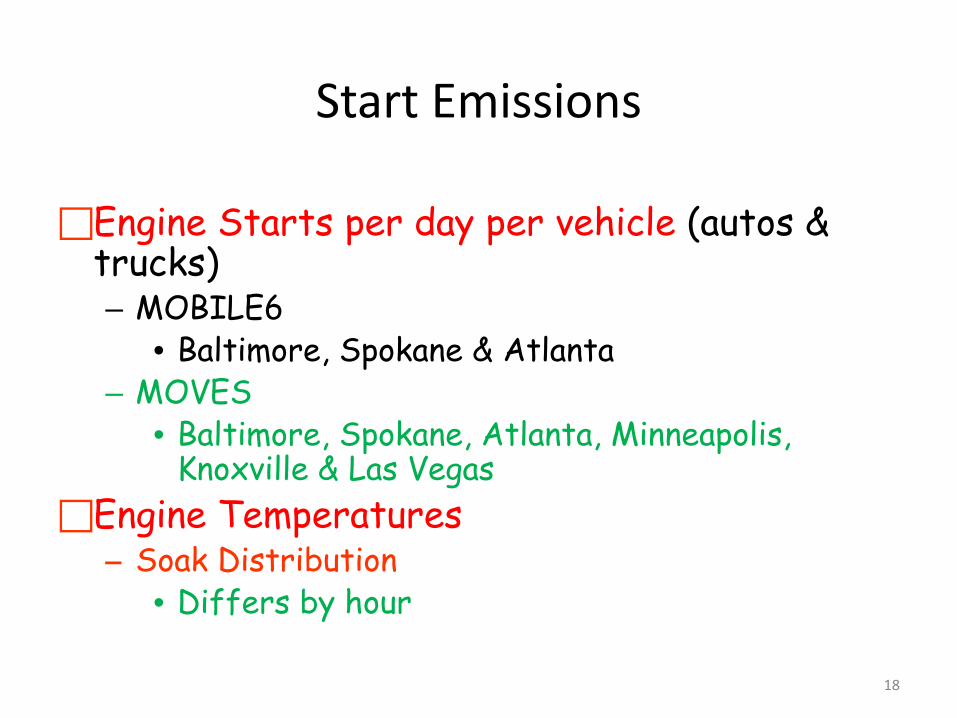
Start Emissions
Engine Starts per day per vehicle (autos & trucks) – MOBILE6
• Baltimore, Spokane & Atlanta – MOVES
• Baltimore, Spokane, Atlanta, Minneapolis, Knoxville & Las Vegas
Engine Temperatures – Soak Distribution
• Differs by hour
19
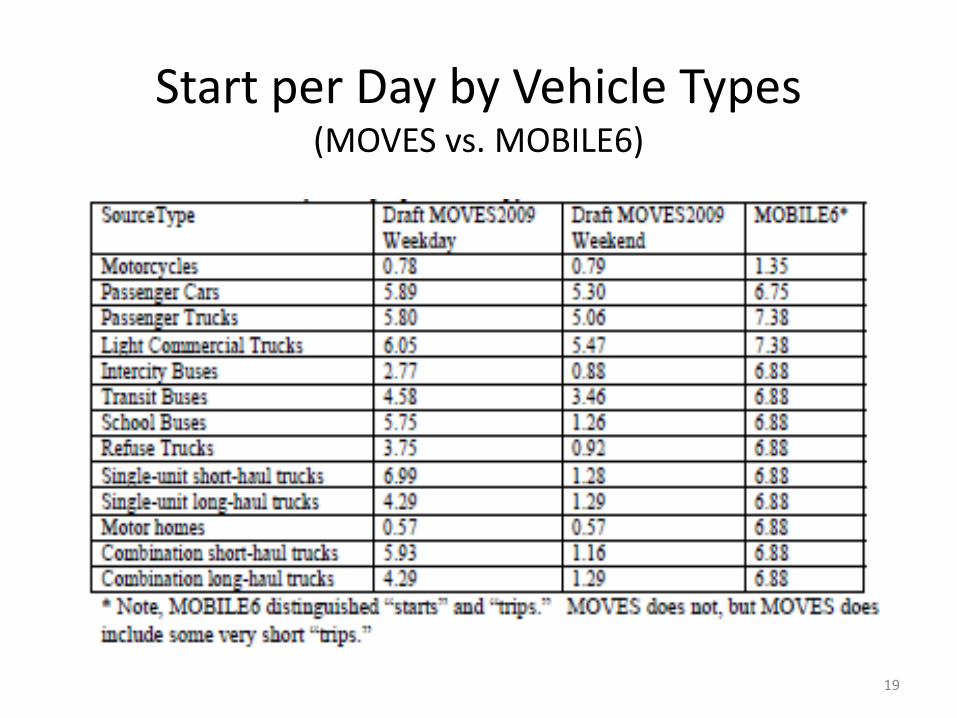
Start per Day by Vehicle Types (MOVES vs. MOBILE6)
20
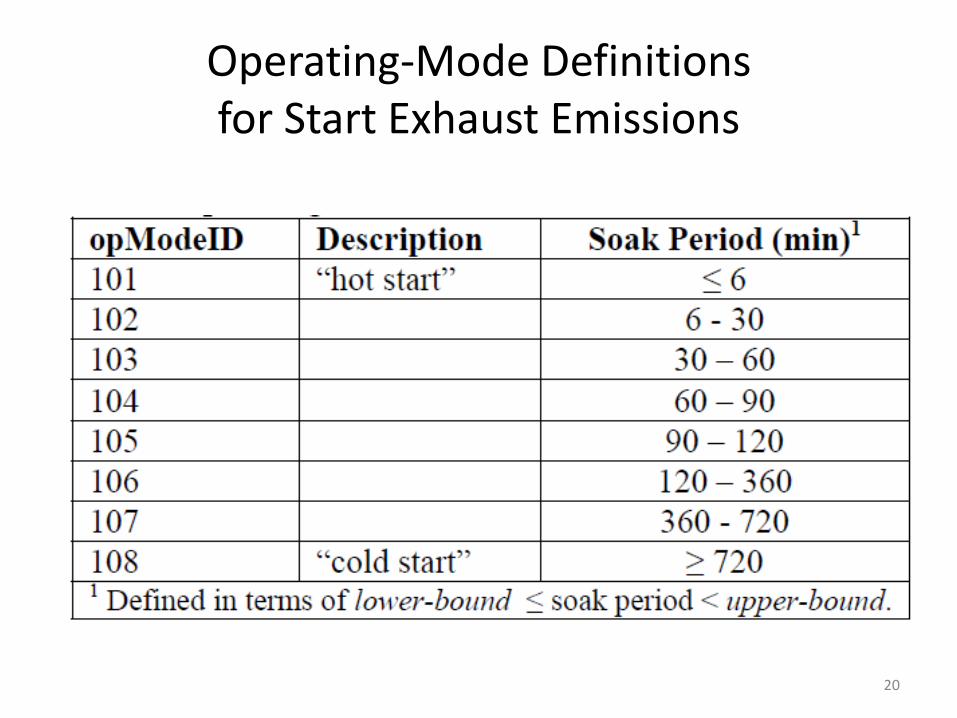
Operating-Mode Definitions for Start Exhaust Emissions
Number of Vehicle Starts
No seasonal variations Default number of starts per vehicle
– Check with local data – Alternative source of data
22
Number of Engine Starts per Day (Local Sources of Data)
TDF model O/D trip table – Provides approximate number of “engine starts”
• Seasonal variation • Reflective to: annual growth, transportation
projects/policies etc. • Number of auto trips per day < number of engine starts per
day – Provides good information where starts are located
O/D trip table approach may provide better local number of engine starts than the MOVES model defaults
Regionally non-significant projects can not be modeled through TDF model. Use project level analysis methodologies
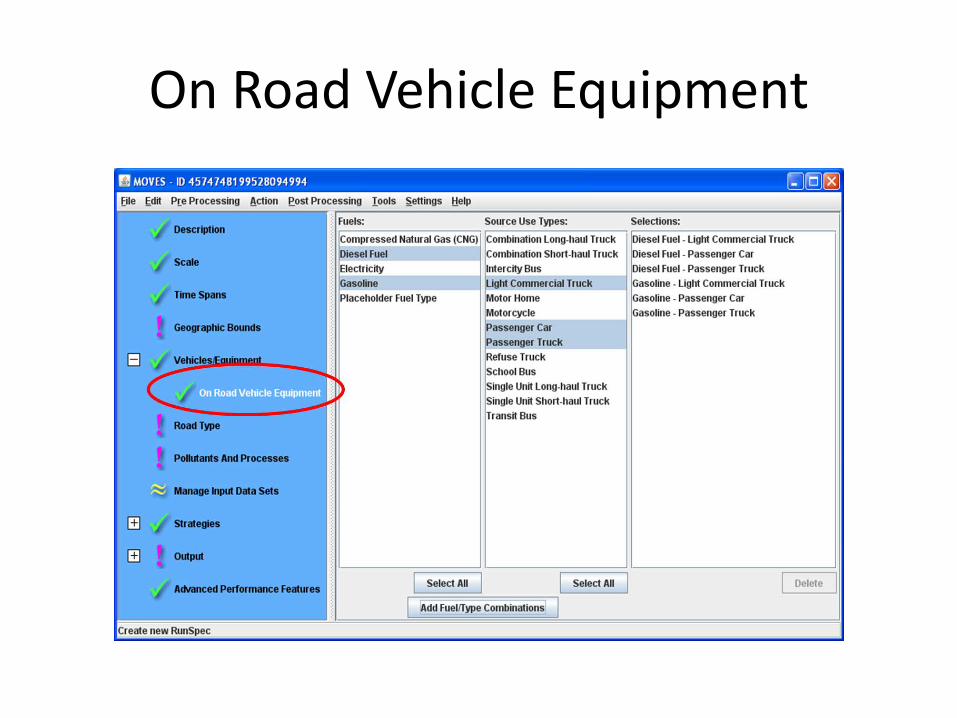
On Road Vehicle Equipment
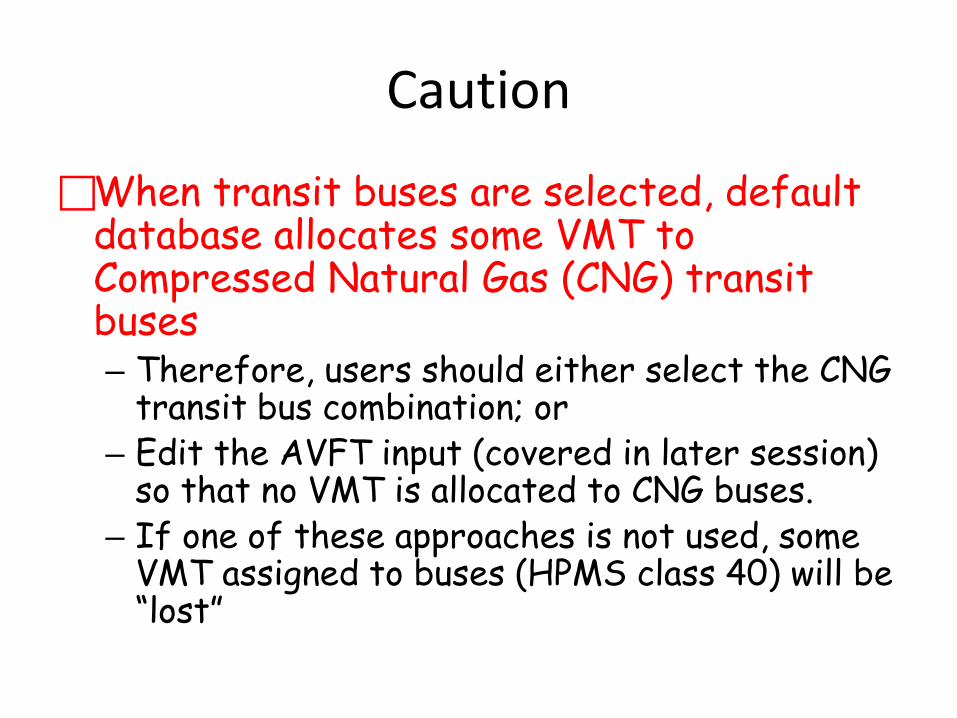
Caution
When transit buses are selected, default database allocates some VMT to Compressed Natural Gas (CNG) transit buses – Therefore, users should either select the CNG
transit bus combination; or – Edit the AVFT input (covered in later session)
so that no VMT is allocated to CNG buses. – If one of these approaches is not used, some
VMT assigned to buses (HPMS class 40) will be “lost”
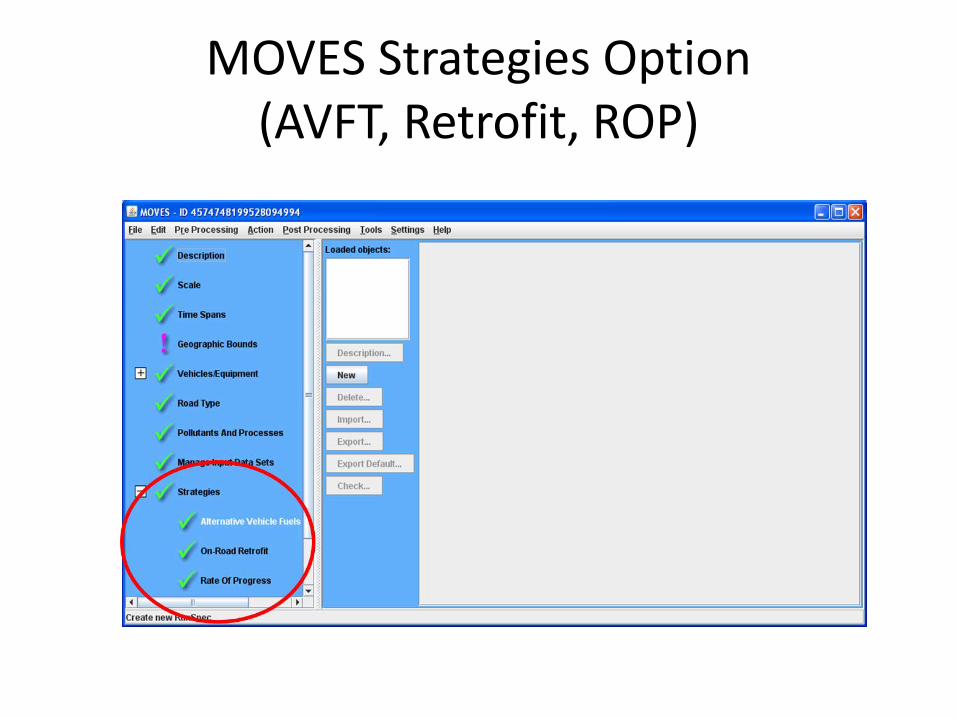
MOVES Strategies Option (AVFT, Retrofit, ROP)
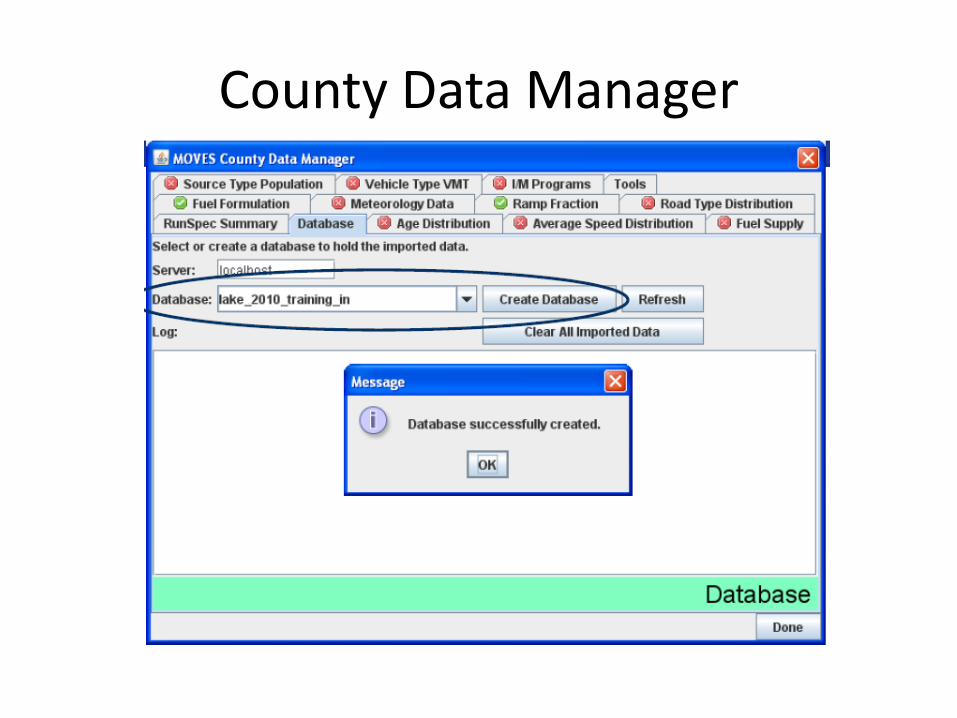
County Data Manager
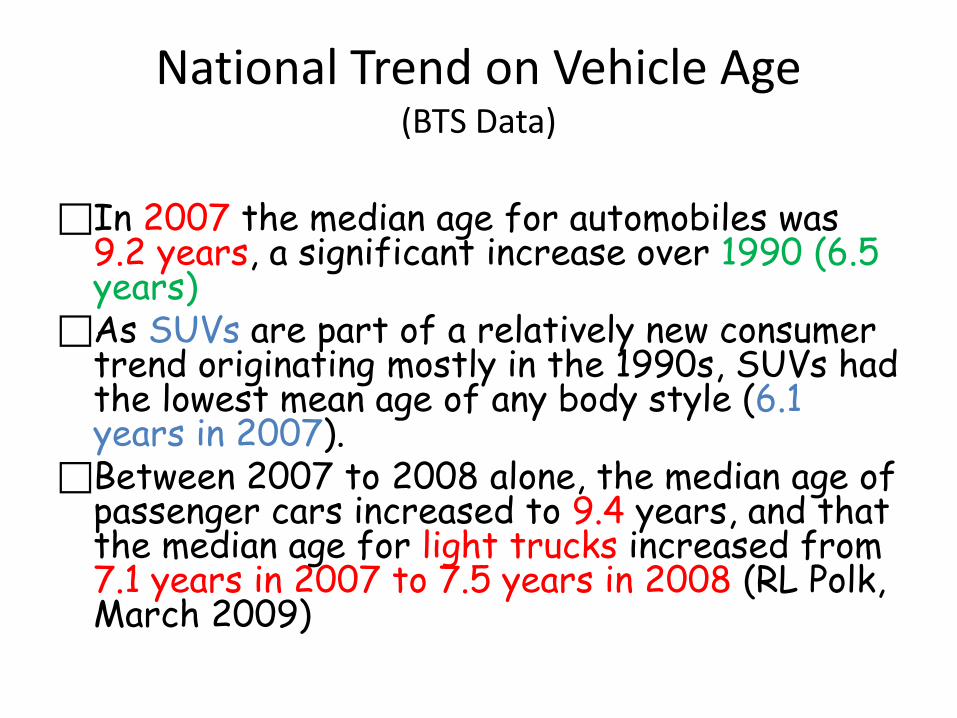
National Trend on Vehicle Age (BTS Data)
In 2007 the median age for automobiles was 9.2 years, a significant increase over 1990 (6.5 years)
As SUVs are part of a relatively new consumer trend originating mostly in the 1990s, SUVs had the lowest mean age of any body style (6.1 years in 2007).
Between 2007 to 2008 alone, the median age of passenger cars increased to 9.4 years, and that the median age for light trucks increased from 7.1 years in 2007 to 7.5 years in 2008 (RL Polk, March 2009)
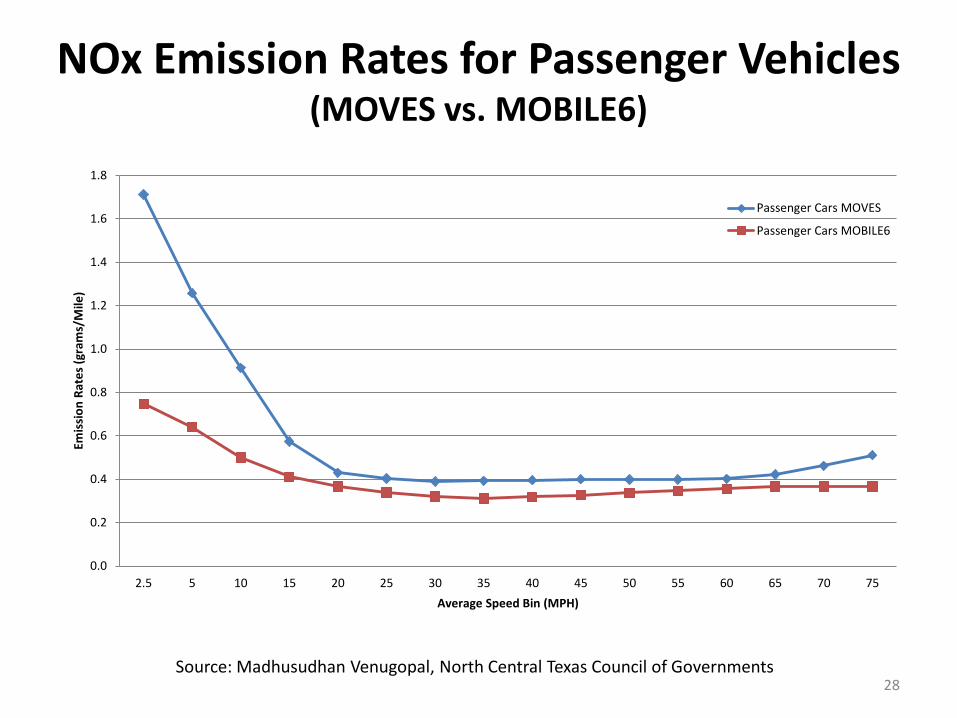
NOx Emission Rates for Passenger Vehicles (MOVES vs. MOBILE6)
0.0
0.2
0.4
0.6
0.8
1.0
1.2
1.4
1.6
1.8
2.5 5 10 15 20 25 30 35 40 45 50 55 60 65 70 75
Emis
sion
Rat
es (g
ram
s/M
ile)
Average Speed Bin (MPH)
Passenger Cars MOVES
Passenger Cars MOBILE6
28 Source: Madhusudhan Venugopal, North Central Texas Council of Governments
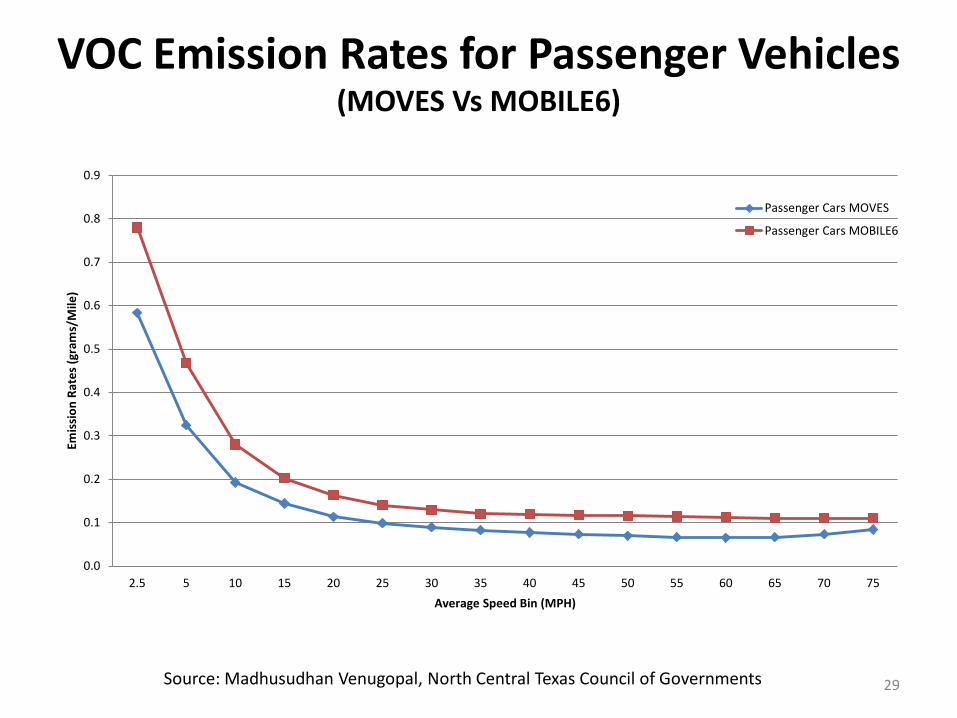
VOC Emission Rates for Passenger Vehicles (MOVES Vs MOBILE6)
0.0
0.1
0.2
0.3
0.4
0.5
0.6
0.7
0.8
0.9
2.5 5 10 15 20 25 30 35 40 45 50 55 60 65 70 75
Emis
sion
Rat
es (g
ram
s/M
ile)
Average Speed Bin (MPH)
Passenger Cars MOVES
Passenger Cars MOBILE6
29 Source: Madhusudhan Venugopal, North Central Texas Council of Governments
Evaporate Emissions Only for HC
Grams/Profile
Modeling Emissions CNG vs. Diesel Buses
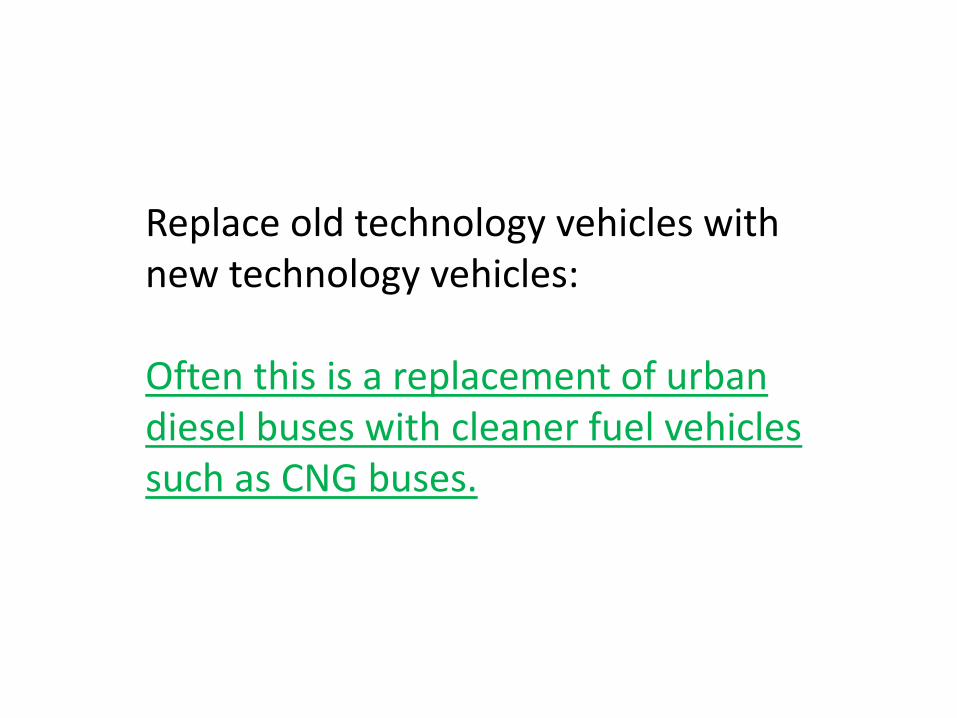
Replace old technology vehicles with new technology vehicles: Often this is a replacement of urban diesel buses with cleaner fuel vehicles such as CNG buses.
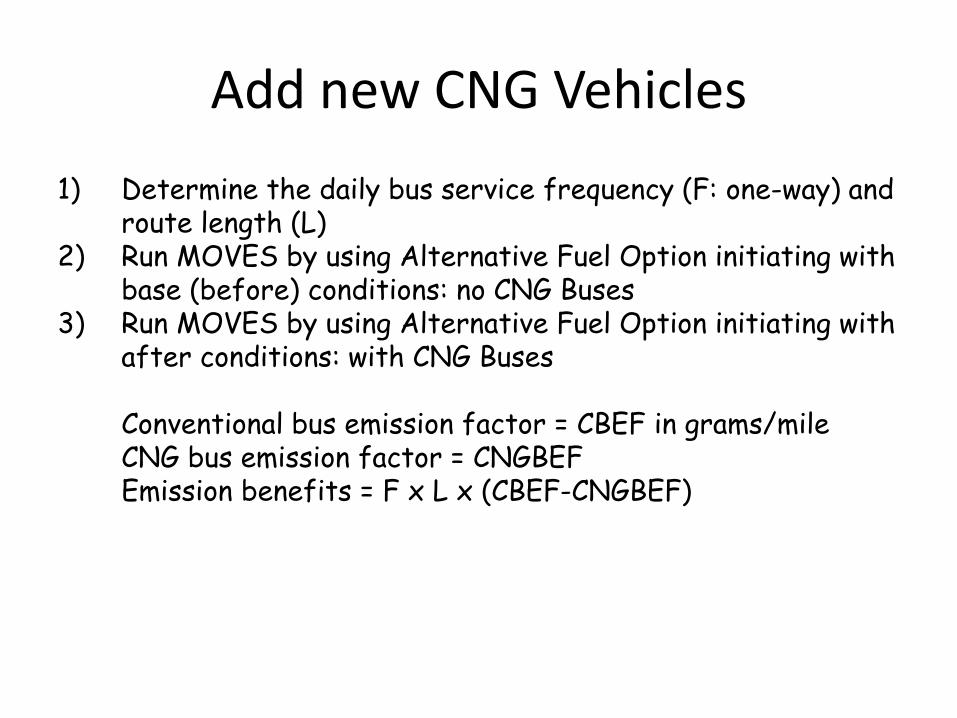
Add new CNG Vehicles 1) Determine the daily bus service frequency (F: one-way) and
route length (L) 2) Run MOVES by using Alternative Fuel Option initiating with
base (before) conditions: no CNG Buses 3) Run MOVES by using Alternative Fuel Option initiating with
after conditions: with CNG Buses Conventional bus emission factor = CBEF in grams/mile CNG bus emission factor = CNGBEF Emission benefits = F x L x (CBEF-CNGBEF)
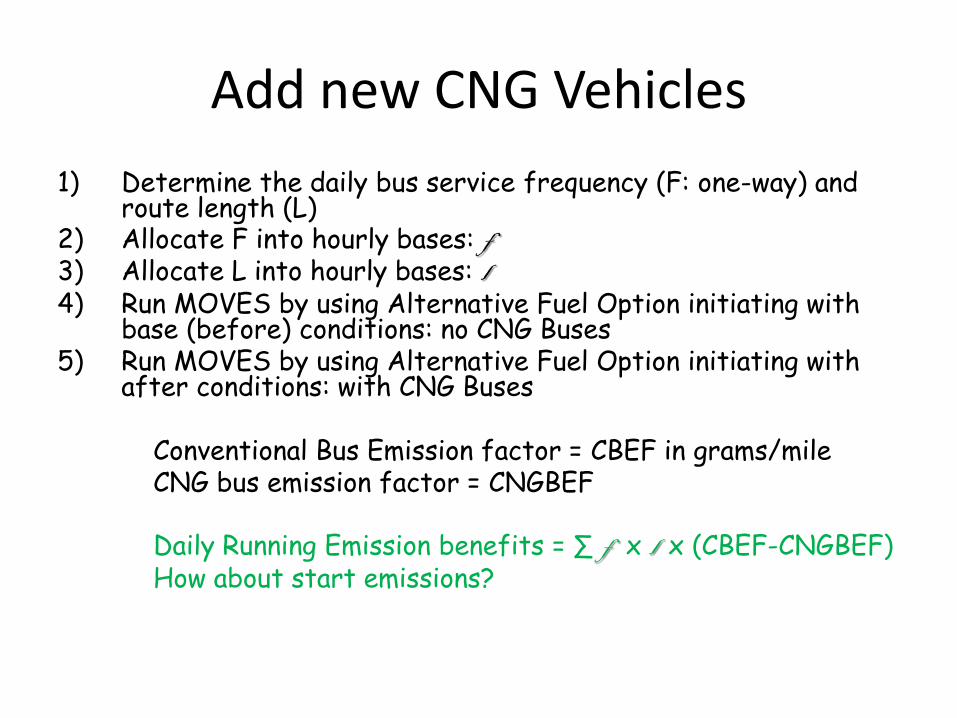
Add new CNG Vehicles 1) Determine the daily bus service frequency (F: one-way) and
route length (L) 2) Allocate F into hourly bases: f 3) Allocate L into hourly bases: l 4) Run MOVES by using Alternative Fuel Option initiating with
base (before) conditions: no CNG Buses 5) Run MOVES by using Alternative Fuel Option initiating with
after conditions: with CNG Buses Conventional Bus Emission factor = CBEF in grams/mile CNG bus emission factor = CNGBEF Daily Running Emission benefits = ∑ f x l x (CBEF-CNGBEF) How about start emissions?