EMISSION LEGISLATION TIMELINE - avl.com · PDF fileEMISSION LEGISLATION TIMELINE: ... 07 April...
37
Engeljehringer Kurt Daniel Baumann, IT AVL List GmbH Public EMISSION LEGISLATION TIMELINE: Overview about emission regulation with focus on RDE AVL-Italy RDE Roadshow, 18.7.2015
-
Upload
nguyendiep -
Category
Documents
-
view
214 -
download
1
Transcript of EMISSION LEGISLATION TIMELINE - avl.com · PDF fileEMISSION LEGISLATION TIMELINE: ... 07 April...

Engeljehringer Kurt
Daniel Baumann, IT
AVL List GmbH
Public
EMISSION LEGISLATION TIMELINE:
Overview about emission regulation with focus on RDE
AVL-Italy RDE Roadshow, 18.7.2015
Engeljehringer | Emission Test Systems | 06 März 2015 | 2Public
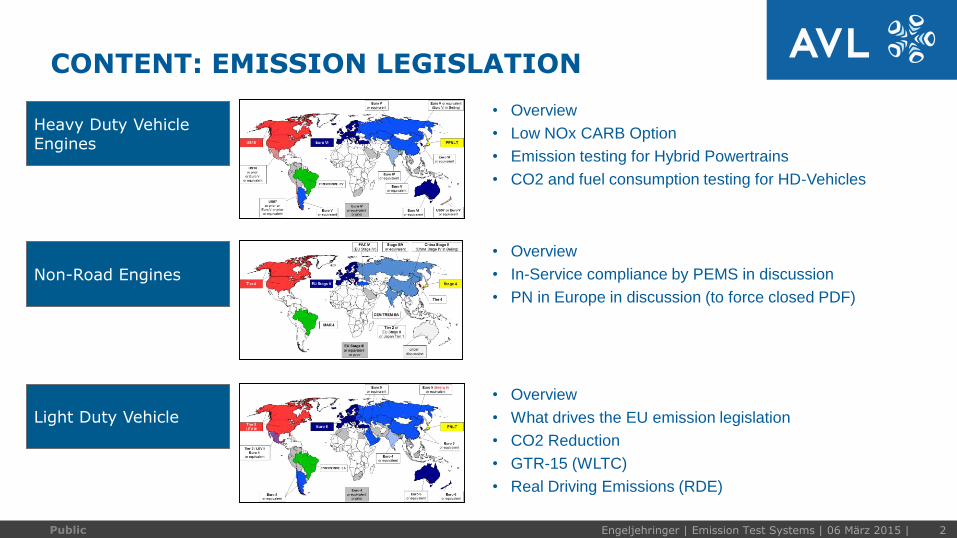
CONTENT: EMISSION LEGISLATION
Heavy Duty Vehicle Engines
Non-Road Engines
• Overview
• In-Service compliance by PEMS in discussion
• PN in Europe in discussion (to force closed PDF)
• Overview
• Low NOx CARB Option
• Emission testing for Hybrid Powertrains
• CO2 and fuel consumption testing for HD-Vehicles
Light Duty Vehicle
• Overview
• What drives the EU emission legislation
• CO2 Reduction
• GTR-15 (WLTC)
• Real Driving Emissions (RDE)

Engeljehringer Kurt | Emission Test Systems | 07 April 2015 | 3Public
EMISSION TIMELINE – HEAVY DUTY
Country 2012 2013 2014 2015 2016 2017 2018 2019 2020 2021 2022 2023 2024 2025Heavy Duty Vehicle
EnginesUS-EPA – US10
CARB optional low NOx
• CARB propose an “optional” lower NOx Limit for California. The 2010 NOx
emission standard 0.20 g/bhp-hr, should be reduced by a factor of 10.
• How to measure is part of a program at SWR “Evaluating Technologies and
Methods to Lower Nitrogen Oxide Emissions from Heavy-Duty Vehicles”.

Engeljehringer | Emission Test Systems | 06 März 2015 | 4Public
EMISSION TIMELINE – HEAVY DUTY
Country 2012 2013 2014 2015 2016 2017 2018 2019 2020 2021 2022 2023 2024 2025Heavy Duty Vehicle
Engines
Euro V Euro VI
GTR-4 (WHSC + WHTC)
Off-Cycle Emissions WNTE Random 15 mode test + In-Service compliance (PEMS)NOx Screening
Euro VII (Hybrid vehicles)?CO2 limits?
CFR-1065
CO2 monitoring & declaration ?
US-EPA – US10
US Phase IIGHG & Fuel Economy – US Phase I
PNLT Post-PNLTR
Euro VI ?
China IV China VIChina V ?
Bharat IV?Bharat III ? Bharat V?
Euro IV / V or prior? Euro VI?
Beijing On-Road NOx?
CARB optional low NOx
NTE
Euro VII?
Engeljehringer | Emission Test Systems | 06 März 2015 | 5Public
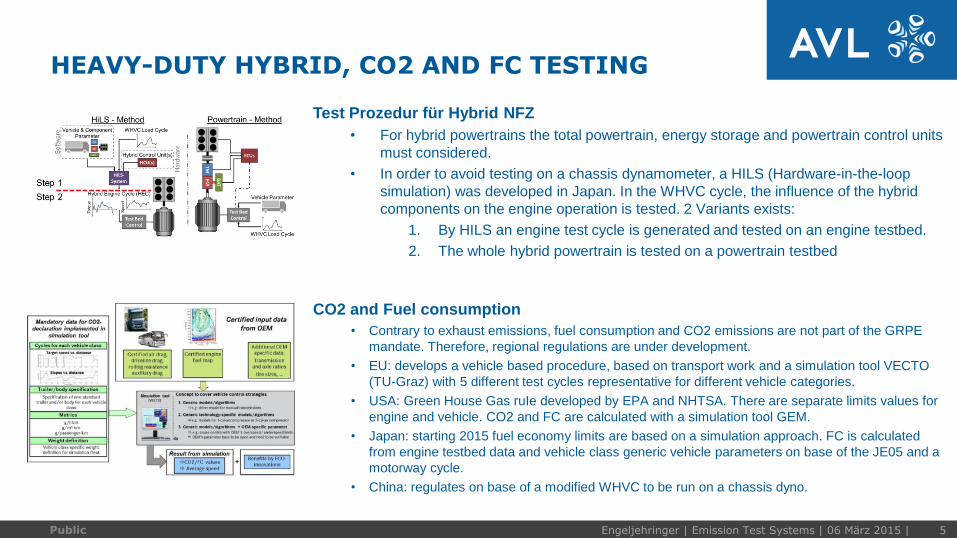
HEAVY-DUTY HYBRID, CO2 AND FC TESTING
Test Prozedur für Hybrid NFZ
• For hybrid powertrains the total powertrain, energy storage and powertrain control units
must considered.
• In order to avoid testing on a chassis dynamometer, a HILS (Hardware-in-the-loop
simulation) was developed in Japan. In the WHVC cycle, the influence of the hybrid
components on the engine operation is tested. 2 Variants exists:
1. By HILS an engine test cycle is generated and tested on an engine testbed.
2. The whole hybrid powertrain is tested on a powertrain testbed
CO2 and Fuel consumption
• Contrary to exhaust emissions, fuel consumption and CO2 emissions are not part of the GRPE
mandate. Therefore, regional regulations are under development.
• EU: develops a vehicle based procedure, based on transport work and a simulation tool VECTO
(TU-Graz) with 5 different test cycles representative for different vehicle categories.
• USA: Green House Gas ruIe developed by EPA and NHTSA. There are separate limits values for
engine and vehicle. CO2 and FC are calculated with a simulation tool GEM.
• Japan: starting 2015 fuel economy limits are based on a simulation approach. FC is calculated
from engine testbed data and vehicle class generic vehicle parameters on base of the JE05 and a
motorway cycle.
• China: regulates on base of a modified WHVC to be run on a chassis dyno.

Engeljehringer | Emission Test Systems | 06 März 2015 | 6Public
EMISSION TIMELINE – NON-ROAD 130-560KW
Country 2012 2013 2014 2015 2016 2017 2018 2019 2020 2021 2022 2023 2024 2025Non-Road Engines
GTR-11 (NRSC + NRTC)
CFR-1065
In-Service Emissions in discussion?
Off-Cycle + PEMS in discussion
Tier 4
CO2 monitoring (later maybe also limits)
Stage IV Stage V
CO2 monitoring & declaration
Stage 3 Stage 4
Tier 4
China II China IV?China III ?
CEV/TREM IV?CEV/TREM III ?
Stage IIIA / Tier-3 or prior? Stage IV / Tier-4?
Tier 3
?
NTE ?
III-B
Engeljehringer | Emission Test Systems | 06 März 2015 | 7Public
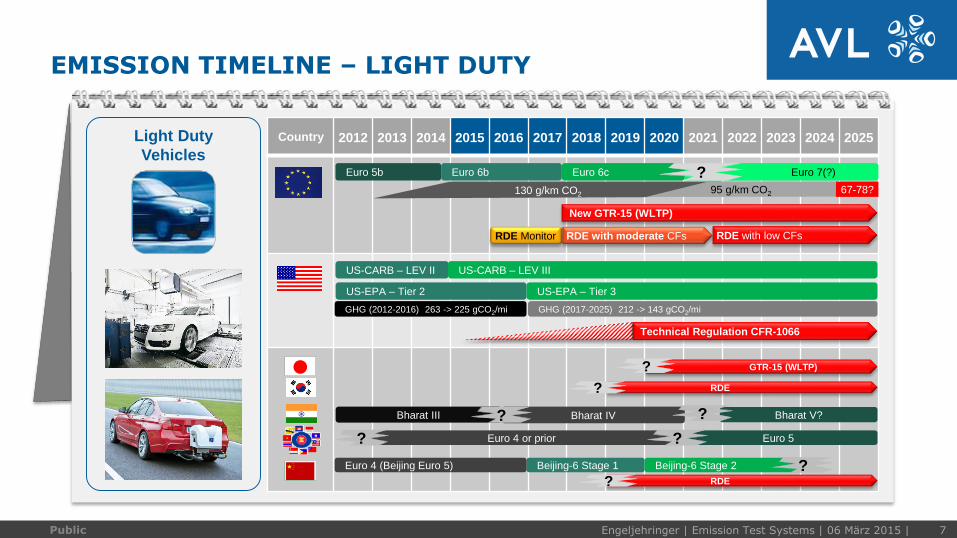
EMISSION TIMELINE – LIGHT DUTY
Country 2012 2013 2014 2015 2016 2017 2018 2019 2020 2021 2022 2023 2024 2025Light Duty
Vehicles
Technical Regulation CFR-1066
GHG (2012-2016) 263 -> 225 gCO2/mi
GTR-15 (WLTP)?
RDE?
Bharat IV
Euro 4 or prior? Euro 5?
US-EPA – Tier 2 US-EPA – Tier 3
US-CARB – LEV II US-CARB – LEV III
Bharat III ? Bharat V??
GHG (2017-2025) 212 -> 143 gCO2/mi
Euro 5b Euro 6b Euro 6c
New GTR-15 (WLTP)
RDE with low CFsRDE Monitor
Euro 7(?)?130 g/km CO2
95 g/km CO2 67-78?
Beijing-6 Stage 1 Beijing-6 Stage 2Euro 4 (Beijing Euro 5) ?
RDE with moderate CFs
RDE?

Engeljehringer | Emission Test Systems | 06 März 2015 | 9Public
WHAT DRIVES EU EMISSION LEGISLATION?
Source: ICCT International Council on Clean Transportation 2014
Real-world exhaust emissions (PEMS) from modern diesel cars:
15 vehicles, 6 manufacturers with different NOx control technologies
All calibrated for EU (Euro 6a) or US (Tier 2 Bin 5/ULEV II)
NO
x a
bo
ve
EU
-6 L
imit
CO2 above decleared “Norm” value.
Euro-5 Limit
Euro-6 Limit
The ideale
EU-6 car
Source: ICCT International Council on Clean Transportation 2014

Engeljehringer | Emission Test Systems | 06 März 2015 | 10Public
WHAT DRIVES EU EMISSION LEGISLATION?
CO2 targets
GTR-15
Po
llutio
ns
RD
E
Technical Issue:
In the technical realization in a vehicle
RDE and CO2 are very much linked
together. Often what is a positive effect on
CO2 is a negative effect on RDE (like
engine downsizing). Therefore a trade off
between RDE and CO2 is a technical
challenge.
Political Target:
While technical wise RDE and CO2 are
very much linked together. As a political
target they are independent targets.

Engeljehringer Kurt | Emission Test Systems | 07 April 2015 | 11Public
GREEN HOUSE GAS EMISSIONS
Source: An analysis of carmaker progress towards EU CO2 targets in 2014, T&E –
European Federation for Transport and Environment AiSBL

Engeljehringer Kurt | Emission Test Systems | 07 April 2015 | 12Public
EU: CO2 EMISSIONS
CO2 - 2025
under
discussion
Phase in:% of fleet
65% of fleet in ‘12
75% of fleet in ‘13
80% of fleet in ‘14
100% of fleet in ‘15
CO2 Fines 2013
per g above limit
4th + all next 95 €
3rd g 25 €
2nd g 15 €
1st g 5 €
CO2 Fines 2020/21
for each g above limit
95 €CO2
g/km
2010 ‘11 ‘12 ‘13 ‘14 ‘15 ‘16 ‘17 ‘18 ‘19 ‘20 ‘21 ‘22 ‘23 ‘24 ‘25
0
110
150
Phase in:% of fleet
95% in ‘20
100% in ‘21
140
130
120
100
40
90
80
70
60
50
30
20
10
130 g/km
95 g/km
67-78 g/km
Excess emission premiums (CO2 fines)
Specific emissions target per manufacturerEach manufacturer has its individual annual CO2 target.
That is calculated on the basis of the average vehicle mass of the
manufacturer's fleet and a reference mass, which is defined on
base of the average vehicle mass of the whole EU fleet.
CO2 TargetsIf a manufacturer’s fleet average is above the CO2 target, he still is allowed to sell the vehicles. But he must pay the Excess Emission Premium
(CO2 fines). Depending on how much he exceeds the target it converted to € and multiplied by the number of registered cars per year.
Credits• Incentives for vehicles with less than 50g/km, by counting it
such a car as 3,5 cars in 2013 and 1,5 in 2015
• E85 credits (5% less CO2), for such cars in countries where at
least 30% of the fuel stations offer E85 (only Sweden)
Eco-innovationsInnovative technologies, which can not show the CO2 reduction in
the type-approval test procedure, like LED lights, can reduce up to
7gCO2/km if agreed by the authorities.
Derogations• Niche-Derogations for OEM’s selling 10.000 to 300.000 cars
• OEM’s selling less than 10.000 cars per year
Engeljehringer Kurt | Emission Test Systems | 07 April 2015 | 13Public
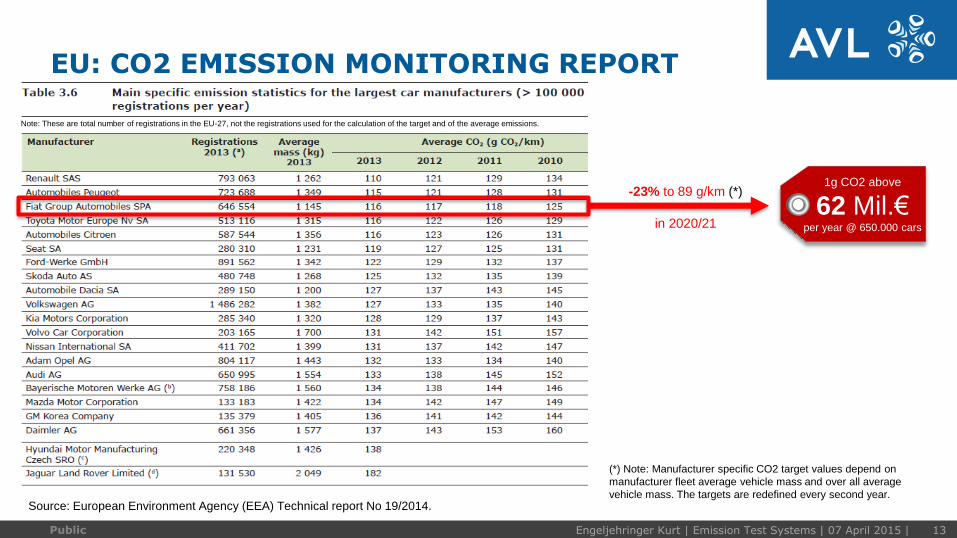
EU: CO2 EMISSION MONITORING REPORT
Source: European Environment Agency (EEA) Technical report No 19/2014.
-23% to 89 g/km (*)
in 2020/21
1g CO2 above
62 Mil.€per year @ 650.000 cars
Note: These are total number of registrations in the EU-27, not the registrations used for the calculation of the target and of the average emissions.
(*) Note: Manufacturer specific CO2 target values depend on
manufacturer fleet average vehicle mass and over all average
vehicle mass. The targets are redefined every second year.

Engeljehringer Kurt | Emission Test Systems | 07 April 2015 | 14Public
USA: GREEN HOUSE GAS (GHG) EMISSIONS
USA implemented a GHG Emission legislation including CO2, CH4 and N2O
Information
about vehicles to the final
customer about smoke
(pollutant emissions) and fuel
efficiency and GHG emission
rating.
Penalty:
In case of violating GHG regulations.
Example: Hyundai and Kia Clean Air Act
Settlement from November 3, 2014.
Hyundai and Kia will pay a $100 million civil penalty
for selling 1.2 million vehicles, that will emit appr.
4.75 million tons of greenhouse gases (GHG) in
excess of what the automakers certified.
Plus forfeit GHG emission credits of $200 million
collected by these violations.
Plus implement measures ($50 million) to prevent
future violations.
It is unlikely that EU also would include
CH4 and N2O, since the EU emission
inventories show only 0,9% from N2O and
0,1% from CH4 already calculated as
CO2 äquivalent.

Engeljehringer | Emission Test Systems | 06 März 2015 | 15Internal
GTR 15: GLOBAL TECHNICAL REGULATIONWhat: It is a worldwide harmonized technical regulation how to test emissions (criteria and CO2) and
fuel and energy consumption of light duty vehicles. It is published by the UN-ECE and
therefore agreed by all members of the United Nations. Earlier it was better known under the
project name “WLTP”.
Why: Up-date and improvements of the current regulation (UN-ECE-83) for a
• better representativeness of test bed results of real world driving
• better reproducibility of the results
How:
• New Drive Cycle – WLTC (Worldwide harmonized Light duty Test Cycle).
• New Test Procedures - Road load determination, equipment, specifications, fuels, …)
• However “Harmonization” (global) and “Representativeness” (local) is always a trade-off.
• GTR-15 doesn’t define the emission limits and which components have to be measured.
When and Where:
• Sept. 2017 it will start in Europe with Euro-6c.
• Over time it will be implemented in most of local light duty emission legislations.
• Japan will implement it mid term, too. (GTR-4 for Heavy Duty is already implemented)
• USA will not implement it, and will use the technical regulation CFR-1066.

Engeljehringer | Emission Test Systems | 06 März 2015 | 16Public
Emission Type Approval Test Types
Type-I Average emission after a cold start
Type-IA Real Driving Emission (RDE)
Type-II CO Idle test
Type-III Crankcase emission
Type-IV Evaporative Emission
Type-V Durability test
Type-VI -7°C low temperature emission test (like Type-I testing but at -7°C)
OBD On Board Diagnostic
CO2 + FC
EC + E-RangeCO2 + Fuel Consumption, Energy consumption and electric range for E-Vehicles
Reg-24 Smoke Opacity for compression ignition engines
GTR 15 / WLTP: PROJECT
GTR-15
What is new:
With Phase-1 not everything in the European light vehicle emission type approval will be changed.
GTR-15 will replace the Type-I test of UN-ECE R-83 and UN-ECE R101.
The definition of the other test types will still be following UN-ECE R-83 specifications, but most likely
replacing in this types the NEDC cycle with the WLTC cycle.
GTR-15
UN-ECE R-83
(NEDC->WLTC)
UN-ECE R-24
GTR-15
(2015-2018)
Low temperature
High altitude test
Durability
In-service conformity
On-board diagnostics
Air conditioning
Energy efficiency
OCE and RDE
Phase 1 Phase 2
RDE

Engeljehringer | Emission Test Systems | 06 März 2015 | 17Public
GTR 15: GLOBAL TECHNICAL REGULATION
Main changes for emission testing:
• A new drive cycle with 4 Phases and 30 minutes long.
• Drive cycle is different for different vehicle classes C1, C2, C3a and C3b, which
depends on the Power/Weight ratio of the vehicle and the max. velocity.
• Manual gear shifting point are calculated individually for each vehicle.
• More detailed definition of the road load measurement, road load simulation on the
chassis dynamometer and vehicle weight and options.
• Definition of vehicle preparation, conditioning before and during the test (temperature,
battery charging, ...)
• More accurate definition of the temperature 23°C +/-5°C, during soak , engine start (+/-
3°C) and test execution (+/-5°C).
• Changes in test and measurement sequences
• Electric energy flow evaluated for the 12V vehicle battery and batteries must not be
loaded during soak time
• …

Engeljehringer | Emission Test Systems | 06 März 2015 | 18Internal
WLTC: WORLDWIDE LIGHT-DUTY TEST CYCLES
Class 1
≤ 22 W/kgLow 1 Medium 1 Low 1
Low 2 Medium 2 High 2
Extra High 2
Class 2
> 22 ≤ 34 W/kg
Low 3 Medium 3-1 High 3-1
Extra High 3
Class 3a
> 34 W/kg
v_max < 120 km/h
Low 3 Medium 3-2 High 3-2
Extra High 3
Class 3b
> 34 W/kg
v max ≥ 120 km/h
5 min
30 min
589 sec 433 sec 455 sec 323sec
Contracting
parties (i.e.
Countries)
may exclude
the Extra-High
phase,
when not
adequate for
the local
driving
behavior. (like
India)
Manual gear shifting is
set individually for each
vehicle, based on cycle
power requirements
versus vehicle mass
and power

Engeljehringer Kurt | Emission Test Systems | 07 April 2015 | 19Public
RDE SHOULD BE KNOWN SINCE 2007 (EU-5)
Regulation (EC) 715/2007 Chapter II, Article 4:
• Tailpipe Emissions and Evap-Emissions
• No reference to a known driving cycle anymore
• But emission requirements for “normal conditions of use”

Engeljehringer Kurt | Emission Test Systems | 07 April 2015 | 20Public
VEHICLE EMISSION TESTING REQUIREMENTS
Emission Test TypesSI – Vehicle
inclusive Hybrids
CI-Vehicleinclusive Hybrids
Pure
Electric
H2
Fuel cell
Fuel System = Mono-Fuel Bi-Fuel Flex-FuelMono
Fuel
Flex
Fuel
Fuel Type = Gasoline LPG NG HydrogenGasoline Gasoline Gasoline Gasoline NG
DieselDiesel
LPG NG Hydrogen Ethanol H2NG Bio-Diesel
Type-I Average Emission both fuels
both fuels
both fuels
both fuels
both fuels
both fuels
Type-IAReal Driving
Emission
both fuels
both fuels
both fuels
both fuels
both fuels
both fuels
Type-II CO Idle test both fuels
both fuels
Gasoline
both fuels
NG
Type-III Crankcase emission Gasoline
Gasoline
Gasoline
Gasoline
NG
Type-IVEvaporative
Emission
Gasoline
Gasoline
Gasoline
Gasoline
Type-V Durability test Gasoline
Gasoline
Gasoline
Gasoline
NG
both fuels
Type-VI-7°C low
temperature
Gasoline
Gasoline
Gasoline
both fuels
OBDOn Board
Diagnostic
CO2 + FC
Energy +
Range
CO2 and FC
E-energy cons. and
electric range
both fuels
both fuels
both fuels
both fuels
both fuels
both fuels
Reg-24 Smoke Opacity
Note: Gasoline includes E5/E10 and Diesel includes B5/B7 and NG includes Bio-methane
Engeljehringer Kurt | Emission Test Systems | 07 April 2015 | 21Public
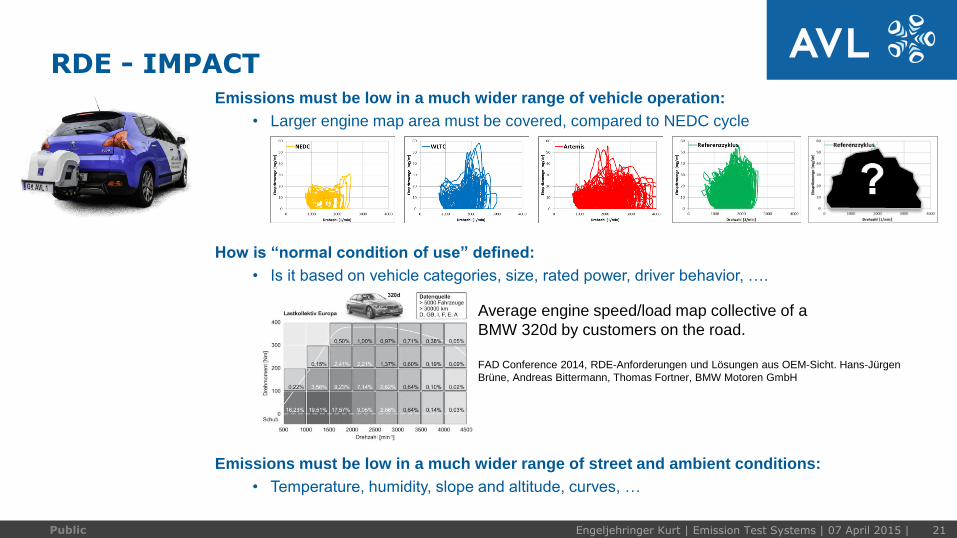
RDE - IMPACTEmissions must be low in a much wider range of vehicle operation:
• Larger engine map area must be covered, compared to NEDC cycle
Emissions must be low in a much wider range of street and ambient conditions:
• Temperature, humidity, slope and altitude, curves, …
How is “normal condition of use” defined:
• Is it based on vehicle categories, size, rated power, driver behavior, ….
Average engine speed/load map collective of a
BMW 320d by customers on the road.
FAD Conference 2014, RDE-Anforderungen und Lösungen aus OEM-Sicht. Hans-Jürgen
Brüne, Andreas Bittermann, Thomas Fortner, BMW Motoren GmbH

Engeljehringer Kurt | Emission Test Systems | 07 April 2015 | 22Public
RDE - IMPACT
Engeljehringer Kurt | Emission Test Systems | 07 April 2015 | 23Public
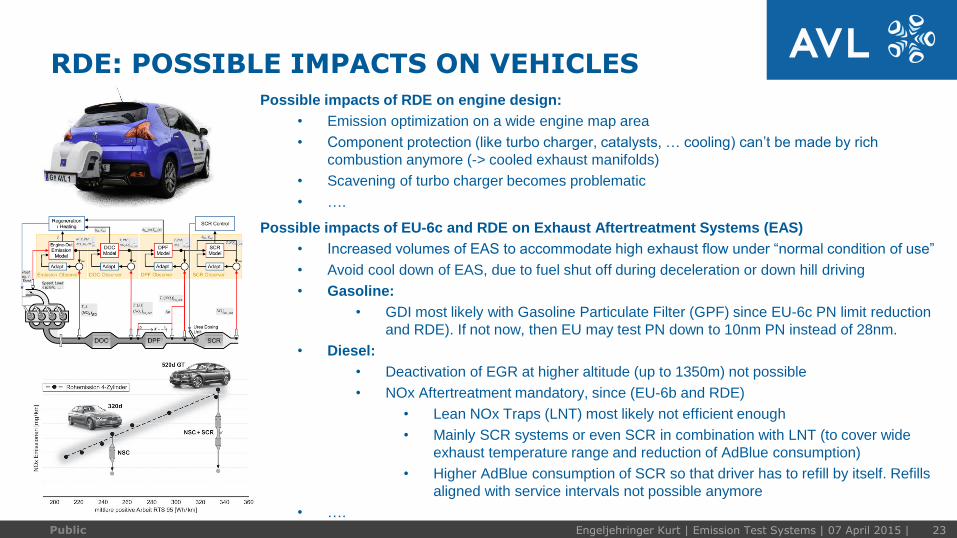
RDE: POSSIBLE IMPACTS ON VEHICLESPossible impacts of RDE on engine design:
• Emission optimization on a wide engine map area
• Component protection (like turbo charger, catalysts, … cooling) can’t be made by rich
combustion anymore (-> cooled exhaust manifolds)
• Scavening of turbo charger becomes problematic
• ….
Possible impacts of EU-6c and RDE on Exhaust Aftertreatment Systems (EAS)
• Increased volumes of EAS to accommodate high exhaust flow under “normal condition of use”
• Avoid cool down of EAS, due to fuel shut off during deceleration or down hill driving
• Gasoline:
• GDI most likely with Gasoline Particulate Filter (GPF) since EU-6c PN limit reduction
and RDE). If not now, then EU may test PN down to 10nm PN instead of 28nm.
• Diesel:
• Deactivation of EGR at higher altitude (up to 1350m) not possible
• NOx Aftertreatment mandatory, since (EU-6b and RDE)
• Lean NOx Traps (LNT) most likely not efficient enough
• Mainly SCR systems or even SCR in combination with LNT (to cover wide
exhaust temperature range and reduction of AdBlue consumption)
• Higher AdBlue consumption of SCR so that driver has to refill by itself. Refills
aligned with service intervals not possible anymore
• ….

Engeljehringer Kurt | Emission Test Systems | 07 April 2015 | 24Public |Emission Applications
VW will have in 2017 50 models with SCR
for EU-6c & RDE
Source: VW Presentation, Dr. Dorenkam
FAD conference, Dresden 2014
Engeljehringer Kurt | Emission Test Systems | 07 April 2015 | 25Public |Emission Applications
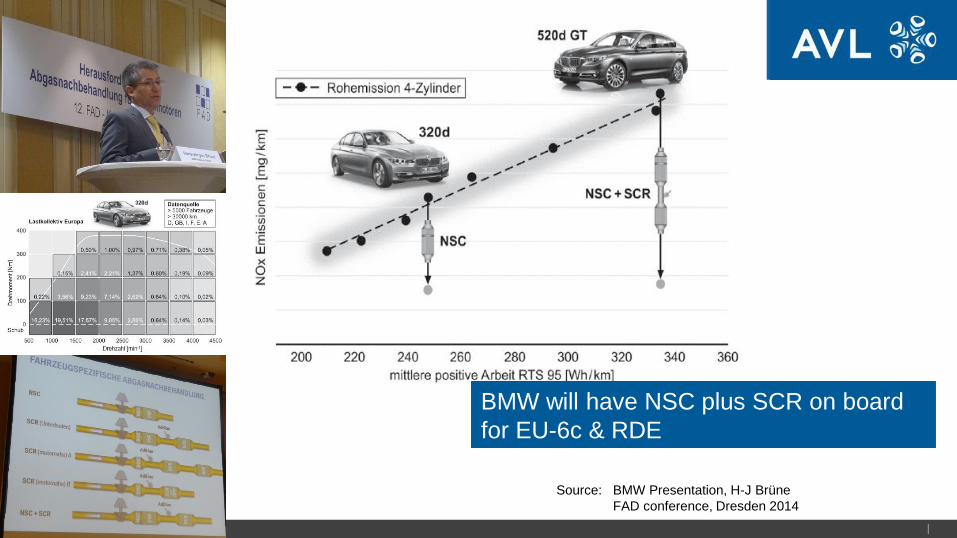
BMW will have NSC plus SCR on board
for EU-6c & RDE
Source: BMW Presentation, H-J Brüne
FAD conference, Dresden 2014

Engeljehringer Kurt | Emission Test Systems | 07 April 2015 | 26Public
RDE – ON THE ROAD
On-Road PEMS versus chassis dyno emission laboratory results validation:
• In general for data plausibility and quality reasons
• If ECU data are used as exhaust flow rate, which is possible for R&D and In-Service
conformity testing (not allowed for type approval testing)
1. Correlation of emission concentrations, only.:
• A first test comparing only the concentrations between a PEMS and an emission laboratory
emission analyzer bench, shows the correlation of the analytical systems, excluding exhaust
flow rate determination, time alignment and modal mass calculations.
2. Correlation of total mass emission:
• Only a full correlation between PEMS and an emission laboratory emission mass results will
prove the correctness of PEMS measurements. Permissible tolerance for ISC are:
• THC +/- 10 mg/km or 10% of lab. result, whichever is larger
• CO +/- 150 mg/km or 30% of lab. result, whichever is larger
• NOx +/- 15 mg/km or 20% of lab. result, whichever is larger
• CO2 +/- 5 mg/km or 8% of lab. result, whichever is larger

Engeljehringer Kurt | Emission Test Systems | 07 April 2015 | 27Public
RDE – ON THE ROADResult of CLEAR (from TU-Graz) :
• The Real-world driving shows the effect of the
CLEAR tool. The read bar shows the
measured NOx emission mass and the blue
bars show the result after applying the
CLEAR tool.
• On Route 2 a high downscaling effect of high
emission of a high dynamic drive is
significant.
Source: Prof. Hausberger, TU-Graz @ Research Networking Day 2015, Graz
Result of CLEAR (from TU-Graz) :
• The increase of the test bed type approval
emission results from the NEDC drive cycle to
the WLTC drive cycle and procedures.
• That hot start emissions are significantly
higher than cold start emissions. That is the
opposite to the real physical behavior of an
engine and exhaust aftertreatment systems.
But the result of an emission optimization for
the official type approval test specifications.
Engeljehringer Kurt | Emission Test Systems | 07 April 2015 | 28Public
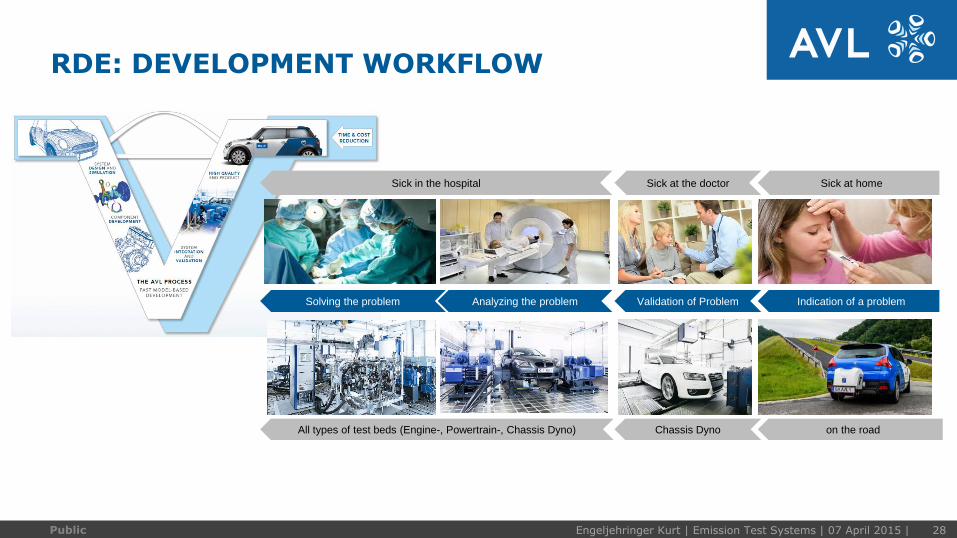
RDE: DEVELOPMENT WORKFLOW
Indication of a problem
Sick at home
on the road
Solving the problem Analyzing the problem
Sick in the hospital
All types of test beds (Engine-, Powertrain-, Chassis Dyno)
Sick at the doctor
Validation of Problem
Chassis Dyno

Engeljehringer Kurt | Emission Test Systems | 07 April 2015 | 29Public
RDE: DEVELOPMENT WORKFLOW
Simulation
Testing EnvironmentDevelopment process

Engeljehringer Kurt | Emission Test Systems | 07 April 2015 | 30Public |AVL Emission Testing Systems | 30
TEST CELL – RDE READY CONFIGURATIONS
Emissions
Traffic StreetDriverRoadMOVE
Sys-Control
MOVE
PEMS
MOVE
Concerto
Chassis
Dyno
Engine-
or PT-
Testbed
RDE
UC-1ISAC Emcon PO iGEM-E
iGEM
Concerto
+ MOVE
Concerto
RDE
UC-2ISAC Emcon PO iGEM-E
iGEM
Concerto
+ MOVE
Concerto
RDE
UC-3InMotion Emcon PO iGEM-E
iGEM
Concerto
+ MOVE
Concerto
Testing Type
Drive
Cycle
AMA-Raw
SPC,APC,Flow
AMA-Raw
SPC,APC,Flow
AMA-Raw
SPC,APC,Flow
Vehicle
RDE
UC-1
Dyno
Control1
RDE
ControlerPOV iGEM-V
iGEM
Concerto
+ MOVE
Concerto
CVS,AMA,PTS
APCVehicle
RDE
UC-2Driver
Dyno
Control2
Drivers
AidPOV iGEM-V
iGEM
Concerto
+ MOVE
Concerto
Drive
Cycle
CVS,AMA,PTS
APCVehicle
RDE
UC-3InMotion
Dyno
Control3 POV iGEM-V
iGEM
Concerto
+ MOVE
ConcertoDriver
CVS,AMA,PTS
APCVehicle
ISAC
ISAC
InMotion
Vehicle
UUT
Engine
Engine
Engine
EngineTrans-
mission
Drive-
Line
Temp.
Humidity
Altitude
Ambient
Test execution,
device control,
data recording
Test-Execut.
Measurement
Other configs
may apply
Emission
Data handling, results,
evaluation, reporting,
data for reproduction
Post Processing
Dyno
Dyno
Dyno
Dyno
Dyno
DynoIn-
Motion
Driving speed (speed/time
speed/distance), road,
driver behavior, ….
Traffic, Driver, Road, … Load
Driving resistances and load
and its test simulation

Engeljehringer Kurt | Emission Test Systems | 07 April 2015 | 31Public |
HOW TO DEVELOP FOR RDE?
Reproduction and Analysis
of Test Data
Frontloading - Virtual
Development
Emission Development and
Calibration,
Verification of Quality Targets
Type
ApprovalIn Service Compliance(Verification, Benchmark)

Engeljehringer Kurt | Emission Test Systems | 07 April 2015 | 32Public
RDE – REPRODUCTION AND ANALYSIS
Reproduction Results of AVL RDE reproduction development work:
• Euro-5 Diesel passenger car with DOC, SCR and DPF.
• These data were measured during preliminary tests of a
new test methodology under develop. It can not be expected
that the here shown good correlation can always be
achieved.
NOx mass
Road 0,633 g/km
Lab. 0,692 g/km
Deviation +9,3 %
CO2 mass
Road 178,1 g/km
Lab. 177,9 g/km
Deviation -0,1 %
CO2 mass [g/s]
NOx mass [g/s]
Engeljehringer Kurt | Emission Test Systems | 07 April 2015 | 33Public
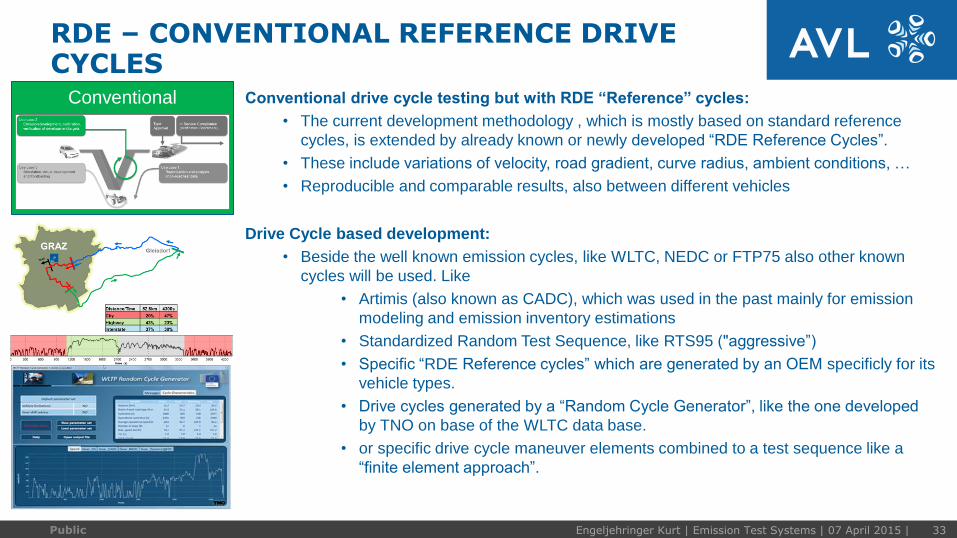
RDE – CONVENTIONAL REFERENCE DRIVE CYCLES
Conventional Conventional drive cycle testing but with RDE “Reference” cycles:
• The current development methodology , which is mostly based on standard reference
cycles, is extended by already known or newly developed “RDE Reference Cycles”.
• These include variations of velocity, road gradient, curve radius, ambient conditions, …
• Reproducible and comparable results, also between different vehicles
Drive Cycle based development:
• Beside the well known emission cycles, like WLTC, NEDC or FTP75 also other known
cycles will be used. Like
• Artimis (also known as CADC), which was used in the past mainly for emission
modeling and emission inventory estimations
• Standardized Random Test Sequence, like RTS95 ("aggressive”)
• Specific “RDE Reference cycles” which are generated by an OEM specificly for its
vehicle types.
• Drive cycles generated by a “Random Cycle Generator”, like the one developed
by TNO on base of the WLTC data base.
• or specific drive cycle maneuver elements combined to a test sequence like a
“finite element approach”.

Engeljehringer Kurt | Emission Test Systems | 07 April 2015 | 34Public
REAL DRIVING EMISSION
Simulation
Virtual Integration and Front-Loading Calibration:
• Virtual simulation of random driving maneuvers with full variability of ambient conditions,
driver types, vehicle variants, connected powertrain, …
• from pure simulation, Hardware in the Loop (HIL) to conventional test beds
• Evaluation of powertrain and vehicle concepts, definition of solutions and engineering
targets, calibration in non standard ambient conditions
Implementation:
• Based on InMotion
• Engine- or Powertrain test beds
• 4x4 Chassis dyno test beds with individual wheel dynos.
• up to GPS Emulation on chassis dyno testbed for car to infrastructure integration
Innovation Adoption:
• Simulation approach, especially for “classic” emission development and testing groups,
require still a high willingness and ramp up time to adopted to such innovations.
Simulation technologies to:
• address the “infinite variables involved in real world driving”
• master todays “large number of vehicle models and variants”.

|AVL Emission Test Systems | Engeljehringer | 2014 35
RDE CHALLENGES ESTIMATIONS – TEST CAPACITY
Emission Applications
• Number of development chassis dyno testbeds = 10 Chassis dynos
• 5 days/week, 50% in 1 and 50% in 2 shift operation, 7 tests/shift, 49 weeks/year = 2.600 Tests per year per CD testbed
• Total test capacity = 26.000 Tests per year
Effects on test bed capacity caused by:
• Reduction of number of tests by longer test time (NEDC 20min -> WLTC 30min) = 3.700 Tests per year must be compensated
|AVL Emission Test Systems | Engeljehringer | 2014 36
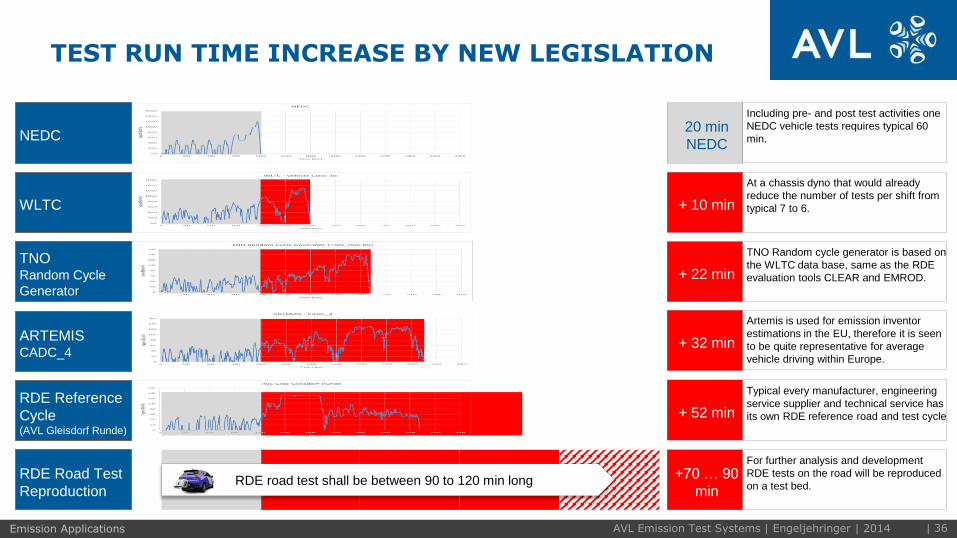
TEST RUN TIME INCREASE BY NEW LEGISLATION
Emission Applications
NEDC20 min
NEDC
WLTC + 10 min
At a chassis dyno that would already
reduce the number of tests per shift from
typical 7 to 6.
Including pre- and post test activities one
NEDC vehicle tests requires typical 60
min.
TNORandom Cycle
Generator
+ 22 min
TNO Random cycle generator is based on
the WLTC data base, same as the RDE
evaluation tools CLEAR and EMROD.
ARTEMISCADC_4
+ 32 min
Artemis is used for emission inventor
estimations in the EU, therefore it is seen
to be quite representative for average
vehicle driving within Europe.
RDE Road Test
ReproductionRDE road test shall be between 90 to 120 min long
+70 … 90
min
For further analysis and development
RDE tests on the road will be reproduced
on a test bed.
+ 52 min
Typical every manufacturer, engineering
service supplier and technical service has
its own RDE reference road and test cycle
RDE Reference
Cycle(AVL Gleisdorf Runde)

|AVL Emission Test Systems | Engeljehringer | 2014 37
RDE CHALLENGES ESTIMATIONS – TEST CAPACITY
Emission Applications
• Number of development chassis dyno testbeds = 10 Chassis dynos
• 5 days/week, 50% in 1 and 50% in 2 shift operation, 7 tests/shift, 49 weeks/year = 2.600 Tests per year per CD testbed
• Total test capacity = 26.000 Tests per year
Effects on test bed capacity caused by:
• Reduction of number of tests by longer test time (NEDC 20min -> WLTC 30min) = 3.700 Tests per year must be compensated
• additional 50 chassis dyno tests needed since RDE
@ 20 models each in 10 EU variants tested in the next 3 years until 2018 = 3.300 Tests per year should be added
• Additional needed test capacities = 7.000 Tests per year
+27% more, but what ?
More test beds,
Higher Efficienciy,
Other test bed types (Powertrain- ,
Engine, HIL, …) or/and
more effective development methods
and tools (simulation, front loading
Engeljehringer Kurt | Emission Test Systems | 07 April 2015 | 38Public
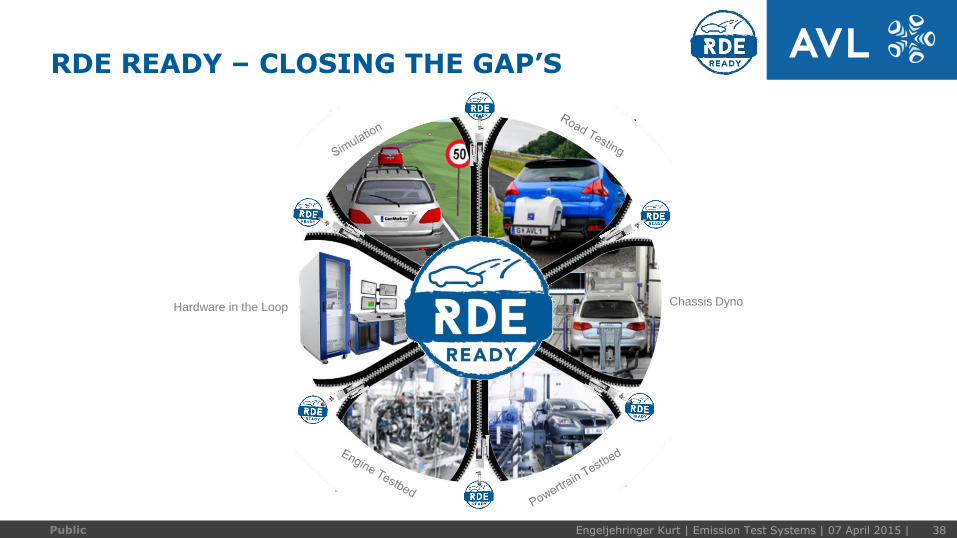
RDE READY – CLOSING THE GAP’S
Chassis DynoHardware in the Loop