Emission Inventory Report
111
WEST RAND DISTRICT MUNICIPALITY: EMISSION INVENTORY FOR 2011 Report No. uMN014-12 i EMISSION INVENTORY FOR THE WEST RAND DISTRICT MUNICIPALITY Issued by: Issued to: uMoya-NILU Consulting (Pty) Ltd P O Box 20622 Durban North, 4016 South Africa MD Mokoena Air Quality Officer West Rand District Municipality Corner Park and 6 th Streets Randfontein 2000 May 2012
Transcript of Emission Inventory Report

WEST RAND DISTRICT MUNICIPALITY: EMISSION INVENTORY FOR 2011
Report No. uMN014-12 i
EMISSION INVENTORY FOR
THE WEST RAND DISTRICT
MUNICIPALITY
Issued by: Issued to:
uMoya-NILU Consulting (Pty) Ltd
P O Box 20622
Durban North, 4016
South Africa
MD Mokoena
Air Quality Officer
West Rand District Municipality
Corner Park and 6th Streets
Randfontein
2000
May 2012

WEST RAND DISTRICT MUNICIPALITY: EMISSION INVENTORY FOR 2011
Report No. uMN014-12 ii
This report has been produced for the West Rand District Municipality by uMoya-NILU Consulting (Pty) Ltd. The intellectual property contained in this report
remains vested in uMoya-NILU Consulting (Pty) Ltd. No part of the report may be reproduced in any manner without written permission from the West Rand District Municipality and uMoya-NILU Consulting (Pty) Ltd.
When used as a reference this report should be cited as follows:
uMoya-NILU (2012): Emission Inventory for the West Rand District Municipality, report
for the West Rand District Municipality, uMoya-NILU Consulting (Pty) Ltd, Report No.
uMN014-12.

WEST RAND DISTRICT MUNICIPALITY: EMISSION INVENTORY FOR 2011
Report No. uMN014-12 iii
EXECUTIVE SUMMARY
Introduction:
Substances released into the air can affect the health of the environment, residents,
animals and plants. Air emissions are the quantity of a substance, measured as mass of
substance per time unit, released into the atmosphere from a source. Sources of air
emissions include industrial facilities, transportation, home heating, agriculture, forest
fires and many others.
The West Rand District Municipality (WRDM) comprises four local municipalities, namely
Mogale City, Randfontein, Merafong and Westonaria. The WRDM is undertaking its first
air emissions inventory, which will then have to be updated on a regular basis to account
for emission changes. The results of the emission inventory will be used to shape the
way air quality is improved in the WRDM. The emission inventory is fundamental to the
development, implementation, monitoring and evaluation of the WRDM’s air quality
strategy. The emission inventory is also used as a major input to atmospheric dispersion
models.
The base year relevant to the emission inventory is 2011, which means that all emission
estimates will be based on 2011 activity data. The primary focus of the emission
inventory will be on the following criteria pollutants:
Sulphur dioxide (SO2)
Nitrogen oxides (NOx)
Carbon monoxide (CO)
Particulate matter (PM, PM10)
Lead (Pb)
The United States Environmental Protection Agency (USEPA) regulates these pollutants
by developing health-based air quality standards. In addition to these pollutants,
emissions will also be estimated for VOC and benzene. Emissions will be reported as
emission rates, of which the most common units are ton/day or kg/year. Pollutant
emission rates will be estimated by a combination of approaches, including the emission
factor approach and emissions monitoring.
Categorisation of Source in WRDM:
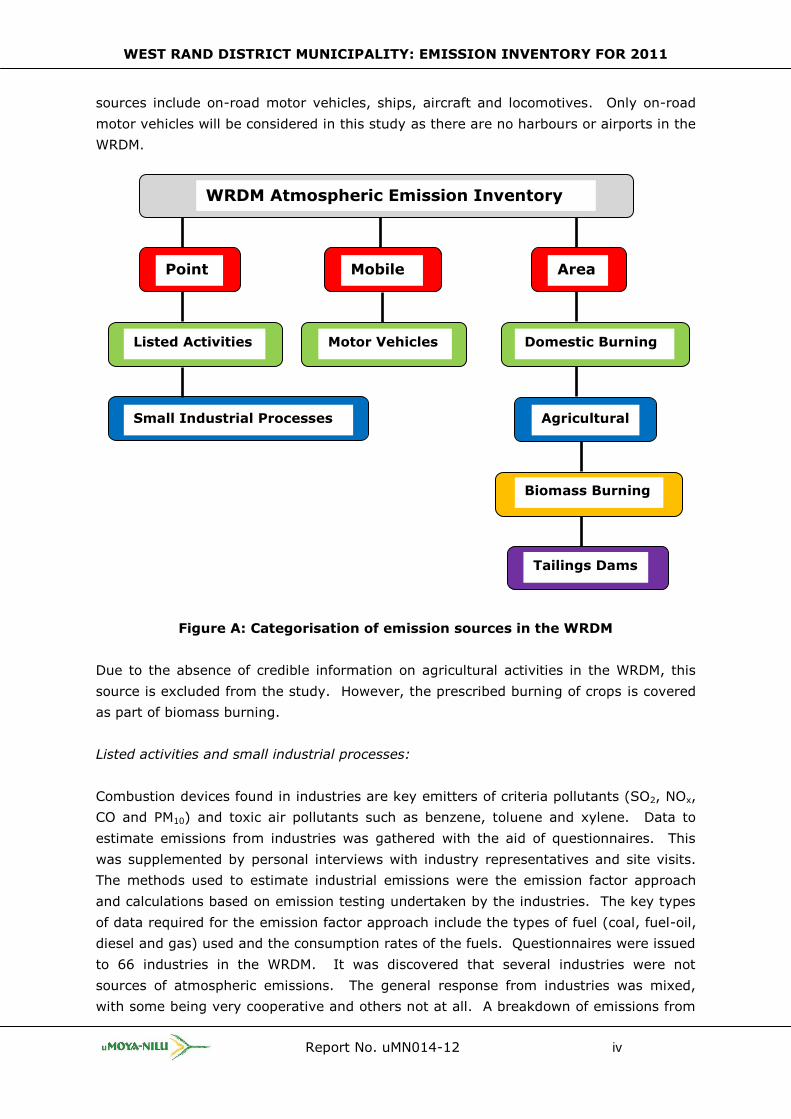
The emission sources in the WRDM are grouped into three main emission types (Figure
A) based on their characteristics, namely, point, mobile and area sources.
Point sources are sub-divided into the two categories of listed activities, i.e., large
industries regulated by Section of the National Environmental Management: Air Quality
Act (Act 39 of 2004) (AQA), and smaller industrial processes with boilers. Mobile
WEST RAND DISTRICT MUNICIPALITY: EMISSION INVENTORY FOR 2011
Report No. uMN014-12 iv
sources include on-road motor vehicles, ships, aircraft and locomotives. Only on-road
motor vehicles will be considered in this study as there are no harbours or airports in the
WRDM.
Figure A: Categorisation of emission sources in the WRDM
Due to the absence of credible information on agricultural activities in the WRDM, this
source is excluded from the study. However, the prescribed burning of crops is covered
as part of biomass burning.
Listed activities and small industrial processes:
Combustion devices found in industries are key emitters of criteria pollutants (SO2, NOx,
CO and PM10) and toxic air pollutants such as benzene, toluene and xylene. Data to
estimate emissions from industries was gathered with the aid of questionnaires. This
was supplemented by personal interviews with industry representatives and site visits.
The methods used to estimate industrial emissions were the emission factor approach
and calculations based on emission testing undertaken by the industries. The key types
of data required for the emission factor approach include the types of fuel (coal, fuel-oil,
diesel and gas) used and the consumption rates of the fuels. Questionnaires were issued
to 66 industries in the WRDM. It was discovered that several industries were not
sources of atmospheric emissions. The general response from industries was mixed,
with some being very cooperative and others not at all. A breakdown of emissions from
WRDM Atmospheric Emission Inventory
Point Mobile Area
Listed Activities Motor Vehicles
Small Industrial Processes
Domestic Burning
Agricultural
Biomass Burning
Tailings Dams

WEST RAND DISTRICT MUNICIPALITY: EMISSION INVENTORY FOR 2011
Report No. uMN014-12 v
the individual industries is contained in Section 4 of this report. The following table
provides a summary per local municipality:
Table A: Breakdown of industrial emission rates per local municipality in
WRDM, ton/day
Local
Municipality
Emission Rate (ton/day)
SO2 NOx CO PM10 VOC Benzene Lead
Mogale City 3.111 2.449 383.680 2.190 0.013 0.001 0.030
Randfontein 1.184 0.297 0.194 0.530 1.492 0.017 0
Westonaria 0.626 0.119 0.078 11.577 0.001 0 0
Merafong 0 0 0 0.004 0 0 0
Total 4.921 2.864 383.952 14.297 1.506 0.017 0.030
The largest industrial source of SO2 emissions is Mogale Alloys at 2.27 ton/day. Its
contribution to total SO2 emissions exceeds 46%, implying that significant reductions in
industrial SO2 emissions in the WRDM could be achieved by focussing reduction efforts
solely on Mogale Alloys. The other industries that have recorded notable SO2 emissions
are the Foodcorp Grocery Division and West End Clay Brick. Emissions of NOx from
industries in the WRDM are also low at 2.86 ton/day.
The local municipality that produces the largest quantity of industrial emissions is Mogale
City. However, it is interesting to note that the highest emissions of PM10 are from
Westonaria. This is primarily due to the many mining operations taking place there.
Motor vehicles:
A motor vehicle is defined as an on-road vehicle that derives its power for propulsion
from the combustion of fossil fuel. The most common types of motor vehicles that
operate in the WRDM are cars, vans (light-duty vehicles), buses and trucks (heavy-duty
vehicles). Cars are fuelled by both diesel and petrol (gasoline), whereas trucks are only
fuelled by diesel. Pollution from vehicles arises from the by-products of the combustion
process (emitted via the exhaust system), from evaporation of the fuel itself from the
fuel tank and from brakes and tyre wear. The pollutants produced include SO2, NOx, CO,
PM10, VOC and lead.
Motor vehicle emissions were estimated by using the Tier 1 approach proposed by the
European Environmental Agency (EEA). The key types of data required for this approach
are fuel sales data and emission factors. Fuel sales data was sourced from the
Department of Energy, which collates fuel sales data for the oil companies. Data was
available for all the local municipalities with the exception of Merafong. Emission factors
were sourced from the EEA.
The total emissions estimated from motor vehicles are presented below in Table B.

WEST RAND DISTRICT MUNICIPALITY: EMISSION INVENTORY FOR 2011
Report No. uMN014-12 vi
Table B: Breakdown of motor vehicle emission rates per local municipality in
WRDM, ton/day
Local
Municipality
Emission Rates (ton/day)
SO2 NOx CO PM10 VOC Lead
Mogale City 0.143 5.329 27.278 0.341 2.977 0.000
Randfontein 0.046 1.911 11.228 0.099 1.215 0.000
Westonaria 0.042 1.742 10.243 0.090 1.108 0.000
Total 0.231 8.982 48.749 0.530 5.300 0.000
The largest quantity of motor vehicle emissions are from Mogale City, followed by
Randfontein and Westonaria. Motor vehicle emissions in Mogale City, on average, make
up approximately 60% of total motor vehicle emissions in the WRDM. With respect to
individual pollutants, the pollutant emitted in the greatest quantity from motor vehicles
in the WRDM is CO at 48.749 ton/day. This is followed by NOx at 8.982 ton/day and
VOC at 5.3 ton/day. The largest source of VOC is gasoline-fuelled passenger cars. PM10
from diesel engines is considered to be one of the most dangerous pollutants from motor
vehicles with regard to human health. PM10 emissions from motor vehicles in the WRDM
are estimated to be 0.53 ton/day or 193 558 kg/year. The largest source of PM10
emissions is high-sulphur diesel and consequently light-duty trucks and heavy-duty
vehicles (trucks and buses). Due to the phase-out of lead from fuels, total lead
emissions from motor vehicles in the WRDM are low at 5 kg/year.
Tailings dams:
Tailings are the residue of the milling process used to extract valuable metals from
mined ores. There are currently approximately 52 active and inactive tailings dams in
the West Rand District Municipalities owned by the various gold mines located in the
areas. A total of 14 tailings dams were identified in Mogale City, 2 in Randfontein, 11 in
Westonaria and 23 in Merafong.
Tailings dams are examples of open areas that provide substantially large un-vegetated
areas that are exposed to wind erosion. They are a major source of dust and particulate
emissions. The estimation of particulate emissions is based on the USEPA methodology
for wind erosion of open aggregate storage piles and exposed areas in industrial facilities
provided in Chapter 13 of the USEPA 42 (USEPA, 2006). The total estimated emissions
from tailings dams are presented in Table C.
Table C: Breakdown of tailings dams emission rates per local municipality
Local Municipality PM Emission Rate
(kg/year)
PM Emission Rate
(ton/day)
% of
Total
Mogale City 1 797 629 4.92 10.95
Randfontein 1 925 291 5.28 11.75
Westonaria 3 956 869 10.83 24.10

WEST RAND DISTRICT MUNICIPALITY: EMISSION INVENTORY FOR 2011
Report No. uMN014-12 vii
Merafong 7 734 055 21.21 47.21
Total 16 467 289 42.24
The local municipality that emits the largest quantity of PM emissions from tailings dams
is Merafong at 21.21 ton/day, which is also the municipality with the greatest number of
tailings dams. More than 47% of all PM emissions from tailings dams are emitted from
Merafong. Significant quantities of emissions also originate from Westonaria, where
many tailings dams are also located. Since there is no information on what proportion of
the PM consists of PM10, it is assumed that all PM is PM10 which is representative of a
worst-case scenario.
Domestic burning:
The three primary application categories relating to domestic fuel burning are cooking,
lighting and space heating. The primary fuels used in South Africa for domestic
purposes are coal, paraffin, liquefied petroleum gas (LPG) and wood. Domestic use of
fuels is restricted largely to informal, low-income and densely populated settlements.
The combustion of these fuels is a significant source of air pollution, especially during
winter. The impact on air quality from residential fire emissions is fairly significant,
considering that the release of pollutants occurs close to ground level at relatively low
temperatures.
Domestic coal burning contributes to the emission of PM10, SO2, NOx, CO and benzene.
The emission factor approach was used to estimate emissions from domestic burning.
Data was sourced on the number of households in the WRDM, the consumption of fuels
by these households and emission factors for the various fuels burned in households.
The estimated emissions from domestic burning are presented in the table below.
Table D: Breakdown of domestic burning emission rates per local municipality
in WRDM, ton/day
Local
Municipalities
Emission Rate (ton/day)
SO2 NOx CO PM10 VOC Benzene
Mogale City 0.087 0.011 0.781 0.019 0.023 0.000
Randfontein 0.040 0.005 0.339 0.007 0.008 0.000
Westonaria 0.068 0.009 0.536 0.010 0.012 0.000
Merafong 0.001 0.000 0.009 0.000 0.000 0.000
Total 0.196 0.025 1.665 0.036 0.044 0.000
Emissions of all pollutants, with the exception of benzene, can be described as
significant. The combustion of coal and paraffin results in high emissions of SO2 due to
the high sulphur content in these fuels. The local municipality that produces the largest
quantity of emissions from domestic burning is Mogale City. This is directly attributable
to the high number of households in Mogale City that use coal for cooking and space
heating. Westonaria is the municipality that produces the second highest quantity of

WEST RAND DISTRICT MUNICIPALITY: EMISSION INVENTORY FOR 2011
Report No. uMN014-12 viii
emissions. Westonaria is the local municipality where the consumption of paraffin is the
greatest. A high number of households use paraffin in Mogale City for cooking, lighting
and space heating.
Biomass burning:
Biomass burning is generally categorised into wildfires and prescribed (controlled)
burning. A wildfire is a large-scale natural combustion process that consumes various
ages, sizes, and types of flora growing outdoors in a geographical area. Consequently,
wildfires are potential sources of large amounts of air pollutants. Prescribed burning
activities include fires that are intentionally started for a variety of reasons such as fuel
reduction for wildfire prevention, regeneration after logging operations, ecosystem
maintenance, land clearing, and agricultural land management. Emissions of PM, CO,
NOx and VOC from wildfires are estimated by using the emission factor approach.
Emissions of SO2 from biomass burning are considered to be negligible.
The emission factor method requires data on the area burned (in hectares) by a fire and
fuel loading (mass of forest fuel/unit land area burned). Data on area burned was
sourced from the Meraka Institute that uses satellite remote sensing techniques to
identify burned areas. For this study, their analyses of burned area consisted of a spatial
overlay with aggregation, performed in a spatial relational database.
The total burned area for 2011 was 782.6 km2, compared to a total estimated area of
the WRDM of 4 087 km2. The burned area represents 20% of the total area of the
WRDM. This does not however imply that 20% of the total surface area of the
municipality was burned as a single location could be burned several times in a year.
A total of 3 651 fires occurred in 2011, meaning that there were approximately 10 fires
in a day in the WRDM. The highest number of fires for both 2010 and 2011 (average of
4.4 a day) occurred in Merafong, by a significant margin. The lowest number of fires
occurred in Randfontein. The results of the estimation of emissions from biomass
burning are presented below in Tables E.
Table E: Breakdown of biomass burning emission rates per local municipality in
WRDM, ton/day
Local
Municipality
Emission Rate (ton/day)
NOx CO PM10 VOC
Mogale City 3.638 127.802 10.856 21.923
Merafong City 7.740 271.913 23.097 46.643
Randfontein 1.763 61.941 5.261 10.625
Westonaria 3.156 110.866 9.417 19.018
Total 16.297 572.522 48.632 98.208
The total emissions from biomass burning can be described as significant. This is
primarily due to the high number of fires that occur in the district municipality.

WEST RAND DISTRICT MUNICIPALITY: EMISSION INVENTORY FOR 2011
Report No. uMN014-12 ix
Significant quantities of all pollutants are emitted into the atmosphere from biomass
burning. The pollutant emitted in the highest quantity if CO at 572.522 ton/day. There
are also significant quantities of VOC and PM emitted at 98.208 ton/day and 48.632
ton/day, respectively. In line with the highest number of fires there, the highest
quantity of emissions as a result of biomass burning are from Merafong.
Total emissions:
Total emissions of all pollutants from all sources in the WRDM are presented below in
Table F.
Table F: Total emissions from all sources in the WRDM, ton/day
Source Emission Rate (ton/day)
SO2 NOx CO PM10 VOC Benzene Lead
Industries 4.921 2.864 383.952 14.297 1.506 0.017 0.030
Motor vehicles 0.231 8.982 48.749 0.530 5.300
0.000
Domestic burning 0.196 0.025 1.665 0.036 0.044
Tailings dams
42.24
Biomass burning
16.297 572.522 48.632 98.208
Total 5.348 28.167 1 006.889 105.736 105.058 0.017 0.030
The emission rates contained in the above tables provide useful information on which
sources to focus when developing emission reduction initiatives. A total of 5.348
ton/day of SO2 are emitted in the WRDM. Industries are the most significant contributor
to this total (>92.0%), due mainly to the combustion of coal.
A total of 28.167 ton/day of NOx emissions are produced in the WRDM, approximately 5
times more than SO2. The largest producer of NOx emissions is from biomass burning.
Wildfires and prescribed burning activities cause nitrogen to be oxidised to NOx. It is
estimated that a total of 16.297 ton/day of NOx emissions are produced in this way. The
other notable sources of NOx emissions are motor vehicles at 8.982 ton/day and
industries at 2.864 ton/day.
A total of 1 006.889 ton/day of CO emissions are produced, greater than both SO2 and
NOx. However, this does not necessarily mean that CO will pose a greater danger to the
health and well-being of residents in the WDM. CO normally causes negative health
impacts at high concentrations, whereas SO2 and NOx cause negative health impacts at
much lower concentrations. The two most significant sources of CO emissions are
biomass burning and industries at 572.522 ton/day and 383.952 ton/day, respectively.
As expected, the tailings dams produce no CO emissions, while motor vehicles produce
48.749 ton/day.
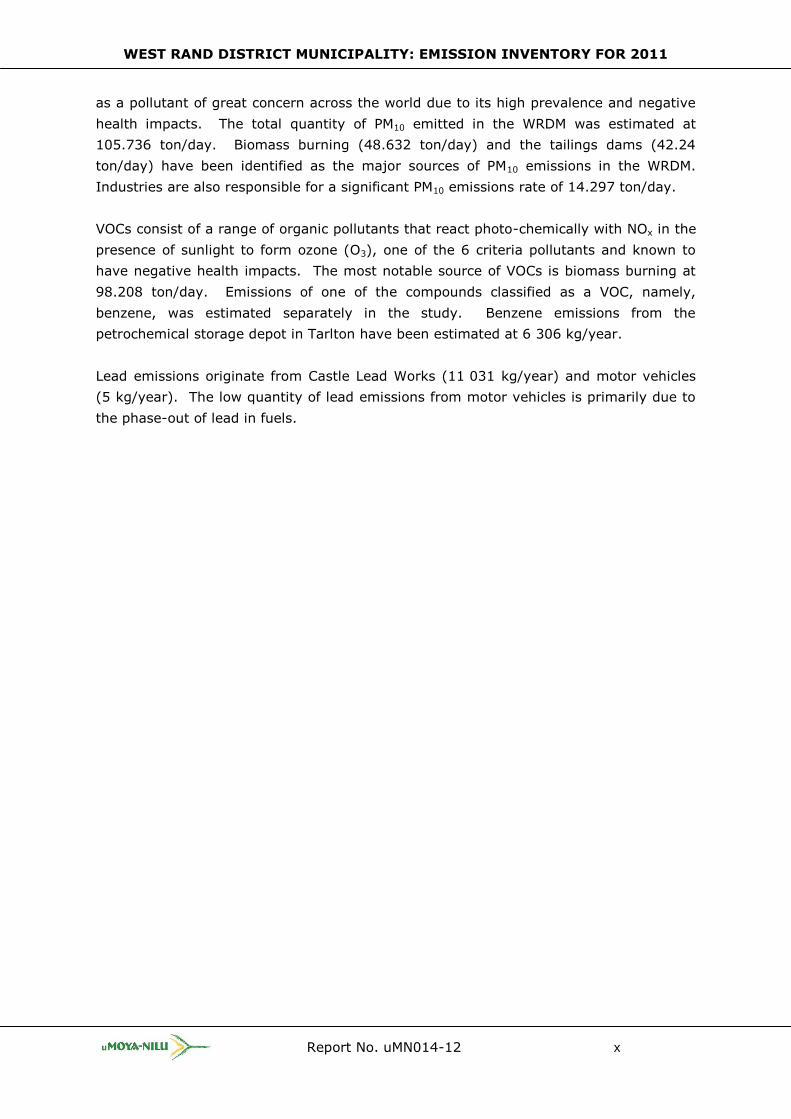
PM10 emissions are produced by all sources identified in this study. The quantity of PM10
emissions produced in the WRDM are greater than both SO2 and NOx. PM10 is recognised
WEST RAND DISTRICT MUNICIPALITY: EMISSION INVENTORY FOR 2011
Report No. uMN014-12 x
as a pollutant of great concern across the world due to its high prevalence and negative
health impacts. The total quantity of PM10 emitted in the WRDM was estimated at
105.736 ton/day. Biomass burning (48.632 ton/day) and the tailings dams (42.24
ton/day) have been identified as the major sources of PM10 emissions in the WRDM.
Industries are also responsible for a significant PM10 emissions rate of 14.297 ton/day.
VOCs consist of a range of organic pollutants that react photo-chemically with NOx in the
presence of sunlight to form ozone (O3), one of the 6 criteria pollutants and known to
have negative health impacts. The most notable source of VOCs is biomass burning at
98.208 ton/day. Emissions of one of the compounds classified as a VOC, namely,
benzene, was estimated separately in the study. Benzene emissions from the
petrochemical storage depot in Tarlton have been estimated at 6 306 kg/year.
Lead emissions originate from Castle Lead Works (11 031 kg/year) and motor vehicles
(5 kg/year). The low quantity of lead emissions from motor vehicles is primarily due to
the phase-out of lead in fuels.

WEST RAND DISTRICT MUNICIPALITY: EMISSION INVENTORY FOR 2011
Report No. uMN014-12 xi
TABLE OF CONTENTS
1. INTRODUCTION ............................................................................................... 1 1.1 Background ........................................................................................................................... 1 1.2 Base Year ............................................................................................................................. 2 1.3 Pollutants .............................................................................................................................. 2 1.4 Source Types ........................................................................................................................ 3 1.5 Time Interval ......................................................................................................................... 4 1.6 General Emission Estimation Methodology .......................................................................... 4
2. TERMS OF REFERENCE ...................................................................................... 5
3. EMISSIONS INVENTORIES................................................................................. 6 3.1 Background ........................................................................................................................... 6 3.2 Emission Estimation Methodologies ..................................................................................... 8
3.2.1 Continuous Emissions Monitoring (CEM) ............................................................... 8 3.2.2 Source Testing ........................................................................................................ 9 3.2.3 Mass Balance .......................................................................................................... 9 3.2.4 Emission Models and Factors ................................................................................. 9
4. CATEGORISATION OF SOURCES IN THE WRDM .................................................. 11
5. LISTED ACTIVITIES AND SMALL INDUSTRIAL PROCESSES .................................. 14 5.1 Description of Emissions .................................................................................................... 14 5.2 Methodology ....................................................................................................................... 15
5.2.1 Data Gathering ...................................................................................................... 15 5.2.1 Estimation of Emissions ........................................................................................ 17
5.3 Results of Emissions Estimations ....................................................................................... 19 6. MOTOR VEHICLES .......................................................................................... 31
6.1 Description of Emissions .................................................................................................... 31 6.2 Methodology ....................................................................................................................... 32 6.3 Results of Emission Estimations ........................................................................................ 35
7. TAILINGS DAMS ............................................................................................. 40 7.1 Description of Emissions .................................................................................................... 40 7.2 Methodology ....................................................................................................................... 41 7.2.1 Data Gathering ................................................................................................................... 41 7.2.2 Estimation of Emissions ..................................................................................................... 41 7.3 Results of Emission Estimates ........................................................................................... 43
8. DOMESTIC BURNING ...................................................................................... 46 8.1 Description of Emissions .................................................................................................... 46 8.2 Methodology ....................................................................................................................... 46
8.2.1 Data Gathering ...................................................................................................... 46 8.2.2 Estimation of Emissions ........................................................................................ 48
8.3 Results of Emission Estimates ........................................................................................... 48 9. BIOMASS BURNING ........................................................................................ 50
9.1 Description of Emissions .................................................................................................... 50 9.2 Methodology for Estimating Emissions............................................................................... 51 9.3 Results of Emissions Estimation ........................................................................................ 53
10. EMISSIONS SUMMARY .................................................................................... 55
11. CONCLUSIONS AND RECOMMENDATIONS ......................................................... 60
12. REFERENCES ................................................................................................. 63
APPENDIX A – STAKEHOLDER WORKSHOP ............................................................. 64
APPENDIX B – DESCRIPTIONS OF POLLUTANTS AND THEIR HEALTH EFFECTS ............ 68
APPENDIX C – EMISSION INVENTORY QUESTIONNAIRE ........................................... 70
APPENDIX D - GUIDELINE DOCUMENT ................................................................... 77
APPENDIX E – STORAGE TANK EMISSIONS ............................................................ 92
APPENDIX F – LOADING GANTRY EMISSIONS ......................................................... 94
APPENDIX G – FUGITIVE EMISSIONS..................................................................... 96

WEST RAND DISTRICT MUNICIPALITY: EMISSION INVENTORY FOR 2011
Report No. uMN014-12 xii
GLOSSARY OF ACRONYMS, TERMS AND UNITS
AEL Atmospheric emission license
API American Petroleum Industry
AQA The National Environmental Management: Air Quality Act (No. 39 of
2005)
AQMP Air quality management plan
BAT Best Available Technology
BTEX Benzene, toluene, ethyl benzene and xylene
CALPUFF The Californian Puff Model, a USEPA approved Gaussian-Lagrangian
air dispersion model
C Degrees Celsius
CEM Continuous emissions monitoring
CO Carbon monoxide
CONCAWE Oil Companies European Association for Environment, Health and
Safety in Refining
DEA The Department of Environmental Affairs
EF Emission factor
EFRT External floating roof tank
EIA Environmental Impact Assessment
Emission
The direct or indirect release of substances, vibrations, heat or noise
from individual or diffuse sources in an installation into the air, water
or land.
FRT Fixed roof tank
g/s Grams per second
HFO Heavy fuel oil
LDAR Leak detection and repair
LPG Liquefied petroleum gas
m/s Meters per second
mg/m3 Milligrams per cubic meter
NEMA National Environmental Management Act (Act No. 107 of 1998)
Nm3/h Normal cubic meters per hour
NOx Oxides of nitrogen, collectively groups nitrogen oxide and nitrous
oxide
NPI National Pollutant Inventory of Australia
O3 Ozone
Pb Lead
PM10 Particulate matter with aerodynamic diameter < 10 microns
PM Particulate matter
ppb Parts per billion
SAWS South African Weather Service
SO2 Sulphur dioxide
TANKS US EPA model to calculate emissions from fuel storage tanks
WEST RAND DISTRICT MUNICIPALITY: EMISSION INVENTORY FOR 2011
Report No. uMN014-12 xiii
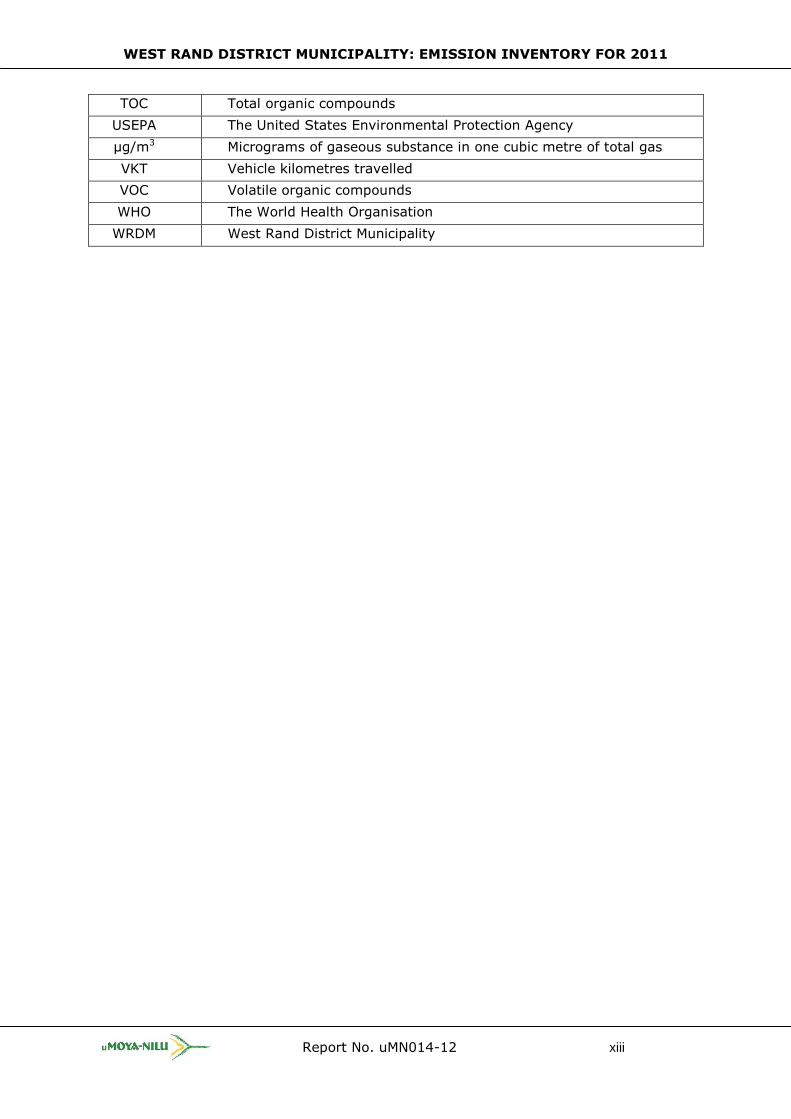
TOC Total organic compounds
USEPA The United States Environmental Protection Agency
µg/m3 Micrograms of gaseous substance in one cubic metre of total gas
VKT Vehicle kilometres travelled
VOC Volatile organic compounds
WHO The World Health Organisation
WRDM West Rand District Municipality

WEST RAND DISTRICT MUNICIPALITY: EMISSION INVENTORY FOR 2011
Report No. uMN014-12 1
1. INTRODUCTION
1.1 Background
Substances released into the air can affect the health of the environment, residents,
animals and plants. Air emissions are the quantity of a substance released to the
atmosphere from a source. There are a variety of sources that are responsible for air
emissions, these include both naturally occurring and man-made. Sources of air
emissions include industrial facilities, transportation, home heating, agriculture, forest
fires and many others.
Air pollution comes from many sources, so it is important to know the contribution each
one makes in order to develop the best approaches for improving air quality. The West
Rand District Municipality (WRDM) is undertaking its first air emissions inventory, which
will then have to be updated on a regular basis to account for emission changes. The
results of the emission inventory will be used to shape the way air quality is improved in
the WRDM. The emission inventory is fundamental to the development, implementation,
monitoring and evaluation of the WRDM’s air quality strategy. The emission inventory is
also used as the major input to atmospheric dispersion models.
The WRDM is located in the province of Gauteng and comprises four local municipalities,
namely Mogale City, Randfontein, Merafong and Westonaria (see Figures 1.1 and 1.2).
The North West province is located to the north, west and south of the municipality.
Figure 1.1: Map showing location of WRDM in Gauteng Province
WEST RAND DISTRICT MUNICIPALITY: EMISSION INVENTORY FOR 2011
Report No. uMN014-12 2
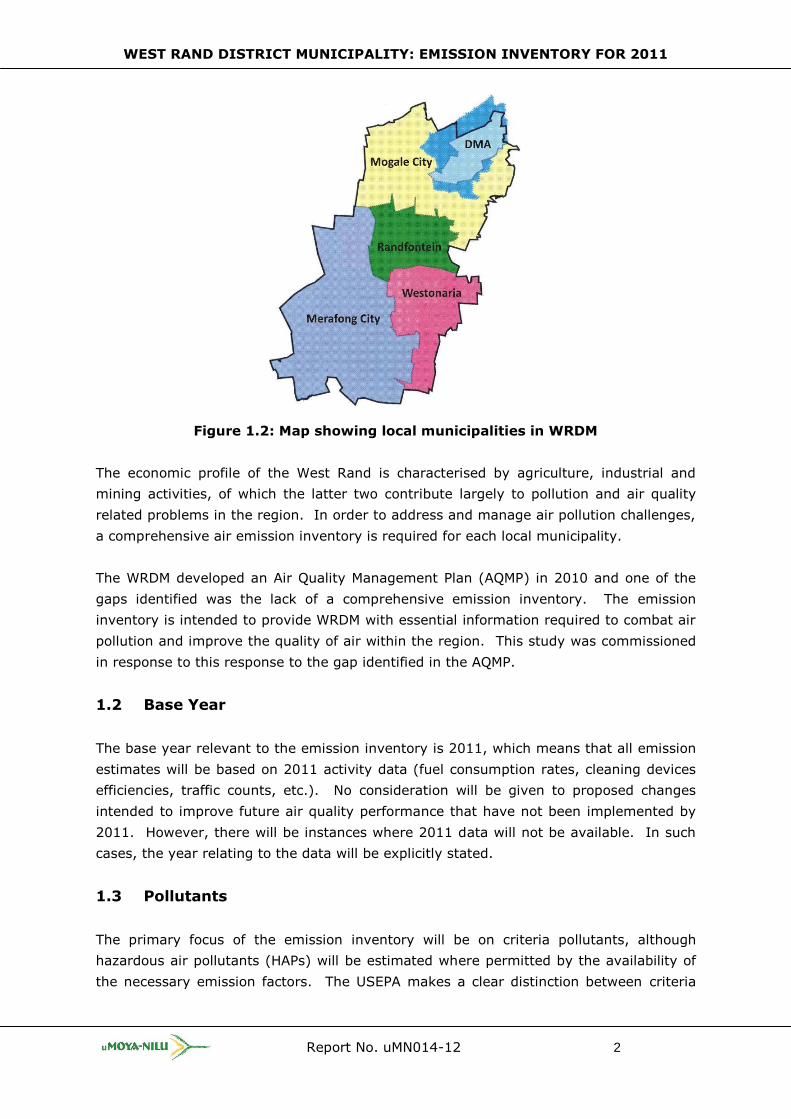
Figure 1.2: Map showing local municipalities in WRDM
The economic profile of the West Rand is characterised by agriculture, industrial and
mining activities, of which the latter two contribute largely to pollution and air quality
related problems in the region. In order to address and manage air pollution challenges,
a comprehensive air emission inventory is required for each local municipality.
The WRDM developed an Air Quality Management Plan (AQMP) in 2010 and one of the
gaps identified was the lack of a comprehensive emission inventory. The emission
inventory is intended to provide WRDM with essential information required to combat air
pollution and improve the quality of air within the region. This study was commissioned
in response to this response to the gap identified in the AQMP.
1.2 Base Year
The base year relevant to the emission inventory is 2011, which means that all emission
estimates will be based on 2011 activity data (fuel consumption rates, cleaning devices
efficiencies, traffic counts, etc.). No consideration will be given to proposed changes
intended to improve future air quality performance that have not been implemented by
2011. However, there will be instances where 2011 data will not be available. In such
cases, the year relating to the data will be explicitly stated.
1.3 Pollutants
The primary focus of the emission inventory will be on criteria pollutants, although
hazardous air pollutants (HAPs) will be estimated where permitted by the availability of
the necessary emission factors. The USEPA makes a clear distinction between criteria

WEST RAND DISTRICT MUNICIPALITY: EMISSION INVENTORY FOR 2011
Report No. uMN014-12 3
pollutants and HAPs. Criteria pollutants are the six most commonly found air pollutants
that can harm human health or the environment. They include:
Sulphur dioxide (SO2)
Nitrogen oxides (NOx)
Carbon monoxide (CO)
Particulate matter (PM, PM10)
Ozone (O3)
Lead (Pb)
The USEPA regulates these pollutants by developing health-based air quality standards.
Emissions for five of the six criteria pollutants will be estimated as part of this project.
Ozone will be excluded as it is, strictly speaking, not an emission but is formed by the
photochemical reaction of nitrogen oxides with non-methane volatile organic compounds
(NMVOC).
HAPs, on the other hand, are pollutants that cause or may cause cancer or other serious
health effects. However, these effects normally occur at high concentrations not
commonly found in the ambient environment, but in occupational environments such as
in the vicinity of chemical plants or chemical storage facilities. The standards developed
for HAPs are therefore occupational standards and are applied to workers working in
facilities that produce or store these pollutants. Examples are toluene (found in
gasoline), methylene chloride (found in paint stripper) and perchlorethylene (emitted
from dry cleaners). The USEPA has compiled a list of 187 HAPs, the majority of which
are organic in nature. However, certain non-organic HAPs such as hydrogen sulphide
(H2S), hydrogen fluoride (HF) and mercury also do exist. The full list of HAPs can be
accessed on the following link:
http://www.epa.gov/ttn/atw/188polls.html
1.4 Source Types
The project scope will include the following three primary source categories:
Point sources
Non-point sources
Mobile sources
Point sources are generally large industries with high stacks and high emission loads.
The USEPA defines a point source as any industry emitting >10 ton/annum of a criteria
pollutant or a combination of criteria pollutants. South Africa has not yet adopted a
formal definition for point sources. The following are typical examples of industries
classified as point sources:
Oil refineries
Power plants
WEST RAND DISTRICT MUNICIPALITY: EMISSION INVENTORY FOR 2011
Report No. uMN014-12 4
Pulp and paper mills
Metallurgical industries
Non-point or area sources are smaller sources of similar activity that are grouped
together, which when taken collectively, produce a significant amount of air pollution.
There are several categories of area sources including biogenic sources, small industrial
sources (tank farms, landfills, waste water treatment plants, etc.), agricultural sources,
domestic burning sources and minor road sources.
Mobile sources are classified as on-road or non-road sources. As the name suggests,
on-road sources include all motor vehicles that travel on road such as cars, vans, trucks
and buses. Non-road sources refer to vehicles that are not confined to a road such as
ships, boats, aeroplanes, construction equipment and farming equipment.
1.5 Time Interval
Emissions will be reported as emission rates (versus emission concentrations), that is,
the mass of pollutants emitted in a time unit interval. The most common emission rate
units are ton/day or kg/annum. Reporting in daily averaging units such as ton/day is
important as it allows seasonal variations during the course of the year to be accounted
for. Seasonal variations occur when industries operate for certain months of the year
and not for others. This results in the uneven distribution of emissions during the year.
Variations in emissions also occur for motor vehicle emissions such that emissions rates
are higher during weekdays and lower during weekends. This variation can only be
demonstrated if emission rates are reported on a daily basis.
The unit of ton/day will be reported to two decimal places, whereas the unit of kg/year
will be reported to zero decimal places.
1.6 General Emission Estimation Methodology
Activity data will be obtained from industry groups, government departments and other
service providers. Pollutants emission rates will then be estimated by combining activity
data with emission factors. Where available, source emission test data will be used in
preference to emission factors for industrial and commercial sources. The emissions will
be assigned to the four local municipalities for all sources. Emissions will then be
calculated for days and years using emissions factors derived from various
internationally recognised sources. Emission estimation techniques for all source types
have been based on either published United States Environmental Protection Agency
(USEPA) or Australian (i.e. NPI) methodologies.

WEST RAND DISTRICT MUNICIPALITY: EMISSION INVENTORY FOR 2011
Report No. uMN014-12 5
2. TERMS OF REFERENCE
The following items broadly define the scope of work for the project:
A. Estimation of emissions from the following biogenic and anthropogenic sources:
Veld fires, windblown dust, etc.
Area sources (human settlements)
Point sources:
Industrial (including mining)
Commercial
Agricultural activities:
Crop related
Animal Breading
Mobile sources:
On- road mobile
Off- road mobile
B. Inclusion of the following pollutants in the inventory:
Criteria pollutants
Organic air toxins
C. Inclusion of the Mogale, Randfontein, Merafong and Westonaria local municipal areas
in the inventory.

WEST RAND DISTRICT MUNICIPALITY: EMISSION INVENTORY FOR 2011
Report No. uMN014-12 6
3. EMISSIONS INVENTORIES
3.1 Background
An air emissions inventory is an accounting of air pollutant emissions released over a
given time for a given political or geographic area. It can include point (e.g. industrial
stacks), area (e.g. domestic burning) and mobile (e.g. cars, trucks, and rail) sources. Air
emissions inventories can include emissions from both anthropogenic (man-made) and
natural (e.g. biomass burning, vegetation, soil, etc.) sources.
Air emission inventories are fundamental components of air quality management
systems. Air emissions must be measured before they can be managed and reduced.
Other components of an air quality management system include goals, policies, ambient
objectives, source emission standards, dispersion modelling, ambient air and source
emission monitoring, environmental reporting, approvals, inspections, enforcement and
research. Air emissions inventories are needed to provide regulators, industry and the
public with easy access to the best possible data to make informed decisions. They are
also needed in order to develop and evaluate emission reduction scenarios. Examples of
emission sources are shown in Figure 3.1.
Figure 3.1: Illustration showing typical emission sources
In an emission inventory, all sources of pollution within an area are listed, and details
are provided of the locations and masses of pollutants emitted. Sources of pollution are
divided into the following categories:
Point sources - Emissions from single activities of considerable size, like industrial
plants, power plants and incinerators are characterised by emissions from
individual stacks. It is important to identify the stacks, and to collect information
about their height, physical parameters and the exact location so that it is
spatially resolved.

WEST RAND DISTRICT MUNICIPALITY: EMISSION INVENTORY FOR 2011
Report No. uMN014-12 7
Mobile sources - Emissions from road traffic, streets and highways, and railways.
Emissions are usually estimated based on transportation data (e.g. traffic
counts).
Area sources - Area sources are smaller or more diffuse sources of pollution (e.g.
home heating, public services, veld fires, agricultural activities). Input data for
estimating emissions from these sources are provided on an area basis either for
administrative areas, such as counties, municipalities or for regular grids.
There are several widely used categories to characterise pollutants. These categories
depend on the level of prevalence of the pollutants and the severity of their impacts on
human beings. The three categories that relate particularly to the petroleum industry
are criteria pollutants, toxic (hazardous) air pollutants and nuisance pollutants.
Criteria pollutants:
The USEPA lists criteria pollutants as the six most commonly found air pollutants that
can harm human health or the environment. They include sulphur dioxide (SO2),
nitrogen oxides (NOx), carbon monoxide (CO), particulate matter (PM), ozone (O3), and
lead (Pb). The USEPA regulates these pollutants by developing health-based air quality
standards.
Toxic air pollutants:
Toxic air pollutants are pollutants that cause or may cause cancer or other serious health
effects. However, their effects normally occur at high concentrations or concentrations
not commonly found in the ambient environment. The impacts of toxic air pollutants are
generally occupational in nature and occur at the point of production. The standards
developed for toxic air pollutants are therefore primarily occupational in nature and
applied to the work place. There are various types of toxic air pollutants that originate
from petrochemical refineries, most of which are organic in nature (collectively referred
to as total organic compounds or TOCs) and formed by the volatilization of organic
compounds. For petrochemical facilities, the following have been identified as the key
toxic air pollutants:
Benzene
Toluene
Ethyl benzene
Xylene
They are collectively referred to as the BTEX group of compounds.
Nuisance pollutants:
In addition to criteria and toxic air pollutants, which are associated with negative health
impacts, there are also pollutants that do not affect one’s health but rather quality of
life. These are the so-called nuisance pollutants and included in this category are

WEST RAND DISTRICT MUNICIPALITY: EMISSION INVENTORY FOR 2011
Report No. uMN014-12 8
pollutants such as hydrogen sulphide (H2S) (odour impact), mercaptans (odour impact)
and dust fallout (nuisance impact).
The emissions inventory starts with identifying all relevant sources in the industry. For
each source that may emit air pollution and contribute to exposure, data must be
collected on the:
Type of source (e.g. point, line, and area source)
Location of source
Amount of emission
Variation of the emissions with time (hour of the day, day of the week and year).
When developing an emission inventory, it is imperative that a base year is selected.
This will serve as a reference for future emissions inventories. Emissions inventories are
typically updated every three to five years.
Emissions data serves as the primary input for air dispersion modelling in providing
spatially referenced emission rates from sources such as industries. Emission
inventories are the starting point in the development of air quality management systems
and provide data for:
Establishing a baseline for future planning.
Setting emission limits and reduction targets for industries through permitting.
Tracking environmental performance of industries (and regulators).
Identifying sources and problem areas.
Generating public interest in air quality.
3.2 Emission Estimation Methodologies
The methodologies most commonly used by petroleum refineries to estimate emissions
to the atmosphere are direct measurement methods: continuous emissions monitoring
(CEM), source testing; and indirect methods: mass balance calculations, emission
models and factors, and engineering estimates.
3.2.1 Continuous Emissions Monitoring (CEM)
CEMs are proven technologies for monitoring emissions directly and continuously. CEMs
are used to determine flue gas flow rates, analyse the gas, measure the contaminant
concentrations, and log the data. They can be the most accurate method of quantifying
emissions but are the most costly option. In several countries, regulations require CEMs
to monitor SO2 and NOx emissions from sulphur recovery unit (SRU) incinerators,
fluidised catalytic crackers (FCCs) and boilers. SO2 and NOx emissions are perceived to
be the most significant pollutants, and these three sources are generally the largest at
refineries under normal operating conditions. Most CEMs require certification and
verification of quality assurance/control (QA/QC) activities, as well as routine
maintenance. Continuous monitoring can be done using either an ‘extractive CEM,’ in
which case the sample gas is extracted from the emission stream and transported to a
WEST RAND DISTRICT MUNICIPALITY: EMISSION INVENTORY FOR 2011
Report No. uMN014-12 9
gas analyser for the measurement and recording of the contaminant concentration, or an
‘in-situ CEM,’ which measures and analyses the emissions directly in a stack. The main
benefits of an extractive CEM is that the instruments are not subject to heat, vibration,
and corrosive conditions. Maintenance is easier at ground level and analysers for
extractive CEMs are generally less expensive than those for in-situ systems. The
disadvantages are that sample lines can leak, freeze, or clog, and pollutants can be lost
to adsorption, scrubbing effects, or condensation. The main benefits of an in-situ CEMs
are minimisation of sample loss and elimination of the costly sampling and conditioning
system. However, maintenance and replacement inside the stack are more difficult and
calibration gas must be taken to the analyser location.
3.2.2 Source Testing
Source testing, also known as stack testing or stack sampling, is the regulatory standard
in South Africa. Undertaken by trained and experienced staff during normal operating
conditions, using accredited methods, and at appropriate intervals, source testing can
provide accurate annual emission estimates. It is required to determine compliance with
a country’s emission standards or permit discharge limits. They are also required for
certification of CEMs, and emission factors are often a collection of source tests at
various operating rates.
3.2.3 Mass Balance
A mass balance calculation applies the law of conservation that the mass of material
entering and leaving a process unit remains unchanged provided there is no
accumulation in the unit. The cost depends on the availability of accurate data and staff
time. The general equation for the mass (M) balance calculation is:
Min=Mout + Maccumulated/depleted
A typical refinery example is the combustion of fuel oil containing sulphur. If it is
assumed that all the sulphur in oxidised to SO2, then the following equation could be
used to estimate SO2 emissions:
SO2 Emissions (kg) = Consumption Rate of fuel (m3/day) x S Content (mg/m3) x (No. of
Days Units Operates) x (MW of SO2/S) x 1(kg)/106 (mg)
3.2.4 Emission Models and Factors
Emission models and factors are widely used to measure air emissions from refineries.
If default data are not applicable to local conditions or type of facility, emission models
require detailed input of data, such as meteorological data or equipment specifications.
WEST RAND DISTRICT MUNICIPALITY: EMISSION INVENTORY FOR 2011
Report No. uMN014-12 10
Examples of emission models used in the petroleum refining sector include the USEPA’s
TANKS and WATER9 models, both of which can be used to calculate VOCs and other air
contaminants. An emission factor is a simplified emission model that relates emissions
from a source to some activity associated with the source. A large number of published
emission factors are available for many processes, and they are generally the least
costly method and the easiest to apply. The USEPA provides ratings of reliability with its
AP-42 emission factors.

WEST RAND DISTRICT MUNICIPALITY: EMISSION INVENTORY FOR 2011
Report No. uMN014-12 11
4. CATEGORISATION OF SOURCES IN THE WRDM
The emission sources in the WRDM are grouped into three main emission types (Figure
4.1), based on their characteristics, namely, point, mobile and area sources. Each of the
main emission sources are further categorised into various key emission source
categories, based on the nature of the emission sources.
The point emission source category includes stationary emission sources identified
individually due to the quantity or nature of their atmospheric emissions. This category
is sub-divided into two key emission source categories:
Listed activities, i.e., large industries regulated by Section of the National
Environmental Management: Air Quality Act (Act 39 of 2004) (AQA)
Smaller industrial processes with boilers.
Figure 4.1: Categorisation of emission sources in the WRDM
The mobile emission source category includes emission sources along a defined line. It
includes all on-road mobile sources (these are vehicles operated on the streets and
highways, such as motorcycles and cars) and non-road mobile sources (consisting of all
vehicles and equipment not routinely operated on streets and highways, such as trains,
ships and aircrafts). Since there are no ports or harbours in the WRDM, the only mobile
source in the district municipality is road traffic or on-road motor vehicles.
WRDM Atmospheric Emission Inventory
Point Mobile Area
Listed Activities Motor Vehicles
Small Industrial Processes
Domestic Burning
Agricultural
Biomass Burning
Tailings Dams

WEST RAND DISTRICT MUNICIPALITY: EMISSION INVENTORY FOR 2011
Report No. uMN014-12 12
The area emission source category encompasses a large number of diverse emission
sources and it includes facilities whose individual emissions do not qualify them as point
sources (individually they emit smaller quantities of pollutants but, collectively, they can
release significant quantities of pollutants) and those emissions sources for which
datasets do not exist to locate the emissions any more specifically. This category is sub-
divided into six key emission source categories:
Domestic burning (for cooking, lighting and space heating)
Agricultural activities
Biomass burning
Tailings dams
Due to the absence of credible information on agricultural activities in the WRDM, this
source is excluded from the study. However, the prescribed burning of crops will be
covered as part of biomass burning.
A brief summary of the main pollutants emitted in the WRDM and their primary sources
are contained in Table 4.2.
Table 4.1: Pollutants and sources at petroleum refineries
Air Pollutant Main Sources
Sulphur dioxide Listed activities
Small industrial processes
Motor vehicles
Domestic burning
Biomass burning
Nitrogen oxides Listed activities
Small industrial processes
Motor vehicles
Domestic burning
Biomass burning
Particulate matter Listed activities
Small industrial processes
Motor vehicles
Domestic burning
Biomass burning
Tailings dams
Carbon monoxide Listed activities
Small industrial processes
Motor vehicles
Domestic burning
Biomass burning
Volatile organic
compounds
Listed activities
Small industrial processes

WEST RAND DISTRICT MUNICIPALITY: EMISSION INVENTORY FOR 2011
Report No. uMN014-12 13
Motor vehicles
Domestic burning
Biomass burning
There are many small industrial processes in the WRDM that are sources of criteria
pollutants and HAPs due to the use of boilers in those facilities. There are several listed
activities, but none of these could be classified as major industries in the league of
power stations, crude oil refineries and pulp and paper mills. These listed activities are
regulated and operate in accordance with conditions specified in their atmospheric
emission licenses (AELs).
Many listed activities and small industrial processes in the WRDM have boilers for the
production of steam, which is used for the purpose of heating. The boilers are primarily
small to medium in size with a heat input rating of less than 50 MW, the threshold for
classification as a listed activity. The combustion of fossil fuels such as coal, diesel, gas
and heavy fuel oil (HFO) in these boilers results in emissions of SO2, NOx, CO, PM10 and
VOC.
There are also several gold mines located across the WRDM, owned and operated by the
major gold mining conglomerates in South Africa. Some of these mines are classified as
listed activities while others are not. Those that are not are exclusively involved in the
extraction of precious metals, and not the refining of the metals. Refining entails
combustion, which is a key source of air pollutants, whereas extraction is not. Extraction
type mining processes are primarily a source of dust and PM10.
Interspersed across the WRDM are also numerous tailings dams, which are major
sources of dust and PM10. The burning of biomass such as agricultural crops and bushes
is a source of PM10 and VOCs. Motor vehicles burn petrol and diesel, which are classified
as fossil fuels due to their origin from crude oil. The burning of petrol and diesel in
motor vehicles produces emissions such as SO2, NOx, CO, PM10 and VOC.

WEST RAND DISTRICT MUNICIPALITY: EMISSION INVENTORY FOR 2011
Report No. uMN014-12 14
5. LISTED ACTIVITIES AND SMALL INDUSTRIAL PROCESSES
5.1 Description of Emissions
There are several listed activities and small industrial processes in the WRDM that
operate boilers, the most common type of combustion device in the municipality. The
primary purpose of these boilers is to produce steam for heating. S.21 of the National
Environmental Management: Air Quality Act, 2004 (AQA) defines listed activities and
legislates the need for these activities to operate in compliance with an AEL. None of the
boilers in the WRDM is classified as listed activities as their heat input ratings do not
exceed 50 MW (threshold for being classified as a listed activity). Many of these boilers
will however be classified as controlled emitters in the proposed regulation for boilers
with heat input ratings exceeding 10 MW but less than 50 MW.
Combustion devices are key emitters of criteria pollutants (SO2, NOx, CO and PM10) and
toxic air pollutants such as benzene, toluene and xylene. The greenhouse gases, CO2,
CH4, and nitrous oxide (N2O), are also produced during gas combustion.
Figure 5.1: Picture of an industrial boiler process
According to CONCAWE, combustion processes comprise boilers, furnaces, gas turbines,
gas engines, diesel engines, incinerators and flares. A large number of industrial
processes and facilities make use of industrial boilers for steam generation. Industrial
boilers use a range of fuels depending on boiler size and design characteristics, and on
the availability/proximity of fuel. In many cases, the fuel is a by-product or waste
product from other processes. The volume and nature of the emissions from combustion

WEST RAND DISTRICT MUNICIPALITY: EMISSION INVENTORY FOR 2011
Report No. uMN014-12 15
in boilers differs depending on the fuel composition, fuel consumption, boiler design and
operation, and the emission and pollution control devices in use.
When fuels burn, they produce various pollutants. The non-combustible portion of the
fuel remains as solid waste. The coarser, heavier waste is called “bottom ash” and is
extracted from the burner, and the lighter, finer portion is “fly ash” and is usually
emitted as particulates through the stack. Products of incomplete combustion include
CO, SOx, NOx, acid gases and VOCs. Metals and their compounds may also be entrained
(i.e. carried forward by a stream of gas or vapour of fine liquid droplets).
Process heaters such as furnaces are used extensively in refineries to supply the heat
necessary to increase the temperature of feed materials to reaction or distillation level.
The fuel burned may be refinery fuel gas, natural gas, residual fuel oils, or combinations,
depending on economics, operating conditions, and emission requirements. Process
heaters may also use CO-rich regenerator flue gas as fuel.
In the WRDM, the most commonly used fuels are coal, followed by gas, diesel and heavy
fuel oil (HFO). A total of 25 industries have been identified with either one or multiple
combustion units.
5.2 Methodology
5.2.1 Data Gathering
The steps in gathering information from industries are illustrated with the aid of the flow
charts below in Figures 4.1. The following points regarding the information gathering
process are highlighted:
Emissions inventory questionnaires serves as the principle information gathering
documents for industries.
Guideline documents were developed to assist industries in completing the
questionnaires.
The questionnaires were accompanied by the official letter from the WRDM.
The questionnaires, once completed by the industry, were signed off by the
authorised company representative to certify the correctness of the information
submitted.
Industries were allowed one month for completing the questionnaires.
Industries could use consultants to assist if in-house capabilities do not exist.
Questionnaires with missing data were referred back to the industries. Once the
questionnaires were adequately completed, the previous incomplete versions
were disposed of.
Data was subjected to quality control before final input into the database. This
involved tasks such as reality checks, sample calculations, etc.

WEST RAND DISTRICT MUNICIPALITY: EMISSION INVENTORY FOR 2011
Report No. uMN014-12 16
Figure 5.1: Flowchart showing steps in gathering information
The emissions inventory questionnaires were developed in Microsoft Word format to
allow for ease of completion by the industries. The questionnaires were received from
industries in hard copy or electronic formats. The hard copies were signed by the senior
company official. The hard copies were stored in a Master File and stores in a safe
location until hand-over to the WRDM. Only the most updated questionnaires or latest
revisions were kept on file. Revisions that were found to be incompletely filled were
disposed of once the corrected versions were received.
The electronic copies were saved in an emissions inventory folder called ‘WRDM
Emissions Inventory_2010’. Write-access to the folder was only assigned to emission
inventory team members.
Industries were identified by initially reviewing existing databases such as those
compiled by the team that developed the WRDM’s air quality management plan. This
was complemented by a drive-around with Musa Zwane of the WRDM to identify
industries that did not appear on the databases. The drive around was based on the
Determine list of industries to be
inventoried
Issue notification to industries on legal
requirement to complete
questionnaire
Follow - up with non - respondents
Contact facility to resolve outstanding
issues
Review and code facility
data
Problems?
Inventory database
uMoya-NILU
Yes
No
To Facility
Distribute questionnaires
To facility
From facility
Calculate emission rates using
emission factors
Receive completed questionnaires
Compare emission rates with
questionnaire
Problems?
Yes
No

WEST RAND DISTRICT MUNICIPALITY: EMISSION INVENTORY FOR 2011
Report No. uMN014-12 17
identification of industries with stacks, which pointed to the existence of combustion
devices such as boilers and furnaces on those premises.
Industries that experienced difficulties in completing the questionnaires were assisted in
two ways. Firstly, industries were invited to visit the offices of the WRDM, where
consultants from the emission inventory development team provided basic training in
completing the questionnaires. Secondly, personal visits were made by Benton Pillay
and Musa Zwane to companies to assist them in gathering the required data and
completing the questionnaires. These two measures yielded very positive results.
5.2.1 Estimation of Emissions
The methods used to estimate emissions from listed activities and small industrial
processes using emission factors are briefly described in this section. These methods
apply mostly to boilers. However, in some instances, emission rates were provided by
the industries. Several industries had also undertaken stack sampling, albeit with
service providers not competent to provide this service. The results of these stack
sampling campaigns have also been used to estimate emissions from the industries
concerned.
Sulphur dioxide:
The quantity of SO2 emitted from combustion processes depends on the mass fraction of
sulphur in the fuel burnt. According to CONCAWE, the following equation can be used to
estimate SO2 emissions from combustion processes (Concawe, 2009):
Emission rate (kg/year) = 2000 × A × MFS (1)
Where,
A = mass of fuel consumed (ton/year)
MFS = mass fraction of sulphur in fuel
This equation assumes complete combustion of sulphur to SO2. The composition of
sulphur in coal generally varies between 0.5 and 1.3%. A conservative estimate of 1%
(or mass fraction of 0.01) was however used in cases where the sulphur content was not
known.
The composition of sulphur in HFO is generally high at 3.5% or 0.035 (m/m). HFO is
therefore the fuel that produces the highest emissions of sulphur per unit mass of fuel
burnt when compared with coal, diesel and gas. Sasol gas has the lowest sulphur
content of 0.001875%, thus making it the cleanest burning fuel. This value was
estimated from information provided by Sasol that the sulphur content of its gas is < 15
mg/m3. Using the density of Sasol gas of 0.80 kg/m3, it was possible to estimate the
maximum sulphur content as a mass percentage of 0.001875%, which represents a

WEST RAND DISTRICT MUNICIPALITY: EMISSION INVENTORY FOR 2011
Report No. uMN014-12 18
conservative estimate. The composition of sulphur in diesel is 500 ppm (m/m), which is
commercially available from most suppliers, including the oil companies. In terms of
mass fraction, this equates to a value of 0.0005.
Nitrogen oxides:
Environment Australia has developed a set of emission estimation guidelines entitled
“Emission Estimation Technique Manual” for a range of industrial sector sources
(Environment Australia, 2008). The contents of these manuals are based on
internationally recognised sources such as the USEPA’s AP-42 and the European Union’s
CORINAIR. The major advantage of using the Environment Australia guidelines is the
reporting of numbers in metric units. For instance, NOx emission factors are reported in
units of kg/m3. The other important advantage is the availability of emission factors for
refinery fuel gas. Most other sources only provide emission factors for natural gas and
suggest that this be used as a surrogate for fuel gas.
According to Environment Australia, the following equation can be used to estimate
emissions from combustion processes using emission factors:
Emission rate (kg/year) = A × EF × CE (2)
Where,
A = mass of fuel consumed (ton/year)
EF = uncontrolled emission factor (kg pollutant/ton fuel burnt)
CE = control efficiency of the emission from the use of a control device
The NOx emission factor for the uncontrolled combustion of coal is 3.8 kg/ton. This
implies that for every ton of coal combusted, an average of 3.8 kg of NOx is emitted.
The use of an emission control device will result in a reduction of the emission factor,
based on the efficiency of the control device. For instance, a reduction efficiency of 50%
will result in the emission facto being reduced by half to 1.9 kg/ton. The boilers in use in
the WRDM are generally not equipped with emission control devices such as low NOx
burners for reduction of NOx emissions. The emission factor of 3.8 kg/ton will therefore
stay unchanged for this study.
The NOx emission factor for the uncontrolled combustion of natural gas (similar to Sasol
gas) from boilers of <30 MW is 2.16 kg/ton. The relevant emission factor for the
uncontrolled combustion of residual oil (similar to HFO) is 7.32 kg/ton and for diesel it is
2.72 kg/ton. As with SO2, emissions of NOx are the highest when residual oil is burnt.
Carbon monoxide:
Equation (2) above is also used for the estimation of CO emissions from combustion
processes. The CO emission factor for uncontrolled combustion of coal in boilers is 2.5
kg/ton. There are currently no emission control devices available for small boilers to

WEST RAND DISTRICT MUNICIPALITY: EMISSION INVENTORY FOR 2011
Report No. uMN014-12 19
reduce CO emissions. The emission factor of 2.5 kg/ton is therefore considered
acceptable.
For residual oil combustion, a CO emission factor 0.67 kg/ton is specified by
Environment Australia. This value is almost three times higher for gas combustion at
1.82 kg/ton. The CO emission factor drops to 0.68 kg/ton for diesel, a value similar to
that for residual oil.
Particulate matter:
As with all other pollutants, PM10 emissions vary with the type of fuel combusted and the
duty of the combustion device. An additional factor that has an influence on PM10
emissions is the ash content of the coal when combustion takes place in wall-fired,
tangentially-fired or wet bottom boilers or in cyclone furnaces. The greater the ash
content, the greater the emissions of PM10. For the conventional spreader stoker type
boiler, which is the type primarily used in the WRDM, ash content does not have a
significant influence on PM10 emissions.
The USEPA (2005) provides emission factors of 33 kg/ton for PM and 6.6 kg/ton for PM10
for coal combustion from boilers with a spreader stoker feed configuration. For natural
gas, Environment Australia provides an emission factor of 0.16 kg/ton for boilers rated <
30 MW. For residual oil, the emission factor for PM10 is even less at 0.0542 kg/ton, while
it is 0.14 kg/ton for diesel.
Volatile organic compounds (VOCs):
VOC emissions by definition include all emissions of volatile organics with the exception
of methane. These are the compounds that participate in the photochemical reactions
that lead to the generation of ground-level ozone. Methane is a greenhouse gas (GHG)
and is not involved in photochemical reactions. Emissions of VOCs from combustion
processes are estimated by using the emission factor method and equation (2), as
presented by Environment Australia. In line with the USEPA, Environment Australia
provides an emission factor of 0.03 kg/ton of VOC emissions from the uncontrolled
combustion of coal.
With respect to natural gas, the VOC emission factor increases to 0.119 kg/ton. For
residual oil and boilers rated < 30 MW, the VOC emission factor is low at 0.04 kg/ton,
and decreases further to 0.0272 kg/ton for diesel. VOC emission factors are generally
higher for fuels that are more volatile, such as natural gas.
5.3 Results of Emissions Estimations
The industry databases referenced in this study were found not to be comprehensive.
Several of the industries contained in the databases no longer existed and several others

WEST RAND DISTRICT MUNICIPALITY: EMISSION INVENTORY FOR 2011
Report No. uMN014-12 20
were not sources of atmospheric emissions. Many industries were also very small and
could not be considered as significant sources of air pollutants. During the drive-around
referred to in the methodology section, several industries were identified that were
inexplicably absent from the industry databases. The following is the final list of
industries included in the emission inventory:
Table 5.1: Industries in the WRDM
Local
Municipality Industry
Source of
Emissions
Listed
Activity
Mogale City
Goud Saad/Krugersdorp Mill Unconfirmed No
Krugersdorp Crematorium Yes Yes
Majesty oil Mills Yes No
Boltonia Meats Yes No
Pace Oils (The Old Oil Man) No No
Rely Metpro Yes No
Foodcorp Piemans Pantry Yes No
Mogale Alloys Yes Yes
African Brick Yes Yes
Castle Lead Works Yes Yes
Chemiphos SA Yes Yes
Exol Oil Refinery Yes No
Advance Seed No No
Auto Commodities Unconfirmed
Avima No No
Blancom International Products No No
William Tell Yes Yes
Clariant Southern Africa No No
Sima Yes No
Fima Films SA No No
The Energy Company No No
Duys Roto Moulders No No
Ceramic Industries Limited Yes Yes
AARD Mining No No
Perlite Mining Unconfirmed
SAB Yes No
Lafarge Ready Mix Yes Yes
Yusuf Dadoo Hospital Yes No
Plascon Yes Yes
Cam Chem Unconfirmed
Pace Oils Yes No
Drift Supersand No No
Janho Quarries and Crushing Yes No
Executive Bricks and Paving Yes No
Krugersdorp Abattoir Yes No
Sasko Mills Yes No
Chemico SA Unconfirmed
Leratong Hospital Yes No
Geratech Zirconium Beneficiation Unconfirmed
Nimag Yes No
Transnet Pipelines Yes No
Sachi Chemicals No No

WEST RAND DISTRICT MUNICIPALITY: EMISSION INVENTORY FOR 2011
Report No. uMN014-12 21
Transvaal Rubber Yes No
Isover No No
Galvaglo Yes No
Cobra Watertech Yes No
Bull Brand Foods Yes No
Randfontein
Aranda Textile Mills Yes No
B&S Steel Fabrication Non-existent
Blitz Engineering Non-existent
Wilma Continental Oil Yes No
Cosmos Dairy Yes No
Gemtex Textile Mill Yes No
Meadow (Astral Foods) Yes No
Foodcorp Grocery Division Yes No
Randfontein Hospital No No
Supreme Petfood/ V-Oils Yes No
Tiger Brands Yes No
Ultimate Feeds Unconfirmed No
Vesuvius Rand Steel Non-existent No
Gold One No No
Armco Superlite Yes Yes
SA Oil Yes No
Transnet Pipelines Yes Yes
Cremos Crematorium Yes
Westonaria
BASF Construction Chemicals Yes No
Goldfields South Deep Gold Mine Yes Yes
Goldfields Kloof Gold Mine Yes Yes
Goldfields Driefontein Mine Yes Yes
West End Clay Brick Yes Yes
Merafong
Corobrick Driefontein Yes Yes
Carletonville Transport and Plant Hire No No
Fochville Hospital No No
Western Deep Levels Hospital No No
Leslie Williams Private Hospital (on
property of Goldfields)
No No
Khutsong Medical Centre No No
Fochville Abattoir Non-existent
Durban Roodepoort Deep Gold Mine
(Blyvoor)
Unconfirmed Yes
Harmony Elandsrand Gold Mine Unconfirmed Yes
AngloGold Ashanti Mponeng Mine Unconfirmed Yes
AngloGold Ashanti Tau Tona Mine Cannot locate Yes
AngoGold Ashanti Savuka Mine Unconfirmed Yes
DRD Gold (Blyvooruitchzit Mine) Cannot locate Yes
A total of 37 emission inventory questionnaires were submitted to industries in Mogale
City. Of these, 15 industries returned their questionnaires either completely or partially
completed. A further 12 were determined not to be a source of emissions during the

WEST RAND DISTRICT MUNICIPALITY: EMISSION INVENTORY FOR 2011
Report No. uMN014-12 22
course of telephonic discussions with their representatives (see Table 5.1). The
following 4 industries in Mogale City that did not submit questionnaires were contacted
telephonically to source fuel data (type, consumption rate, sulphur content, etc.) needed
to estimate their pollutant emission rates:
Foodcorp Piemans Pantry
SIMA
Yusuf Dadoo Hospital
Leratong Hospital
The following industries expressed their desire not to participate in the study with
responses that were generally rude and uncooperative:
Goud Saad/Krugersdorp Mill
Cam Chem
The other industries in Mogale City such as Boltonia Meats, Rely Metpro, Perlite Mining,
Lafarge Cement, Krugersdorp Abbatoir and John Turner and Sons have generally been
evasive and uncooperative.
Exol Oil Refinery would like to be included in the study, but the company was in the
process of conducting an air quality study and wished to submit information at a later
stage.
Of the 19 industries listed in Randfontein, a total of 9 returned their questionnaires.
Personal visits had to be paid to several of these industries after they initially failed to
submit their questionnaires on time. During these visits, the emission inventory
questionnaires were completed. A total of 2 industries were confirmed as not being
sources of emissions, a further 2 remain unconfirmed (due to a lack of response) and a
further 3 were found to no longer exist in the Randfontein Municipality. Gemtex Textile
Mill did not submit their questionnaire, but the company was contacted telephonically to
obtain their boiler fuel data. Aranda Textile Mill remains evasive and difficult to source
information from.
A total of 5 industries were contacted in Westonaria. BASF Construction Chemicals and
West End Bricks submitted their emission inventory questionnaires, whereas the 3
Goldfields Mines provided copies of their draft AEL application forms. Most of the
information required to estimate their emission was contained in the AEL application
forms.
Industries in the Merafong Municipality, of which a total of 13 were identified, generally
proved to be the most uncooperative. Emission inventory questionnaires were issued to
the following industries:
Corobrik
Leslie Williams Private Hospital
Harmony Elandsrand Gold Mine

WEST RAND DISTRICT MUNICIPALITY: EMISSION INVENTORY FOR 2011
Report No. uMN014-12 23
AngloGold Ashanti Mponeng Mine
AngoGold Ashanti Savuka Mine
A total of 4 industries were found not to be a source of emissions through telephonic
discussions and 2 could not be located. From Table 5.1, it is clear that the majority of
industries are located in Mogale City, followed by Randfontein, Merafong and Westonaria.
The largest type of industries are the precious metal mines, but smelting operations are
absent from the majority of mines in the WRDM. These mines primarily extract ore,
which is transported to other areas where ore beneficiation in the form of smelting takes
place. Smelting operations result in emissions of combustion pollutants such as SO2,
NOx, CO and PM10. Since smelting operations are absent, the primary pollutant produced
is dust from ore extraction. The estimation of these dust emissions, primarily from the
handling and storage of ore, is a complex task that mines should estimate with the aid of
air quality consultants. However, since the extraction takes place underground, dust
emissions are not expected to be significant. Dust is classified as a nuisance pollutant
that has no health impacts but affect one’s quality of life. Dust is the cause of many
complaints and results in the soiling, contamination, structural corrosion and damage to
precision equipment, machinery and computers. Although highly dependent upon local
sources, dust typically comprises of windblown dust, fine sand, mist, fly ash, pulverised
coal and ore. Transport distances range typically from <1 m to <2 km. South Africa
currently has dust fallout standards in place. The Department of Environmental Affairs
(DEA) has published limit values (SANS 1929) for dust deposition and these are used for
assessment purposes. The 1 200 mg/m2/day threshold is taken as an action level for
remedial action.
For the reasons described here, there was not a huge focus on dust emissions from
mining operations. The only mining group that disclosed the existence of smelting
operations was Goldfields at its South Deep, Kloof and Driefontein gold mines. However,
the emissions data provided by Goldfields is not complete and lacks the detail required
for the compilation of a comprehensive emission inventory. The data provided by
Goldfields was nevertheless used in this study, but all the mines should be encouraged
to undertake more detailed emission inventories of their processes when the WRDM
emission inventory is updated in the future.

WEST RAND DISTRICT MUNICIPALITY: EMISSION INVENTORY FOR 2011
Report No. uMN014-12 24
Figure 5.1: Gold Fields South Deep twin shaft vent shaft
An important aspect in the reduction of atmospheric emissions is the phasing out of the
so-called “dirty fuels”. These are generally the fuels with high sulphur contents that
when combusted result in high emissions of SO2 and other pollutants. Coal and HFO are
generally classified as dirty fuels and should be discouraged from use by industries.
These are unfortunately also the most abundant and cheapest fuels. The use of clean
fuels such as gas and LPG should be promoted. The following table provides the
consumption of fuels by those industries that did submit the data.
Table 5.2: Fuels and quantities consumed by industries in the WRDM
Local
Municipality Industry
Fuel Consumption Rate
Coal
(ton/year)
Fuel Oil
(ton/year)
Gas
(m3/year)
Diesel
(ton/year)
Mogale City
Majesty Oil Mills 4 800
Transvaal Rubber 16
South African Breweries 9 855
Sphinx Acrylic Bathroom
Ware
2 839
Mogale Alloys 88 413
Plascon Luipaardsvlei 128 228
Independent
Crematoriums of SA
13 941
Chemiphos 115
Castle Lead Works 320 033
Cobra Watertech 360 000
William Tell Industries 562
Galvaglo Not reported
BullBrand Foods 4 800
Foodcorp Piemans Pantry 739
SIMA 2 124 521
Yusuf Dadoo Hospital 2 520

WEST RAND DISTRICT MUNICIPALITY: EMISSION INVENTORY FOR 2011
Report No. uMN014-12 25
Leratong Hospital 1 800
Randfontein
Meadow Feeds 1 932 70
Wilma Continental Oils 12 000
Cosmos Dairy 18
Foodcorp Grocery Division 14 400
Westonaria
BASF Construction
Chemicals
Goldfields South Deep
Gold Mine
Goldfields Kloof Gold Mine
Goldfields Driefontein Mine
West End Clay Brick 11 424
Total 141 944 1 486 2 949 562 34
From the above table, coal and gas appear to be the most widely used fuels. A total of
141 944 tons of coal a year are burnt by industries in the WRDM. Of this total, 62% is
consumed by Mogale Alloys, by far the single largest consumer of coal in the district
municipality. Other large coal consumers include the Foodcorp Grocery Division, West
End Clay Brick, Wilma Continental Oils and South African Breweries (SAB).
There are essentially two types of oils, namely, HFO and LFO (light fuel oil). HFO is
generally associated with high levels of sulphur and is consequently a dirty fuel. A few
industries use LFO and HFO, either as their primary fuel or as a backup to coal. The
latter scenario exists in case coal-fired boilers fail or are decommissioned for statutory
maintenance reasons. The largest consumer of oil is the Foodcorp Piemans Pantry,
followed by William Tell Industries. As indicated previously, HFO is a dirty fuel and its
use should therefore be discouraged in the WRDM.
The use of gas, notably Sasol gas, is relatively prevalent in the WRDM. SIMA, a
company that manufacturers steam for commercial purposes, is the largest consumer of
gas at 2 124 521 Nm3/year. Other large users of gas include Cobra Watertech and
Castle Lead Works. In contrast to HFO, gas is recognised as the cleanest fuel.
The following table presents the emission rates estimated from the various industries
that submitted information in the form of questionnaires, AEL application forms, results
of stack sampling or via telephonic interviews.
The total SO2 emissions from all industries in the WRDM are estimated to be 1 796 219
kg/year or 4.92 ton/day. This figure is relatively small if compared to the SO2 emissions
from a standard crude oil refinery in South Africa, which can vary from 6 to 18 ton/day.
SO2 emission rates from local power stations are even greater at between 200 and 750
ton/day of SO2.

WEST RAND DISTRICT MUNICIPALITY: EMISSION INVENTORY FOR 2011
Report No. uMN014-12 26
Table 4.2: Emission rates from industries in WRDM, kg/year
Local
Municipality Industry
Emission Rate (kg/year)
SO2 NOx CO PM10 VOC Benzene Lead
Mogale City
Majesty Oil Mills 48 000 18 240 12 000 31 680 144
Transvaal Rubber 16 43 11 2
South African Breweries 70 956 37 449 24 638 65 043 296
Sphinx Acrylic Bathroom Ware 13 4 229
Mogale Alloys 828 560 777 270 139 979 420 622 570 2 652 2 140
Plascon Luipaardsvlei 3 051 937 172 11 855
Independent Crematoriums of SA 1 291 733 335 35 2 44
The Old Oil Man
Automotive Gasoil Limited
Chemiphos 289 34 21 231 5
Geratech
Castle Lead Works 9 313 5 298 37 4 38 8 847
Cobra Watertech 1
William Tell Industries 39 312 4 111 376 30 22
Nimag 15 100
Galvaglo 4 012
BullBrand Foods 48 000 18 240 12 000 31 680 144
Foodcorp Piemans Pantry 259 5 411 495 40 30
SIMA 25 9 518 2 855 258 253
Yusuf Dadoo Hospital 50 400 9 576 6 300 16 632 76
Leratong Hospital 36 000 6 840 4 500 11 880 54
Randfontein
Meadow Feeds 24 224 7 854 4 877 12 755 61
Wilma Continental Oils 120 000 45 600 30 000 79 200 360
Cosmos Dairy 18 49 12 3
Foodcorp Grocery Division 288 000 54 720 36 000 95 040 432
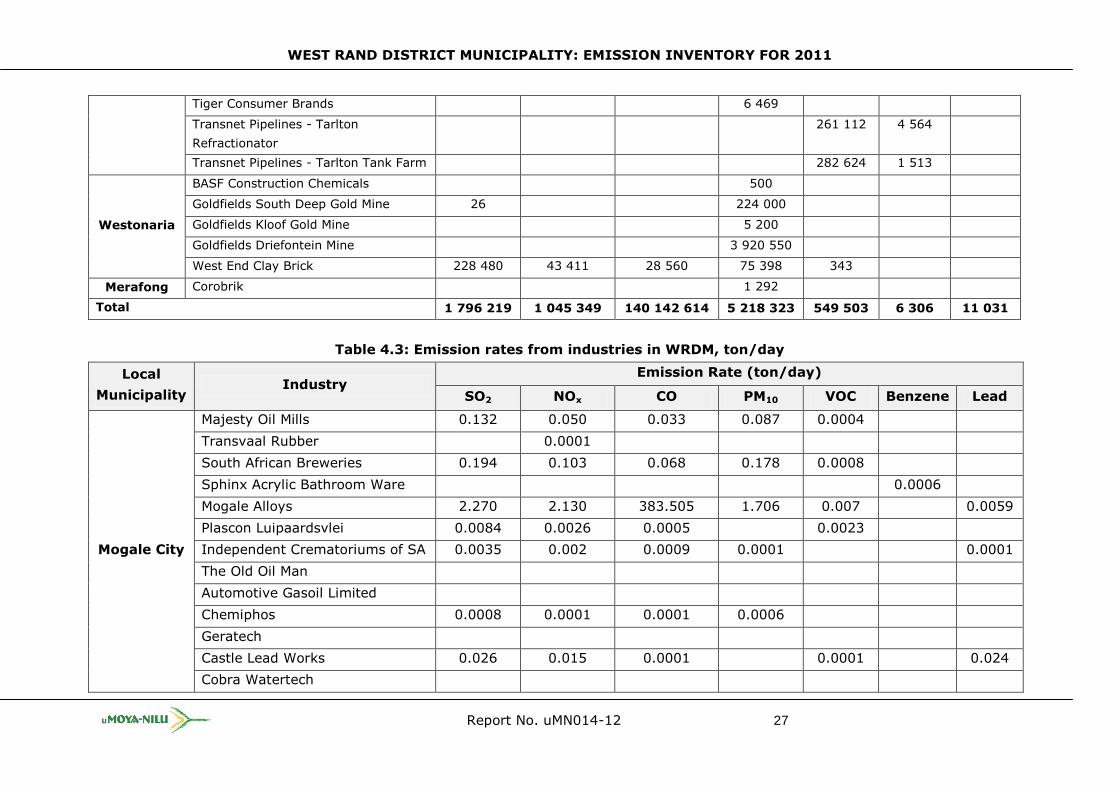
WEST RAND DISTRICT MUNICIPALITY: EMISSION INVENTORY FOR 2011
Report No. uMN014-12 27
Tiger Consumer Brands 6 469
Transnet Pipelines - Tarlton
Refractionator
261 112 4 564
Transnet Pipelines - Tarlton Tank Farm 282 624 1 513
Westonaria
BASF Construction Chemicals 500
Goldfields South Deep Gold Mine 26 224 000
Goldfields Kloof Gold Mine 5 200
Goldfields Driefontein Mine 3 920 550
West End Clay Brick 228 480 43 411 28 560 75 398 343
Merafong Corobrik 1 292
Total 1 796 219 1 045 349 140 142 614 5 218 323 549 503 6 306 11 031
Table 4.3: Emission rates from industries in WRDM, ton/day
Local
Municipality Industry
Emission Rate (ton/day)
SO2 NOx CO PM10 VOC Benzene Lead
Mogale City
Majesty Oil Mills 0.132 0.050 0.033 0.087 0.0004
Transvaal Rubber 0.0001
South African Breweries 0.194 0.103 0.068 0.178 0.0008
Sphinx Acrylic Bathroom Ware 0.0006
Mogale Alloys 2.270 2.130 383.505 1.706 0.007 0.0059
Plascon Luipaardsvlei 0.0084 0.0026 0.0005 0.0023
Independent Crematoriums of SA 0.0035 0.002 0.0009 0.0001 0.0001
The Old Oil Man
Automotive Gasoil Limited
Chemiphos 0.0008 0.0001 0.0001 0.0006
Geratech
Castle Lead Works 0.026 0.015 0.0001 0.0001 0.024
Cobra Watertech

WEST RAND DISTRICT MUNICIPALITY: EMISSION INVENTORY FOR 2011
Report No. uMN014-12 28
William Tell Industries 0.108 0.0113 0.001 0.0001
Nimag 0.041
Galvaglo 0.011
BullBrand Foods 0.132 0.050 0.033 0.087 0.0004
Foodcorp Piemans Pantry 0.0007 0.0148 0.0014 0.0001 0.0001
SIMA 0.0001 0.0261 0.0078 0.0007 0.0007
Yusuf Dadoo Hospital 0.138 0.026 0.017 0.046 0.0002
Leratong Hospital 0.099 0.019 0.012 0.033 0.0001
Randfontein
Meadow Feeds 0.066 0.022 0.013 0.035 0.0002
Wilma Continental Oils 0.329 0.125 0.082 0.217 0.001
Cosmos Dairy 0.0001
Foodcorp Grocery Division 0.789 0.150 0.099 0.2604 0.0012
Tiger Consumer Brands 0.018
Transnet Pipelines - Tarlton
Refractionator
0.715 0.013
Transnet Pipelines - Tarlton Tank
Farm
0.774 0.004
Westonaria
BASF Construction Chemicals 0.0014
Goldfields South Deep Gold Mine 0.0001 0.614
Goldfields Kloof Gold Mine 0.014
Goldfields Driefontein Mine 10.741
West End Clay Brick 0.626 0.119 0.078 0.207 0.0009
Merafong Corobrik 0.004
Total 4.9211 2.8640 383.9524 14.2968 1.5055 0.0173 0.0302

WEST RAND DISTRICT MUNICIPALITY: EMISSION INVENTORY FOR 2011
Report No. uMN014-12 29
Table 4.5: Breakdown of emission rates per local municipality in WRDM, kg/year
Local
Municipality
Emission Rate (kg/year)
SO2 NOx CO PM10 VOC Benzene Lead
Mogale City 1 135 471 893 714 140 043 164 799 208 4 571 229 11 031
Randfontein 432 242 108 223 70 889 193 467 544 589 6 077 0
Westonaria 228 506 43 411 28 560 4 225 648 343 0 0
Merafong 0 0 0 1 292 0 0 0
Total 1 796 219 1 045 349 140 142 614 5 218 323 549 503 6 306 11 031
Table 4.6: Breakdown of emission rates per local municipality in WRDM, ton/day
Local
Municipality
Emission Rate (ton/day)
SO2 NOx CO PM10 VOC Benzene Lead
Mogale City 3.111 2.449 383.680 2.190 0.013 0.001 0.030
Randfontein 1.184 0.297 0.194 0.530 1.492 0.017 0
Westonaria 0.626 0.119 0.078 11.577 0.001 0 0
Merafong 0 0 0 0.004 0 0 0
Total 4.921 2.864 383.952 14.297 1.506 0.017 0.030

WEST RAND DISTRICT MUNICIPALITY: EMISSION INVENTORY FOR 2011
Report No. uMN014-12 30
The impact of these SO2 emissions on ambient air quality should be determined through
air quality monitoring or atmospheric dispersion modelling. However, based on emission
rates, the initial expectation is that SO2 ambient air quality levels should be low and
below health-based air quality guidelines and standards. The largest source of SO2
emissions is Mogale Alloys at 2.27 ton/day. Its contribution to total SO2 emissions
exceeds 46%, implying that significant reductions in industrial SO2 emissions in the
WRDM could be achieved by focussing reduction efforts on Mogale Alloys. The reason for
Mogale Alloys’ high SO2 emissions is directly related to its high consumption of coal. The
other industries that have recorded notable SO2 emissions are the Foodcorp Grocery
Division and West End Clay Brick. Although the Foodcorp Pieman’s Pantry is a large
consumer of oil, it is a clean oil called low burning fuel (LBF) with a sulphur content of
0.005%, compared to the typical 3% of HFO.
Emissions of NOx from industries in the WRDM are also low at 2.86 ton/day. This is in
line with international trends which suggest that other sources such as motor vehicles
are more prominent sources of NOx emissions than industries.
The breakdowns of emission rates for each local municipality reveal that the largest
quantity of atmospheric emissions from industries is produced in Mogale City. This is
followed by Randfontein, Westonaria and Merafong. Of the total of 4.921 ton/day of SO2
emitted from industries in the WRDM, 3.111 ton/day are emitted from industries in
Mogale City and 1.184 ton/day are emitted from industries in Randfontein. The total SO2
emissions from industries in these two local municipalities is 4.295 ton/day. Emissions
from the other two local municipalities, namely, Westonaria and Merafong are there
insignificant.
However, it is interesting to note that the highest emissions of PM10 are from
Westonaria. This is primarily due to the numerous mining operations taking place there.
There are also many mines located in Merafong, but as mentioned earlier, the industries
in Merafong were not very forthcoming in providing emissions information, so it was not
possible to estimate SO2 emissions from mines in Merafong.
WEST RAND DISTRICT MUNICIPALITY: EMISSION INVENTORY FOR 2011
Report No. uMN014-12 31
6. MOTOR VEHICLES
6.1 Description of Emissions
A motor vehicle is defined as an on-road vehicle that derives its power for propulsion
from the combustion of fossil fuel (NPI, 2000). The most common types of motor
vehicles that operate in the WRDM are passenger cars, vans (light-duty vehicles), buses
and trucks (heavy-duty vehicles). The energy to propel vehicles comes from burning
fuel in an engine. Cars are fuelled by both diesel and petrol, whereas trucks are only
fuelled by diesel. Pollution from vehicles arises from the by-products of the combustion
process (emitted via the exhaust system) and from evaporation of the fuel itself from
the fuel tank. Particulate matter is also emitted from brakes and tyre wear.
Various types of pollutants are produced in the combustion process. A range of VOCs
are produced because the fuel is not completely burnt (oxidised) during combustion.
NOx results from the oxidation of nitrogen at high temperature and pressure in the
combustion chamber. CO is generated when carbon in the fuel is partially oxidised
rather than fully oxidised to CO2. SO2 and lead are derived from the sulphur and lead in
fuels. Particulate matter is produced from the incomplete combustion of fuels, additives
in fuels and lubricants, and worn material that accumulates in the engine lubricant.
These additives and worn materials also contain trace amounts of various metals and
their compounds which may be released as exhaust emissions.
Evaporative emissions come mainly from petrol (diesel fuel has a much lower vapour
pressure) and consist of VOCs and small amounts of lead. These emissions may occur in
several ways:
Diurnal Losses: As the ambient air temperature rises during the day, the
temperature of fuel in the vehicle’s fuel system increases and increased vapour is
produced.
Running Losses: Heat from the engine and exhaust system can vaporise gasoline
when the car is running.
Hot Soak Losses: Because the engine and exhaust system remain hot for a period
of time after the engine is turned off, gasoline evaporation continues when a car
is parked.
Resting Losses: Vapour may be lost from the fuel system or the evaporative
emission control system as a result of permeation through rubber components
and other leaks.
Another type of emission that arises from the use of motor vehicles is dust emissions
from roads. As the vehicle’s tyres turn, particles on the road are crushed and re-
suspended into the atmosphere.
Motor vehicles continue to play a dominant role in causing air pollution. In the European
Union as a whole, on and off road vehicles are the largest sources of CO, NOx and

WEST RAND DISTRICT MUNICIPALITY: EMISSION INVENTORY FOR 2011
Report No. uMN014-12 32
NMVOC emissions (Andrias, et al, 1994). Forecasts indicated that vehicles would remain
a major emissions source there until the various Euro standards have been
implemented. In densely populated urban areas, vehicles can be a major source of
exposure to PM as well. Road vehicles account for a majority of NOx and black smoke
emissions in many major cities in the world.
Motor vehicles are also major emissions sources in the United States (US) and Japan. In
the densely populated cities of the US, where the air pollution problem is especially
severe, the USEAP has projected that highway vehicles will account for approximately
38% of the total NOx inventory and 22% of the total VOC inventory in 2005, in spite of
the introduction of tighter motor vehicle standards in the 1990 Clean Air Act. It is
increasingly clear that motor vehicles are also the major source of pollution problems in
the developing world.
6.2 Methodology
Motor vehicle emissions are generally estimated by using a combination of the top-down
(high-level) and bottom-up (detailed) approaches. The top-down approach essentially
entails the use of emission factors with fuels sales data on a broad spatial basis, say, a
municipality. Data requirements and resources to estimate emissions based on the top-
down approach are not significant. The bottom-up approach, on the other hand, entails
the use of emission factors with detailed activity data such vehicle counts, road data,
vehicle parc data, and fuel consumption data. The bottom-up approach provides results
that are more accurate than the top-down approach, but requires substantially greater
resources. The data requirements for the bottom-down approach are substantial and
therefore more onerous. The preferred approach in estimating motor vehicle emissions
is therefore a combination of both the top-down and bottom-up approaches.
Top-down approach: The key types of data required for this approach are fuel sales data
and emission factors. The European Environmental Agency (EEA) publishes a guideline
book with a comprehensive list of methodologies for estimating atmospheric emissions
from a variety of sources (EEA, 2010). One of the chapters deals specifically with
exhaust emissions from road transport. The EEA identifies the following key categories
of motor vehicles:
Passenger cars
Light-duty trucks (<3.5 ton)
Heavy-duty vehicles (>3.5 ton) including buses
Motorcycles
The EEA also identifies a range of pollutants emitted from motor vehicles including the
following:
Ozone precursors (CO, NOx, VOCs)
Greenhouse gases (CO2, CH4, N2O)
Acidifying substances (NH3, NOx, SO2)

WEST RAND DISTRICT MUNICIPALITY: EMISSION INVENTORY FOR 2011
Report No. uMN014-12 33
Particulate matter mass (PM)
Carcinogenic species (PAHs and POPs)
Toxic substances (dioxins and furans)
Heavy metals (e.g. lead)
However, due to the scope of this study, the only pollutants that will be considered are
SO2, NOx, CO, PM10, NMVOC, benzene and lead. The EEA proposes the use of the
following equation to estimate these emissions (with the exception of SO2) based on a
top-down or Tier 1 approach:
Ei = Σj (Σm (FCj,m × EFi,j,m)) (1)
Where,
Ei = emission of pollutant i (g),
FCj,m = fuel consumption of vehicle category j using fuel m (kg),
EFi,j,m = fuel consumption-specific emission factor of pollutant i for vehicle
category j and fuel m (g/kg).
Since emissions of SO2 are dependent on the sulphur content of the fuel burnt, the EEA
proposes the following equation to estimate SO2 emissions:
ESO2,m = 2 x kS,m x FCm (2)
Where,
ESO2,m = emissions of SO2 per fuel m (g),
kS,m = weight related sulphur content in fuel of type m (g/g fuel),
FCm = fuel consumption of fuel m (g).
The emission factors, presented in the table below, that are to be used in equation (1),
have been developed by the EEA. The emission factors apply to the two primary fuels
used in motor vehicles, namely, gasoline and diesel.
Table 6.1: Emission factors to estimate motor vehicle emissions
Category Fuel Emission Factor (g/kg Fuel)
NOx CO PM10 VOC Lead
Passenger cars Gasoline 14.5 132 0.037 14 0.000017
Diesel 11 4.7 1.7 1.1 0.0000325
Light-duty trucks Gasoline 24 155 0.03 14 0.000017
Diesel 15 11 2.8 1.75 0.0000325
Heavy-duty vehicles Diesel 37 8 1.2 1.6 0.0000325
The emission factors suggest that passenger car engines are more efficient at burning
fuel with respect to both gasoline and diesel when compared to light-duty trucks and
heavy-duty vehicles. For instance, burning a kg of gasoline in a passenger car will only

WEST RAND DISTRICT MUNICIPALITY: EMISSION INVENTORY FOR 2011
Report No. uMN014-12 34
result in 14.5 g of NOx emissions, whereas burning a similar quantity of gasoline in a
light-duty truck will emit a larger 24 g of NOx.
The use of these emission factors requires data on quantity of fuel consumed. The
organisation that historically collated fuel sales data for South Africa was the South
African Petroleum Industries Association (SAPIA). However, this role was recently
transferred to the Department of Energy (DoE), which was approached to provide fuel
sales data for the WRDM. Data is reported by the DoE for the major motor vehicle fuels
used in South Africa, namely:
Unleaded petrol of 95 octane, ULP95,
Unleaded petrol of 93 octane ULP93,
Lead replacement petrol of 95 octane (LRP95),
Lead replacement petrol of 93 octane (LRP93),
Diesel of 50 ppm sulphur (diesel50) and
Diesel of 500 ppm (diesel500).
The most recent year of data that the DoE has available for release into the public
domain is 2009. However, data is not available for Merafong.
Fuels sales data, as provided by the DoE, are presented below in Table 6.2. It is
important to note that fuels sales data does not necessarily translate into fuel
consumption data, the data actually required to estimate atmospheric emissions by
using equations (1) and (2) above. As a point in illustration, motor vehicle owners may
fill up their tanks in Randfontein, but drive directly to the City of Joburg, where the
majority of the fuel may be burnt and emission produced. The reverse may also apply,
where fuel is purchased in the City of Joburg, but burnt in Ranfontein. This creates an
off-setting effect. With this as the backdrop, the assumption therefore made in this
study, as with other similar studies, is that fuel sold in an area is roughly consumed in
that area. This then implies that the fuel sales data of Table 6.2 is assumed to be fuel
consumed in the WRDM.
Table 6.2: Fuel sales data for 2009
Fuel Name Local Municipality Consumption
(Litres/Year)
Diesel50 Mogale City 7 591 333
Diesel50 Randfontein 643 513
Diesel50 Westonaria 143 524
Diesel500 Mogale City 59 429 601
Diesel500 Randfontein 18 178 579
Diesel500 Westonaria 16 802 458
LRP93 Mogale City 29 965 859
LRP93 Randfontein 15 095 843
LRP93 Westonaria 15 429 549
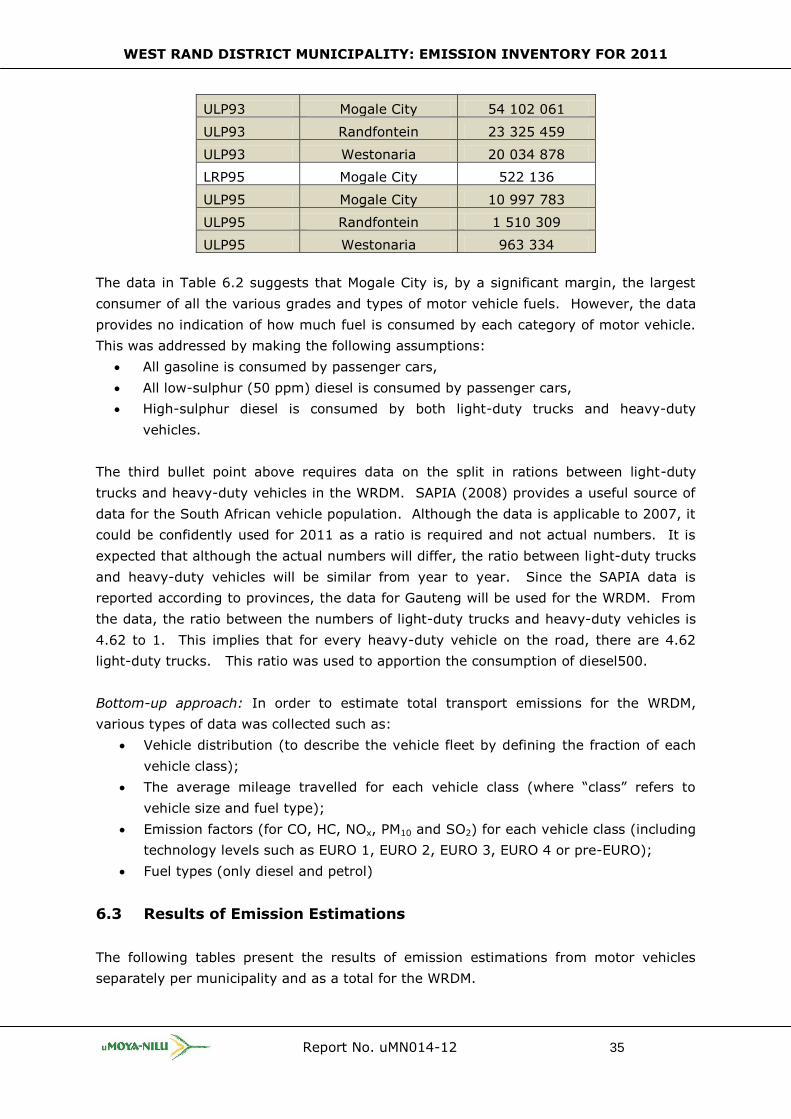
WEST RAND DISTRICT MUNICIPALITY: EMISSION INVENTORY FOR 2011
Report No. uMN014-12 35
ULP93 Mogale City 54 102 061
ULP93 Randfontein 23 325 459
ULP93 Westonaria 20 034 878
LRP95 Mogale City 522 136
ULP95 Mogale City 10 997 783
ULP95 Randfontein 1 510 309
ULP95 Westonaria 963 334
The data in Table 6.2 suggests that Mogale City is, by a significant margin, the largest
consumer of all the various grades and types of motor vehicle fuels. However, the data
provides no indication of how much fuel is consumed by each category of motor vehicle.
This was addressed by making the following assumptions:
All gasoline is consumed by passenger cars,
All low-sulphur (50 ppm) diesel is consumed by passenger cars,
High-sulphur diesel is consumed by both light-duty trucks and heavy-duty
vehicles.
The third bullet point above requires data on the split in rations between light-duty
trucks and heavy-duty vehicles in the WRDM. SAPIA (2008) provides a useful source of
data for the South African vehicle population. Although the data is applicable to 2007, it
could be confidently used for 2011 as a ratio is required and not actual numbers. It is
expected that although the actual numbers will differ, the ratio between light-duty trucks
and heavy-duty vehicles will be similar from year to year. Since the SAPIA data is
reported according to provinces, the data for Gauteng will be used for the WRDM. From
the data, the ratio between the numbers of light-duty trucks and heavy-duty vehicles is
4.62 to 1. This implies that for every heavy-duty vehicle on the road, there are 4.62
light-duty trucks. This ratio was used to apportion the consumption of diesel500.
Bottom-up approach: In order to estimate total transport emissions for the WRDM,
various types of data was collected such as:
Vehicle distribution (to describe the vehicle fleet by defining the fraction of each
vehicle class);
The average mileage travelled for each vehicle class (where “class” refers to
vehicle size and fuel type);
Emission factors (for CO, HC, NOx, PM10 and SO2) for each vehicle class (including
technology levels such as EURO 1, EURO 2, EURO 3, EURO 4 or pre-EURO);
Fuel types (only diesel and petrol)
6.3 Results of Emission Estimations
The following tables present the results of emission estimations from motor vehicles
separately per municipality and as a total for the WRDM.

WEST RAND DISTRICT MUNICIPALITY: EMISSION INVENTORY FOR 2011
Report No. uMN014-12 36
Table 6.3: Breakdown of motor vehicle emission rates from Mogale City
Category Fuel Consumption
(kg/year)
Emission Rates (kg/year) Emission Rates (ton/day)
SO2 NOx CO PM10 VOC Lead SO2 NOx CO PM10 VOC Lead
Passenger cars
Gasoline 71 690 879 7169 1 039 518 9 463 196 2 653 1 003 672 1 0.020 2.848 25.927 0.007 2.750 0.000
Diesel50 5 693 500 569 62 628 26 759 9 679 6 263 0 0.002 0.172 0.073 0.027 0.017 0.000
Diesel500 0 0 0 0 0 0 0.000 0.000 0.000 0.000 0.000 0.000
Light-duty trucks
Gasoline 0 0 0 0 0 0 0.000 0.000 0.000 0.000 0.000 0.000
Diesel50 0 0 0 0 0 0 0.000 0.000 0.000 0.000 0.000 0.000
Diesel500 36 641 466 36641 549 622 403 056 102 596 64 123 1 0.100 1.506 1.104 0.281 0.176 0.000
Heavy-duty vehicles
Diesel50 0 0 0 0 0 0 0.000 0.000 0.000 0.000 0.000 0.000
Diesel500 7 930 735 7931 293 437 63 446 9 517 12 689 0 0.022 0.804 0.174 0.026 0.035 0.000
Total 52 311 1 945 205 9 956 458 124 444 1 086 747 3 0.143 5.329 27.278 0.341 2.977 0.000
Table 6.4: Breakdown of motor vehicle emission rates from Randfontein
Category Fuel Consumption
(kg/year)
Emission Rates (kg/year) Emission Rates (ton/day)
SO2 NOx CO PM10 VOC Lead SO2 NOx CO PM10 VOC Lead
Passenger cars
Gasoline 29 948 708 2995 434 256 3 953 229 1 108 419 282 1 0.008 1.190 10.831 0.003 1.149 0.000
Diesel50 482 635 48 5 309 2 268 820 531 0 0.000 0.015 0.006 0.002 0.001 0.000
Diesel500 0 0 0 0 0 0 0.000 0.000 0.000 0.000 0.000 0.000
Light-duty trucks
Gasoline 0 0 0 0 0 0 0.000 0.000 0.000 0.000 0.000 0.000
Diesel50 0 0 0 0 0 0 0.000 0.000 0.000 0.000 0.000 0.000
Diesel500 11 208 047 11208 168 121 123 289 31 383 19 614 0 0.031 0.461 0.338 0.086 0.054 0.000
Heavy-duty vehicles
Diesel50 0 0 0 0 0 0 0.000 0.000 0.000 0.000 0.000 0.000
Diesel500 2 425 887 2426 89 758 19 407 2 911 3 881 0 0.007 0.246 0.053 0.008 0.011 0.000
Total 16 677 697 444 4 098 193 36 222 443 308 1 0.046 1.911 11.228 0.099 1.215 0.000

WEST RAND DISTRICT MUNICIPALITY: EMISSION INVENTORY FOR 2011
Report No. uMN014-12 37
Table 6.5: Breakdown of motor vehicle emission rates from Westonaria
Category Fuel Consumption
(kg/year)
Emission Rates (kg/year) Emission Rates (ton/day)
SO2 NOx CO PM10 VOC Lead SO2 NOx CO PM10 VOC Lead
Passenger cars
Gasoline 27 320 821 2 732 396 152 3 606 348 1 011 382 491 0 0.007 1.085 9.880 0.003 1.048 0.000
Diesel50 107 643 11 1 184 506 183 118 0 0.000 0.003 0.001 0.001 0.000 0.000
Diesel500
0 0 0 0 0 0 0.000 0.000 0.000 0.000 0.000 0.000
Light-duty
trucks
Gasoline
0 0 0 0 0 0 0.000 0.000 0.000 0.000 0.000 0.000
Diesel50
0 0 0 0 0 0 0.000 0.000 0.000 0.000 0.000 0.000
Diesel500 10 359 597 10 360 155 394 113 956 29 007 18 129 0 0.028 0.426 0.312 0.079 0.050 0.000
Heavy-duty
vehicles
Diesel50
0 0 0 0 0 0 0.000 0.000 0.000 0.000 0.000 0.000
Diesel500 2 242 247 2 242 82 963 17 938 2 691 3 588 0 0.006 0.227 0.049 0.007 0.010 0.000
Total
15 345 635 693 3 738 748 32 891 404 327 1 0.042 1.742 10.243 0.090 1.108 0.000
Table 6.6: Breakdown of total motor vehicle emission rates per local municipality, kg/year
Local
Municipality
Emission Rates (kg/year)
SO2 NOx CO PM10 VOC Lead
Mogale City 52 311 1 945 205 9 956 458 124 444 1 086 747 3
Randfontein 16 677 697 444 4 098 193 36 222 443 308 1
Westonaria 15 345 635 693 3 738 748 32 891 404 327 1
Total 84 332 3 278 342 17 793 399 193 558 1 934 382 5

WEST RAND DISTRICT MUNICIPALITY: EMISSION INVENTORY FOR 2011
Report No. uMN014-12 38
Table 6.7: Breakdown of total motor vehicle emission rates per local municipality, ton/day
Local
Municipality
Emission Rates (ton/day)
SO2 NOx CO PM10 VOC Lead
Mogale City 0.143 5.329 27.278 0.341 2.977 0.000
Randfontein 0.046 1.911 11.228 0.099 1.215 0.000
Westonaria 0.042 1.742 10.243 0.090 1.108 0.000
Total 0.231 8.982 48.749 0.530 5.300 0.000

WEST RAND DISTRICT MUNICIPALITY: EMISSION INVENTORY FOR 2011
39
From the table above, it is clear that the highest quantity of motor vehicle emissions is from
Mogale City, followed by Randfontein and Westonaria. Motor vehicle emissions in Mogale City, on
average, make up approximately 60% of total motor vehicle emissions in the WRDM.
With respect to individual pollutants, the pollutant emitted in the greatest quantity from motor
vehicles in the WRDM is CO at 48.749 ton/day. This is followed by NOx at 8.982 ton/day and
NMVOC at 5.3 ton/day. The largest source of VOC is gasoline-fuelled passenger cars. Diesel PM
is considered to be one of the most dangerous pollutants from motor vehicles with regard to
human health. PM10 is the key indicator of diesel PM. PM10 emissions from motor vehicles in the
WRDM are estimated to be 0.53 ton/day or 193 558 kg/year. The largest source of PM10
emissions is high sulphur diesel and consequently light-duty trucks and heavy-duty vehicles
(trucks and buses). Due to the phase-out of lead from fuels, total lead emissions from motor
vehicles in the WRDM is low at 5 kg/year.
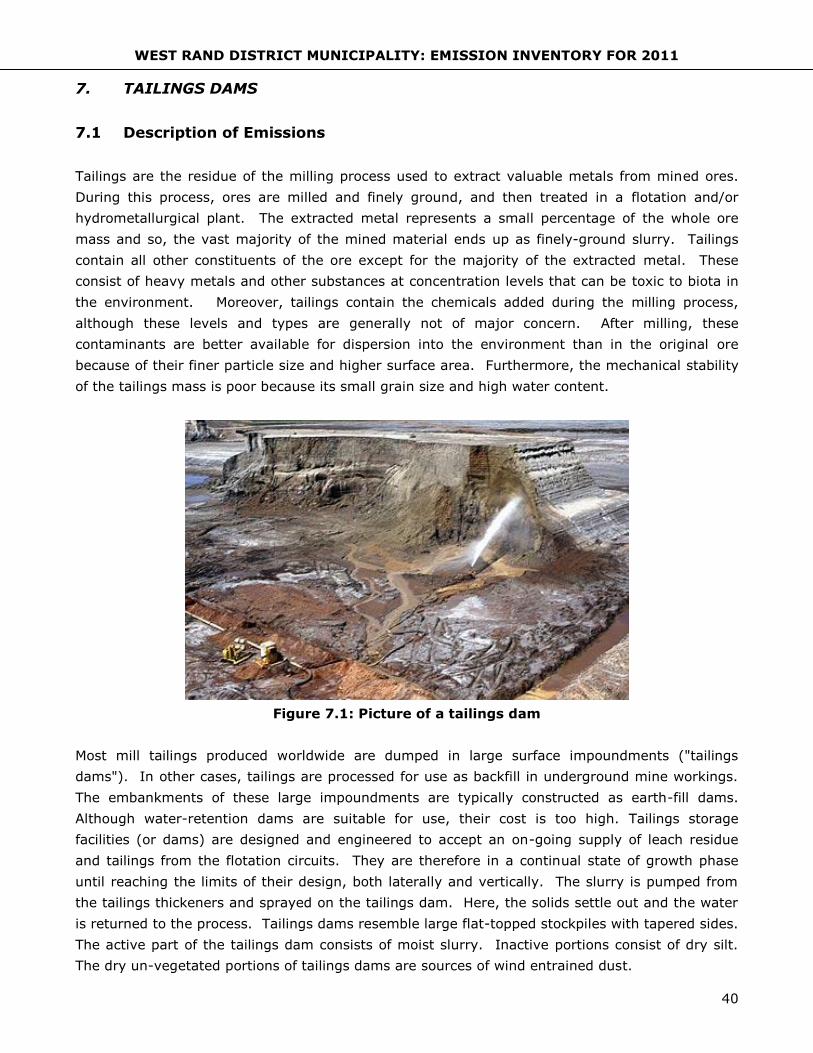
WEST RAND DISTRICT MUNICIPALITY: EMISSION INVENTORY FOR 2011
40
7. TAILINGS DAMS
7.1 Description of Emissions
Tailings are the residue of the milling process used to extract valuable metals from mined ores.
During this process, ores are milled and finely ground, and then treated in a flotation and/or
hydrometallurgical plant. The extracted metal represents a small percentage of the whole ore
mass and so, the vast majority of the mined material ends up as finely-ground slurry. Tailings
contain all other constituents of the ore except for the majority of the extracted metal. These
consist of heavy metals and other substances at concentration levels that can be toxic to biota in
the environment. Moreover, tailings contain the chemicals added during the milling process,
although these levels and types are generally not of major concern. After milling, these
contaminants are better available for dispersion into the environment than in the original ore
because of their finer particle size and higher surface area. Furthermore, the mechanical stability
of the tailings mass is poor because its small grain size and high water content.
Figure 7.1: Picture of a tailings dam
Most mill tailings produced worldwide are dumped in large surface impoundments ("tailings
dams"). In other cases, tailings are processed for use as backfill in underground mine workings.
The embankments of these large impoundments are typically constructed as earth-fill dams.
Although water-retention dams are suitable for use, their cost is too high. Tailings storage
facilities (or dams) are designed and engineered to accept an on-going supply of leach residue
and tailings from the flotation circuits. They are therefore in a continual state of growth phase
until reaching the limits of their design, both laterally and vertically. The slurry is pumped from
the tailings thickeners and sprayed on the tailings dam. Here, the solids settle out and the water
is returned to the process. Tailings dams resemble large flat-topped stockpiles with tapered sides.
The active part of the tailings dam consists of moist slurry. Inactive portions consist of dry silt.
The dry un-vegetated portions of tailings dams are sources of wind entrained dust.
WEST RAND DISTRICT MUNICIPALITY: EMISSION INVENTORY FOR 2011
41
There are currently approximately 52 active and inactive tailings dams in the West Rand District
Municipalities owned by the various gold mines located in the areas. The material on the beaches
is very fine with a high silt content material which dries to form a weak crust which is easily
broken to expose the fine powder-like silt beneath. When exposed this material is entrained into
the atmosphere by wind. The sides of the tailings dam are relatively well vegetated which is an
effective way to reduce the dust entrainment by wind. Due to the significance of its size and their
vertical dimensions, the tailings dams provide a considerable area of dry material that is exposed
to wind. While active and predominantly moist, the potential for dust entrainment by wind is
dampened, but it may become a significant source of particulate matter if it is not vegetated and
is allowed to dry out, particularly during windy conditions.
7.2 Methodology
7.2.1 Data Gathering
Tailings dams are examples of open areas that provide substantially large un-vegetated areas that
are exposed to wind erosion. The task of data gathering consisted essentially of scanning the
WRDM using Google Earth to identify tailings/slimes dams. Each of the tailings dams identified in
this manner was then provided with an identity number ranging from 1 to 54 (TD1 to TD54). A
marked-up Google Earth map showing all the tailings dams was then sent to the mines in the
WRDM by Musa Zwane so that the mines could identify which of the 54 tailings dams belonged to
them.
7.2.2 Estimation of Emissions
This section describes the methodology used to estimate emission rates of PM10 and total
suspended particulates (TSP) from tailings dams.
The estimation of particulate emissions is based on the USEPA methodology for wind erosion of
open aggregate storage piles and exposed areas in industrial facilities provided in Chapter 13 of
the USEPA 42 (USEPA, 2006). The following methodology was followed:
Using Google Earth, the WRDM was scanned for tailings dams. A total of 54 were
identified.
The lateral dimensions of each tailings dam was estimated by demarcating these using
Google Earth (see examples in Figure 4.1). The average height of each source was
obtained from Google Earth;
Each area source was divided into three areas: a windward area, the top of the area and a
leeward area;
The area of potential wind erosion of the tailings dam was calculated based on the variable
vegetation cover and on the surface water area;

WEST RAND DISTRICT MUNICIPALITY: EMISSION INVENTORY FOR 2011
42
A function was developed to determine the relationship between wind speed and the
emission rate, or entrainment, based on the approach recommended by the USEPA (2006);
Average daily wind speed and direction data for the WRDM was obtained from the South
African Weather Service (SAWS);
The wind dependant emission rates of particulate matter in g/m2/s are presented in
Section 7.3.
Figure 7.2: Tailings dams as identified in Google Earth with red boundaries for
estimating approximate areas

WEST RAND DISTRICT MUNICIPALITY: EMISSION INVENTORY FOR 2011
43
7.3 Results of Emission Estimates
The results of PM emission estimations from tailings dams in the WRDM are presented in Tables
7.3 and 7.4.
The 3 largest dams in terms of PM emissions in the WRDM are TD18 which belongs to Gold 1 and
emits 4.35 ton/day, followed by TD30 which belongs to Goldfields Driefontein and emits 2.3
ton/day, and TD22 which also belongs to Gold 1 and emits 2.03 ton/day.
Table 7.3: PM emission rates from tailings dams in WRDM
Tailings
Dam
Local
Municipality Mine
PM Emission
Rate
(kg/year)
PM
Emission
Rate
(ton/day)
TD1 Mogale City 143 525 0.39
TD2 Mogale City 48 864 0.13
TD3 Mogale City 256 619 0.70
TD4 Mogale City 306 724 0.84
TD5 Mogale City 108 615 0.30
TD6 Mogale City 122 378 0.34
TD7 Mogale City 58 898 0.16
TD8 Mogale City 82 040 0.22
TD10 Mogale City 109 048 0.30
TD12 Mogale City 83 394 0.23
TD14 Mogale City 109 473 0.30
TD15 Mogale City 47 821 0.13
TD16 Mogale City 229 597 0.63
TD17 Mogale City 90 633 0.25
TD18 Randfontein Gold 1 – Mill Site 1 587 153 4.35
TD19 Randfontein 338 138 0.93
TD20 Westonaria 507 048 1.39
TD21 Westonaria 468 223 1.28
TD22 Westonaria Gold 1 – Old No. 4 741 547 2.03
TD23 Westonaria Goldfields – Kloof 1 426 515 1.17
TD24 Westonaria 221 880 0.61
TD25 Westonaria Goldfields – South Deep TS 404 990 1.11
TD26 Westonaria Goldfields – South Deep SS 283 222 0.78
TD27 Westonaria 85 410 0.23
TD28 Westonaria Goldfields – Kloof 2 571 019 1.56
TD29 Merafong Goldfields – Kloof 3 639 158 1.75
TD30 Merafong Goldfields – Driefontein 4 839 258 2.30
TD31 Merafong Goldfields – Driefontein 3 334 164 0.92

WEST RAND DISTRICT MUNICIPALITY: EMISSION INVENTORY FOR 2011
44
TD32 Merafong 50 540 0.14
TD33 Merafong Goldfields – Driefontein 1 507 446 1.39
TD34 Merafong Goldfields – Driefontein 2 462 140 1.27
TD35 Merafong Goldfields – Driefontein 5 278 136 0.76
TD36 Merafong 238 302 0.65
TD37 Merafong 69 366 0.19
TD38 Merafong 431 126 1.18
TD39 Merafong 81 596 0.22
TD40 Merafong 509 238 1.40
TD41 Merafong 661 428 1.81
TD42 Merafong 319 508 0.88
TD43 Merafong 132 037 0.36
TD44 Merafong 193 277 0.53
TD45 Merafong 261 332 0.72
TD46 Merafong 133 961 0.37
TD47 Merafong 46 502 0.13
TD48 Merafong 615 928 1.69
TD49 Merafong 440 915 1.21
TD50 Merafong 442 300 1.21
TD51 Merafong 46 397 0.13
TD52 Westonaria Goldfields – Kloof Venterspost 2 147 065 0.40
TD53 Westonaria Goldfields – Kloof Venterspost 1 99 950 0.27
TD55 Randfontein Gold 1 - Lindium Not estimated
TD56 Randfontein Gold 1 – Dump 20 Not estimated
Total 15 413 844 42.24
A total of 14 tailings dams were identified in Mogale City, 4 in Randfontein, 11 in Westonaria and
23 in Merafong. An additional 2 tailings dams (TD9 and TD54) that were initially identified as
being located in Mogale City, were later found to be located in the City of Joburg.
The total PM emissions from tailings dams was estimated at 42.24 ton/day. This implies that an
average 42 tons of PM enter the ambient environment of the WRDM on a daily basis from tailings
dams. The estimation of PM10 emissions, a subset of PM emissions, is not possible as the
emission estimation methodology used in this study only applies to PM.

WEST RAND DISTRICT MUNICIPALITY: EMISSION INVENTORY FOR 2011
45
Table 7.4: Breakdown of PM emission rates per local municipality
Local Municipality PM Emission Rate
(kg/year)
PM Emission Rate
(ton/day)
% of
Total
Mogale City 1 797 629 4.92 11.64
Randfontein 1 925 291 5.28 12.5
Westonaria 3 956 869 10.83 25.63
Merafong 7 734 055 21.21 50.21
Total 15 413 844 42.24
The local municipality that emits the largest quantity of PM emissions from tailings dams is
Merafong at 21.21 ton/day, which is also the municipality with the greatest number of tailings
dams. More than 50% of all PM emissions from tailings dams are emitted from Merafong. A
significant quantity of emissions also originate from Westonaria, where many tailings dams are
also located.

WEST RAND DISTRICT MUNICIPALITY: EMISSION INVENTORY FOR 2011
46
8. DOMESTIC BURNING
8.1 Description of Emissions
The three primary application categories relating to domestic fuel burning are:
Cooking
Lighting
Space heating
These are also the categories under which StatsSA reports the number of households utilising
fuel. The primary fuels used in South Africa for domestic purposes are coal, paraffin, liquefied
petroleum gas (LPG) and wood. Domestic use of fuels is restricted largely to informal, low-income
and densely populated settlements. The combustion of these fuels is a significant source of air
pollution, especially during winter. The impact on air quality from residential fire emissions is
fairly significant, considering that the release of pollutants occurs close to ground level at
relatively low temperatures (causing a lack of buoyancy of the plume). The low-level release
implies that the pollutants are released into the stable surface inversion layer, where dispersion is
inhibited and pollutants tend to accumulate close to the source. High ambient concentrations may
result near the source under these conditions. The relatively low fire temperature implies that the
combustion process is often incomplete.
Domestic coal burning contributes to the emission of particulate matter, notable PM2.5 and PM10.
Other criteria pollutants such as SO2 and CO are also emitted in substantial quantities as a result
of coal burning, particularly when low-grade, high sulphur coal is burned. Domestic burning of
wood (in addition to veld fire burning) results in the release of fine particulate emissions (PM2.5) as
well as NO2, CO and benzene. Domestic coal and wood combustion in informal settlements and
rural areas have been identified through various studies to be, potentially, one of the greatest
sources of airborne particulates and gaseous emissions to be inhaled in high concentration (i.e.
before dispersion and fallout processes can ameliorate impact).
Although many households are electrified, informal households predominantly use a contribution
of this fuel mix (coal, paraffin, LPG, wood, animal dung and other waste materials are used to a
smaller extent) primarily due their availability and affordability, although factors such as cultural
traditions also play a role in the continuing use of other fuels. Population density and growth also
play a significant part, amongst a variety of additional factors.
8.2 Methodology
8.2.1 Data Gathering
The estimation of emissions from domestic burning commenced with the sourcing of data on the
number of households in the WRDM utilising fuels for domestic purposes (cooking, lighting, space

WEST RAND DISTRICT MUNICIPALITY: EMISSION INVENTORY FOR 2011
47
heating). The most appropriate source for this information was the census data from StatsSA’s
Household Services Community Survey 2007. The census data reports on the number of
households burning fuel in an area, which for our purposes are the four local municipalities of the
WRDM. The limitation of the information is recognised to be the fact that the information is not
current. The study should ideally utilise data for 2011, however, the most recent data available
was for 2007. The number of households consuming fuels are presented in Tables 5.1 to 5.3 for
the four local municipalities.
Table 8.1: Number of households using fuels for cooking
Fuel Mogale City Randfontein Westonaria Merafong
Coal 235 131 71 16
Paraffin 14 248 8 578 16 729 349
LPG 1 184 406 512 15
Wood 1 122 376 417 79
Table 8.2: Number of households using fuels for lighting
Fuel Mogale City Randfontein Westonaria Merafong
Paraffin 3 035 1 900 7 102 17
LPG 189 0 216 0
Table 8.3: Number of households using fuels for space heating
Fuel Mogale City Randfontein Westonaria Merafong
Coal 4 108 1 631 2 431 16
Paraffin 10 374 7 123 13 689 237
LPG 1 303 262 286 58
Wood 4 763 1 024 1 327 222
Having obtained data on the number of households consuming fuels, the next logical step was to
determine the quantity of fuels consumed per household. One of the outputs of the extensive
research undertaken in developing the FRIDGE (Fund for Research into Industrial Development,
Growth and Equity) report was data on the quantities of fuels consumed in specific geographical
areas of South Africa. The quantity of fuels consumed varies with geographical areas due to
several reasons such as climate (more fuels consumed in colder areas) and extent of development
(more fuels consumed in rural areas). For instance, the quantity of coal consumed in the
eThekwini Municipality (warmer and more developed) is 0.042 ton/year/household, which is
significantly less than the 0.615 ton/year/household consumed by households in the Vaal Triangle
(colder and less developed).
The FRIDGE report does not specifically present fuel consumption data for the WRDM. It was
therefore decided to select an area that most closely reflects the situation in the WRDM, in this
case, Johannesburg. The total fuel consumption figures contained in the table below for the local

WEST RAND DISTRICT MUNICIPALITY: EMISSION INVENTORY FOR 2011
48
municipalities of the WRDM were based on household level fuel consumption figures for
Johannesburg.
Table 8.4: Total fuel consumption for households in the WRDM
Fuel Total Consumption (ton/year)
Mogale City Randfontein Westonaria Merafong
Coal 65.85 36.71 19.89 4.48
Paraffin 446.53 268.83 524.29 10.94
LPG 5.63 1.93 2.44 0.07
Wood 20.07 6.73 7.46 1.41
From the table above, it is clear that the greatest quantity of coal, paraffin and wood are
consumed in Mogale City, while the greatest quantity of paraffin is consumed in Westonaria. In
contrast, the lowest quantities of all fuels are consumed in Merafong.
8.2.2 Estimation of Emissions
Having determined fuel consumption associated with domestic burning in the WRDM, the next
important step was to source appropriate emission factors for the criteria pollutants. The FRIDGE
report also served as a useful reference source for emission factors of criteria pollutants from
domestic burning. The following table presents these emission factors.
Table 5.5: Emission factors identified for the estimation of household fuel combustion
emissions
Fuel Units Emission Factors
SO2 NOx VOCs PM10 CO Benzene
Coal g/kg 19 1.5 5 4.1 187.4 0.0134
Paraffin g/l 8.5 1.5 0.09 0.2 44.9 0
LPG g/kg 0.01 1.4 0.5 0.07 13.6 0
Wood g/kg 0.18 5 22 15.7 114.6 0.9
8.3 Results of Emission Estimates
By applying the emission factors of Table 5.5 to the fuel consumption rates of Table 5.4, it was
possible to estimate pollutant emission rates from domestic burning. These are presented below
in Table 8.6.

WEST RAND DISTRICT MUNICIPALITY: EMISSION INVENTORY FOR 2011
49
Table 8.6: Breakdown of emission rates from domestic burning per local municipality,
kg/year
Local
Municipalities
Emission Rate (kg/year)
SO2 NOx CO PM10 VOC Benzene
Mogale City 31 609 3 864 285 016 6 842 8 496 96
Randfontein 14 774 1 821 123 902 2 544 3 078 23
Westonaria 24 814 3 242 195 704 3 635 4 316 28
Merafong 356 73 3 277 126 165 5
Total 71 553 9 000 607 899 13 147 16 056 152
Table 8.6: Breakdown of emission rates from domestic burning per local municipality,
ton/day
Local
Municipalities
Emission Rate (ton/day)
SO2 NOx CO PM10 VOC Benzene
Mogale City 0.087 0.011 0.781 0.019 0.023 0.000
Randfontein 0.040 0.005 0.339 0.007 0.008 0.000
Westonaria 0.068 0.009 0.536 0.010 0.012 0.000
Merafong 0.001 0.000 0.009 0.000 0.000 0.000
Total 0.196 0.025 1.665 0.036 0.044 0.000
Emissions of all pollutants, with the exception of benzene, can be described as significant. The
combustion of coal and paraffin result in high emissions of SO2 due to the high sulphur content in
these fuels. The local municipality that produces the largest quantity of emissions from domestic
burning is Mogale City. This is directly attributable to the high number of households in Mogale
City that use coal for cooking and space heating. Westonaria is the municipality that produces the
second highest quantity of emissions. Westonaria is the local municipality where the consumption
of paraffin is the greatest. A high number of households use paraffin in Mogale City for cooking,
lighting and space heating.

WEST RAND DISTRICT MUNICIPALITY: EMISSION INVENTORY FOR 2011
50
9. BIOMASS BURNING
9.1 Description of Emissions
Biomass burning is generally categorised into wildfires and prescribed (controlled) burning.
Wildfires:
A wildfire is a large-scale natural combustion process that consumes various ages, sizes, and
types of flora growing outdoors in a geographical area. Consequently, wildfires are potential
sources of large amounts of air pollutants that must be considered when trying to relate emissions
to air quality. Wildfires occur both naturally (e.g. through lightning strikes) and through arson. It
is often difficult to determine whether a wildfire has been deliberately lit or has occurred naturally.
The size and intensity, even the occurrence, of a wildfire depend directly on such variables as
meteorological conditions, the species of vegetation involved and their moisture content, and the
weight of consumable fuel per acre (available fuel loading). Once a fire begins, the dry
combustible material is consumed first. If the energy release is large and of sufficient duration,
the drying of green, live material occurs, with subsequent burning of this material as well. Under
proper environmental and fuel conditions, this process may initiate a chain reaction that results in
a widespread conflagration.
The factors that affect the rate of spread of a wildfire are:
Weather (wind velocity, ambient temperature, relative humidity);
Fuels (fuel type, fuel bed array, moisture content, fuel size); and
Topography (slope and profile).
Figure 9.1: Photograph of a wildfire – a significant source of emissions

WEST RAND DISTRICT MUNICIPALITY: EMISSION INVENTORY FOR 2011
51
Prescribed burning:
The most effective method of controlling wildfire emissions is to prevent the occurrence of
wildfires by various means. A frequently used technique for reducing wildfire occurrence is
"prescribed" or "hazard reduction" burning. This type of managed burn involves combustion of
litter and underbrush to prevent fuel build-up under controlled conditions, thus reducing the
danger of a wildfire. Although some air pollution is generated by this preventive burning, the net
amount is believed to be a relatively smaller quantity than that produced by wildfires.
Prescribed burning activities include fires that are intentionally started for a variety of reasons
such as fuel reduction for wildfire prevention, regeneration after logging operations, ecosystem
maintenance, land clearing, and agricultural land management (NPI, 1999). The amount and type
of prescribed burning and wildfires will vary significantly between different geographical areas and
airsheds. The quantity and composition of emissions from different types of burning are also
highly variable. For forest and grassland fires (both wild and prescribed), the area of land burned
will vary greatly depending on climatic conditions. Fuel loadings may also vary from year to year,
and with the time of year that the burn occurs. These two factors combined lead to large
variations in the amount of material consumed in fires from one year to the next.
For agricultural burning, the amount of fuel burned will depend on the annual crop harvest and
farming practices in the airshed. The amount of consumable fuel in a particular area has a major
impact on emissions from burning. Different species composition and hence different plant
material types have different burning qualities. Thus, forests, grasses, and crops such as wheat
and barley have different emission-generating characteristics.
The major air pollutant of concern is the smoke produced. Smoke from prescribed fires is a
complex mixture of carbon, tars, liquids, and different gases. This open combustion source
produces particles of widely ranging size, depending to some extent on the rate of energy release
of the fire. The major pollutants from wildland burning are PM, CO, and VOCs. NOx are emitted at
rates of from 1 to 4 g/kg burned, depending on combustion temperatures. Emissions of SOx are
negligible. PM emissions depend on the mix of combustion phase, the rate of energy release, and
the type of fuel consumed. All of these elements must be considered in selecting the appropriate
emission factor for a given fire and fuel situation.
9.2 Methodology for Estimating Emissions
Emissions of PM, CO, NOx and VOC from wildfires are estimated by using the following equations:
Fi = Pi L (1)
Ei = Fi A = Pi L A (2)
Where:
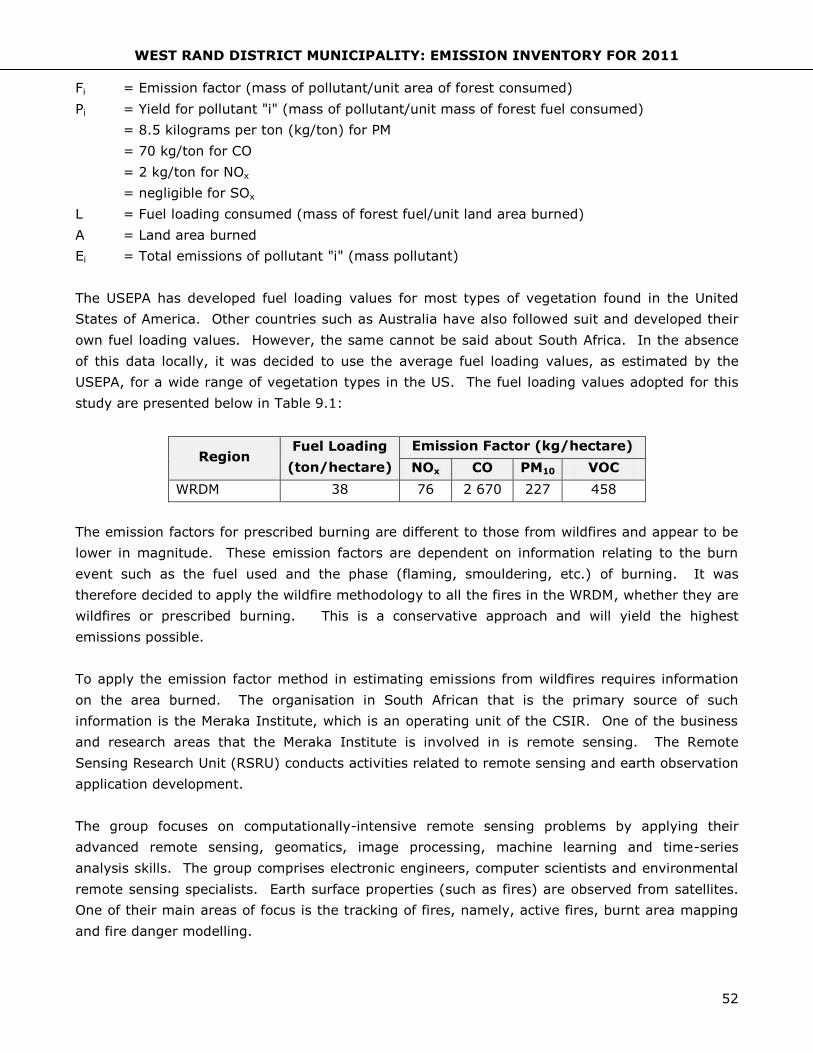
WEST RAND DISTRICT MUNICIPALITY: EMISSION INVENTORY FOR 2011
52
Fi = Emission factor (mass of pollutant/unit area of forest consumed)
Pi = Yield for pollutant "i" (mass of pollutant/unit mass of forest fuel consumed)
= 8.5 kilograms per ton (kg/ton) for PM
= 70 kg/ton for CO
= 2 kg/ton for NOx
= negligible for SOx
L = Fuel loading consumed (mass of forest fuel/unit land area burned)
A = Land area burned
Ei = Total emissions of pollutant "i" (mass pollutant)
The USEPA has developed fuel loading values for most types of vegetation found in the United
States of America. Other countries such as Australia have also followed suit and developed their
own fuel loading values. However, the same cannot be said about South Africa. In the absence
of this data locally, it was decided to use the average fuel loading values, as estimated by the
USEPA, for a wide range of vegetation types in the US. The fuel loading values adopted for this
study are presented below in Table 9.1:
Region Fuel Loading
(ton/hectare)
Emission Factor (kg/hectare)
NOx CO PM10 VOC
WRDM 38 76 2 670 227 458
The emission factors for prescribed burning are different to those from wildfires and appear to be
lower in magnitude. These emission factors are dependent on information relating to the burn
event such as the fuel used and the phase (flaming, smouldering, etc.) of burning. It was
therefore decided to apply the wildfire methodology to all the fires in the WRDM, whether they are
wildfires or prescribed burning. This is a conservative approach and will yield the highest
emissions possible.
To apply the emission factor method in estimating emissions from wildfires requires information
on the area burned. The organisation in South African that is the primary source of such
information is the Meraka Institute, which is an operating unit of the CSIR. One of the business
and research areas that the Meraka Institute is involved in is remote sensing. The Remote
Sensing Research Unit (RSRU) conducts activities related to remote sensing and earth observation
application development.
The group focuses on computationally-intensive remote sensing problems by applying their
advanced remote sensing, geomatics, image processing, machine learning and time-series
analysis skills. The group comprises electronic engineers, computer scientists and environmental
remote sensing specialists. Earth surface properties (such as fires) are observed from satellites.
One of their main areas of focus is the tracking of fires, namely, active fires, burnt area mapping
and fire danger modelling.

WEST RAND DISTRICT MUNICIPALITY: EMISSION INVENTORY FOR 2011
53
For this study, their analyses of burned area consisted of a spatial overlay with aggregation,
performed in a spatial relational database. The data used for burned areas was derived from a
merge of the so-called Giglio and Roy algorithms for MODIS burned area detection. Boundary
data was from the 2011 version of the Municipal Demarcation Board datasets. Burned areas were
collected into each area for each year by a spatial join/overlay and a temporal boundary query
before being aggregated to form counts and area calculations. The count may include the same
area more than once, as a fire can partially burn the area of a pixel observation more than once in
a year. Also, each burned area is not necessarily 463 m x 463 m (the minimum area size
identified by the satellite as burned); rather, what the algorithm says is that enough of a pixel has
burned to flag the whole pixel as “burned”. The implication is that the area estimate has an
inherent commission error. This is generally more than offset by the fact that many fires are not
detected, particularly those that are small. Overall, the estimate is likely to be conservative, with
more omission than commission errors.
9.3 Results of Emissions Estimation
Burned area for the local municipalities of the WRDM, as determined by the Meraka Institute, are
presented below in Table 9.2.
Table 9.2: Yearly burned area data for the WRDM
Local Municipality No. of
Fires (1)
Yearly Burned Area
Accumulation (m2) (2)
2010:
Mogale City 926 198 505 694
Randfontein 401 85 961 969
Merafong 1 450 310 835 050
Westonaria 1 041 223 158 129
Total 3 818 818 460 842
2011:
Mogale City 815 174 710 735
Merafong 1 734 371 715 846
Randfontein 395 84 675 755
Westonaria 707 151 558 883
Total 3 651 782 661 219
Notes:
1) A count of 463m x 463m pixels in a given year, for a given LM, that are flagged as “Burned” by one or other of
two algorithms for detecting burned areas from MODIS data.
2) An aggregation of the area of all the “Burned” pixels that are counted in a given year, for a given LM. Unit of
measure is m2. To get to hectares, divide by 10 000.
The discrepancy in burned areas between 2010 are 2011 is a mere 4%, thus relatively
insignificant. As this study is for 2011, emission estimations were based on 2011 data.

WEST RAND DISTRICT MUNICIPALITY: EMISSION INVENTORY FOR 2011
54
The total burned area for 2011 was 782.6 km2, compared to a total estimated area of the WRDM
of 4 087 km2. The burned area represents 20% of the total area of the WRDM. This does not
however imply that 20% of the total surface area of the municipality was burned as a single
location could be burned several times in a year.
The total of 3 651 fires in 2011 implies that there were approximately 10 fires in a day in the
WRDM. The highest number of fires for both 2010 and 2011 (average of 4.4 a day) occurred in
Merafong, by a significant margin. The lowest number of fires occurred in Randfontein.
The results of the estimation of emissions from biomass burning in the WRDM using the
methodologies described above are presented below in Tables 9.3 and 9.4.
Table 9.3: Breakdown of emission rates from biomass burning per local municipality,
kg/year
Local
Municipality
Emission Rate (kg/year)
NOx CO PM10 VOC
Mogale City 1 327 802 46 647 766 3 962 439 8 001 752
Merafong City 2 825 040 99 248 131 8 430 515 17 024 586
Randfontein 643 536 22 608 427 1 920 446 3 878 150
Westonaria 1 151 848 40 466 222 3 437 355 6 941 397
Total 5 948 225 208 970 545 17 750 756 35 845 884
Table 9.3: Breakdown of emission rates from biomass burning per local municipality,
ton/day
Local
Municipality
Emission Rate (ton/day)
NOx CO PM10 VOC
Mogale City 3.638 127.802 10.856 21.923
Merafong City 7.740 271.913 23.097 46.643
Randfontein 1.763 61.941 5.261 10.625
Westonaria 3.156 110.866 9.417 19.018
Total 16.297 572.522 48.632 98.208
The total emissions from biomass burning can be described as significant. This is primarily due to
the high number of fires that occur in the district municipality.
Significant quantities of all pollutants are emitted into the atmosphere from biomass burning. The
pollutant emitted in the highest quantity if CO at 572.522 ton/day. There are also significant
quantities of VOC and PM emitted at 98.208 ton/day and 48.632 ton/day, respectively. In line
with the highest number of fires there, the highest quantity of emissions as a result of biomass
burning is emitted from Merafong.

WEST RAND DISTRICT MUNICIPALITY: EMISSION INVENTORY FOR 2011
55
10. EMISSIONS SUMMARY
Total emissions of all pollutants from all sources in the WRDM are presented below in Table 10.1
and 10.2.
Table 10.1: Total emissions from all sources in the WRDM, kg/year
Source Emission Rate (kg/year)
SO2 NOx CO PM10 VOC Benzene Lead
Industries 1 796 219 1 045 349 140 142 614 5 218 323 549 503 6 306 11 031
Motor vehicles 84 332 3 278 342 17 793 399 193 558 1 934 382
5
Domestic burning 71 553 9 000 607 899 13 147 16 056 152
Tailings dams
15 413 844
Biomass burning
5 948 225 208 970 545 17 750 756 35 845 884
Total 1 952 104 10 280 917 367 514 457 38 589 628 38 345 825 6 458 11 036
Table 10.2: Total emissions from all sources in the WRDM, ton/day
Source Emission Rate (ton/day)
SO2 NOx CO PM10 VOC Benzene Lead
Industries 4.921 2.864 383.952 14.297 1.506 0.017 0.030
Motor vehicles 0.231 8.982 48.749 0.530 5.300
0.000
Domestic burning 0.196 0.025 1.665 0.036 0.044
Tailings dams
42.24
Biomass burning
16.297 572.522 48.632 98.208
Total 5.348 28.167 1 006.889 105.736 105.058 0.017 0.030
The emission rates contained in the above tables provide useful information on which sources to
focus when developing emission reduction initiatives.
SO2 emissions originate from the combustion of fossil fuels. A total of 5.348 ton/day of SO2
emissions are produced in the WRDM. Industries are the most significant contributor to this total
(>92.0%), due mainly to the combustion of coal. SO2 emissions also emanate from motor
vehicles, due to the combustion of diesel, and domestic burning, due to the combustion of coal.
No SO2 emissions are produced by tailings dams and biomass burning.
A total of 28.167 ton/day of NOx emissions are produced in the WRDM, approximately 5 times
more than SO2. NOx emissions are produced from the oxidation of naturally occurring nitrogen
species in the ambient environment during combustion processes. The atmosphere is composed
of approximately 80% nitrogen. As such, the largest producer of NOx emissions is biomass
burning. Wildfires and prescribed burning activities cause nitrogen to be oxidised to NOx. It is
estimated that a total of 16.297 ton/day of NOx emissions are produced in this way. The other
notable sources of NOx emissions are motor vehicles at 8.982 ton/day and industries at 2.864
ton/day. Some NOx emissions originate from domestic burning, but the quantity is insignificant
when compared to the other major sources described above .

WEST RAND DISTRICT MUNICIPALITY: EMISSION INVENTORY FOR 2011
56
A total of 1 006.889 ton/day of CO emissions are produced in the WRDM, greater than both SO2
and NOx. However, this does not necessarily mean that CO will pose a greater danger to the
health and well-being of residents in the WDM. CO normally causes negative health impacts at
high concentrations, whereas SO2 and NOx cause negative health impacts at much lower
concentrations. The two most significant sources of CO emissions are biomass burning and
industries at 572.522 ton/day and 383.952 ton/day, respectively. As expected, the tailings dams
produce no CO emissions, while motor vehicles produce 48.749 ton/day.
PM10 emissions are produced by all sources identified in this study. The quantity of PM10
emissions produced in the WRDM are greater than both SO2 and NOx. PM10 is recognised as a
pollutant of great concern across the world due to its high prevalence and negative health
impacts. The total quantity of PM10 emitted in the WRDM was estimated at 105.736 ton/day.
Biomass burning (48.632 ton/day) and the tailings dams (42.24 ton/day) have been identified as
the major sources of PM10 emissions in the WRDM. Industries are also responsible for a significant
PM10 emissions rate of 14.297 ton/day.
VOCs consist of a range of organic pollutants that react photo-chemically with NOx in the presence
of sunlight to form ozone (O3), one of the 6 criteria pollutants and known to have negative health
impacts. The most notable source of VOCs is biomass burning at 98.208 ton/day. Emissions of
one of the compounds classified as a VOC, namely, benzene, was estimated separately in the
study. Benzene emissions from the petrochemical storage depot in Tarlton have been estimated
at 6 306 kg/year.
Lead emissions originate from Castle Lead Works (11 031 kg/year) and motor vehicles (5
kg/year). The low quantity of lead emissions from motor vehicles is primarily due to the phase-
out of lead in fuels.
Emission contributions of individual sources are presented graphically with the aid of pie graphs in
Figures 10.1 to 10.5 below.

WEST RAND DISTRICT MUNICIPALITY: EMISSION INVENTORY FOR 2011
57
Figure 10.1: Graphical presentation of SO2 emissions from the WRDM
The graph above clearly shows that industries are the dominant source with regard to SO2
emissions in the WRDM. Industries account for 92.0% of all SO2 emissions, followed by motor
vehicles at 4.3% and domestic burning at 3.7%. There are no SO2 emissions from tailings dams,
while SO2 emissions from biomass burning could be described as negligible. The primary fossil
fuel which results in the production of SO2 emissions is coal, used by both industries and
households.
Figure 10.2: Graphical presentation of NOx emissions from the WRDM
With regard to NOx emissions, the two primary sources in the WRDM are biomass burning and
motor vehicles, with overall contributions of 57.9% and 31.9%, respectively. The total
92
.0%
4.3
%
3.7
%
0.0
%
0.0
%
SO2 EMISSIONS FROM THE WRDM
Industries
Motor vehicles
Domestic burning
Tailings dams
Biomass burning
10.2%
31.9%
0.1%
0.0%
57.9%
NOX EMISSIONS FROM THE WRDM
Industries
Motor vehicles
Domestic burning
Tailings dams
Biomass burning

WEST RAND DISTRICT MUNICIPALITY: EMISSION INVENTORY FOR 2011
58
contribution of NOx emissions from industries are lower at 10.2%, whereas NOx emissions from
domestic burning are insignificant at 0.1%.
Figure 10.3: Graphical presentation of CO emissions from the WRDM
The greatest source of CO emissions is biomass burning with an overall contribution of 56.9%.
This is followed by another significant contributor, industries, at 38.1%. CO emissions from motor
vehicles make up 4.8% of total CO emissions in the municipality.
Figure 10.4: Graphical presentation of PM10 emissions from the WRDM
The two most significant sources of PM10 emissions in the WRDM are biomass burning at a 46.0%
contribution and tailings dams at a 39.9% contribution. As with most other pollutants, industries
make a notable contribution to total PM10 emissions of 13.5%.
38.1%
4.8%
0.2% 0.0%
56.9%
CO EMISSIONS FROM THE WRDM
Industries
Motor vehicles
Domestic burning
Tailings dams
Biomass burning
13.5%
0.5%
0.0%
39.9%
46.0%
PM10 EMISSIONS FROM THE WRDM
Industries
Motor vehicles
Domestic burning
Tailings dams
Biomass burning
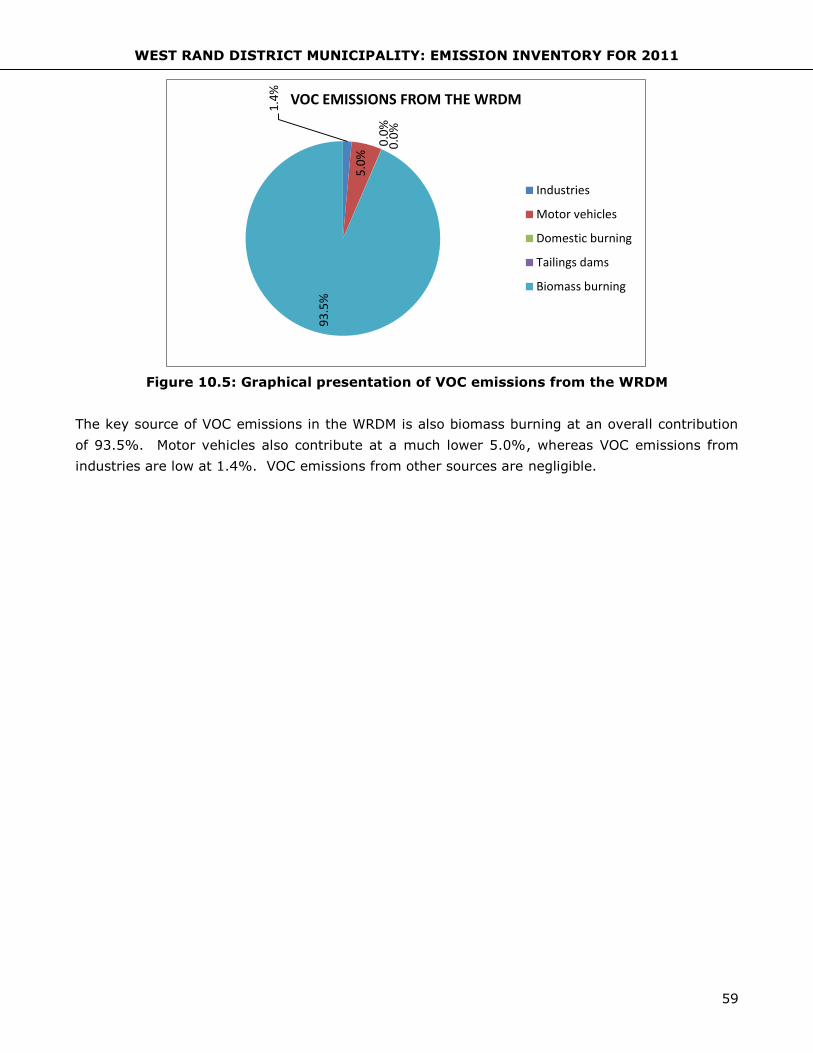
WEST RAND DISTRICT MUNICIPALITY: EMISSION INVENTORY FOR 2011
59
Figure 10.5: Graphical presentation of VOC emissions from the WRDM
The key source of VOC emissions in the WRDM is also biomass burning at an overall contribution
of 93.5%. Motor vehicles also contribute at a much lower 5.0%, whereas VOC emissions from
industries are low at 1.4%. VOC emissions from other sources are negligible.
1.4
%
5.0
% 0
.0%
0
.0%
93
.5%
VOC EMISSIONS FROM THE WRDM
Industries
Motor vehicles
Domestic burning
Tailings dams
Biomass burning

WEST RAND DISTRICT MUNICIPALITY: EMISSION INVENTORY FOR 2011
60
11. CONCLUSIONS AND RECOMMENDATIONS
The following are the key conclusions in relation to this study:
1. The 7 major sources of atmospheric emissions identified in the WRDM under their relevant
categories are:
Point – Listed activities and small industrial processes
Mobile – Motor vehicles
Area – Domestic burning, agricultural, biomass burning and tailings dams
2. Due to the absence of credible information on agricultural activities in the WRDM, this
source is excluded from the present study. However, the prescribed burning portion of
agricultural activities is accounted for under biomass burning.
3. Combustion devices (boilers, furnaces, heaters, etc.) in the WRDM are key emitters of
criteria pollutants (SO2, NOx, CO and PM10) and toxic air pollutants such as benzene,
toluene and xylene.
4. A total of 66 industries were identified and contacted to in the information gathering phase
of the project.
5. The primary fuels used by industries in the WRDM are coal (different grades), fuel oil
(heavy and light), diesel and gas.
6. Coal is the most widely used fuel with Mogale Alloys consuming 62 % of the total.
7. The following fuel consumption rates were determined from industries in the WRDM:
Coal – 141 944 ton/year
Fuel oil – 1 486 ton/year
Gas – 2 949 562 m3/year
Diesel – 34 ton/year
8. The total emission rates of pollutants from industries in the WRDM are:
SO2 – 4.921 ton/day
NOx – 2.864 ton/day
CO – 383.680 ton/day
PM10 – 14.297 ton/day
VOC – 1.506 ton/day
Benzene – 0.017 ton/day
Lead – 0.03 ton/day
9. The largest source of industrial SO2 emissions is Mogale Alloys, which emits an average of
2.27 ton/day or 46% of the total industrial SO2 emissions.
10. There are numerous mines located in the WRDM, but refining/smelting do not take place at
the majority these mines, with the result that the primary emissions from mines are PM,
notably dust, from ore extraction.
11. The only mining group that disclosed the existence of smelting/refining operations was
Goldfields at its South Deep, Kloof and Driefontein gold mines.
12. The estimation of emissions from motor vehicles was based on fuel sales data, sourced
from the Department of Energy. The following fuel sales figures apply to the WRDM:
Gasoline - 95 587 839 litres/year

WEST RAND DISTRICT MUNICIPALITY: EMISSION INVENTORY FOR 2011
61
Diesel50 - 7 591 333 litres/year
Diesel500 - 59 429 601 litres/year
13. The total emission rates of pollutants from motor vehicles in the WRDM are:
SO2 – 0.231 ton/day
NOx – 8.982 ton/day
CO – 48.749 ton/day
PM10 – 0.530 ton/day
VOC – 5.300 ton/day
14. The highest emission rates from motor vehicles originate from Mogale City.
15. The key pollutant emitted from tailings dams is PM. The tailings dams that produce the
largest quantity of PM emissions belong to Gold 1 (4.35 ton/day), Goldfields Driefontein
(2.3 ton/day), and another to Gold 1 (2.03 ton/day).
16. PM emission rates from tailings dams for the local municipalities are as follows:
Mogale City - 4.92 ton/day
Randfontein - 5.28 ton/day
Westonaria - 10.83 ton/day
Merafong - 21.21 ton/day
17. The local municipality from where the highest PM emissions from tailings dams occurs is
Merafong (21.21 ton/day or >50 % of total),
18. The primary applications in domestic fuel burning are cooking, lighting and space heating
using coal, paraffin, LPG and wood as the primary fuels.
19. The total estimated emissions from domestic burning are:
SO2 – 0.196 ton/day
NOx – 0.025 ton/day
CO – 1.665 ton/day
PM10 – 0.036 ton/day
VOC – 0.044 ton/day
20. The local municipality that produces the largest quantity of emissions from domestic
burning is Mogale City due to the large number of homes using fuels there.
21. Wildfires and controlled burning (biomass burning) are a significant source of NOx, CO,
PM10 and VOC.
22. There were a total of 3 818 and 3 651 significant fires in the WRDM in 2010 and 2011,
respectively. The highest number of fires at approximately 1 600 per year were identified
in Merafong.
23. The emission rates from biomass burning have been estimated as follows:
NOx – 16.297 ton/day
CO – 572.522 ton/day
PM10 – 48.632 ton/day
VOC – 98.208 ton/day
24. Total emissions of all sources in the WRDM are as follows:
SO2 - 5.348 ton/day
NOx – 28.167 ton/day
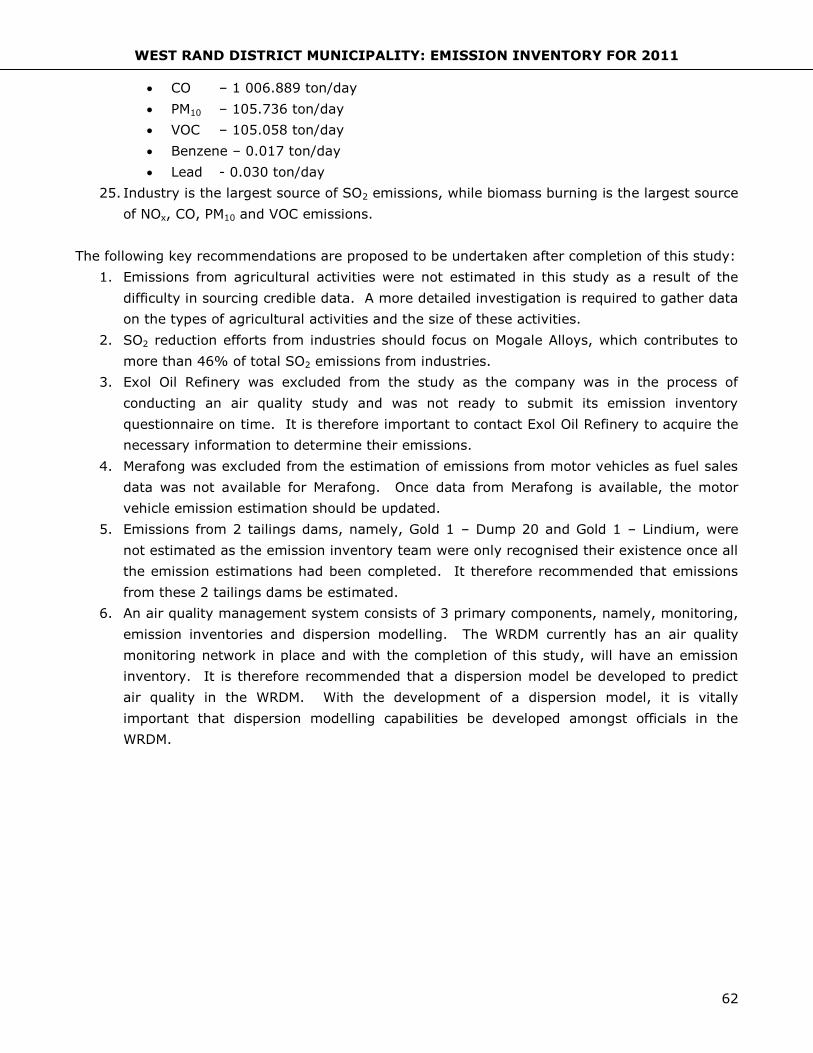
WEST RAND DISTRICT MUNICIPALITY: EMISSION INVENTORY FOR 2011
62
CO – 1 006.889 ton/day
PM10 – 105.736 ton/day
VOC – 105.058 ton/day
Benzene – 0.017 ton/day
Lead - 0.030 ton/day
25. Industry is the largest source of SO2 emissions, while biomass burning is the largest source
of NOx, CO, PM10 and VOC emissions.
The following key recommendations are proposed to be undertaken after completion of this study:
1. Emissions from agricultural activities were not estimated in this study as a result of the
difficulty in sourcing credible data. A more detailed investigation is required to gather data
on the types of agricultural activities and the size of these activities.
2. SO2 reduction efforts from industries should focus on Mogale Alloys, which contributes to
more than 46% of total SO2 emissions from industries.
3. Exol Oil Refinery was excluded from the study as the company was in the process of
conducting an air quality study and was not ready to submit its emission inventory
questionnaire on time. It is therefore important to contact Exol Oil Refinery to acquire the
necessary information to determine their emissions.
4. Merafong was excluded from the estimation of emissions from motor vehicles as fuel sales
data was not available for Merafong. Once data from Merafong is available, the motor
vehicle emission estimation should be updated.
5. Emissions from 2 tailings dams, namely, Gold 1 – Dump 20 and Gold 1 – Lindium, were
not estimated as the emission inventory team were only recognised their existence once all
the emission estimations had been completed. It therefore recommended that emissions
from these 2 tailings dams be estimated.
6. An air quality management system consists of 3 primary components, namely, monitoring,
emission inventories and dispersion modelling. The WRDM currently has an air quality
monitoring network in place and with the completion of this study, will have an emission
inventory. It is therefore recommended that a dispersion model be developed to predict
air quality in the WRDM. With the development of a dispersion model, it is vitally
important that dispersion modelling capabilities be developed amongst officials in the
WRDM.
WEST RAND DISTRICT MUNICIPALITY: EMISSION INVENTORY FOR 2011
63
12. REFERENCES
1. Andrias, Samaras and Zierock. The Estimation of the Emissions of Other Mobile Sources
and Machinery Subparts Off-Road Road Vehicles and Machines, Railways and Inland
Waterways in The European Union, September 1994.
2. Environment Australia. Emissions Estimation Technique Manual, Aggregate Emissions from
Motor Vehicles. Version 1.0. 22 November 2000.
3. European Environmental Agency. EMEP/EEA Air Pollutant Emission Inventory Guidebook.
Exhaust Emission from Road Transport. 2010.
4. South African Petroleum Industries Association. Petrol and Diesel in South Africa and the
Impact on Air Quality. November 2008.
5. USEPA, Compilation of Air Pollutant Emission Factor, AP-42, Fifth Edition, Volume I:
Stationery Point and Area Sources, 2005.

WEST RAND DISTRICT MUNICIPALITY: EMISSION INVENTORY FOR 2011
64
APPENDIX A – STAKEHOLDER WORKSHOP
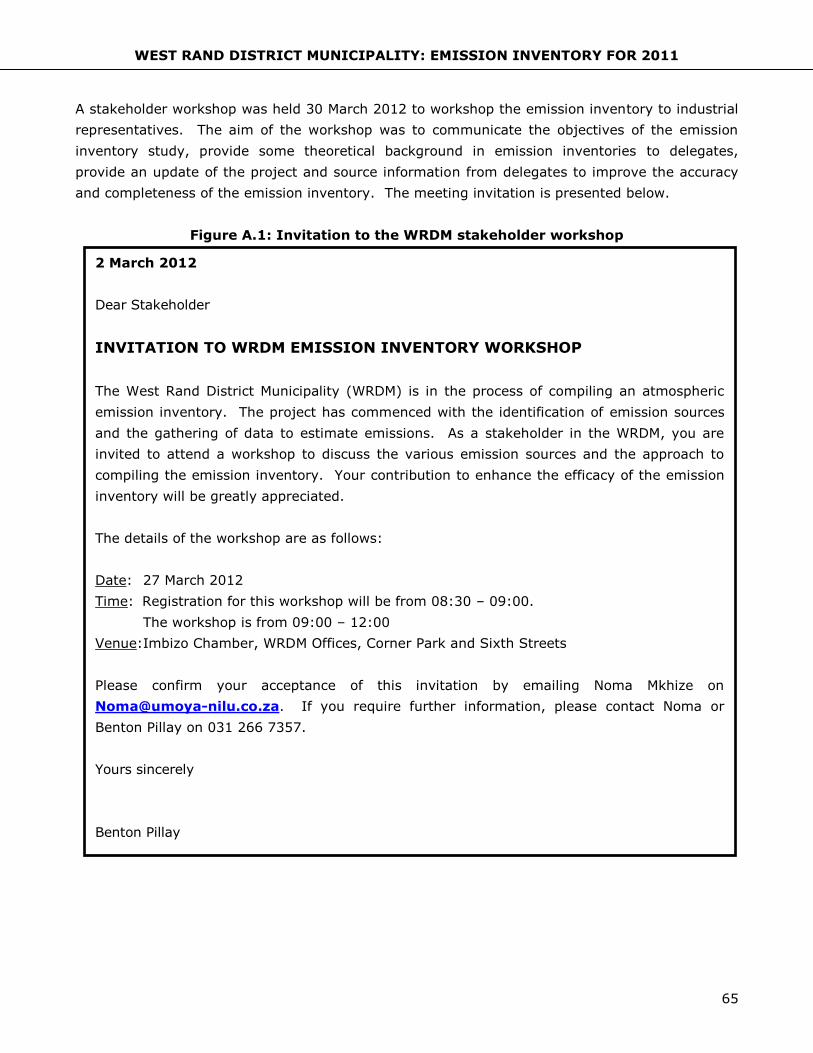
WEST RAND DISTRICT MUNICIPALITY: EMISSION INVENTORY FOR 2011
65
A stakeholder workshop was held 30 March 2012 to workshop the emission inventory to industrial
representatives. The aim of the workshop was to communicate the objectives of the emission
inventory study, provide some theoretical background in emission inventories to delegates,
provide an update of the project and source information from delegates to improve the accuracy
and completeness of the emission inventory. The meeting invitation is presented below.
Figure A.1: Invitation to the WRDM stakeholder workshop
2 March 2012
Dear Stakeholder
INVITATION TO WRDM EMISSION INVENTORY WORKSHOP
The West Rand District Municipality (WRDM) is in the process of compiling an atmospheric
emission inventory. The project has commenced with the identification of emission sources
and the gathering of data to estimate emissions. As a stakeholder in the WRDM, you are
invited to attend a workshop to discuss the various emission sources and the approach to
compiling the emission inventory. Your contribution to enhance the efficacy of the emission
inventory will be greatly appreciated.
The details of the workshop are as follows:
Date: 27 March 2012
Time: Registration for this workshop will be from 08:30 – 09:00.
The workshop is from 09:00 – 12:00
Venue:Imbizo Chamber, WRDM Offices, Corner Park and Sixth Streets
Please confirm your acceptance of this invitation by emailing Noma Mkhize on
[email protected]. If you require further information, please contact Noma or
Benton Pillay on 031 266 7357.
Yours sincerely
Benton Pillay
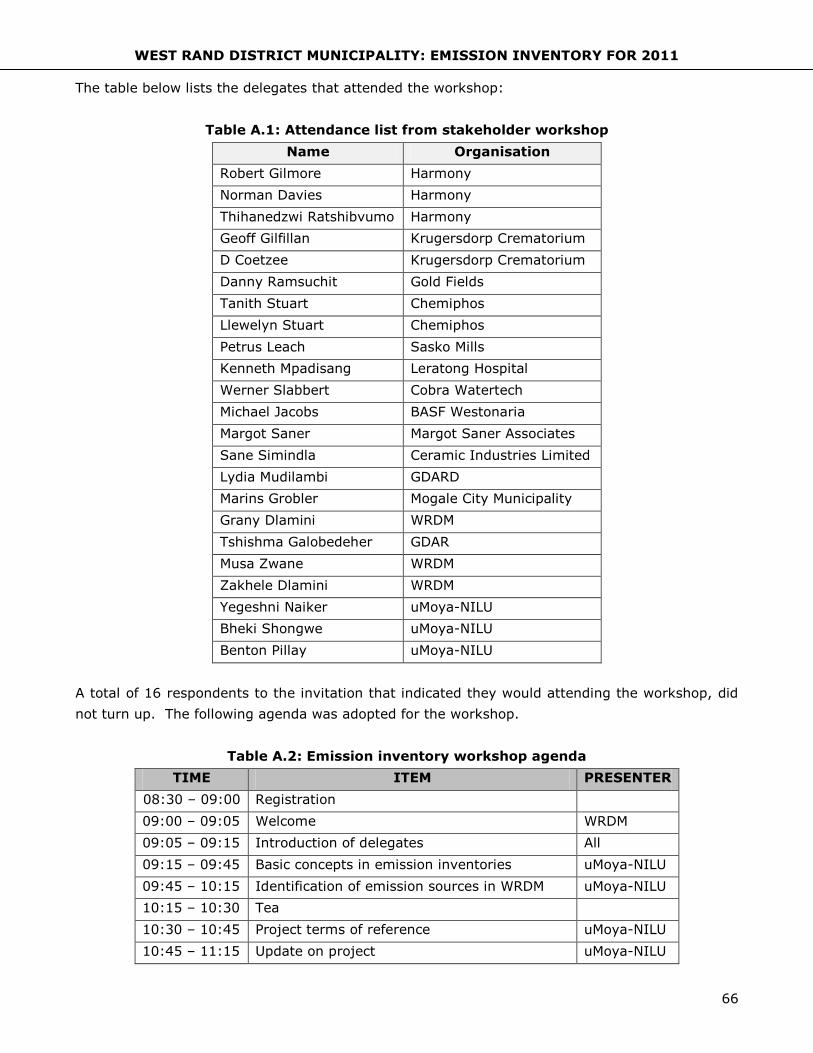
WEST RAND DISTRICT MUNICIPALITY: EMISSION INVENTORY FOR 2011
66
The table below lists the delegates that attended the workshop:
Table A.1: Attendance list from stakeholder workshop
Name Organisation
Robert Gilmore Harmony
Norman Davies Harmony
Thihanedzwi Ratshibvumo Harmony
Geoff Gilfillan Krugersdorp Crematorium
D Coetzee Krugersdorp Crematorium
Danny Ramsuchit Gold Fields
Tanith Stuart Chemiphos
Llewelyn Stuart Chemiphos
Petrus Leach Sasko Mills
Kenneth Mpadisang Leratong Hospital
Werner Slabbert Cobra Watertech
Michael Jacobs BASF Westonaria
Margot Saner Margot Saner Associates
Sane Simindla Ceramic Industries Limited
Lydia Mudilambi GDARD
Marins Grobler Mogale City Municipality
Grany Dlamini WRDM
Tshishma Galobedeher GDAR
Musa Zwane WRDM
Zakhele Dlamini WRDM
Yegeshni Naiker uMoya-NILU
Bheki Shongwe uMoya-NILU
Benton Pillay uMoya-NILU
A total of 16 respondents to the invitation that indicated they would attending the workshop, did
not turn up. The following agenda was adopted for the workshop.
Table A.2: Emission inventory workshop agenda
TIME ITEM PRESENTER
08:30 – 09:00 Registration
09:00 – 09:05 Welcome WRDM
09:05 – 09:15 Introduction of delegates All
09:15 – 09:45 Basic concepts in emission inventories uMoya-NILU
09:45 – 10:15 Identification of emission sources in WRDM uMoya-NILU
10:15 – 10:30 Tea
10:30 – 10:45 Project terms of reference uMoya-NILU
10:45 – 11:15 Update on project uMoya-NILU
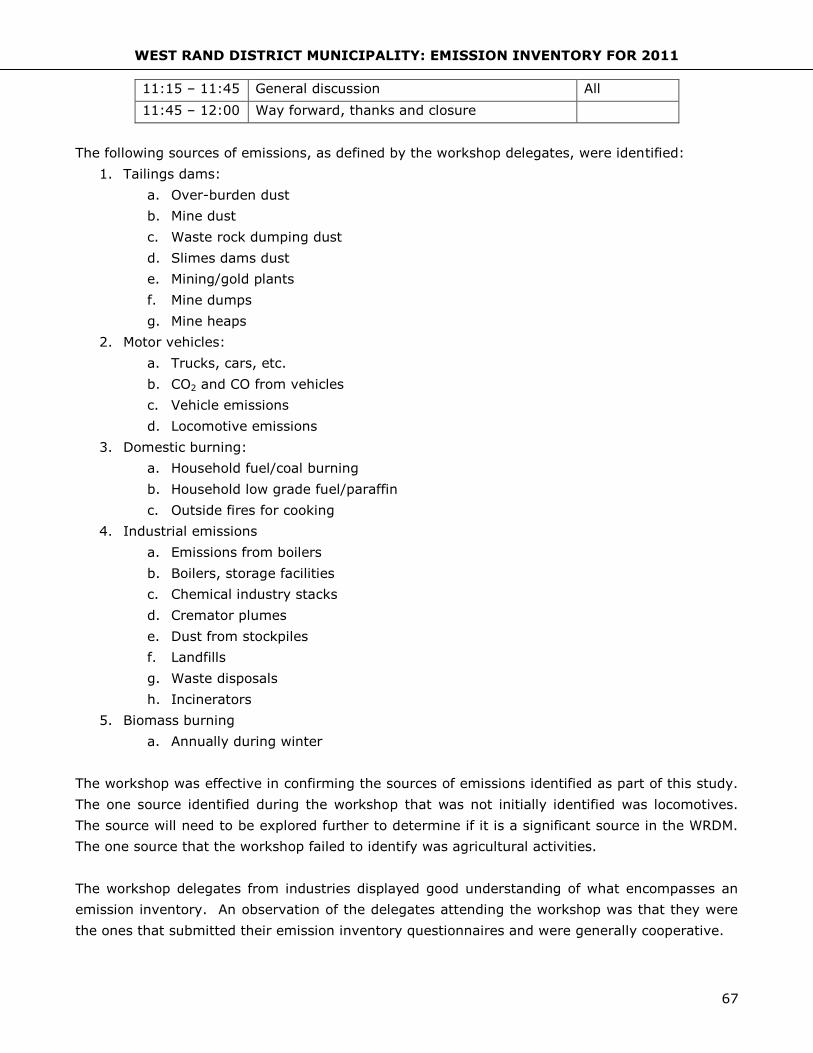
WEST RAND DISTRICT MUNICIPALITY: EMISSION INVENTORY FOR 2011
67
11:15 – 11:45 General discussion All
11:45 – 12:00 Way forward, thanks and closure
The following sources of emissions, as defined by the workshop delegates, were identified:
1. Tailings dams:
a. Over-burden dust
b. Mine dust
c. Waste rock dumping dust
d. Slimes dams dust
e. Mining/gold plants
f. Mine dumps
g. Mine heaps
2. Motor vehicles:
a. Trucks, cars, etc.
b. CO2 and CO from vehicles
c. Vehicle emissions
d. Locomotive emissions
3. Domestic burning:
a. Household fuel/coal burning
b. Household low grade fuel/paraffin
c. Outside fires for cooking
4. Industrial emissions
a. Emissions from boilers
b. Boilers, storage facilities
c. Chemical industry stacks
d. Cremator plumes
e. Dust from stockpiles
f. Landfills
g. Waste disposals
h. Incinerators
5. Biomass burning
a. Annually during winter
The workshop was effective in confirming the sources of emissions identified as part of this study.
The one source identified during the workshop that was not initially identified was locomotives.
The source will need to be explored further to determine if it is a significant source in the WRDM.
The one source that the workshop failed to identify was agricultural activities.
The workshop delegates from industries displayed good understanding of what encompasses an
emission inventory. An observation of the delegates attending the workshop was that they were
the ones that submitted their emission inventory questionnaires and were generally cooperative.
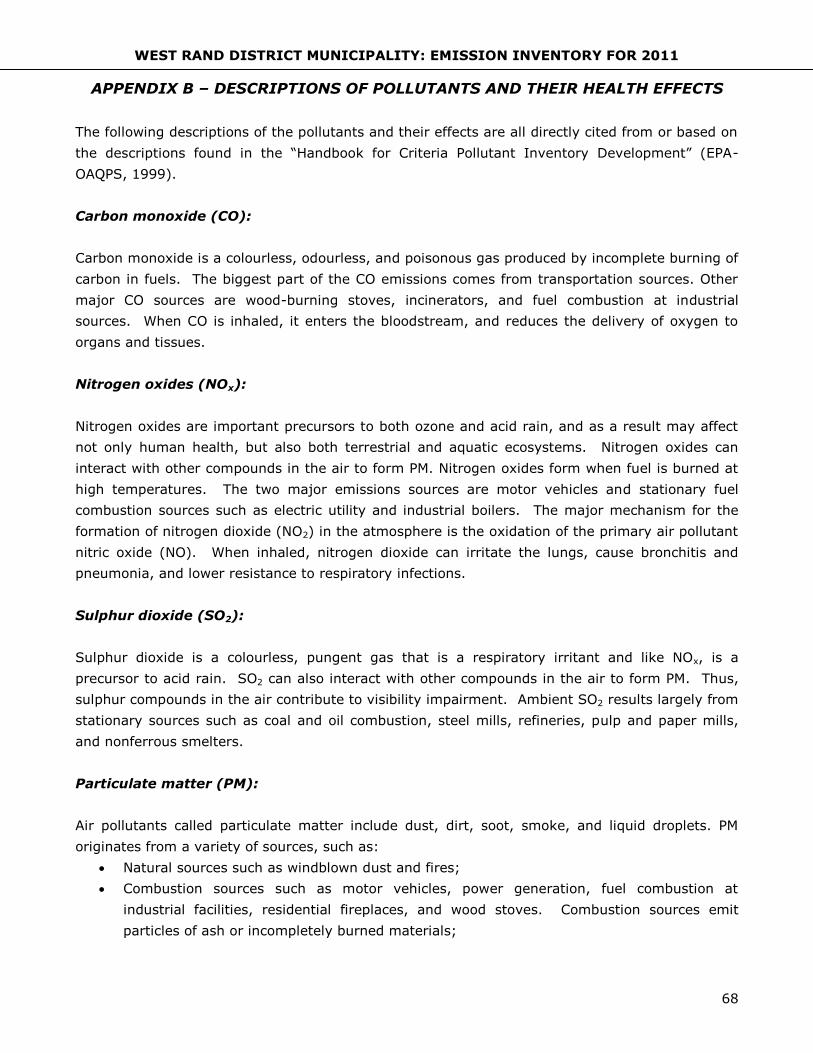
WEST RAND DISTRICT MUNICIPALITY: EMISSION INVENTORY FOR 2011
68
APPENDIX B – DESCRIPTIONS OF POLLUTANTS AND THEIR HEALTH EFFECTS
The following descriptions of the pollutants and their effects are all directly cited from or based on
the descriptions found in the “Handbook for Criteria Pollutant Inventory Development” (EPA-
OAQPS, 1999).
Carbon monoxide (CO):
Carbon monoxide is a colourless, odourless, and poisonous gas produced by incomplete burning of
carbon in fuels. The biggest part of the CO emissions comes from transportation sources. Other
major CO sources are wood-burning stoves, incinerators, and fuel combustion at industrial
sources. When CO is inhaled, it enters the bloodstream, and reduces the delivery of oxygen to
organs and tissues.
Nitrogen oxides (NOx):
Nitrogen oxides are important precursors to both ozone and acid rain, and as a result may affect
not only human health, but also both terrestrial and aquatic ecosystems. Nitrogen oxides can
interact with other compounds in the air to form PM. Nitrogen oxides form when fuel is burned at
high temperatures. The two major emissions sources are motor vehicles and stationary fuel
combustion sources such as electric utility and industrial boilers. The major mechanism for the
formation of nitrogen dioxide (NO2) in the atmosphere is the oxidation of the primary air pollutant
nitric oxide (NO). When inhaled, nitrogen dioxide can irritate the lungs, cause bronchitis and
pneumonia, and lower resistance to respiratory infections.
Sulphur dioxide (SO2):
Sulphur dioxide is a colourless, pungent gas that is a respiratory irritant and like NOx, is a
precursor to acid rain. SO2 can also interact with other compounds in the air to form PM. Thus,
sulphur compounds in the air contribute to visibility impairment. Ambient SO2 results largely from
stationary sources such as coal and oil combustion, steel mills, refineries, pulp and paper mills,
and nonferrous smelters.
Particulate matter (PM):
Air pollutants called particulate matter include dust, dirt, soot, smoke, and liquid droplets. PM
originates from a variety of sources, such as:
Natural sources such as windblown dust and fires;
Combustion sources such as motor vehicles, power generation, fuel combustion at
industrial facilities, residential fireplaces, and wood stoves. Combustion sources emit
particles of ash or incompletely burned materials;
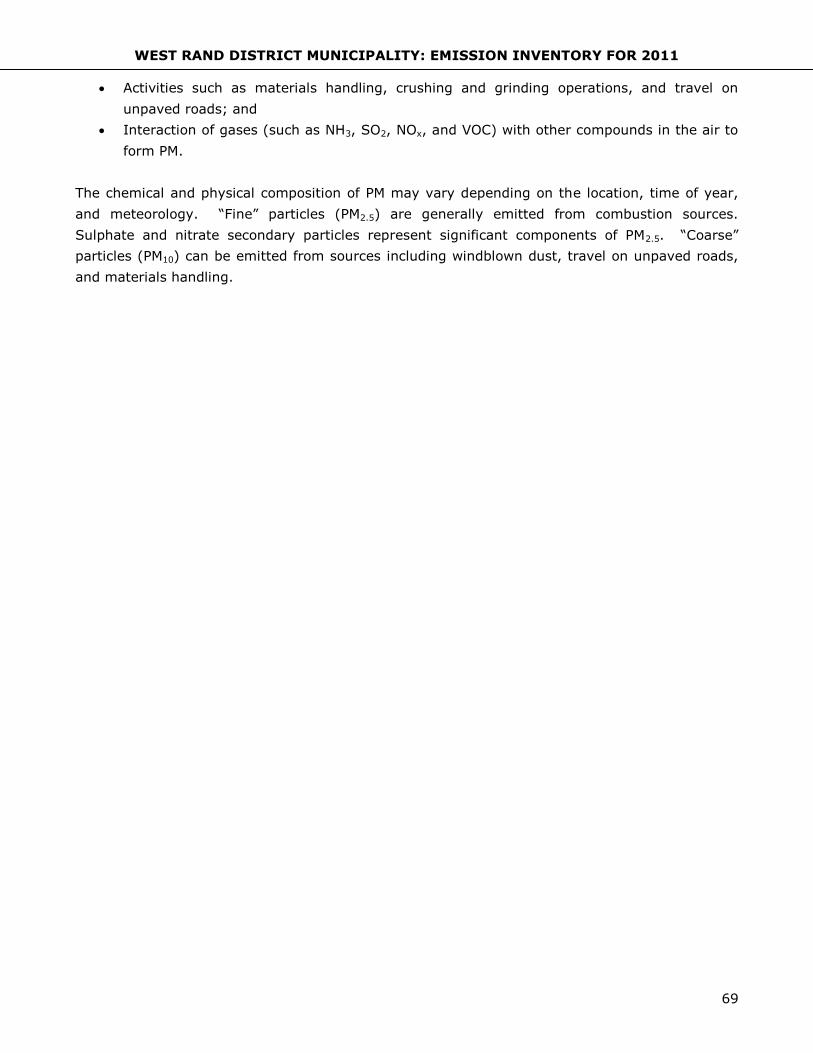
WEST RAND DISTRICT MUNICIPALITY: EMISSION INVENTORY FOR 2011
69
Activities such as materials handling, crushing and grinding operations, and travel on
unpaved roads; and
Interaction of gases (such as NH3, SO2, NOx, and VOC) with other compounds in the air to
form PM.
The chemical and physical composition of PM may vary depending on the location, time of year,
and meteorology. “Fine” particles (PM2.5) are generally emitted from combustion sources.
Sulphate and nitrate secondary particles represent significant components of PM2.5. “Coarse”
particles (PM10) can be emitted from sources including windblown dust, travel on unpaved roads,
and materials handling.

WEST RAND DISTRICT MUNICIPALITY: EMISSION INVENTORY FOR 2011
70
APPENDIX C – EMISSION INVENTORY QUESTIONNAIRE

WEST RAND DISTRICT MUNICIPALITY: EMISSION INVENTORY FOR 2011
71
1. GENERAL COMPANY INFORMATION
1.1 Name of company:
1.2 Physical address:
1.3 Postal address:
1.4 Name of contact person:
1.5 Title of contact person:
1.6 Telephone number of contact person:
1.7 Fax number of contact person:
1.8 E-mail address of contact person:
1.9 Number of Employees:
1.10 Approximate site coordinates - X: Y:
1.11 Nature of business:
1.12 S.21 Category and sub-category:
1.13 Total Plant emissions (tons/year):
SO2
NOX
CO
PM10
PM2.5 Lead VOC
1.14 Normal Operating
Schedule
1.15 Monthly Throughput (% of total for year – must add up to
100 %)
Hrs/Day Days/
Wk Wk/Yr Jan Feb Mar Apr May Jun Jul Aug Sep Oct Nov Dec
Questionnaires to be submitted within 1 month from date of receipt to Noma Mkhize on fax
number on email [email protected]. In case of queries, Noma can be reached on 031 266
7357.
For official use only
Facility I.D.: Revision: Date Received:

WEST RAND DISTRICT MUNICIPALITY: EMISSION INVENTORY FOR 2011
72
2. POINT SOURCE DATA
2.1 Stack Data
Stack
Name/No.
X
Coordinate
Y
Coordinate
Stack
Height
Stack
Diameter
Exit Gas
Temp.
(oC)
Exit Gas
Velocity
(m/s)
Exit Gas
Flow Rate
(m3/s)
e.g. S111
E
N 57 m 2.5 m 156 15 74
2.2. Cleaning Device Data
Stack
Name/No. Cleaning Device Type
Component
Removed
Cleaning
Device
Availability
(%)
Cleaning
Efficiency
e.g. S111 Electrostatic Precipitator PM10 80% 85%
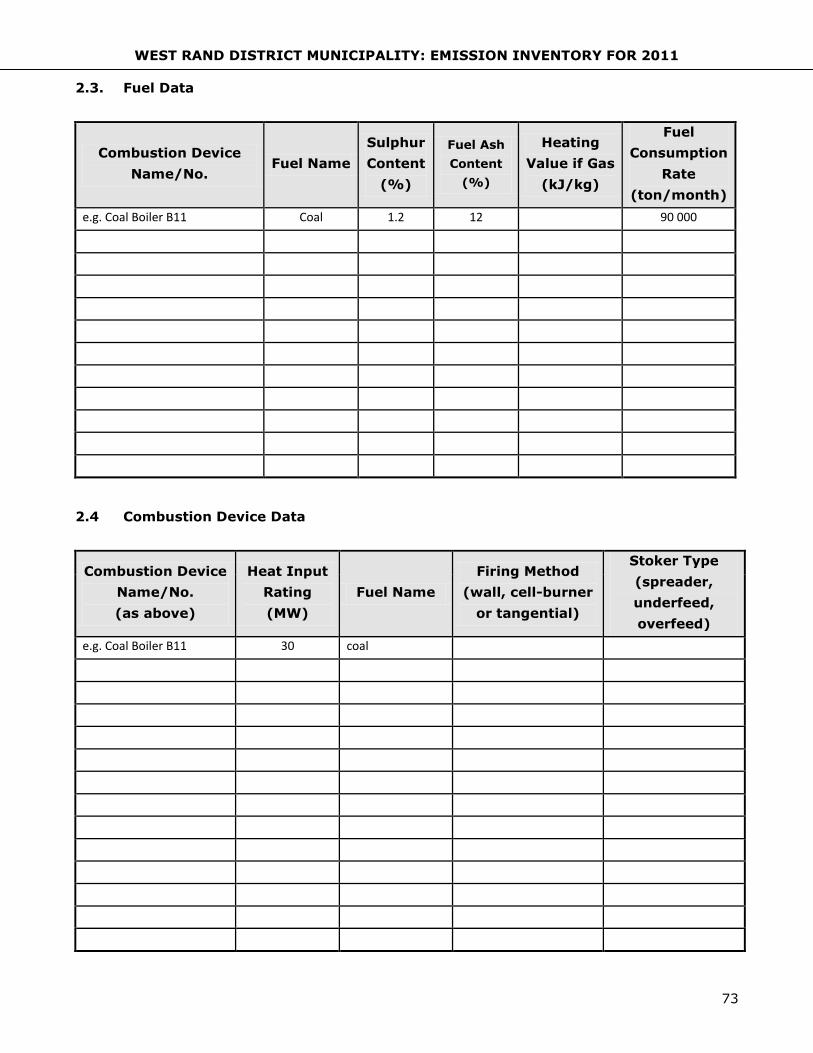
WEST RAND DISTRICT MUNICIPALITY: EMISSION INVENTORY FOR 2011
73
2.3. Fuel Data
Combustion Device
Name/No. Fuel Name
Sulphur
Content
(%)
Fuel Ash
Content
(%)
Heating
Value if Gas
(kJ/kg)
Fuel
Consumption
Rate
(ton/month)
e.g. Coal Boiler B11 Coal 1.2 12 90 000
2.4 Combustion Device Data
Combustion Device
Name/No.
(as above)
Heat Input
Rating
(MW)
Fuel Name
Firing Method
(wall, cell-burner
or tangential)
Stoker Type
(spreader,
underfeed,
overfeed)
e.g. Coal Boiler B11 30 coal

WEST RAND DISTRICT MUNICIPALITY: EMISSION INVENTORY FOR 2011
74
2.5. Process Production Data
Process
Name/No.
Product
Produced
Production
Rate
(ton/month)
Listed Activity
Category – S.21
Year of
Validity
2.6. Process Emission Data
Please add additional rows if required.
Process
Name/No.
Stack
Name/No.
(leave
blank if no
stack)
Pollutant
Emitted
Emission
Rate
(kg/year)
Basis of Calculation
(Measurement,
emission factor,
mass balance)
Year of
Validity
e.g. Coal Boiler B11 S111
SO2 2840 CEM
2010
NOx 607 Emission factor - USEPA
CO 485 Emission factor – USEPA
PM10 19 Mass balance
NMVOC 12 Emission factor – USEPA
Pb 0,56 Emission factor – Corinair

WEST RAND DISTRICT MUNICIPALITY: EMISSION INVENTORY FOR 2011
75
3. AREA SOURCE DATA
Process
Name/No.
Listed
Activity
Category –
S.21
Component
Emitted
Emission
Rate
(kg/year)
Year of
Validity
Co-ordinates of Boundary of Process Area
1 2 3 4
X Y X Y X Y X Y
E.g.
Final Product Tank
Storage
2.2
Benzene 123
2009
58.92" N
42.39" E
2
58.88" N
51.37" E
47.66" N
51.19" E
48.87" N
42.32" E
Toluene 710
Ethybenzene 34
Xylene 344

WEST RAND DISTRICT MUNICIPALITY: EMISSION INVENTORY FOR 2011
76
4. DECLARATION
I, the undersigned, hereby declare that I have personally examined and I am familiar
with the information and statements herein and further certify this information and
statements are true, accurate and complete.
Name of person completing form:
Designation:
Signature:
Date:
Name of authorised company representative:
Designation:
Signature:
Date:
WEST RAND DISTRICT MUNICIPALITY: EMISSION INVENTORY FOR 2011
77
APPENDIX D - GUIDELINE DOCUMENT

WEST RAND DISTRICT MUNICIPALITY: EMISSION INVENTORY FOR 2011
78
CONFIDENTIALITY
The WRDM and uMoya-NILU respect the confidentiality of data submitted by industries
and will treat data marked accordingly as confidential. If you have any special concerns
about confidentiality, please contact uMoya-NILU.
The following information will be kept confidential if clearly marked:
Production rates
Trade secrets (information that reveals secret processes or methods of
manufacture or production)
Information not considered confidential includes:
Emission rates
Emission point data
Type of emissions control equipment
Type of emitting equipment
Information that you consider confidential should be clearly marked CONFIDENTIAL.
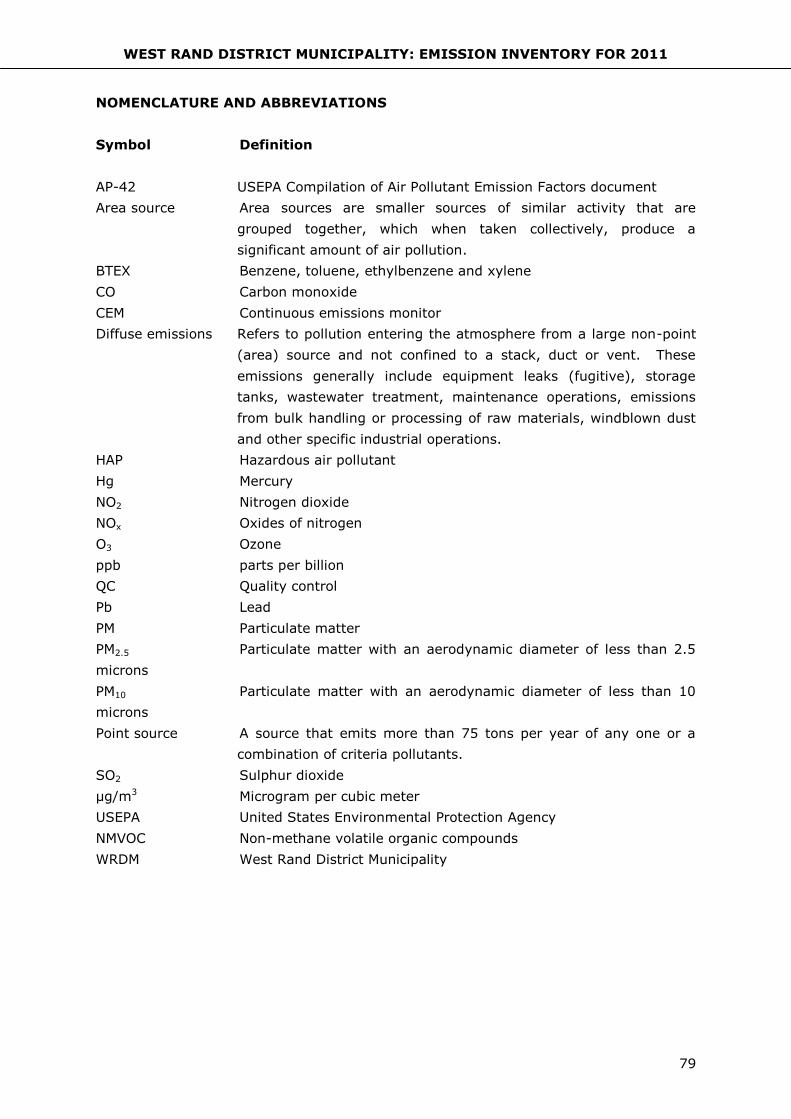
WEST RAND DISTRICT MUNICIPALITY: EMISSION INVENTORY FOR 2011
79
NOMENCLATURE AND ABBREVIATIONS
Symbol Definition
AP-42 USEPA Compilation of Air Pollutant Emission Factors document
Area source Area sources are smaller sources of similar activity that are
grouped together, which when taken collectively, produce a
significant amount of air pollution.
BTEX Benzene, toluene, ethylbenzene and xylene
CO Carbon monoxide
CEM Continuous emissions monitor
Diffuse emissions Refers to pollution entering the atmosphere from a large non-point
(area) source and not confined to a stack, duct or vent. These
emissions generally include equipment leaks (fugitive), storage
tanks, wastewater treatment, maintenance operations, emissions
from bulk handling or processing of raw materials, windblown dust
and other specific industrial operations.
HAP Hazardous air pollutant
Hg Mercury
NO2 Nitrogen dioxide
NOx Oxides of nitrogen
O3 Ozone
ppb parts per billion
QC Quality control
Pb Lead
PM Particulate matter
PM2.5 Particulate matter with an aerodynamic diameter of less than 2.5
microns
PM10 Particulate matter with an aerodynamic diameter of less than 10
microns
Point source A source that emits more than 75 tons per year of any one or a
combination of criteria pollutants.
SO2 Sulphur dioxide
µg/m3 Microgram per cubic meter
USEPA United States Environmental Protection Agency
NMVOC Non-methane volatile organic compounds
WRDM West Rand District Municipality

WEST RAND DISTRICT MUNICIPALITY: EMISSION INVENTORY FOR 2011
80
TABLE OF CONTENTS
FOREWORD 3
1. GENERAL COMPANY INFORMATION 4
2. STACK DATA 4
3. CLEANING DEVICE DATA 4
4. FUEL DATA 5
5. COMBUSTION DEVICE DATA 5
6. PRODUCTION DATA 5
7. PROCESS EMISSION DATA 6

WEST RAND DISTRICT MUNICIPALITY: EMISSION INVENTORY FOR 2011
81
FOREWORD
The West Rand District Municipality (WRDM) is compiling a comprehensive emission
inventory of emissions in the district municipality. The emissions inventory will contain
data on point and non-point (area) sources. The WRDM has enlisted the services of
uMoya-NILU to complete this project.
An emissions inventory details the amounts and types of air pollutants released into the
air. It is a comprehensive listing by source of air pollution emissions. The emissions
inventory questionnaire serves as the principle means of gathering data from industries.
In summary, the questionnaire includes general information on the industry, stack data,
cleaning device data, process fuel consumption data, fuel burning process data and
process emission data. This guideline is intended to assist industries in completing the
various sections of the questionnaire.
The pollutants that fall within the scope of this project are the so-called criteria and
hazardous air pollutants (HAPs). Criteria pollutants are the six most commonly found air
pollutants that can harm human health or the environment. They include:
Sulphur dioxide (SO2)
Nitrogen oxides (NOx)
Particulate matter (PM)
Carbon monoxide (CO)
Lead (Pb)
The USEPA has listed 187 HAPs which cause or may cause cancer or other serious health
effects. However, their effects normally occur at high concentrations or concentrations
not commonly found in the ambient environment. Most HAPs are organic in nature,
although non-organic toxics also exist e.g. mercury, hydrogen sulphide and hydrogen
fluoride. The complete list of toxic air pollutants can be accessed on the USEPA website
on the following link:
http://www.epa.gov/ttn/atw/188polls.html
The project focuses on two types of industry sources, namely, point sources and area
sources. Point source emissions are released from stacks and are generally of a high
emission rate. Area source emissions, on the other hand, originate from a large area
and are smaller than point source emissions. Typical examples of area sources are
storage tanks or landfills.
Please note that the inventory is for the year 2010. All information provided must
therefore be relevant to 2010. Do not provide information based on future plans for
reduction.

WEST RAND DISTRICT MUNICIPALITY: EMISSION INVENTORY FOR 2011
82
Questionnaires are to be submitted within 1 month from date of receipt to Noma Mkhize
on email [email protected]. In case of queries, Noma can be contacted on 031 266
7357.

WEST RAND DISTRICT MUNICIPALITY: EMISSION INVENTORY FOR 2011
83
1. GENERAL COMPANY INFORMATION
1.1 to 1.9
Fill in the business details of your company in the spaces provided on the form.
1.10 Fill in the latitude and longitude (Y and X coordinates) that represents the central
point of your company’s premises. This information can be obtained from Google Earth.
1.11 Provide a concise description of the business activity of your company.
1.12 Select the category and sub-category from the table below for point and area
sources that best describes your company:
Table 1.1: Section 21 Listed Activities
CATEGORY SUB-CATEGORY
1. Combustion Installations 1.1 Solid fuel combustion installations
1.2 Liquid fuel combustion installations
1.3 Solid biomass combustion installations
1.4 Gas combustion installations
2. Petroleum industry, the
production of gaseous and
liquid fuels as well as
petrochemicals from crude oil,
gas and biomass
2.1 Combustion installations
2.2 Storage and handling of petroleum
products
2.3 Industry fuel oil recyclers
3. Carbonisation and coal
gasification
3.1 Combustion installations
3.2 Coke production and coal gasification
3.3 Tar production
3.4 Char, charcoal and carbon black
production
3.5 Electrode paste production
4. Metallurgical industry
4.1 Drying
4.2 Combustion installations
4.3 Primary aluminium production
4.4 secondary aluminium production
4.5 Sinter plants
4.6 Basic oxygen furnace steel making
4.7 Electric arc furnace and steel making
(primary and secondary)
4.8 Blast furnace operations
4.9 Ferro-alloy production
4.10 Foundries
4.11 Agglomeration operations
4.12 Pre-reduction and direct reduction
4.13 Lead smelting
4.14 Production and processing of zinc, nickel
and cadmium
4.15 Processing of arsenic, antimony, beryllium,
chromium and silicon
4.16 Smelting and converting of sulphide ores
4.17 Precious and base metal production and
refining

WEST RAND DISTRICT MUNICIPALITY: EMISSION INVENTORY FOR 2011
84
4.18 Vanadium ore processing
4.19 Production and casting of bronze and
brass, ands casting copper
4.20 Slag processes
4.21 Metal recovery
4.22 Hot dip galvanising
4.23 Metal spray
5. Mineral Processing, Storage
and Handling
5.1 Storage and handling of ore and coal
5.2 Clamp kilns for brick production
5.3 Cement production (using conventional
fuels and raw materials)
5.4 Cement production (using alternate fuels
and/or resources)
5.5 Lime production
5.6 Glass and mineral wool production
5.7 Ceramic production
5.8 Macadam preparation
5.9 Alkali processes
6. Organic chemicals industry 6.1 Organic chemicals manufacturing
7. Inorganic chemicals industry 7.1 Primary production and use in
manufacturing of ammonia, fluorine,
chlorine, and hydrogen cyanide
7.2 Primary production of acids
7.3 Primary production of chemical fertiliser
7.4 manufacturing activity involving the
production, use in manufacturing or
recovery of antimony, arsenic, beryllium,
cadmium, chromium, cobalt, lead,
mercury, selenium, by the application of
heat
7.5 Production of calcium carbide
7.6 Production of phosphorus and phosphorus
salts not mentioned elsewhere
8. Disposal of hazardous and
general waste
9. Pulp and paper manufacturing
activities, including by-products
recovery
9.1 Lime recovery kilns
9.2 Alkali waste chemical recovery furnaces
9.3 Copeland alkali waste chemical recovery
process
9.4 Chlorine dioxide plant
9.5 Wood drying and the production of
manufactured wood products
10. Animal matter processing
1.13 Fill in the total pollutant or bubble emissions from all the processes in your
company. Use the information from Section 7 by adding the totals for each pollutant.
1.14 & 1.15
The objective of operating schedule data is to ensure that calculations for emission rates
are more accurate. Emission rate equations using the emission factor method take into
account the number of operational hours per day, the number of operational days per
week and the number of operational weeks per year.

WEST RAND DISTRICT MUNICIPALITY: EMISSION INVENTORY FOR 2011
85
Monthly throughput data is necessary to obtain a finer resolution for emission rates by
month versus annual emission rates that are normally reported. This information is
important since not all processes are operational continuously throughout the year.
Monthly emission rate data is especially useful for dispersion modelling purposes. The
results of modelling could be used to highlight varying trends in monthly air quality
levels.
2. POINT SOURCE DATA
The information required in this section relates to emissions from stacks, which are
generally regarded as point sources.
2.1 Stack Data
An important input into air dispersion models is stack data. The coordinates (latitudes
and longitudes) of the stack are required to plot them on GIS maps. Furthermore, stack
data is an important input into air dispersion models.
Fill in the data as detailed in Section 2 of the questionnaire for every stack on your
premises. The stack name or number is a company specific name or number that you
use to identify the stack. If your stack is a square stack, provide the dimensions at the
stack exit point.
2.2 Cleaning Device Data
Identify the pollution control equipment or devices used to control emissions in your
processes. Provide details including the percent cleaning efficiency, associated stack
number, etc. of the cleaning devices that your company is currently using. Review
operational records to determine the historical availability of your cleaning devices.
Cleaning devices inevitably need to be decommissioned for maintenance related
activities. This compromises the availability of the cleaning device. Cleaning efficiency
does not always meet design specification. In this case, report cleaning efficiency based
on trial run data and actual performance measurements.
The following are examples of cleaning device technologies:
Electrostatic precipitator
Water/steam injection (gas turbines)
Fabric filter
Lean/staged combustion
Scrubber
Flue gas recirculation
Cyclone
Biofilter

WEST RAND DISTRICT MUNICIPALITY: EMISSION INVENTORY FOR 2011
86
Low NOx burner
Activated carbon filter
Selective catalytic reduction
Selective non-catalytic reduction
Incinerator
2.3 Fuel Data
The combustion of fuels results in the production of gaseous and particulate air
pollutants. It is necessary to identify the various types of fuels used in your processes.
For every process, list the type of fuel used and the consumption rate of the fuel. Some
of the common fuels include:
Bituminous coal
Heavy fuel oil
Light fuel oil
Marine fuel oil
Diesel
Jet fuel/kerosene
Paraffin
Fuel gas
Methane-rich gas
LPG
Wood
Also provide an estimation of the sulphur content, heating value and ash content of the
various fuel types used.
2.4 Combustion Device Data
Information on the firing method, heating value of fuel used, and stoker type of the
combustion devices will assist in selecting the most appropriate emission factor for the
emission rate calculation. The USEPA reports emission factors as a function of firing
method and type of burners used. Please provide information relating to the maximum
operating period for the various sources. Be sure to include the maximum number of
hours per day and days per week the fuel burning appliance will operate for.
2.5 Process Production Data
Air emissions do not only originate from the combustion of fuels. There are several non-
combustion type processes that give rise to air pollution. For example, the production of
sulphuric acid using elemental sulphur as a raw material results in the formation of
sulphur dioxide as a process emission. The oil refining industry produces sulphur dioxide
as a process emission from catalytic crackers.

WEST RAND DISTRICT MUNICIPALITY: EMISSION INVENTORY FOR 2011
87
The primary objective of this section is to identify those processes in your company that
cause air pollution, whether or not they are combustion type processes. The production
rates of these processes are required to assist in selecting the correct emission factors.
2.6 Process Emission Data
Emission Estimation Techniques:
This section requires a listing of all the processes in your company together with the
emissions resulting from those processes and their emission rates. Please report on the
emissions of criteria and toxic air pollutants:
The following is a list of criteria pollutants:
SO2
NOx
CO
PM
Lead
If possible, speciate the PM into PM10 and PM2.5 if the particle size distribution of your
particulate emissions are known. These particles have aerodynamic diameters of less
than 10 and 2.5 microns, which make them small enough to enter the lungs and cause
negative health effects.
The USEPA has listed 187 HAPs (see Foreword for website link). Please also report the
emissions of these pollutants if your facility produces any of them. Several of these
toxic air pollutants are volatile organic compounds (VOCs). Please report on the
emissions of volatile organic compounds from the various processes in your facility.
Please mention the basis for the estimation. In general, there are four types of emission
estimates techniques (EET) that may be used to estimate emissions from your facility.
The four types are:
Mass balance
Engineering calculations
Direct measurement or
Emission factors
Select the EET that is most appropriate for your facility. For example, the mass balance
option may be chosen to best estimate the fugitive particulate emissions from stockpiles,
direct measurement option for losses from pumps and flanges and the emission factors
option when estimating losses from storage tanks.
It is important to note that EETs relate principally to average process emissions.
Emissions resulting from non-routine events are rarely routinely included in EETs.
WEST RAND DISTRICT MUNICIPALITY: EMISSION INVENTORY FOR 2011
88
However, it is important to recognise that emissions resulting from significant operating
excursions and/or accidental situations e.g. flaring events, spills etc. will also need to be
estimated and added to process emissions when calculating total emissions for reporting
purposes.
All the sources of releases into the air must be specified. Describe the equipment or
type of operation that will be generating the emission, e.g. sandblasting operations,
flaring, tank storage, chemical processing, incineration, etc. The estimated annual
emissions in tons per year for each component must also be calculated and submitted.
Examples of procedures used to calculate emission estimates are outlined below:
a) Emissions from combustion sources:
Multiply the maximum input firing rate of the combustion equipment in Giga Joules per
hour, or the maximum rate of discharge by the emission factors for the appropriate fuel
used, multiplied by the maximum duration of operation. Express the contaminant
estimate in tons per year, e.g. sulphur dioxide (ton/year):
Natural gas fired industrial boiler, 155.5 GJ/h, low NOx burner controlled:
15.5 GJ/h x (2.57 g/GJ suspended + 3.11 g/GJ condensable) x 16 hours/day x 6
days/week x 52 weeks/year x 16-6 tons/g = 0.44 ton/year.
b) Emissions from solvent emitting sources:
Multiply the projected or last year’s annual solvent use by the product density and
percent volatility as provided on the Material Safety Data Sheets from the supplier, e.g.
total organic compounds, TOC (ton/year):
5000 litres/year x 0.88 kg/L density x 40% volatile x 10-3 tons/kg = 1.76 tons/year
The amount (kg per ton) and concentration (mg/per m³) of each relevant component of
the emissions shall be specified. (Other units may be used if this is more appropriate).
If the operation concerns facilities that are already operative, both the current amounts
released and the amounts expected in the future shall be stated.
If the amounts released vary with time, both the maximum and average emission rates
must be stated.
Specify the averaging period for mean amounts per time unit and concentration. This
may for example be one hour, one shift (8 hours), 24 hours, one week or one year,
depending on the pattern of operations and the parameters in question.
The averaging period for the maximum emission rate must also be specified.
Instantaneous measurements or rates per 15 minutes, per hour or per 24-hour period
may be used depending on both the pattern of operations and the method of
measurement.

WEST RAND DISTRICT MUNICIPALITY: EMISSION INVENTORY FOR 2011
89
c) An example of a calculation using the mass balance technique:
A ferromanganese smelter is in the initial stages of its EIA prior to commissioning. An
air quality assessment is required for the plant’s Air Emissions Licence (AEL)
application, which needs to be submitted with the EIA. This application must include
dispersion modelling. The plant is not yet in operation, so no emission data is
available. A mass balance has been drawn up by the Process Engineer of a similar plant
with an identical process. The plant will process 30 tons of ore per day, 7 days per
week. According to the mass balance, 11.5 kg of particulates (as Mn) is given off for
every 1496.6 kg of material input. This is considered to be the only particulate
emission from this process. The plant will be fitted with a bag-house that typically
operates at a 98% efficiency.
E = A X EF X {1- (ER/100)}
Where, E - Emission rate (g/s)
A - Activity rate (tons per second)
EF - Emission factor (g/ton)
ER - Emission reduction efficiency (%)
A = 30 tons per day / 86400 (tons per second)
EF = 11 500 (g/ton)
ER = 98 (%)
Therefore:
E = 0.000347 x 11 500 x {1- (98/100)}
= 0.07981 g/s
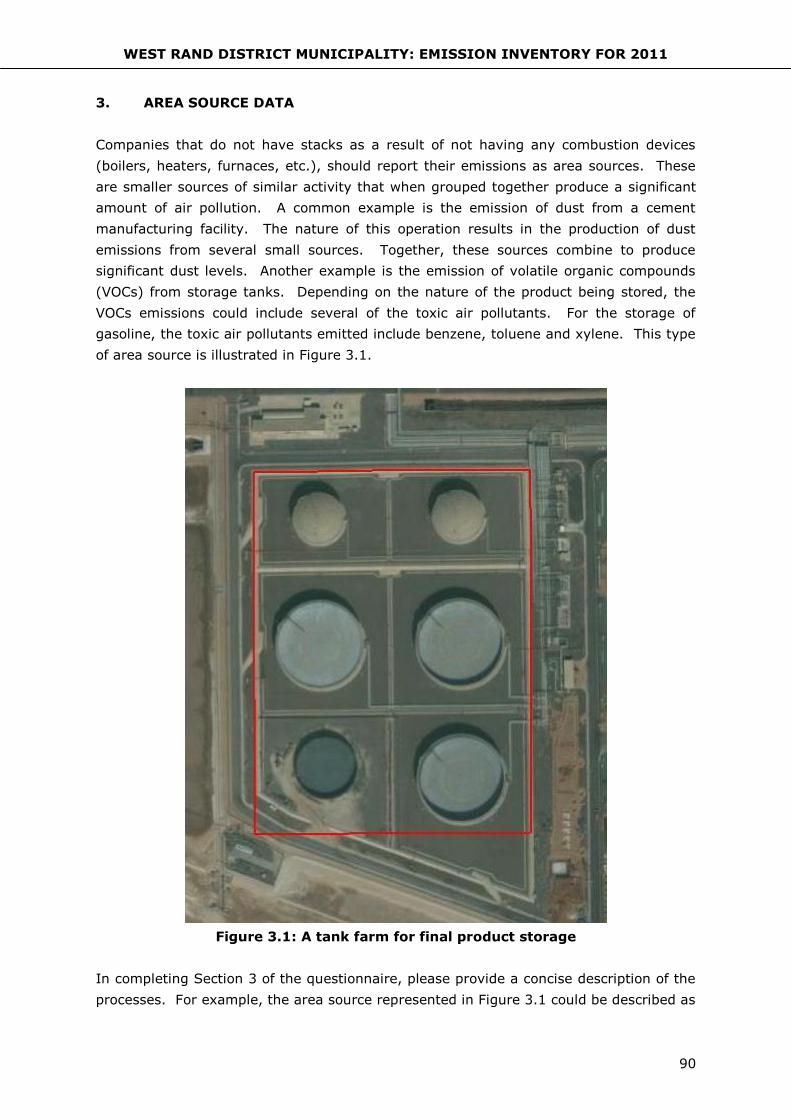
WEST RAND DISTRICT MUNICIPALITY: EMISSION INVENTORY FOR 2011
90
3. AREA SOURCE DATA
Companies that do not have stacks as a result of not having any combustion devices
(boilers, heaters, furnaces, etc.), should report their emissions as area sources. These
are smaller sources of similar activity that when grouped together produce a significant
amount of air pollution. A common example is the emission of dust from a cement
manufacturing facility. The nature of this operation results in the production of dust
emissions from several small sources. Together, these sources combine to produce
significant dust levels. Another example is the emission of volatile organic compounds
(VOCs) from storage tanks. Depending on the nature of the product being stored, the
VOCs emissions could include several of the toxic air pollutants. For the storage of
gasoline, the toxic air pollutants emitted include benzene, toluene and xylene. This type
of area source is illustrated in Figure 3.1.
Figure 3.1: A tank farm for final product storage
In completing Section 3 of the questionnaire, please provide a concise description of the
processes. For example, the area source represented in Figure 3.1 could be described as

WEST RAND DISTRICT MUNICIPALITY: EMISSION INVENTORY FOR 2011
91
‘Final Product Tank Storage’. Then enter the S.21 category and sub-category relating to
the process.
Then list the pollutants emitted and their emission rates in columns 3 and 4.
The co-ordinates that define the area must then be entered. Please remember to enter
latitude and longitudes. The example of the tank farm in Figure 3.1 can be used to
illustrate this. The red rectangle defines the boundaries of the area of the tank farm.
The co-ordinates are the latitudes and longitudes of the four corners of the rectangle.
By using a similar approach, plot the approximate area of your area sources. Then
determine the co-ordinates of the 4 points of the area. If the area you have defined has
more than 4 points, supply the co-ordinates on a blank page, which must be attached to
the questionnaire. The co-ordinates for your area sources can be identified by using
Google Earth. Identify your facility in Google Earth. Then zoom in and locate the co-
ordinates of the 4 points of your area sources.

WEST RAND DISTRICT MUNICIPALITY: EMISSION INVENTORY FOR 2011
92
APPENDIX E – STORAGE TANK EMISSIONS
Description of Emissions:
Emission losses from storage tanks containing organic liquids, especially highly volatile
liquids, occur because of evaporative losses of the liquid during storage and as a result
of changes in the liquid level. The emission rates are dependent on whether the tank is
of fixed roof or floating roof configuration. The two significant types of emissions from
fixed roof tanks are standing storage losses and working losses. Standing storage loss is
the expulsion of vapour from tanks through vapour expansion and contraction, which is
the result of changes in temperature and barometric pressure. This loss occurs without
any change in liquid level in the tank. The loss from filling and emptying the tank is
called working loss. Evaporation during filling operations is a result of an increase in the
liquid level in the tank. As the liquid level increases, the pressure inside the tank
exceeds the relief pressure and vapours are expelled from the tank. Evaporative loss
during emptying occurs when air drawn into the tank during liquid removal becomes
saturated with organic vapour and expands, thus exceeding the capacity of the vapour
space.
Figure E.1: External floating roof storage tanks
The total emissions from floating roof tanks are the sum of standing storage losses and
withdrawal losses. Withdrawal losses occur as the liquid level, and thus the floating roof,
is lowered. Some liquid remains on the inner tank wall surface and evaporates.
Standing storage loss from floating roof tanks include rim seal and deck fitting losses.
Other potential standing storage loss mechanisms include breathing losses as a result of
temperature and pressure changes.
WEST RAND DISTRICT MUNICIPALITY: EMISSION INVENTORY FOR 2011
93
Emissions are naturally greater for more volatile products such as gasoline and smaller
for less volatile products such as diesel. The key emissions from refinery storage tanks
are a range of organic compounds that include hexane, benzene, toluene, ethyl benzene,
xylene, and 1,2,4 trimethyl benzene.
Methodology for Estimating Emissions:
To estimate emissions from storage tanks, the USEPA’s TANKS model was used. The
equations used in the model were developed by the American Petroleum Institute (API).
These are well-documented in Chapter 7 of the USEPA’s AP-42 2. TANKS allows the
input of specific information on storage tanks (e.g. tank type, dimensions, construction
and paint condition), liquid fuel contents, handling protocols (e.g. type of fuel, annual
product throughput and number of turnovers per year) and site-specific ambient
meteorological information. Speciation of the emission into its resultant components
was based on the composition of the components in their liquid phase. The compounds
selected for speciation were benzene, toluene, ethyl benzene and xylene.
The model also requires the input of representative meteorological data. Climatologically
representative wind, temperature, pressure and solar radiation data for South Durban
was obtained from the South African Weather Service (SAWS) and the eThekwini
Municipality.
The gathering of information for input into the TANKS model was achieved with the use
of a questionnaire that was issued to Engen. The questionnaire (see Appendix A) was
developed with the intention of sourcing information required to estimate emissions by
using the TANKS model.
The following assumptions were made in the estimation of storage tank emissions:
1. Where maximum liquid levels were not provided, a value equivalent to 95% of
tank/shell height was used.
2. Where average liquid levels were not provided, a value equivalent to 50% of
tank/shell height was used.
3. Slops were assumed to be gasoline in the TANKS model.
Results of Emissions Estimation:
The results of storage tank emission estimations are presented below for the Transnet
Pipelines Tarlton Tank Farm and Refractionator.
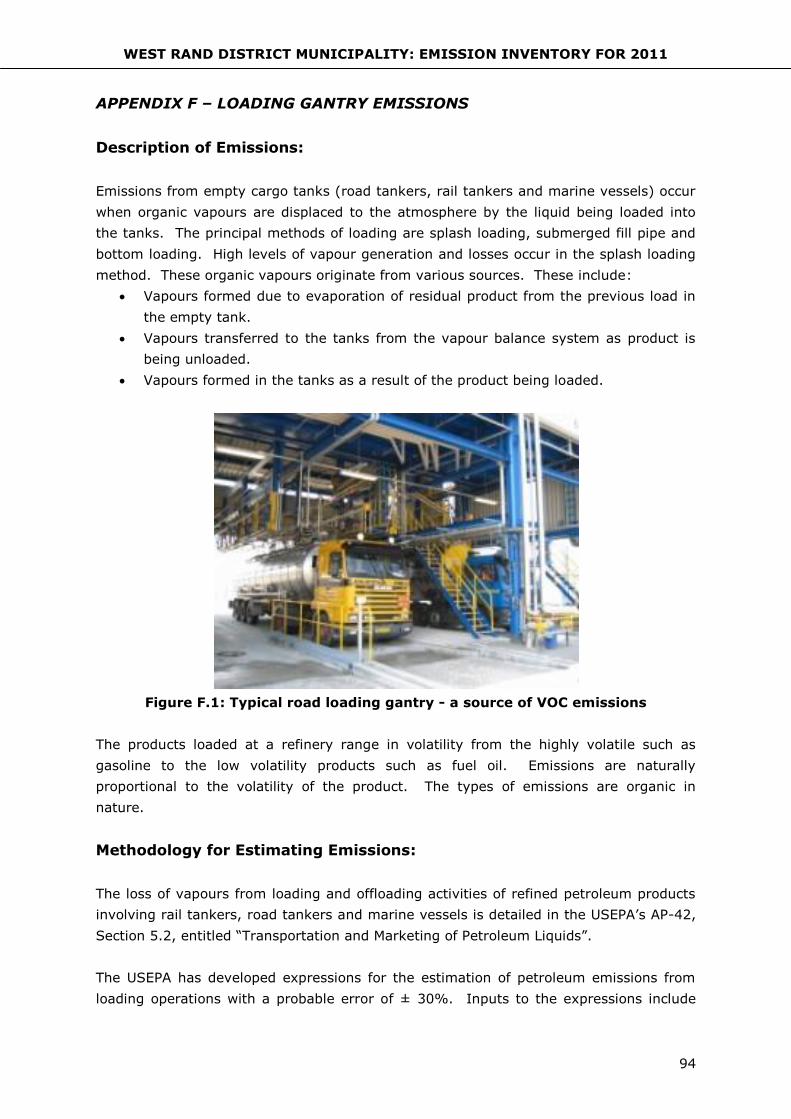
WEST RAND DISTRICT MUNICIPALITY: EMISSION INVENTORY FOR 2011
94
APPENDIX F – LOADING GANTRY EMISSIONS
Description of Emissions:
Emissions from empty cargo tanks (road tankers, rail tankers and marine vessels) occur
when organic vapours are displaced to the atmosphere by the liquid being loaded into
the tanks. The principal methods of loading are splash loading, submerged fill pipe and
bottom loading. High levels of vapour generation and losses occur in the splash loading
method. These organic vapours originate from various sources. These include:
Vapours formed due to evaporation of residual product from the previous load in
the empty tank.
Vapours transferred to the tanks from the vapour balance system as product is
being unloaded.
Vapours formed in the tanks as a result of the product being loaded.
Figure F.1: Typical road loading gantry - a source of VOC emissions
The products loaded at a refinery range in volatility from the highly volatile such as
gasoline to the low volatility products such as fuel oil. Emissions are naturally
proportional to the volatility of the product. The types of emissions are organic in
nature.
Methodology for Estimating Emissions:
The loss of vapours from loading and offloading activities of refined petroleum products
involving rail tankers, road tankers and marine vessels is detailed in the USEPA’s AP-42,
Section 5.2, entitled “Transportation and Marketing of Petroleum Liquids”.
The USEPA has developed expressions for the estimation of petroleum emissions from
loading operations with a probable error of ± 30%. Inputs to the expressions include

WEST RAND DISTRICT MUNICIPALITY: EMISSION INVENTORY FOR 2011
95
the quantities of products loaded, their vapour pressures and their molecular weights.
The expressions also require saturation factors which were determined by the USEPA
through empirical tests. Saturation factors are dependent on the type of loading. The
highest saturation factors occur for splash loading, whereas the lowest occur for
submerged and bottom loading.
The products considered in the emissions inventory are TOCs, benzene, toluene, ethyl
benzene and xylene.
The information required to estimate emissions from loading gantries was sourced from
Transnet Pipelines by using an emission inventory questionnaire.
Results of Emissions Estimation:
Data on quantities loaded at the Wentworth Depot could not be acquired by Engen
Refinery as the depot operates independently of the refinery. The Wentworth Depot was
therefore excluded from this estimation. Loading gantries at the Tara Road Depot are
not equipped with vapour capture devices. Therefore, 100% of vapour emissions
generated through loading and offloading processes enter the atmosphere. The table
below contains data used in the estimation of emissions from loading gantries.

WEST RAND DISTRICT MUNICIPALITY: EMISSION INVENTORY FOR 2011
96
APPENDIX G – FUGITIVE EMISSIONS
Description of Emissions:
Fugitive emission leaks from process equipment constitute a considerable portion of VOC
emissions from facilities that process or store organic chemicals. These emissions cause
safety problems due to their common characteristics such as flammability. The types of
equipment from which leaks typically occur are block valves, control valves, pump seals,
compressor seals, pressure relief valves, flanges and connectors, open-ended lines and
sampling connections.
Figure G.1: Process equipment which are prone to leakages
Leaks from equipment occur due to several reasons. These include sub-standard
installation of equipment (e.g. flanges not adequately tightened), general wear and tear
of equipment components (gaskets wearing out after several years in use), incorrect
selection of packing materials (incorrect type of seals used in pumps) and corrosion
(which results in reduced wall thickness). The quantity of emissions from leaking
equipment is dependent on the contents of the pipeline. The more volatile the product,
the higher the rate of product loss from the leak. Leaks are typically higher when the
products involved are light hydrocarbons. In similar vein, leaks from heavy
hydrocarbons such as fuel oil and bitumen are very low.
Methodology for Estimating Emissions:
The USEPA’s Protocol for Equipment Leak Emission Estimates presents four methods for
estimating emissions from leaking equipment, commonly referred to as fugitive
emissions. Three of the methods are dependent on the use of screening (measurement)
data. The method commonly employed to conduct measurements of fugitive emission
leak concentrations is the leak detection and repair (LDAR) programme. The
implementation of an LDAR programme is costly, but the most accurate method. Engen
contracted SNC Lavalin of Canada to undertake an LDAR programme at the refinery.

WEST RAND DISTRICT MUNICIPALITY: EMISSION INVENTORY FOR 2011
97
The programme involves the measurement of leaks on 120,000 estimated points in the
refinery.
The following components that are considered to be the major sources of fugitive
emissions, were considered for the study:
Manual valves
Control valves
Compressor seals
Agitator seals
Pressure relief valves
Flanges and connectors
Open-ended lines
Sampling points
All process lines containing less than 10% (m/m) VOCs were excluded from the study.
Fugitive emissions of VOCs are measured in accordance with USEPA Method 21 entitled
‘Determination of Volatile Organic Compound Leaks’. The measurement of VOC
concentration (in ppm) at each component was undertaken with the aid of portable
flame ionisation detector (FID).
A correlation equation was used to calculate the emission rate (mass/time) of VOCs from
a component with measured VOC concentration data serving as the primary input. The
source of the correlation equation was the ‘Protocol for Equipment Leak Emission
Estimates’. Speciation to BTEX was based on the composition of BTEX in crude oil and
was applied to the total VOC emissions, not unit-specific VOC emissions. The following
composition of the BTEX components in crude oil was used in the speciation:
Benzene – 0.6%
Toluene – 1.00%
Ethyl benzene – 0.40%
Xylene – 1.40%
Results of Emissions Estimation:
The results of the fugitive emission estimates were sourced from Engen’s Leak Detection
and Repair Program Report 5. Emissions were estimated for Units 2, 22, 41, 42, 43, 44,
45, 68 and 71, comprising a total of 60 000 points. It is estimated that there are
120,000 points in the refinery. To adjust for this shortcoming, the total emission rate
was extrapolated for 120 000 points by multiplying the emission rate estimated for
60,000 points by two.
Emissions of VOC and BEX are presented in the table below:

WEST RAND DISTRICT MUNICIPALITY: EMISSION INVENTORY FOR 2011
98
Table 13.1: Total emissions from fugitive sources
POLLUTANT
EMISSION
RATE (kg/year)
EMISSION
RATE (ton/day)
TOC 375,815.60 1.030
Benzene 2,254.89 0.006
Toluene 3,758.16 0.010
Ethyl benzene 1,503.26 0.004
Xylene 5,261.42 0.014
Total organic emissions from fugitive sources were estimated at 375.82 ton/year or 1.87
ton/day. Benzene’s emission losses contributed approximately 0.5 % or 2.25 ton/day to
this total.