Emission Estimation Technique...
23
National Pollutant Inventory Emission Estimation Technique Manual for Medicinal and Pharmaceutical Product Manufacturing
Transcript of Emission Estimation Technique...

National Pollutant Inventory
Emission EstimationTechnique Manual
for
Medicinal and PharmaceuticalProduct Manufacturing

First published in August 1998 1
Approved 25/6/98
EMISSION ESTIMATION TECHNIQUESFOR
MEDICINAL AND PHARMACEUTICAL PRODUCT MANUFACTURING
TABLE OF CONTENTS
1.0 INTRODUCTION ............................................................................................... 3
2.0 PROCESS DESCRIPTION.................................................................................. 4
2.1 Medicinals and Botanicals................................................................... 42.2 Pharmaceutical Preparations .............................................................. 42.3 In Vivo and In Vitro Diagnostic Substances, and BiologicalProducts ......................................................................................................... 4
3.0 EMISSION ESTIMATION.................................................................................. 7
3.1 Emissions To Air................................................................................... 83.2 Emissions To Water.............................................................................. 83.3 Emissions To Land................................................................................ 9
4.0 RAW MATERIAL INPUTS AND POLLUTANT OUTPUTS ................... 9
4.1 Raw Materials....................................................................................... 114.2 Estimating Emissions of Listed Substances.................................... 14
5.0 EMISSION FACTOR RATING ...................................................................... 16
6.0 EMISSION FACTORS....................................................................................... 17
7.0 CONTROL TECHNOLOGIES .......................................................................... 20
8.0 REFERENCES .................................................................................................... 22

2
Approved 25/6/98
MEDICINAL AND PHARMACEUTICAL PRODUCT MANUFACTURING
LIST OF FIGURES AND TABLES
Figure 1. Simplified Process Flow Diagram for Chemical Synthesis............ 5
Figure 2. Simplified Process Flow Diagram for Natural andBiological Extraction............................................................................... 6
Figure 3. Simplified Process Flow Diagram for the FermentationProcess ....................................................................................................... 6
Figure 4. Simplified Process Flow Diagram for Compounding andFormulating............................................................................................. 7
Table 1. Typical Material Inputs and Pollutant Outputs in thePharmaceutical Industry1,a .................................................................. 10
Table 2. Solvents Used in the Chemical Synthesis Process ........................ 12
Table 3. Solvents Used in Biological and Natural ProductExtraction................................................................................................ 13
Table 4. Solvents Used in Fermentation Processes ...................................... 13
Table 5. Solvent Purchases and Ultimate Disposition by USPharmaceutical Manufacturers.......................................................... 15
Table 6. Emission Factors for Organic Emissions to Air fromPharmaceutical Manufacture 1,a......................................................... 18
Table 7. Emission Factors for Nutrient Emissions to Water fromPharmaceutical Manufacture 1,a......................................................... 18
Table 8. Emission Factors for Organics to Water from PharmaceuticalManufacture 1,a ...................................................................................... 19
Table 9. Emission Factors for Listed Substances in Solid Wastesfrom Pharmaceutical Manufacture 1,2 .............................................. 19
Table 10. Control Technologies for Air Emissions1........................................ 21

3
Approved 25/6/98
1.0 Introduction
The purpose of all Emission Estimation Technique (EET) Manuals in thisseries is to assist Australian manufacturing, industrial, and servicefacilities to report emissions of listed substances to the National PollutantInventory (NPI). This Manual describes the procedures and recommendedapproaches for estimating emissions from facilities engaged in themanufacture of pharmaceutical and medicinal related product.
The medicinal and pharmaceutical product manufacturing activitiescovered in this Manual apply to facilities primarily engaged in themanufacture of drugs, medicines, medicinal chemicals, herbal medicines,or other pharmaceutical products for human or veterinary use. Themanufacture of pesticides is not covered by this Manual.
EET MANUAL : Medicinal and Pharmaceutical ProductManufacturing
HANDBOOK: Medicinal and Pharmaceutical ProductManufacturing
ANZSIC CODE : 2543
This Manual was drafted by the NPI Unit of the Queensland Departmentof Environment on behalf of the Commonwealth Government. It hasbeen developed through a process of national consultation involving Stateand Territory environmental authorities and key industry stakeholders.

4
Approved 25/6/98
2.0 Process Description
The pharmaceutical industry consists of facilities that are primarilyinvolved in processing or manufacturing medicinal chemicals andpharmaceutical products. The industry also includes establishments thatformulate pharmaceutical products and are involved in grinding, grading,and milling of botanical products. The pharmaceutical sectormanufactures bulk substance pharmaceutical intermediates and activeingredients that are further processed into finished products.
2.1 Medicinals and Botanicals
Facilities in the medicinals and botanicals sector are primarily engaged i nmanufacturing bulk organic and inorganic medicinal chemicals and theirderivatives and processing (grading, grinding, and milling) bulk botanicaldrugs and herbs. The sector is composed of facilities that manufactureproducts of natural origin, hormonal products and basic vitamins, as wellas those that isolate active medicinal principals such as alkaloids frombotanical drugs and herbs. These substances are used as active ingredientsfor pharmaceutical preparations. Facilities often produce both medicinaland botanical pharmaceutical preparations at the same facility.
2.2 Pharmaceutical Preparations
The pharmaceutical preparations sector is made up of facilities that processand manufacture raw materials into pharmaceutical preparations forhuman and veterinary uses. Finished products are sold in various dosageforms including, tablets, capsules, ointments, solutions, suspensions, andpowders. These products are developed primarily for the use of dental,medical, or veterinary professionals, for administration to patients and thegeneral public. Pharmaceutical products are often classified in terms oftheir availability to the general public (eg. prescription, and over-the-counter (OTC) drugs).
2.3 In Vivo and In Vitro Diagnostic Substances, and Biological Products
The in vivo and in vitro diagnostic substances sector includes facilities thatmanufacture in-vivo (tested inside a living organism), and in vitro (testedoutside of a living organism) diagnostic substances. Products includechemical, biological, and radioactive substances used in diagnosing andmonitoring health.

5
Approved 25/6/98
The biological products sector produces bacterial and virus vaccines,toxoids, serums, plasma, and other blood derivatives for human andveterinary use, other than in-vivo and in-vitro diagnostic substances.
The production of pharmaceutical products has three main stages: researchand development; the conversion of organic and natural substances intobulk pharmaceutical substances or ingredients through fermentation,extraction, or chemical synthesis; and, the formulation of the finalpharmaceutical product.
It is impossible to provide a single process flow diagram for thepharmaceutical industry, as each bulk substance differs in its manufacture,and several intermediates may be produced in a step-wise fashion prior tothe manufacture of the final active ingredient. However, an examplechemical synthesis process is provided at Figure 1 to identify theequipment used, and at which points emissions and wastes might begenerated.
Figures 2 and 3 show simplified process flow diagrams for natural andbiological extraction, and fermentation processes respectively. As eachfacility in Australia is unique, you are encouraged to develop a flowdiagram for your own operations detailing the input of materials andlisted substances, and the waste sources and emissions resulting from theoperation of each process.
Air EmissionsControl Device
WastewaterTreatment
ProcessCondenser
ProcessCondenser
ReactionVessel
Separation:- extraction- decanting- centrifugation- filtration
Crystal isat ion
Pur i f icat ion:- recrystalisation- centrifugation- filtration
Dry ing
Product
Spent solvents torecovery/disposal Wastewater
Treatment
WastewaterSolvent Vapour
SolventVapour
Solvent Vapour
SolventVapour
SolventVapour
SolventVapour
Wastewater Wastewater
ReactionResidues
Chemical(reactants)
Sealed - jacketfor cooling/heating
media
Figure 1. Simplified Process Flow Diagram for Chemical Synthesis
USEPA. September 1997. EPA Office Compliance Sector Notebook Project

6
Approved 25/6/98
Sludge (solvent,organic material)
Wastewater(BOD, COD,
TSS)
Wasteawater(BOD, COD,
TSS,ammonium salts
andsolvents)
Mixing andwashing
Extraction Evaporation
Solvent vapours(phenol,
chloroform,dichloromethane)
Wastewater(acidic or basic
solvents)Scrubber
H20
Organic Solvents(dichloromethane,
chloroform, alcohol,toluene)
Raw Material(animal tissue, plant
tissue, roots plasma)
ActiveIngredient
To compounding& formulation
H20
Figure 2. Simplified Process Flow Diagram for Natural and BiologicalExtraction
USEPA. September 1997. EPA Office Compliance Sector Notebook Project
FermentationBroth Fi l ter
Product Dissolvedor Precipitated Separations
InoculationTank
Heat
F i l terCake
Sludge (sugars,starches,
fermentationbroths, cornsteep, liquor)
Wastewater(Solvents,
copper, zinc,BOD, COD, TSS,
low pH)
Wastewater(solvents)
Gas(NO2, CO 2,
sulphur)
Seed
H20
Nutrients(sugars, Starches Solvents or
Metal Salts(MiBK, Cu, Zn)
Organic Solvents(acetone, MiBK, 1,2-
dichloroethane
ActiveIngredient
To compounding& formulation
Figure 3. Simplified Process Flow Diagram for the Fermentation Process
USEPA. September 1997. EPA Office Compliance Sector Notebook Project
Figure 4 shows a simplified process flow diagram for compounding,formulation, and packaging, and emission and waste points.

7
Approved 25/6/98
Fugitive Emissions
SolventEmission - VOC's
TabletDust
Mixing &Granulation
Tableting &Encapsulation
WashingEquipment
Wastewater(waste
starches,sugars, BOD,COD, TSS)
Wastewater(solvents,detergents)
Tablets andCapsules
Aqueous-based SolventsExcipients &Binders(sugar, starches)
Non-contactcooling water
ActiveIngredient
(drug)
Figure 4. Simplified Process Flow Diagram for Compounding andFormulating
USEPA. September 1997. EPA Office Compliance Sector Notebook Project
3.0 Emission Estimation
Estimates of emissions of listed substances to air, water and land should bereported for each substance that triggers a threshold. The reporting list anddetailed information on thresholds are contained in The NPI Guide at thefront of this Handbook.
In general, there are four types of emission estimation techniques (EETs)that may be used to estimate emissions from your facility. These aredescribed in The NPI Guide. Select the EET, or mix of EETs, which is mostappropriate for your purposes. If you estimate your emission by using anyof these EET’s, your data will be displayed on the NPI database as being of‘acceptable reliability’. Similarly, if your relevant environmental authorityhas approved the use of emission estimation techniques that are notoutlined in this Handbook, your data will also be displayed as being of‘acceptable reliability’.
For example, you might choose to use a mass balance to best estimatefugitive losses from pumps and vents, direct measurement for stack andpipe emissions, and emission factors when estimating losses from storagetanks and stockpiles.
8
Approved 25/6/98
You are able to use emission estimation techniques that are not outlinedin this document. You must, however, seek the consent of your relevantenvironmental authority. For example, if you already undertake directmeasurement, you may use this information for NPI reporting purposes(if you do not undertake direct measurement, the NPI does not require youto do so).
3.1 Emissions To Air
Air emissions may be categorised as :
Fugitive emissions
These are emissions that are not released through a vent or stack.Examples of fugitive emissions include dust from stockpiles, volatilisationof vapour from vats or open vessels, and material handling. Emissionsemanating from ridgeline roof-vents, louvres, and open doors of abuilding as well as equipment leaks, and leaks from valves and flanges arealso examples of fugitive emissions. Emission factor EETs are the usualmethod for determining losses through fugitive emissions.
Point source emissions
These emissions are exhausted into a vent or stack and emitted through asingle point source into the atmosphere. An air emissions control devicesuch as a carbon adsorption unit, scrubber, baghouse, or afterburner may beadded to the stack prior to the atmospheric release.
3.2 Emissions To Water
Emissions of substances to water can be categorised as discharges to:
• Surface waters (eg. lakes, rivers, dams, and estuaries);• Coastal or marine waters; and• Stormwater.
The discharge of listed substances to a sewer or tailings dam does notrequire you to report to the NPI (See also Section 3.0 of The NPI Guide).The main source of wastewater from this industry is usually from airpollution control equipment such as wet scrubbers.
The most appropriate method for determining emissions to theenvironment via wastewater is to use direct measurement, however, youmay use other EETs for the purposes of reporting to the NPI.

9
Approved 25/6/98
3.3 Emissions To Land
Emissions of substances to land on-site include solid wastes, slurries,sediments, spills and leaks, storage and distribution of liquids, and the useof chemicals to control various elements of the environment where theseemissions contain listed substances. These emission sources can be broadlycategorised as :
• surface impoundments of liquids and slurries• unintentional leaks and spills.
4.0 Raw Material Inputs And Pollutant Outputs
Pharmaceutical batch processes use numerous raw materials, and generateemissions and wastes containing NPI-listed substances. These wastes andemissions will depend on the raw materials and equipment used, as wellas the manufacturing process employed. In designing bulk manufacturingprocesses, consideration is given to the availability of the starting materialsand their toxicity, as well as to the wastes (eg. mother liquors, filterresidues, and other by-products) and the emissions generated.
When bulk manufacturing reactions are complete, the solvents arephysically separated from the resulting product. Because of purityconcerns, solvents are rarely reused in a pharmaceutical process. Theymay be sold for non-pharmaceutical uses, used for fuel blendingoperations, recycled, or transferred off-site for incineration.
Table 1 identifies the raw materials, associated emission and waste streamscontaining NPI listed substances, and some of the more commontechnologies used to control these emissions and wastes

10
Approved 25/6/98
Table 1. Typical Material Inputs and Pollutant Outputs in thePharmaceutical Industry1,a
Process Material Input Air EmissionsWater Emissions or
TransfersResidualWastes
Chemical SynthesisReaction Solvents, catalysts,
reactants (benzene,chloroform, dichloromethane, toluene,methanol, ethyleneglycol, methyl isobutylketone, xylenes,hydrochloric acid, etc)
VOC emissions fromreactor vents, manholes,material loading andunloading, acid gases(halogen acids, sulphurdioxide, nitrous oxides);fugitive emissions, frompumps, samplecollections, valves,tanks
Process wastewaters with spentsolvents, catalysts,reactants; pumpseal waters, wetscrubber wastewater, equipmentcleaning wastewater
Reactionresidues andreactorbottomwastes
Separation Separation andextraction solvents(methanol, toluene,n-hexane, etc.)
VOC emissions fromfiltering systems whicharen’t contained; andfugitive emissions fromvalves, tanks, andcentrifuges
Equipment cleaningwastewaters,spills, leaks, spentseparation solvents
Purification Purification solvents(methanol, toluene,acetone, hexanes, etc.)
Solvent vapours frompurification tanks;fugitive emissions
Equipment cleaningwash waters,spills, leaks, spentpurificationsolvents
Drying Finished active drugsor intermediates
VOC emissions frommanual loading andunloading of dryers
Equipment cleaningwast waters, spills,leaks
Natural ProductExtraction
Plants, animal tissues,extraction solvents(ammonia, phenol,chloroform, toluene,etc.)
Solvent vapours andVOCs from extractionchemicals
Equipment cleaningwash waters, spentsolvents(ammonia); naturalproduct extractionwastewater
Spent rawmaterials
Fermentation Inoculum, sugars,starches, nutrients,phosphates,fermentation solvents(ethanol, amylalcohol, methanol,methyl isobutylketone, acetone, etc.)
Odouriferous gases,extraction solventvapours, particulates
Spent fermentorbroth, fermentationwastewater
Waste filtercake,fermentationresidues
Formulation Active drug, binders,sugar, syrups, etc.
Tablet dusts, otherparticulates
Equipment cleaningwash waters (spentsolvents), spills,leaks, wash waters
Particulates,wastepackaging,rejectedtablets,capsules, etc.
Adapted by QLD Department of Environment, 1998

11
Approved 25/6/98
4.1 Raw Materials
Hundreds of raw materials are required for the processes of chemicalsynthesis used by the industry, and many are NPI listed substances. Theseinclude organic and inorganic compounds and are used in gas, liquid, andsolid forms. Plant and animal tissues are also used by the pharmaceuticalmanufacturing industry to produce various biological and naturalextraction products.
Each manufacturing or formulation facility in Australia is unique,differing from other facilities in size, types of intermediates, bulksubstances, or products produced, amounts and types of solvents used, andthus, in the raw materials used, and emissions and wastes generated. Mostbulk pharmaceutical reactions require organic solvents to dissolvechemical intermediates and reagents. Because of the high reactivity ofmany pharmaceutical reagents and intermediates, solvents must be non-reactive, provide an environment which allows efficient heat transferduring endothermic or exothermic reactions, and facilitate efficientelectron transfer.
Often, halogenated solvents such as dichloromethane, provide theoptimum choice for pharmaceutical reactions. The most commonly usedsolvent in the pharmaceutical industry is methanol, an oxygenated organicsolvent. Other common solvents used are ethanol, acetone, andisopropanol. Table 2, 3, and 4 show the typical solvents (and whether ornot they are hazardous air pollutants and NPI-listed) used in chemicalsynthesis, biological and natural extraction, and fermentation processes,respectively.

12
Approved 25/6/98
Table 2. Solvents Used in the Chemical Synthesis Process
SubstanceHazardous
AirPollutant
NPIListed
SubstanceSubstance
HazardousAir
Pollutant
NPIListed
Substanceacetone X formaldehyde X Xacetonitrile X X formamideammonia X furfuraln-amyl acetate n-heptaneamyl alcohol n-hexane X Xaniline X X isobutyl
aldehydebenzene X X isopropanoln-butyl acetate isopropyl
acetaten-butyl alcohol isopropyl etherchlorobenzene X methanol X Xchloroform X X methylaminechloromethane X methyl cellulosecyanide X dichloro
methaneX X
cyclohexane X methyl formate1,2-dichloro-benzene
methyl isobutylketone
X X
diethylamine 2-methylpyridine
diethyl ether petroleumnaphtha
n,n-dimethyl-acetamide
phenol X X
diethylamine polyethyleneglycol
n,n-dimethyl-aniline
X n-propanol
n,n-dimethyl-formamide
X pyridine
dimethylsulphoxide
tetrahydrofuran
1,4-dioxane X toluene X Xethanol X trichlorofloro-
methaneethyl acetate X methyl ethyl
ketoneX X
ethylene glycol X X triethylamine Xxylenes X X
Adapted from USEPA Profile on the Pharmaceutical Manufacturing Industry, 1997 and thedraft National Environment Protection Measure on the National Pollutant Inventory, 1998.

13
Approved 25/6/98
Table 3. Solvents Used in Biological and Natural Product Extraction
SubstanceHazardous
AirPollutant
NPIListed
SubstanceSubstance
HazardousAir
Pollutant
NPIListed
Substanceacetone X ethylene glycol X Xacetonitrile X X formaldehyde X Xammonia X n-heptanen-amyl acetate n-hexane X Xamyl alcohol isopropanoln-butyl alcohol isopropyl
acetatechloroform X X isopropyl ether1,2-dichloroethane
X methanol X X
diethylamine dichloromethane
X X
diethyl ether petroleumnaphtha
n,n-diethylformamide
X phenol X X
dimethylsulphoxide
n-propanol
1,4-dioxane X pyridineethanol X tetrahydrofuran ethyl acetate X toluene X XAdapted from USEPA Profile on the Pharmaceutical Manufacturing Industry, 1997 and thedraft National Environment Protection Measure on the National Pollutant Inventory, 1998.
Table 4. Solvents Used in Fermentation Processes
SubstanceHazardous
AirPollutant
NPIListed
SubstanceSubstance
HazardousAir
Pollutant
NPIListed
Substanceacetone X n-heptaneacetonitrile X X n-hexane X Xammonia X isopropanoln-amyl acetate isopropyl
acetateamyl alcohol methanol X Xn-butyl acetate methyl cellulosen-butyl alcohol dichloro
methaneX X
chloroform X X methyl isobutylketone
X X
n,n-diethylformamide
X petroleumnaphtha
ethanol X phenol X Xethyl acetate X toluene X X formaldehyde X X triethylamineAdapted from USEPA Profile on the Pharmaceutical Manufacturing Industry, 1997 and thedraft National Environment Protection Measure on the National Pollutant Inventory, 1998.

14
Approved 25/6/98
4.2 Estimating Emissions of Listed Substances
Emissions consist almost entirely of organic solvents that escape fromdryers, reactors, distillation systems, storage tanks, and other operations.These emissions are exclusively non-methane organic compounds.Emissions of other listed substances are negligible (except for particulatematter in unusual circumstances), and are not treated in this Manual.
It is not practical to attempt to evaluate emissions from individual steps i nthe production process, or to associate emissions of any NPI listedsubstance with individual pieces of equipment, because of the great varietyof batch operations that may be undertaken at a single production facility.It is more reasonable to obtain data on total purchases of listed substancesat your facility, and to assume that these represent replacements forsolvents lost by evaporation. Air emission estimates can be calculated bysubtracting the materials that do not enter the air because they have beenincinerated, have been transferred off-site, or have been incorporated intothe pharmaceutical product by chemical reaction. NPI substancesincorporated into manufactured product do not have to be reported as anemission of that substance.
If facility-specific information is not available, industry wide data may beused instead, or the emission factors provided in this Manual. Table 5 listsannual purchases by US pharmaceutical manufacturers and shows theultimate disposition of each solvent by the industry in that country. Thiskind of data is currently unavailable for the Australian manufacturingindustry, but given the similarities between Australian and US industries,it is quite appropriate to use the US data provided in this Manual
Emissions can be estimated by using your own facility’s data on purchasesof individual solvents, and computing the quantity of each that evaporatesinto the air, or is transferred off-site to sewer, incineration, or in solidwaste. This estimation can be done from either the information given i nTable 5, or through information obtained from your own facility’spurchasing and processing records. If solvent volumes are given ratherthan weights, the liquid densities identified in Table 5 can be used tocompute weights.
The emission factors in this Manual are derived from Table 5, and areprovided as an example of how to calculate emission factors for yourfacility.

15
Approved 25/6/98
Table 5. Solvent Purchases and Ultimate Disposition by USPharmaceutical Manufacturers
AnnualPurchase
Ultimate Disposition (%) LiquidDensity
Solvent (tonnes) Airemission
Sewer Incineration Solidwaste
Finalproduct (g/litre)
acetic acid 930 1 82 17 1044acetone 12 040 14 22 38 7 19 792acetonitrile 35 83 17 792benzene 1 010 29 37 16 8 10 876chloroform 500 57 5 38 1500ethanol 13 230 10 6 7 1 76 792ethyl acetate 2 380 30 47 20 3 900ethylene glycol 60 100 1116formaldehyde 30 19 77 4 b
n-hexane 530 17 15 68 660methanol 7 960 31 45 14 6 4 792dichloromethane 10 000 53 5 20 22 1332methyl ethylketone 260 65 12 23 804methylisobutylketone 260 80 20 804toluene 6 010 31 14 26 29 8641,1,2-tri-chloroethane 135 100 1356xylenes 3 090 6 19 70 5 864USEPA 1995a These data were reported by 26 member companies of the US Pharmaceutical
Manufacturers’ Association, accounting for 53% of pharmaceutical sales in 1975.b Sold as aqueous solutions containing 37% to 50% formaldehyde by weight.c Only solvents listed on the NPI are included.

16
Approved 25/6/98
5.0 Emission Factor Rating
Every emission factor has an associated emission factor rating (EFR) code.This rating system is common to EETs for all industries and sectors andtherefore, to all Industry Handbooks. They are based on rating systemsdeveloped by the United States Environmental Protection Agency(USEPA), and by the European Environment Agency (EEA). Consequently,the ratings may not be directly relevant to Australian industry. Sources forall emission factors cited can be found in the references section of thisdocument. The emission factor ratings will not form part of the publicNPI database.
When using emission factors, you should be aware of the associated EFRcode and what that rating implies. An A or B rating indicates a greaterdegree of certainty than a D or E rating. The less certainty, the more likelythat a given emission factor for a specific source or category is notrepresentative of the source type. These ratings notwithstanding, the maincriterion affecting the uncertainty of an emission factor remains the degreeof similarity between the equipment/process selected in applying thefactor, and the target equipment/process from which the factor wasderived.
The EFR system is as follows :
A - ExcellentB - Above AverageC - AverageD - Below AverageE - PoorU - Unrated
Estimating your facility’s emissions based on emission factors only, andwithout taking into account any control measures, may have anuncertainty as high as 100%.
Other EETs, such as release calculations based on mass balance of solventconsumption and without taking into account control measures, mayhave an uncertainty of 50%.
An EET based on an audit or direct measurement, and taking into accountcontrol measures, may have an uncertainty of 20% .

17
Approved 25/6/98
6.0 Emission Factors
An emission factor is a tool that is used to estimate emissions to theenvironment. In this Manual, it relates the quantity of substances emittedfrom a source to some common activity associated with those emissions.They are usually expressed as the weight of a substance emitted, divided bythe unit weight, volume, distance, or duration of the activity emitting thesubstance (eg. kilograms of acetone emitted per tonne of product).
Emission factors are used to estimate a facility’s emissions by the generalequation:
E = A x T x EF x [1 - (ER/100)]where :
E = emissions;A = activity rate;T = time (or another variable)EF = uncontrolled emission factor; andER = overall emission reduction efficiency, %.
Emission factors developed from measurements for a specific facility,source, or process may sometimes be used to estimate emissions at othersites. Should a company operate several production units of similar sizeand using similar processes, and emissions were measured from onefacility or unit-process, an emission factor could be developed and appliedto similar sources. As previously mentioned, it is advisable to have theemission factor reviewed and approved by your local environmentalauthority prior to its use for NPI estimations.
Example 1.Table 6. shows that 140kg of acetone are emitted for each tonne of pharmaceuticalproducts produced from an uncontrolled source. It is assumed that the productionplant operates for 1 500 hours per year.
EFacetone = 140kg/tonne
Pharmaceuticalproduction rate = 0.5 tonnes/hour
Acetone emissions = EFacetone x production ratex operating time
= 140 x 0.5= 70 kg/hr x (1 tonne ÷ 1 000kg)
x 1 500 hr/yr
= 105 tonnes per year
18
Approved 25/6/98
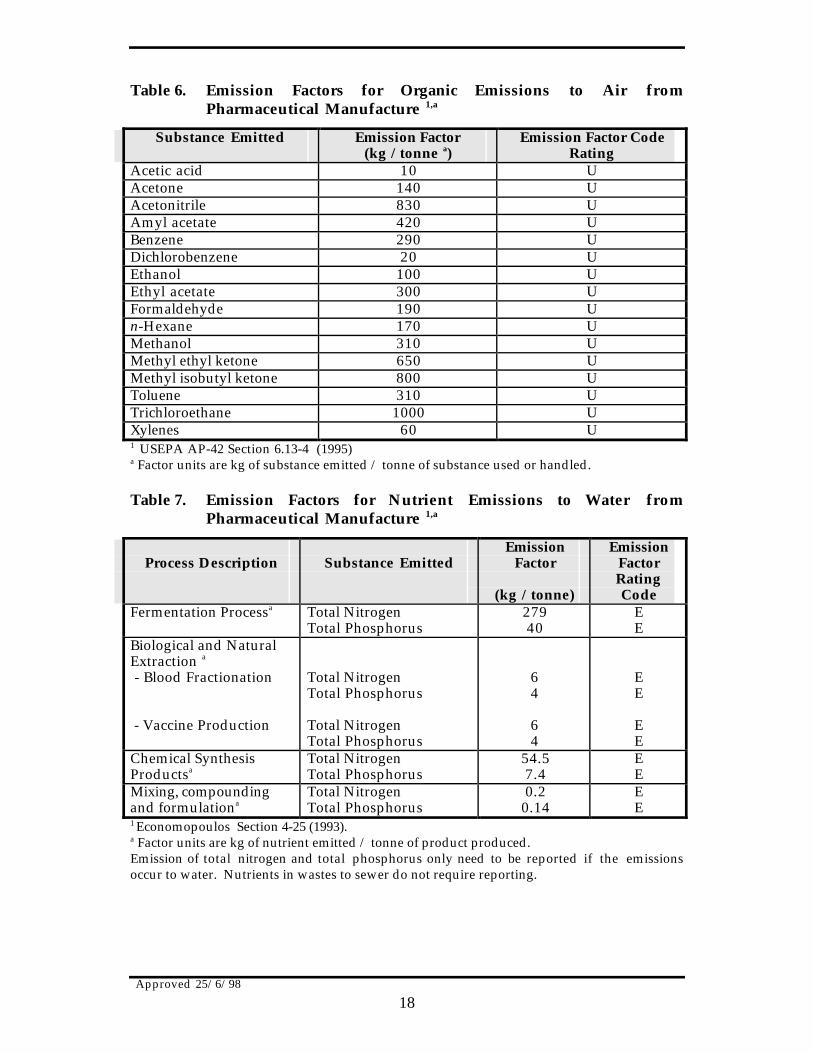
Table 6. Emission Factors for Organic Emissions to Air fromPharmaceutical Manufacture 1,a
Substance Emitted Emission Factor(kg / tonne a)
Emission Factor CodeRating
Acetic acid 10 UAcetone 140 UAcetonitrile 830 UAmyl acetate 420 UBenzene 290 UDichlorobenzene 20 UEthanol 100 UEthyl acetate 300 UFormaldehyde 190 Un-Hexane 170 UMethanol 310 UMethyl ethyl ketone 650 UMethyl isobutyl ketone 800 UToluene 310 UTrichloroethane 1000 UXylenes 60 U1 USEPA AP-42 Section 6.13-4 (1995)a Factor units are kg of substance emitted / tonne of substance used or handled.
Table 7. Emission Factors for Nutrient Emissions to Water fromPharmaceutical Manufacture 1,a
Process Description Substance EmittedEmission
Factor
(kg / tonne)
EmissionFactorRatingCode
Fermentation Processa Total NitrogenTotal Phosphorus
27940
EE
Biological and NaturalExtraction a
- Blood Fractionation
- Vaccine Production
Total NitrogenTotal Phosphorus
Total NitrogenTotal Phosphorus
64
64
EE
EE
Chemical SynthesisProductsa
Total NitrogenTotal Phosphorus
54.57.4
EE
Mixing, compoundingand formulationa
Total NitrogenTotal Phosphorus
0.20.14
EE
1 Economopoulos Section 4-25 (1993).a Factor units are kg of nutrient emitted / tonne of product produced.Emission of total nitrogen and total phosphorus only need to be reported if the emissionsoccur to water. Nutrients in wastes to sewer do not require reporting.
19
Approved 25/6/98
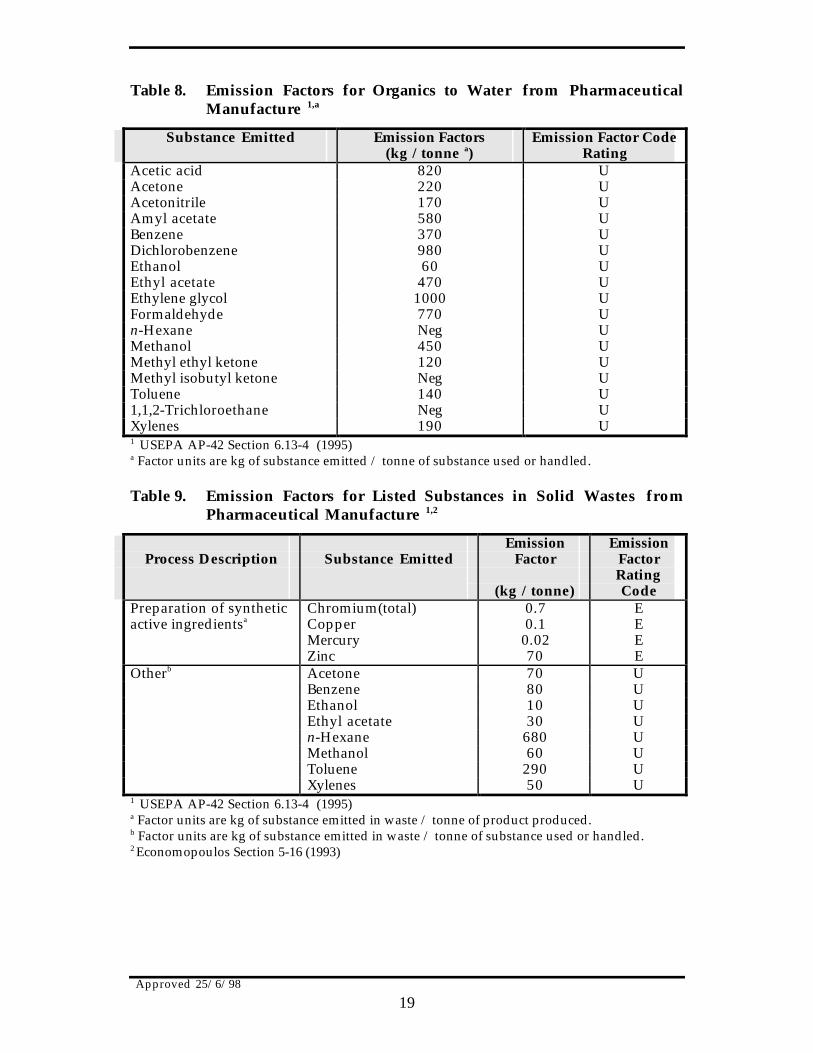
Table 8. Emission Factors for Organics to Water from PharmaceuticalManufacture 1,a
Substance Emitted Emission Factors(kg / tonne a)
Emission Factor CodeRating
Acetic acid 820 UAcetone 220 UAcetonitrile 170 UAmyl acetate 580 UBenzene 370 UDichlorobenzene 980 UEthanol 60 UEthyl acetate 470 UEthylene glycolFormaldehyde
1000770
UU
n-Hexane Neg UMethanol 450 UMethyl ethyl ketone 120 UMethyl isobutyl ketone Neg UToluene 140 U1,1,2-Trichloroethane Neg UXylenes 190 U1 USEPA AP-42 Section 6.13-4 (1995)a Factor units are kg of substance emitted / tonne of substance used or handled.
Table 9. Emission Factors for Listed Substances in Solid Wastes fromPharmaceutical Manufacture 1,2
Process Description Substance EmittedEmission
Factor
(kg / tonne)
EmissionFactorRatingCode
Preparation of syntheticactive ingredientsa
Chromium(total)CopperMercuryZinc
0.70.1
0.0270
EEEE
Otherb Acetone 70 UBenzene 80 UEthanol 10 UEthyl acetate 30 Un-Hexane 680 UMethanol 60 UToluene 290 UXylenes 50 U
1 USEPA AP-42 Section 6.13-4 (1995)a Factor units are kg of substance emitted in waste / tonne of product produced.b Factor units are kg of substance emitted in waste / tonne of substance used or handled.2 Economopoulos Section 5-16 (1993)

20
Approved 25/6/98
7.0 Control Technologies
As solvents are expensive, considerable effort is made to recover and re-use them. Hence, solvent emissions are controlled as part of the normaloperating procedures in the pharmaceutical industry. In addition, mostmanufacturing is carried out inside facility buildings, where solvent lossesmust be minimised to protect the health of workers, and conform tooccupational health and safety standards.
Water or brine-cooled condensers are the most common control devicesused in the industry, with carbon adsorption units in occasional use. Witheach of these methods, solvent can be recovered. Where the mainobjective is not solvent reuse but rather, the control of an odorous or toxicvapour, scrubbers or incinerators are used. These control systems areusually designed to remove a specific chemical vapour, and will only beused when a batch of the corresponding drug is being produced. Usually,solvents are not recovered from scrubbers and reused and, of course, nosolvent recovery is possible from an incinerator.
It is difficult to make a quantitative estimate of the efficiency of eachcontrol method because it largely depends on the process being controlled,and pharmaceutical manufacture involves hundreds of differentprocesses. Incinerators, carbon adsorbers, and scrubbers have been reportedto remove greater than 90 percent of the organics in the control equipmentinlet stream. Condensers are limited in that they can only reduce theconcentration in the gas stream to saturation at the condensertemperature, but not below that level. Lowering the temperature willlower the concentration at saturation, but it is not possible to operate at atemperature below the freezing point of one of the components of the gasstream.
Table 10 provides expected control efficiencies for emissions to air oncommonly used abatement equipment. In the absence of precise data onthe efficiencies of control equipment at your facility, you should assumethat any abatement equipment used reduces emissions by 90 percent.Therefore, to obtain an emission total from a controlled source, multiplythe uncontrolled emission total (obtained from either using the emissionfactors above, or another EET such as mass balance) by 0.1.

21
Approved 25/6/98
Table 10. Control Technologies for Air Emissions1
Emission Type EfficiencyMethod Organic
Vapours InorganicVapours
Particulates(%)
Cyclones X 98a
Fabric Filter X 80-99Wet Scrubbers Xb X X 80Electrostatic precipitators X 99.5-99.9Carbon adsorption Xc X 50-99Fluidised-bed systems Xd NDAbsorption Xe 90-99Condensation X Xf 50-95g
Thermal incineration X >99Catalytic incineration X 95-99
1 Eastern Research Group, 1997.a The greatest amount of control would be achieved for particles larger than 5µm.b Depends on material, should be miscible in water.c Carbon adsorption or fired-bed systems.d Not widely used.e Material must be readily soluble in water or other solvents.f Depends on vaporisation point of material and the formation of azeotropic mixtures.g Highly dependent on the emission stream characteristics.ND = no data

22
Approved 25/6/98
8.0 References
Eastern Research Group. July 1997. Introduction To Stationary PointSource Emission Inventory Development Volume II: Chapter 1.Morrisville, NC, USA.
Economopoulos A. P. 1993. Assessment of Sources of Air, Water, and LandPollution. A Guide to Rapid Source Inventory Techniques and their use i nFormulating Environmental Control Strategies. Part One: Rapid InventoryTechniques in Environmental Pollution. World Health Organisation,Geneva, Switzerland.
USEPA. January 1995. Compilation of Air Pollutant Emission Factors,Volume 1: Stationary Point and Area Sources, Fifth edition, AP-42. Section6.13 Pharmaceutical Production. United States Environmental ProtectionAgency, Office of Air Quality Planning and Standards. Research TrianglePark, NC, USA.
USEPA. September 1997. EPA Office Compliance Sector Notebook Project.Profile of the Pharmaceutical Manufacturing Industry. United StatesEnvironmental Protection Agency, Office of Enforcement and ComplianceAssurance. Washington, DC, USA.