Emerging Therapeutic Company Investment and Deal ... - bio.org...BIO Industry Analysis uses IPO...
28
1 Contents: 1. Acquisitions (slides 3-5) 2. Licensing (slides 6-8) 3. IPOs and FOPOs (slides 9-13) 4. Venture Funding (slides 14-21) 5. Methodology (22-28) Emerging Therapeutic Company Investment and Deal-making 2010-2019 BIO Industry Analysis Team: David Thomas, CFA, Vice President, Industry Research, BIO Chad Wessel, Director, Industry Research, BIO
Transcript of Emerging Therapeutic Company Investment and Deal ... - bio.org...BIO Industry Analysis uses IPO...
1
Contents:1. Acquisitions (slides 3-5)2. Licensing (slides 6-8)3. IPOs and FOPOs (slides 9-13)4. Venture Funding (slides 14-21)5. Methodology (22-28)
Emerging Therapeutic Company Investment and Deal-making2010-2019
BIO Industry Analysis Team:David Thomas, CFA, Vice President, Industry Research, BIOChad Wessel, Director, Industry Research, BIO
Acquisitions(emerging therapeutic companies only)
1. R&D-stage companies2. Market-stage companies <$1B sales

Emerging Company AcquisitionsR&D-Stage Targets
>$5B upfront
Therapeutic companies acquired for minimum $10M deal value
www.bio.org/iareports
Juno, AveXisAblynx
SynagevaReceptos
Pharmasset
Stemcentrx
Kite
Source: Informa, Cortellis, BCIQ, BIO Industry Analysis, 2020
MDCO* $9.8B (NVS)
*MDCO had sold off Market franchise
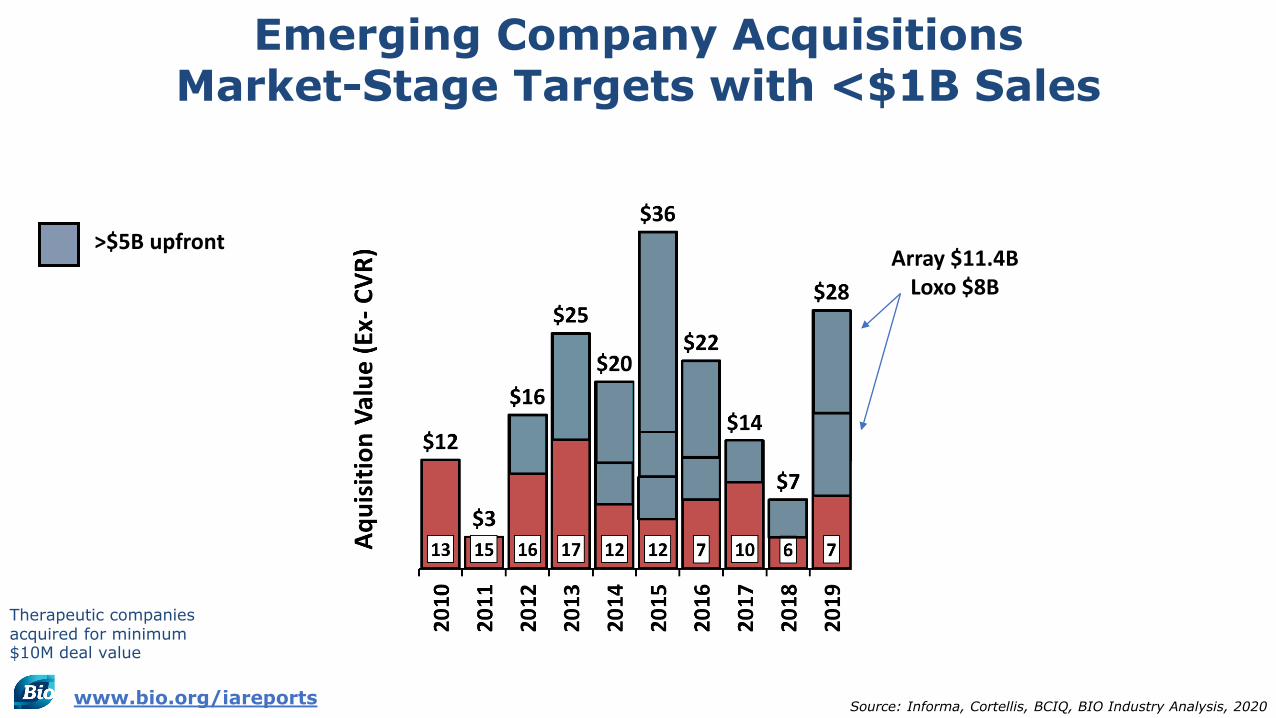
Emerging Company AcquisitionsMarket-Stage Targets with <$1B Sales
Array $11.4BLoxo $8B
>$5B upfront
Therapeutic companies acquired for minimum $10M deal value
www.bio.org/iareports Source: Informa, Cortellis, BCIQ, BIO Industry Analysis, 2020
R&D-Stage Drug Asset Out-Licensing
(Small therapeutic companies only)

R&D-stage Out-Licensing (Upfront Payments)
Source: Informa, Cortellis, BIO Industry Analysis, 2020
$1.8B BMS/Nektar$1.0B Biogen/Ionis>$1B upfront
**
Global therapeutic companies acquired for minimum $10M deal value
$5.0B Gilead/Galapagos
$1.1B Sarepta/Roche
www.bio.org/iareports
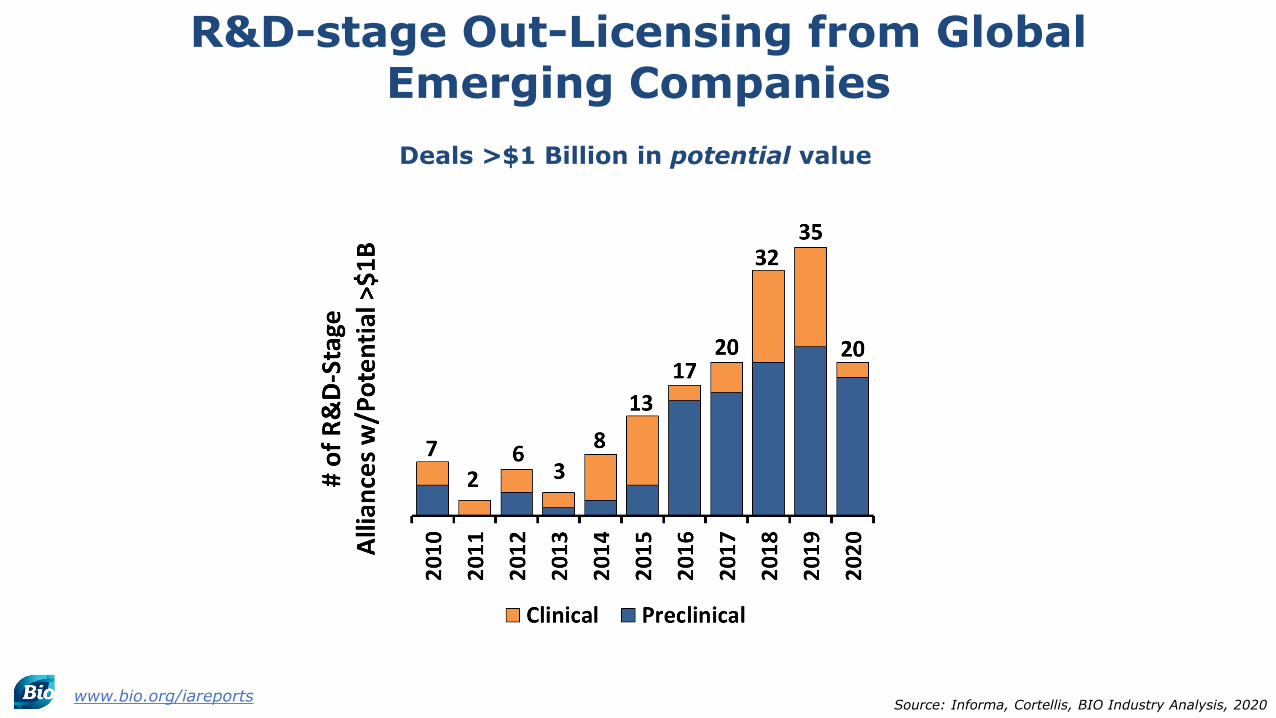
R&D-stage Out-Licensing from Global Emerging Companies
Source: Informa, Cortellis, BIO Industry Analysis, 2020
Deals >$1 Billion in potential value
www.bio.org/iareports
9
Public Markets and Public Financings
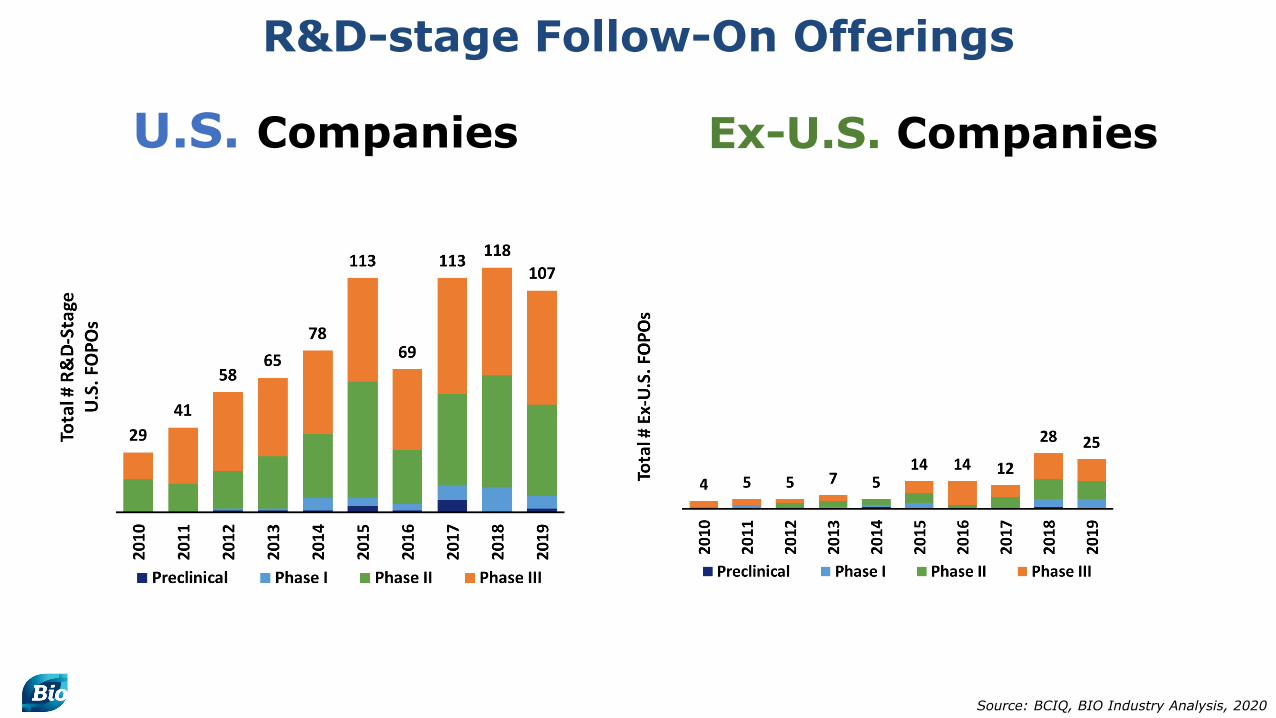
R&D-stage Follow-On Offerings
U.S. Companies Ex-U.S. Companies
Source: BCIQ, BIO Industry Analysis, 2020
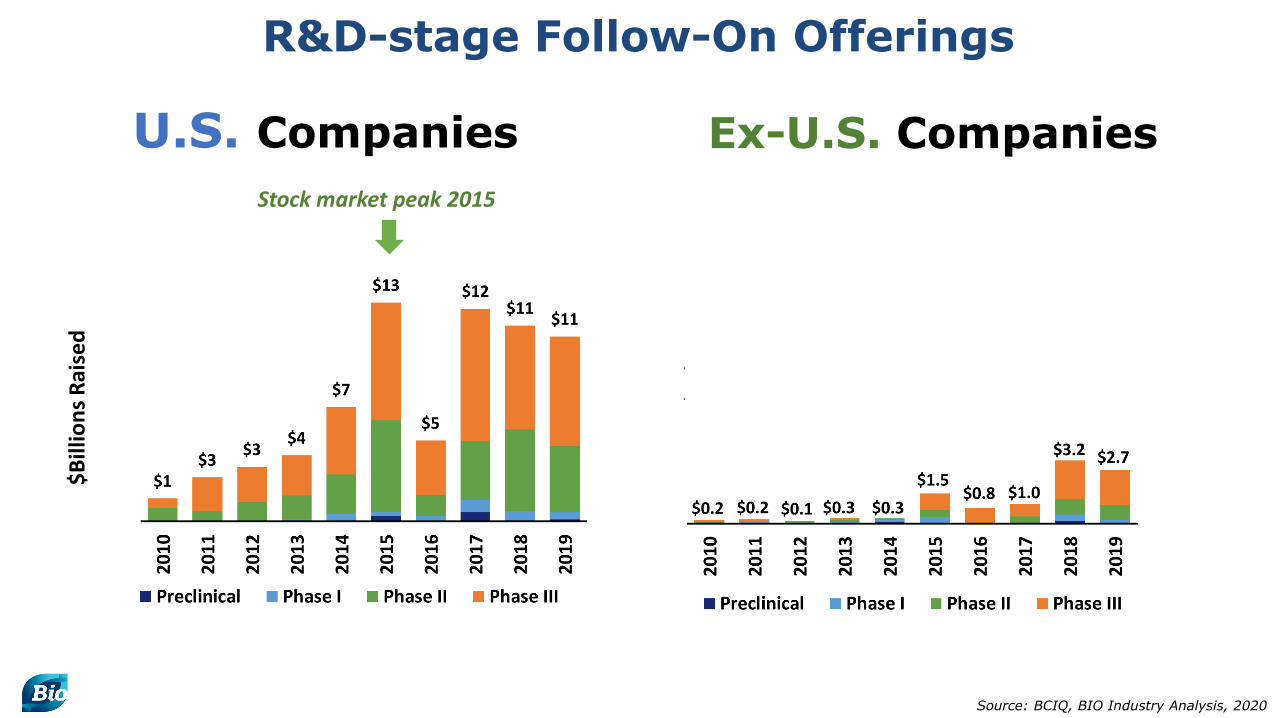
R&D-stage Follow-On Offerings
U.S. Companies Ex-U.S. Companies
Source: BCIQ, BIO Industry Analysis, 2020
Stock market peak 2015
$Bill
ions
Rai
sed

R&D-Stage IPOs
Source: Nasdaq, BCIQ, BIO Industry Analysis, 2020
U.S. Companies Ex-U.S. Companies
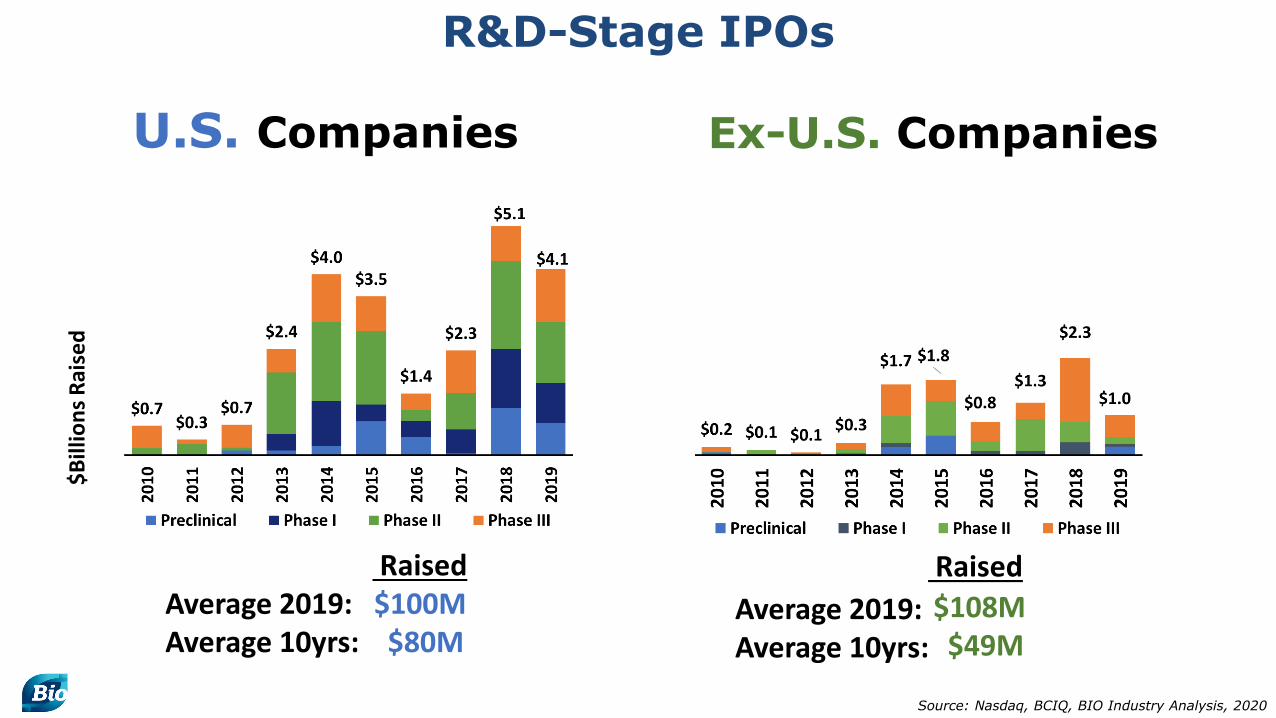
R&D-Stage IPOs
Average 2019: $100MAverage 10yrs: $80M
Source: Nasdaq, BCIQ, BIO Industry Analysis, 2020
U.S. Companies Ex-U.S. Companies
$108M$49M
Raised RaisedAverage 2019: Average 10yrs:
$Bill
ions
Rai
sed
Venture Capital
BCIQ
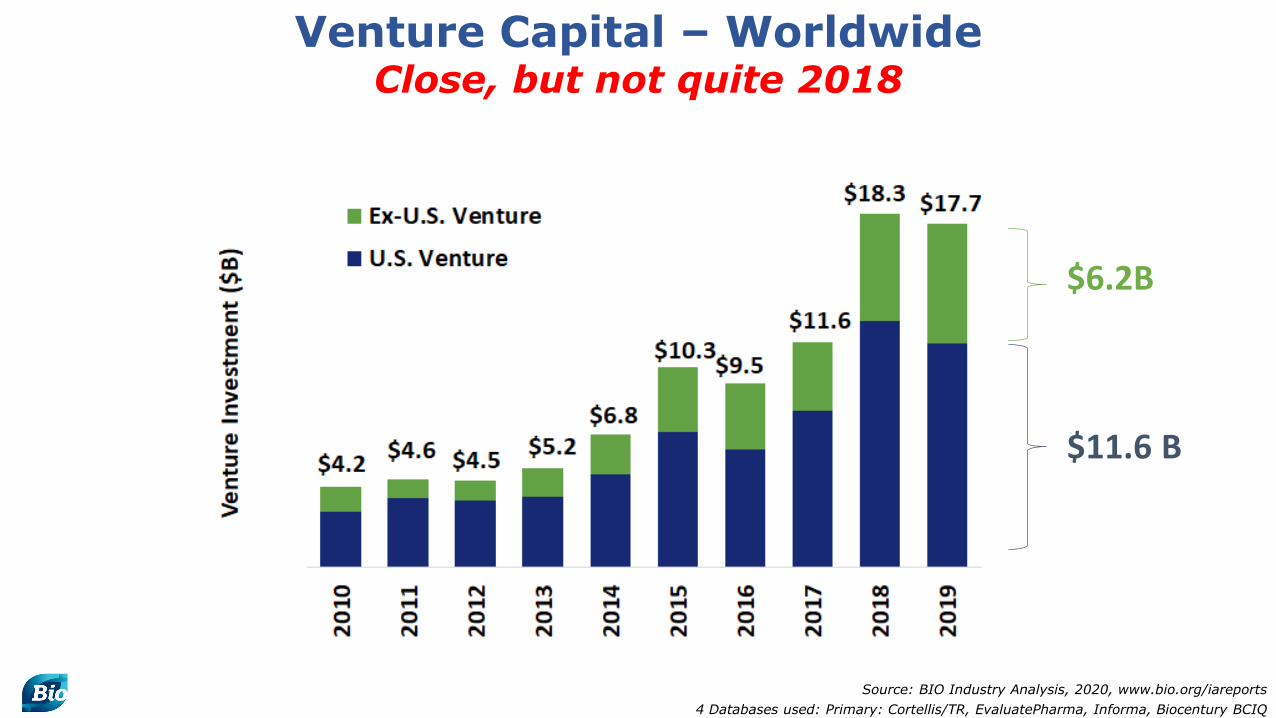
Venture Capital – WorldwideClose, but not quite 2018
Source: BIO Industry Analysis, 2020, www.bio.org/iareports4 Databases used: Primary: Cortellis/TR, EvaluatePharma, Informa, Biocentury BCIQ
$6.2B
$11.6 B
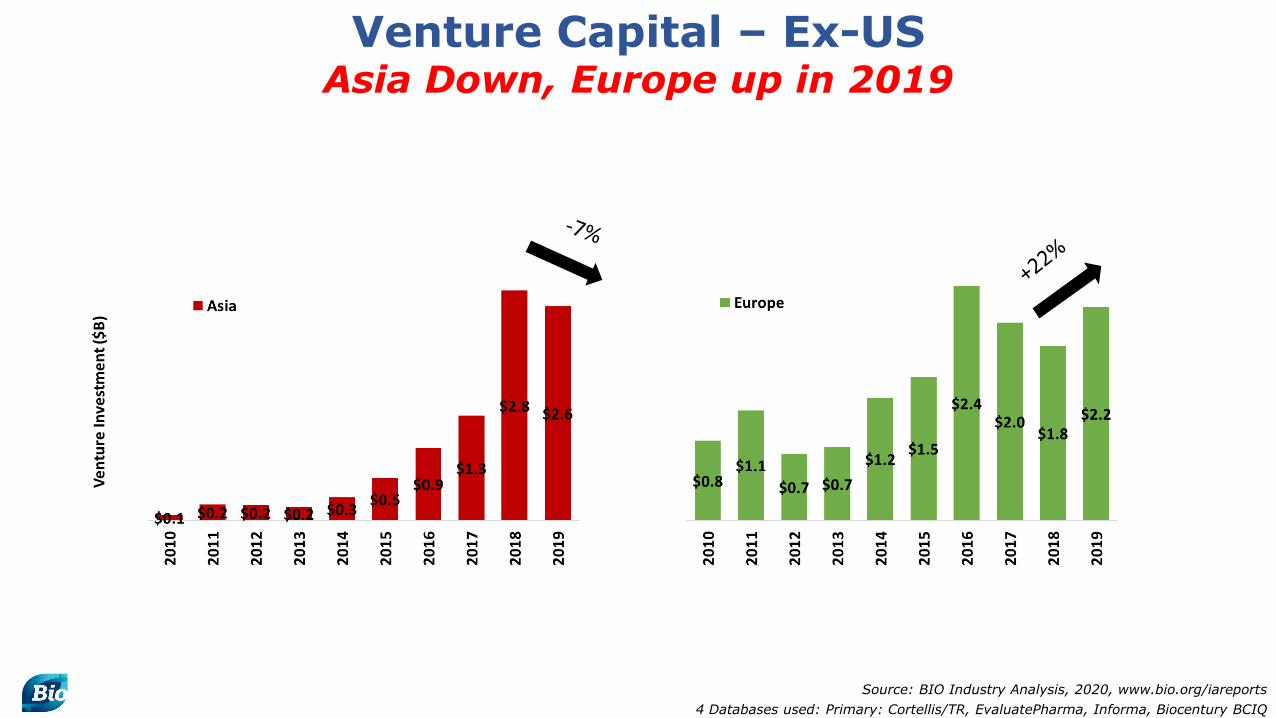
Venture Capital – Ex-USAsia Down, Europe up in 2019
Source: BIO Industry Analysis, 2020, www.bio.org/iareports4 Databases used: Primary: Cortellis/TR, EvaluatePharma, Informa, Biocentury BCIQ
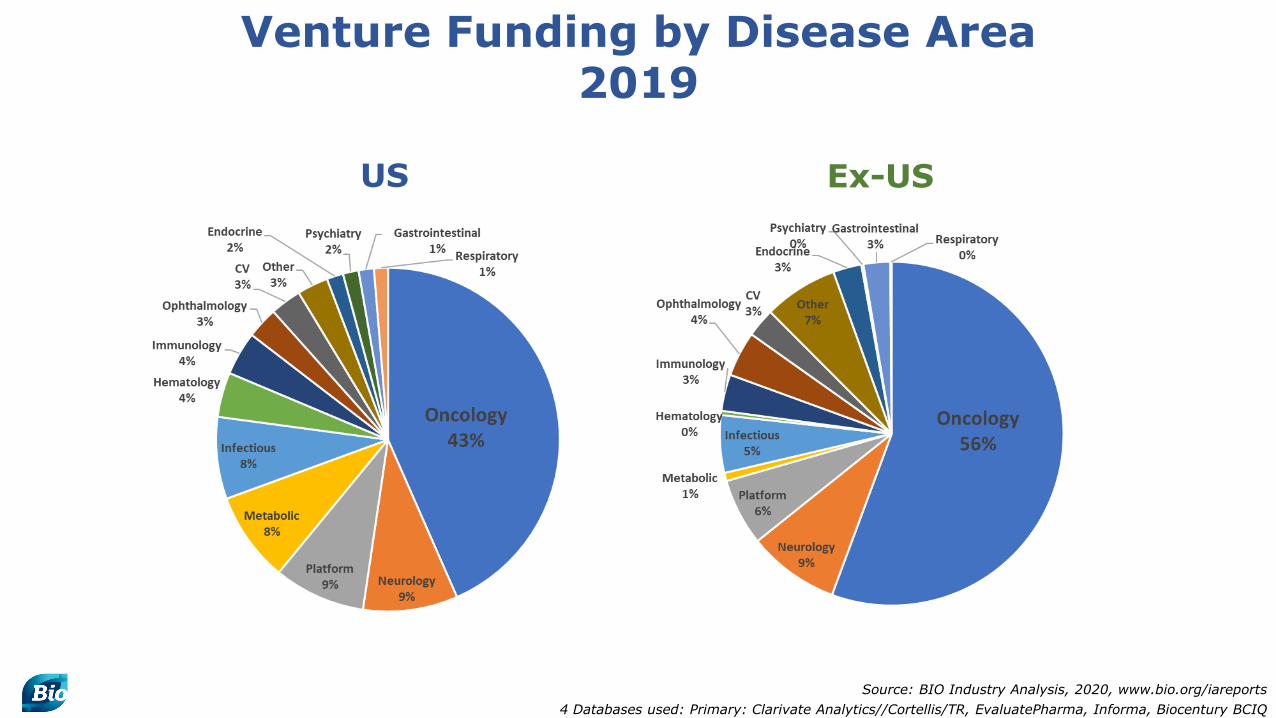
Venture Funding by Disease Area2019
Source: BIO Industry Analysis, 2020, www.bio.org/iareports4 Databases used: Primary: Clarivate Analytics//Cortellis/TR, EvaluatePharma, Informa, Biocentury BCIQ
US Ex-US
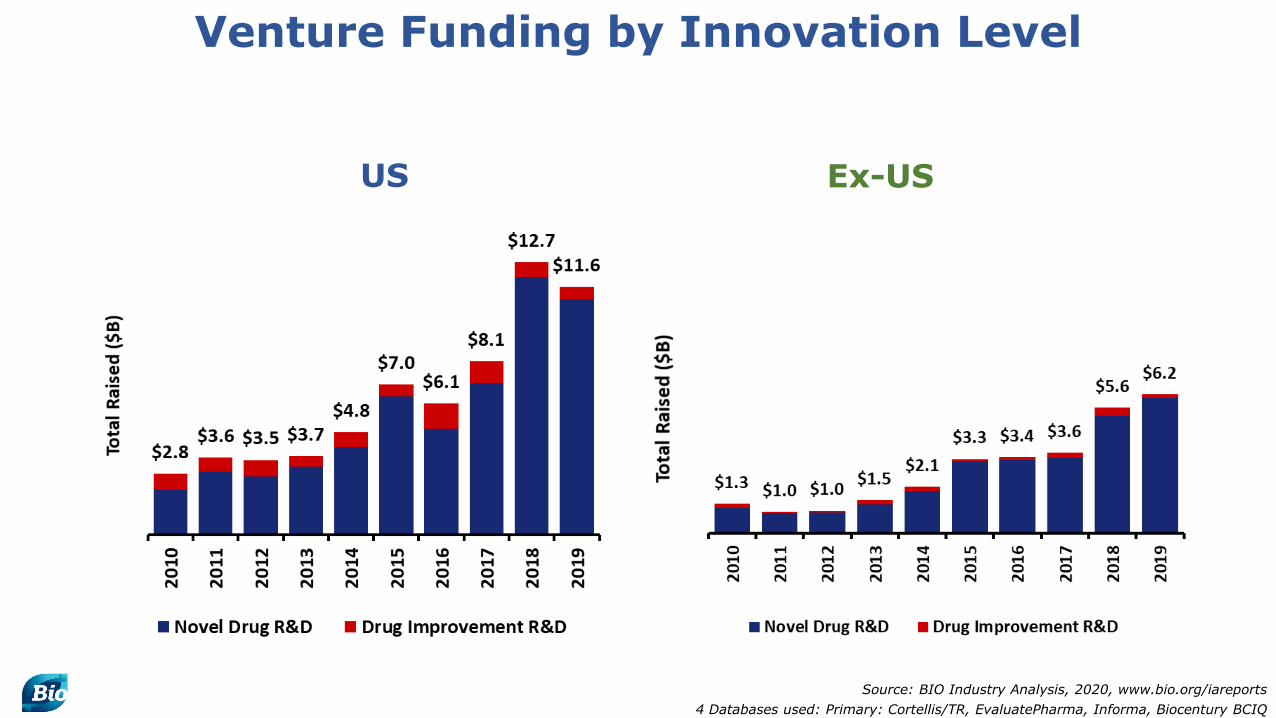
Venture Funding by Innovation Level
Source: BIO Industry Analysis, 2020, www.bio.org/iareports4 Databases used: Primary: Cortellis/TR, EvaluatePharma, Informa, Biocentury BCIQ
US Ex-US
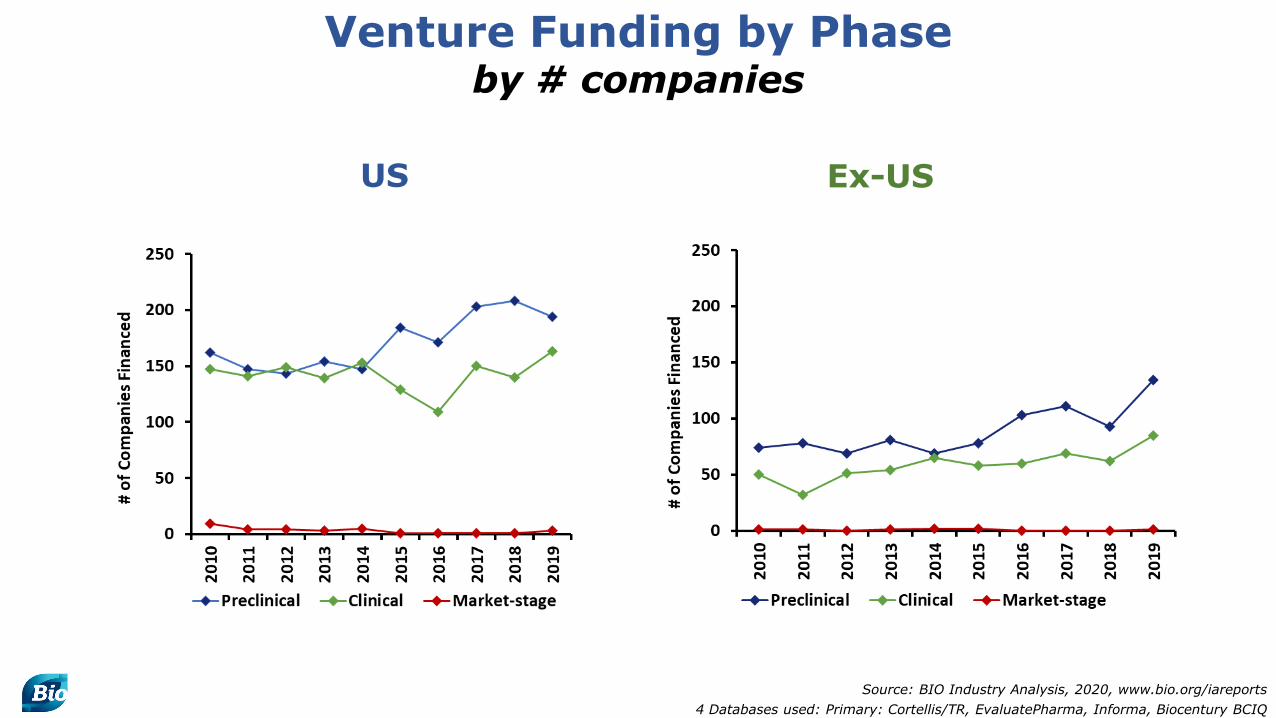
Venture Funding by Phaseby # companies
Source: BIO Industry Analysis, 2020, www.bio.org/iareports4 Databases used: Primary: Cortellis/TR, EvaluatePharma, Informa, Biocentury BCIQ
US Ex-US

Series A-1 Rounds for U.S. companiesWas 2018 an Outlier?
109
Source: BIO Industry Analysis, 2020, www.bio.org/iareports4 Databases used: Primary: Cortellis/TR, EvaluatePharma, Informa, Biocentury BCIQ
81
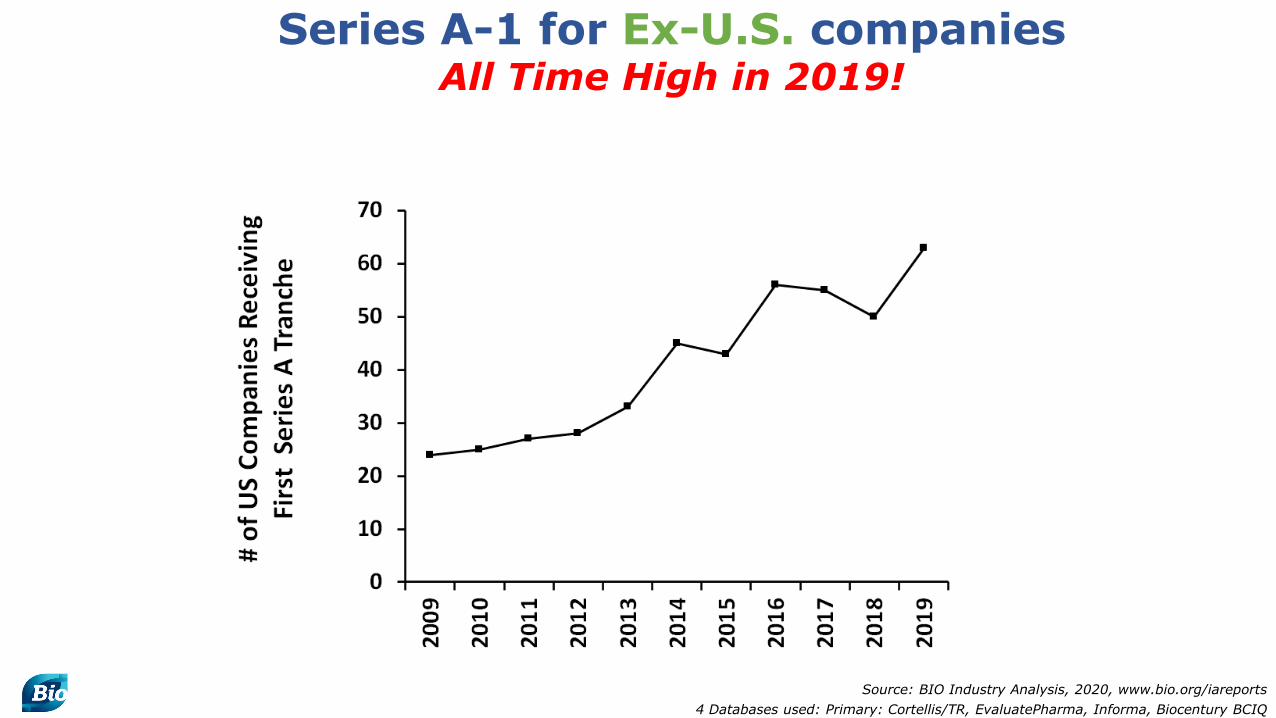
Series A-1 for Ex-U.S. companiesAll Time High in 2019!
Source: BIO Industry Analysis, 2020, www.bio.org/iareports4 Databases used: Primary: Cortellis/TR, EvaluatePharma, Informa, Biocentury BCIQ
Methodology
for Industry Analysis Investment and Deal Trends
Definitions
Emerging Therapeutic Company definition: All companies analyzed for this report are “Emerging Therapeutic” companies that are either developing therapeutics with a lead drug in R&D or have a drug on the market, but have less than $1 billion in sales at the time of the transaction. Generics, distribution, and pharmacy companies are excluded.
Phase and Disease categories: Each transaction was tagged by the company’s lead program phase of development as of the date of investment or deal. For programs at the NDA/BLA stage, we grouped them as Phase III.
Novel vs. Improvement R&D: Company lead programs are assessed for two categories of innovation: novel R&D pursuing a new chemical entity, and R&D that expands the properties, availability, patient experience, etc. of an already-approved chemical entity. In the first category, novel R&D, we included in-licensed assets with prior data, such as spin-outs from big pharmaceutical companies. The lead drug for the novel category cannot have had a prior approval for any indication. The second category, drug improvement, included delivery technologies such as nanotechnology, lipids (micelles), new adjuvants for approved vaccines, extended release and prolonged half-life chemical modifications (conjugates and linkers, including pegylated variants), patches, topical creams, implanted delivery devices, needle-less injections, as well as reformulation of an approved drug, repurposing of an approved drug, and nutraceuticals.
Countries/Regions: For Europe the following countries were included: Austria, Belgium, Cyprus, Denmark, Finland, France, Germany, Greece, Italy, Ireland, Malta, Netherlands, Norway, Poland, Spain, Sweden, Switzerland, United Kingdom. For Asia, the Pacific region is included: Australia, China, India, Hong Kong, Japan, Malaysia, New Zealand, Singapore, South Korea, Taiwan. For ROW: Bermuda, Cayman Islands, Chile, Israel, Russia.
Definitions
Disease Categorizing: Each year of funding, for each round, investment was labeled by one of 14 major categories (13 diseases plus platform technologies). Vaccines include both bacterial and viral vaccines. Thus, all other infectious disease categories are for small molecule or large molecule approaches ex-vaccine. Oncology vaccines are tagged as vaccines if a true antigen (often peptides) is being utilized and will have the modality tagged with vaccine instead of large molecule. Thus, oncology vaccines do not show up under vaccines within infectious disease. This allows us to sort vaccines across all disease areas. “Other” in Infectious Disease refers mainly to anti-parasitic medicines and head lice treatments.
Wound healing was placed under dermatology if directly related to skin injury, but if directly affecting the immune system it is labeled under immunology. Immunology is ex-GI diseases. This is significant as some databases will place IBD under inflammation, but we chose to place it under gastrointestinal.
Platform refers to molecular platforms only, not target- or hypothesis-driven platforms. For example, a company focused on the mTOR pathway would not be a platform company, but a company designing bispecific Fab fragments would count as platform.Strokes involving the brain are classified under neurology, but if designed for heart stroke in patients they are labeled as cardiovascular. Osteoporosis falls under endocrine, and Osteoarthritis was placed under “Other.” Also under “Other” are dermatology, allergy,musculoskeletal diseases, otology (ear diseases), periodontitis, urology/genitourinary, non-viral liver diseases, fertility drugs, and treatments for side effects of chemotherapy or radiation.

Venture Capital
Sources for Venture Capital transactions: For U.S. venture capital, the primary data source used was the Cortellis Competitive Intelligence database. This was supplemented with three others: EvaluatePharma, Informa’s Strategic Transactions, and BioCentury’s BCIQ database. Ex-U.S. venture capital was sourced primarily from EvaluatePharma and BioCentury’s BCIQ database. Further investigation of company R&D and financings was complemented with Factset and SEC filings as well as Fierce Biotech, Xconomy, BiotechGate, and company press releases.
Investments included: Equity investments in this study are predominantly venture in nature, with some exceptions at the Seed stage where angel investors, family offices, and other non-venture capital investors have an impact and are included. Cases where private money was raised for the sole purpose of acquiring an existing company were excluded. Additionally, debt financing, bridge loans, government grants, and disease/patient foundation grants were excluded. Equity investments were aggregated, and duplicates and non-drug company financing events were removed.
Treatment of tranches: As mentioned above, the tagging is based on the date of actual funding, not commitment to future tranches. For example, large Series A rounds can be spread out into payments stretching beyond a single year when press releases and major media outlets report a financing event. For example, a Series A round can have the sequence of A1, A2, A3 tranched rounds within the same year or in different years. These were accounted for by year such that the accounting is for companies financed per year, not payments/tranches per year. For example, a company with A1, A2, and A3 payments in 2012 would be treated as a single company financing in 2012, not three separate Series A round financings. If the A1, A2, and A3 rounds occurred in 2011, 2012, and 2013, then these would be counted as one Series A round investment per year. This enables an accurate accounting of breadth of funding on a yearly basis.
IPOs: BIO Industry Analysis uses IPO amounts reported on the Nasdaq.com website, S-1 filings with the SEC. IPOs are tracked from a variety of news feeds including EndPoints, Biocentury, BioWorld, FierceBiotech. Disease areas and phase were tagged according to lead product in R&D at the time of investment.
Follow-on offerings: Biocentury was the primary data source for follow-on offerings. Only new shares issued in a follow-on offering valued at more than $10 million were included. Values exclude sales of shares by inside investors. Disease areas and phase were tagged according to lead product in R&D at the time of investment.
Licensing: Informa’s Strategic Transactions database, the Cortellis Deals Intelligence database (formerly Recap), and Biocentury were the primary data sources for licensing. Disease areas and phase were tagged according to lead product in R&D at the time of the deal.
Acquisitions: The primary data source for acquisitions was the Informa Strategic Transactions database. This was supplemented with the Cortellis Deals Intelligence (formerly Recap), EvaluatePharma, and Biocentury. Disease areas and phase were tagged according to lead product in R&D at the time of the deal. For global acquisition data, we report upfront payments to more accurately reflect the actual money flow into small company investors. Although Contingent Value Rights (CVRs) structures are now being used extensively in emerging company acquisitions (66% of acquisitions in our dataset), the upfront dollars are an immediate, guaranteed commitment from the partner or acquirer. The data presented for acquisitions includes both R&D-stage emerging companies (with a lead product in Preclinical, Phase I, Phase II, or Phase III testing), and market-stage emerging companies (with an approved product but with under $1 billion in product sales). By focusing only on emerging companies, this data may differ from other currently available reports that often include large company acquisitions.
Public Funding, Alliances and Acquisitions

Contact Information:
David Thomas, CFAVice President, Industry Research, BIO