Emerging markets: is risk aversion dead? David Lubin November 2002.
22
Emerging markets: is risk aversion dead? David Lubin November 2002
-
Upload
clinton-dennis -
Category
Documents
-
view
216 -
download
0
Transcript of Emerging markets: is risk aversion dead? David Lubin November 2002.

Emerging markets: is risk aversion dead?
David Lubin
November 2002

Risk appetite collapsed in 2002
Total issuance of bonds, loans and equity by emerging markets (US$bn)
0
50
100
150
200
250
300
Jan Feb Mar Apr May Jun Jul Aug Sep Oct Nov Dec
1997 1998 1999 2000 2001 2002

ONSCREEN
...but risk appetite seems to have re-appeared
90
95
100
105
1102-
Sep
9-Se
p
16-S
ep
23-S
ep
30-S
ep
7-O
ct
14-O
ct
21-O
ct
28-O
ct
4-N
ov
11-N
ov
18-N
ov
25-N
ov
7000
8000
9000
VEB ARS CLP
ILS KRW THB
Dow Jones, right scale

ONSCREEN
On what does risk appetite depend? Real US rates?
-6-4-202468
1012
Jan-
70
Jan-
72
Jan-
74
Jan-
76
Jan-
78
Jan-
80
Jan-
82
Jan-
84
Jan-
86
Jan-
88
Jan-
90
Jan-
92
Jan-
94
Jan-
96
Jan-
98
Jan-
00
Jan-
02
Lending boom to Latin America
Latin American debt crisis
“Emerging markets” is born
October 2001 “mini-boom”

ONSCREEN
...or US asset prices?
700
800
900
1000
1100
1200
1300
1400
1500
1600Se
p-99
Dec
-99
Mar
-00
Jun-
00
Sep-
00
Dec
-00
Mar
-01
Jun-
01
Sep-
01
Dec
-01
Mar
-02
Jun-
02
Sep-
02
1.5
2
2.5
3
3.5
4
4.5
S&P Brazilian real/USD, right scale (inv erted)

ONSCREEN
The fall in net private capital flows is long-lasting
Net private direct investment Net private portfolio investment
Other net private capital flows Total flows
-200-150
-100-50
050
100150200
250300
1990 1991 1992 1993 1994 1995 1996 1997 1998 1999 2000 2001
US$bn

ONSCREEN
FDI flows are at risk
Privatisation as a share of total FDI flows, 1990-1999
36%
6%
42%
0%
5%
10%
15%
20%
25%
30%
35%
40%
45%
Latin America Asia Europe
ONSCREEN
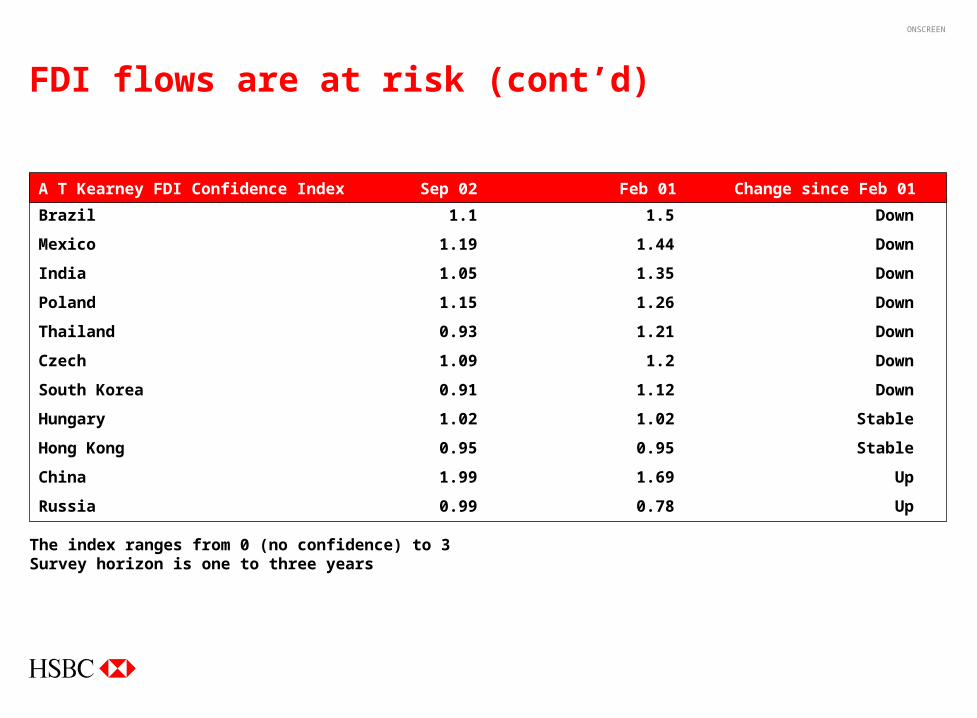
FDI flows are at risk (cont’d)
Brazil 1.1 1.5 Down
Mexico 1.19 1.44 Down
India 1.05 1.35 Down
Poland 1.15 1.26 Down
Thailand 0.93 1.21 Down
Czech 1.09 1.2 Down
South Korea 0.91 1.12 Down
Hungary 1.02 1.02 Stable
Hong Kong 0.95 0.95 Stable
China 1.99 1.69 Up
Russia 0.99 0.78 Up
A T Kearney FDI Confidence Index Sep 02 Feb 01 Change since Feb 01
The index ranges from 0 (no confidence) to 3Survey horizon is one to three years
ONSCREEN
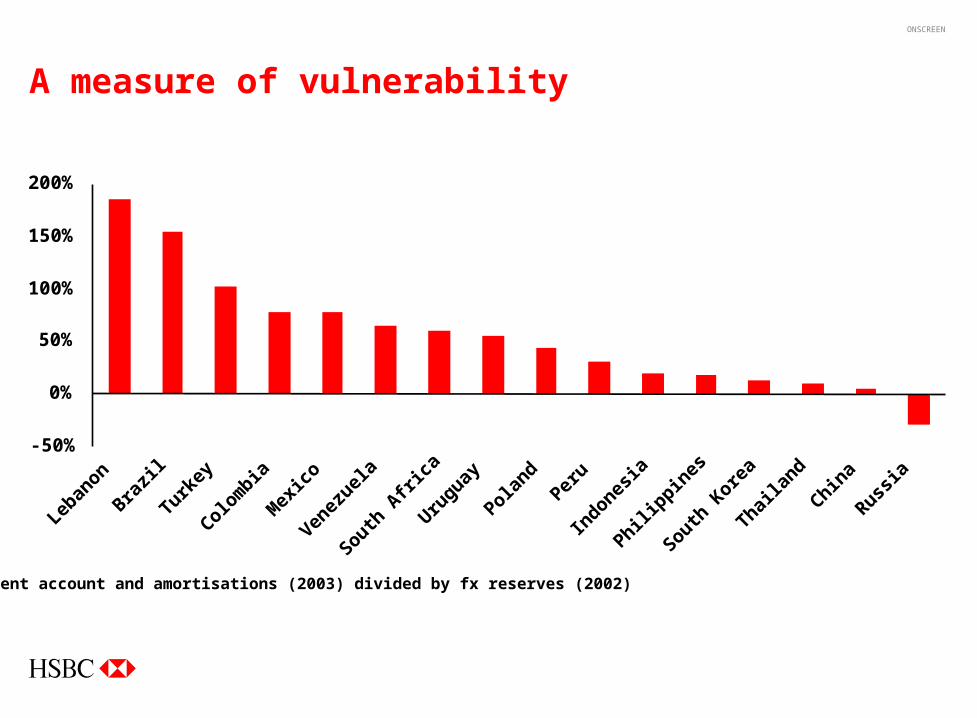
A measure of vulnerability
Current account and amortisations (2003) divided by fx reserves (2002)
-50%
0%
50%
100%
150%
200%
Leban
on
Brazil
Turkey
Colom
bia
Mex
ico
Venez
uela
South A
frica
Uruguay
Poland
Peru
Indones
ia
Philippin
es
South K
orea
Thaila
nd
China
Russia

ONSCREEN
Brazil’s basic problem
0%
10%
20%
30%
40%
50%
60%
Thaila
nd
Philippin
es
Indones
ia
South K
orea
Russia
South A
frica
Mex
ico
Turkey
China
Poland
Venez
uela
Colom
biaPer
u
Brazil
Argen
tina
Exports as a share of GDP

ONSCREEN
Brazil’s current account adjustment is great, but...
-30.5-33.4
-25.3 -24.2 -23.2
-10.0
-40.0
-35.0
-30.0
-25.0
-20.0
-15.0
-10.0
-5.0
0.0
1997 1998 1999 2000 2001 2002
$ bn
ONSCREEN
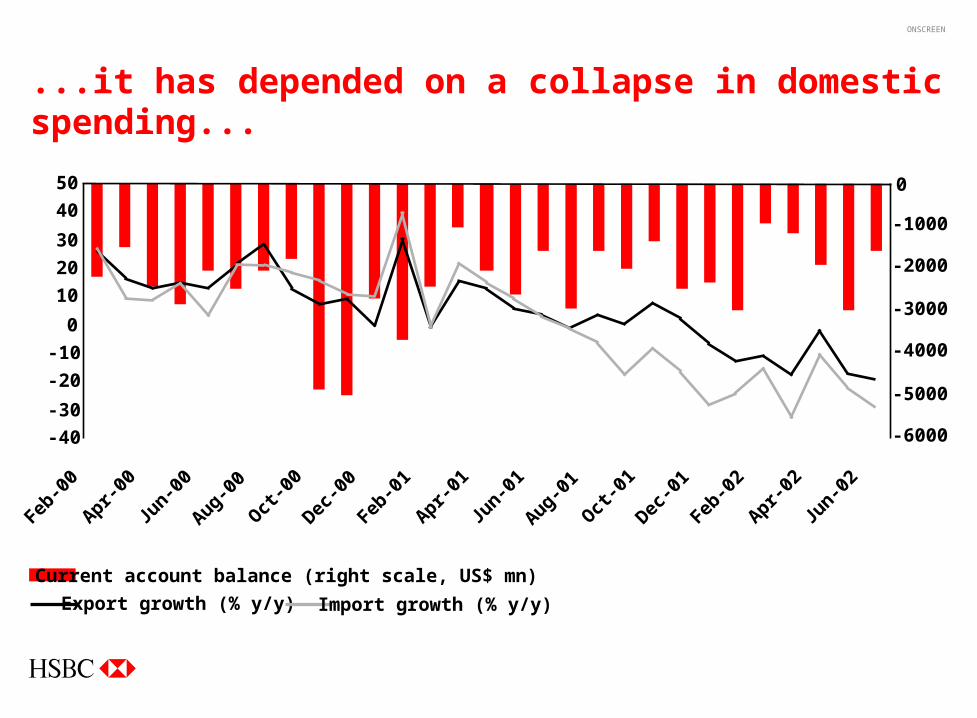
...it has depended on a collapse in domestic spending...
-40
-30
-20
-10
0
10
20
30
40
50
Feb-0
0
Apr-00
Jun-0
0
Aug-00
Oct-0
0
Dec-0
0
Feb-0
1
Apr-01
Jun-0
1
Aug-01
Oct-0
1
Dec-0
1
Feb-0
2
Apr-02
Jun-0
2
-6000
-5000
-4000
-3000
-2000
-1000
0
Current account balance (right scale, US$ mn)
Export growth (% y/y) Import growth (% y/y)

ONSCREEN
...and a weak exchange rate...
0.0
0.5
1.0
1.5
2.0
2.5
3.0
3.5
4.0
Jan-80 Jan-82 Jan-84 Jan-86 Jan-88 Jan-90 Jan-92 Jan-94 Jan-96 Jan-98 Jan-00 Jan-02
Brazil's inflation-adjusted exchange rate

ONSCREEN
...which makes the domestic debt burden grow...
Brazil’s domestic debt
Floating rate
61%
US$-linked
30%
Fixed rate
9%

ONSCREEN
...creating a solvency risk
Domestic debt External debt
0.00
10.00
20.00
30.00
40.00
50.00
60.00
70.00
Jun-9
7
Oct-9
7
Feb-9
8
Jun-9
8
Oct-9
8
Feb-9
9
Jun-9
9
Oct-9
9
Feb-0
0
Jun-0
0
Oct-0
0
Feb-0
1
Jun-0
1
Oct-0
1
Feb-0
2
Jun-0
2
% GDP
ONSCREEN
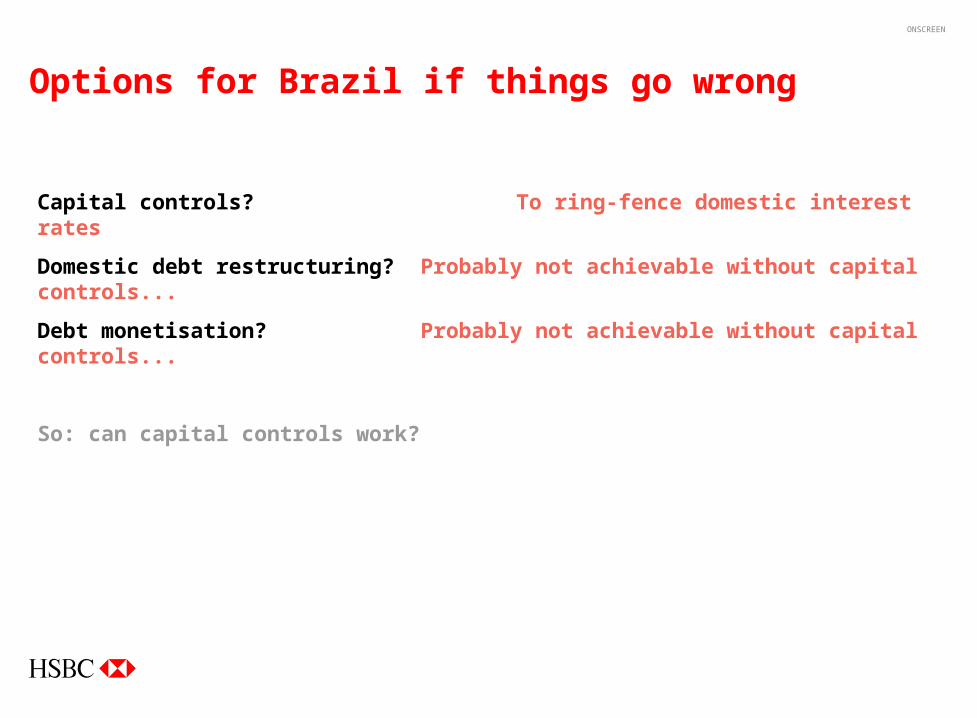
Options for Brazil if things go wrong
Capital controls? To ring-fence domestic interest rates
Domestic debt restructuring? Probably not achievable without capital controls...
Debt monetisation? Probably not achievable without capital controls...
So: can capital controls work?

ONSCREEN
Is there ‘moral hazard’ in Turkey?
Can there be ‘creditor’ moral hazard without ‘debtor’ moral hazard?
IMF share of 2003-2006 external amortisations
Turkey 24%Brazil 17%

ONSCREEN
Contagion mechanisms have changed
0%
20%
40%60%
80%
100%
120%
140%160%
180%
200%
1993 1994 1995 1996 1997 1998 1999 2000 2001
Latin America Emerging Asia EMEA
Short term external debt divided by fx reserves

ONSCREEN
Common creditor problems?
Turkey 28% 10%
Russia 50% 6%
Ukraine 31% 15%
Romania 17% 24%
South Africa 21% 9%
Germany France
Brazil 17% 24%
Mexico 41% 35%
Colombia 29% 25%
Venezuela 37% 16%
Argentina 23% 27%
Spain USA

ONSCREEN
Russian creditworthiness has improved massively
100
120
140
160
180
200
220
240
260
1997 1998 1999 2000 2001 2002 2003
-2
0
24
6
8
10
1214
16
18
% Ex ports goods, serv ices & income Current account % of GDP, right scale

ONSCREEN
Mexican peso isn’t cheap, but ability to pay is strong
0
20
40
60
80
100
120
140
160
Jan-8
0
Jan-8
2
Jan-8
4
Jan-8
6
Jan-8
8
Jan-9
0
Jan-9
2
Jan-9
4
Jan-9
6
Jan-9
8
Jan-0
0
Jan-0
2
0
50
100
150
200
250
300
350
400
External debt/exports ratio, right scale Real exchange rate index, 1990=100, left scale

David Lubin
November 2002
Emerging markets: is risk aversion dead?