
Jp north jp mira road_archstones property solutions_asps_bhavik_bhatt
Upload
truongkhanhCategory
view
217download
0
Aberdeen Asset Management (“AAM”) is the marketing name in Canada for Aberdeen Asset Management Inc., Aberdeen Fund Distributors,
LLC, and Aberdeen Asset Management Asia Ltd and Aberdeen Asset Management Canada Limited. Aberdeen Asset Management Inc. is
registered as a Portfolio Manager in the Canadian provinces of Ontario, Nova Scotia and New Brunswick, and as an Investment Fund Manager
in the Canadian provinces of Ontario, Quebec, and Newfoundland and Labrador. Aberdeen Asset Management Asia Limited and Aberdeen
Asset Management Canada Limited are registered as Portfolio Managers in Ontario. Aberdeen Fund Distributors, LLC operates as an Exempt
Market Dealer in all provinces and territories of Canada. Aberdeen Fund Distributors, LLC and Aberdeen Asset Management Canada Limited
are wholly owned subsidiaries of Aberdeen Asset Management Inc. Both Aberdeen Asset Management Inc. and Aberdeen Asset Management
Asia Ltd. are wholly owned by Aberdeen Asset Management PLC.
For professional use only – Not for Public distribution
Emerging Market Debt
Niagara Institutional Dialogue
Karen Bater, CFA, Senior Fixed Income Specialist
Aberdeen Asset Management
June 10, 2015

1
What happened in 2014?
2
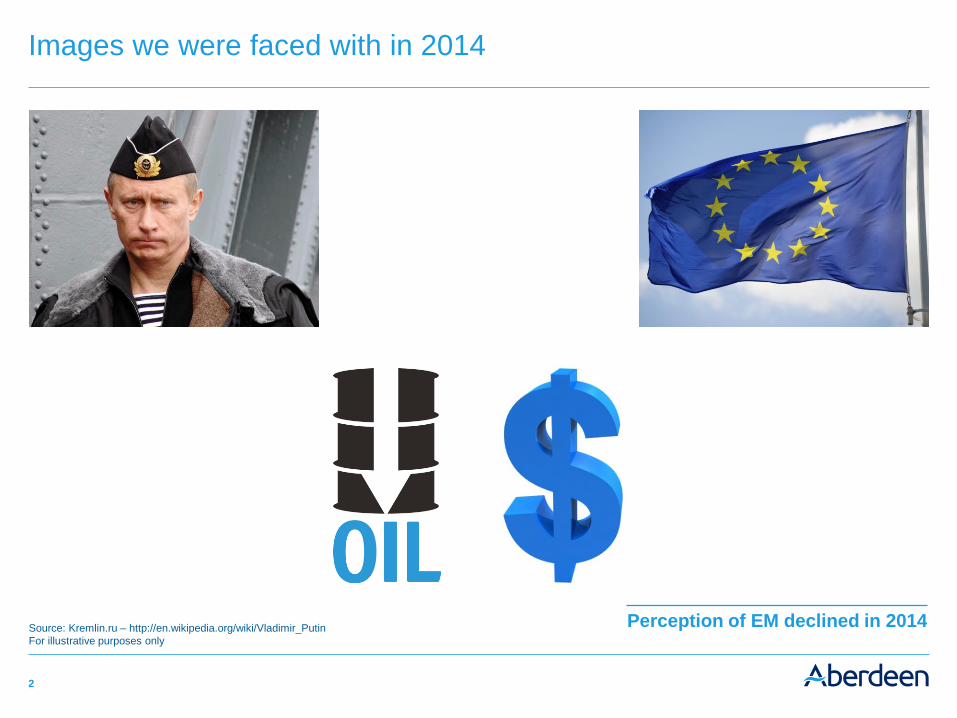
Images we were faced with in 2014
Source: Kremlin.ru – http://en.wikipedia.org/wiki/Vladimir_Putin
For illustrative purposes only
Perception of EM declined in 2014

3
But despite all the noise returns were solid in EM
2014 total returns across asset classes (%)
Source: JP Morgan, 31 Dec 14. Past performance is not indicative of future results
Indexes used: US Equities: S&P 500, Frontiers: JPM NEXGEM, US IG Credit: JPM JULI, EM Hard Sov: JPM EMBI GD, US Treasuries: JPM US Treasuries, EM Corporates: JPM CEMBI BD,
US High Yield: JPM HY, EM Equities: JPM EM Free, EM Local Sov: JPM GBI-EM GD
Indexes are unmanaged and have been provided for comparison purposes only. No fees or expenses are reflected. Individuals cannot invest directly in an index. For illustrative purposes only
-5.72%
-1.82%
1.67%
4.96%
6.08%
7.43%
7.99%
10.58%
14.87%
-10% -5% 0% 5% 10% 15% 20%
EM Local Sov.
EM Equities
US High Yield
EM Corporates
US Treasuries
EM Hard Sov.
US IG Credit
Frontiers
US Equities
4
Myth and reality – true face of DM and EM fundamentals

5
Growth
Annual GDP growth (%)
Source: International Monetary Fund (IMF), Oct 14
Forecasts are offered as opinion and are not reflective of potential performance, are not guaranteed and actual events or results may differ materially. For illustrative purposes only
-6
-4
-2
0
2
4
6
8
10
2000 2001 2002 2003 2004 2005 2006 2007 2008 2009 2010 2011 2012 2013 2014 2015 2016 2017 2018 2019
Emerging market and developing economies Advanced economies%
Forecast

6
Demographics
Population growth
Source: Emerging Advisors Group, Nov 14
For illustrative purposes only
Population growth (%y/y) EM DM
0.0%
0.5%
1.0%
1.5%
2.0%
2.5%
3.0%
1960 1965 1970 1975 1980 1985 1990 1995 2000 2005 2010
7
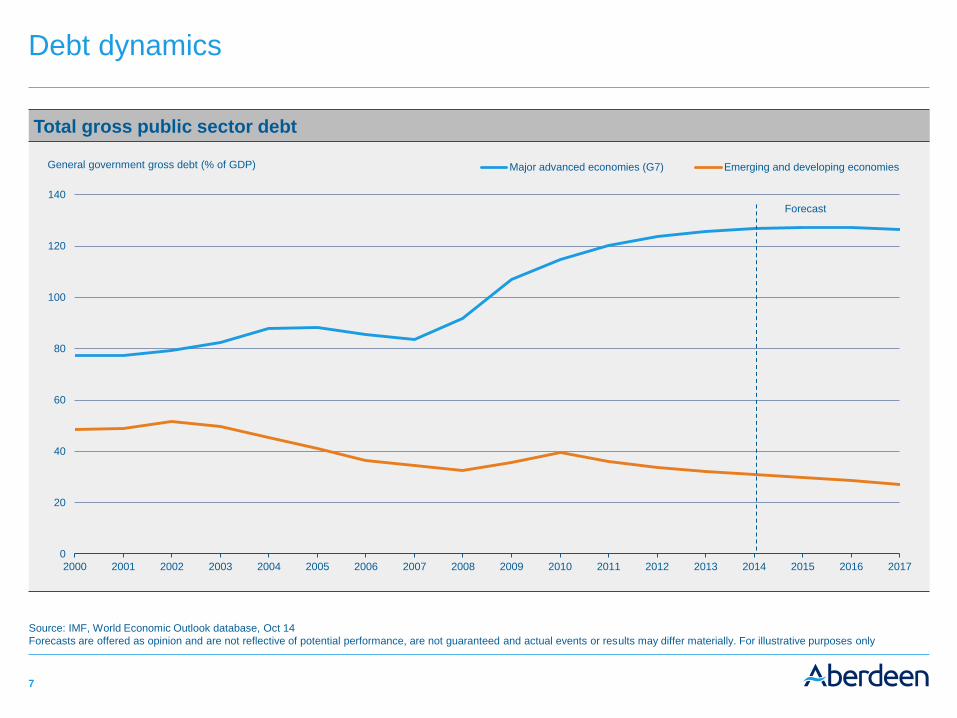
Debt dynamics
Total gross public sector debt
Source: IMF, World Economic Outlook database, Oct 14
Forecasts are offered as opinion and are not reflective of potential performance, are not guaranteed and actual events or results may differ materially. For illustrative purposes only
0
20
40
60
80
100
120
140
2000 2001 2002 2003 2004 2005 2006 2007 2008 2009 2010 2011 2012 2013 2014 2015 2016 2017
Major advanced economies (G7) Emerging and developing economiesGeneral government gross debt (% of GDP)
Forecast
8
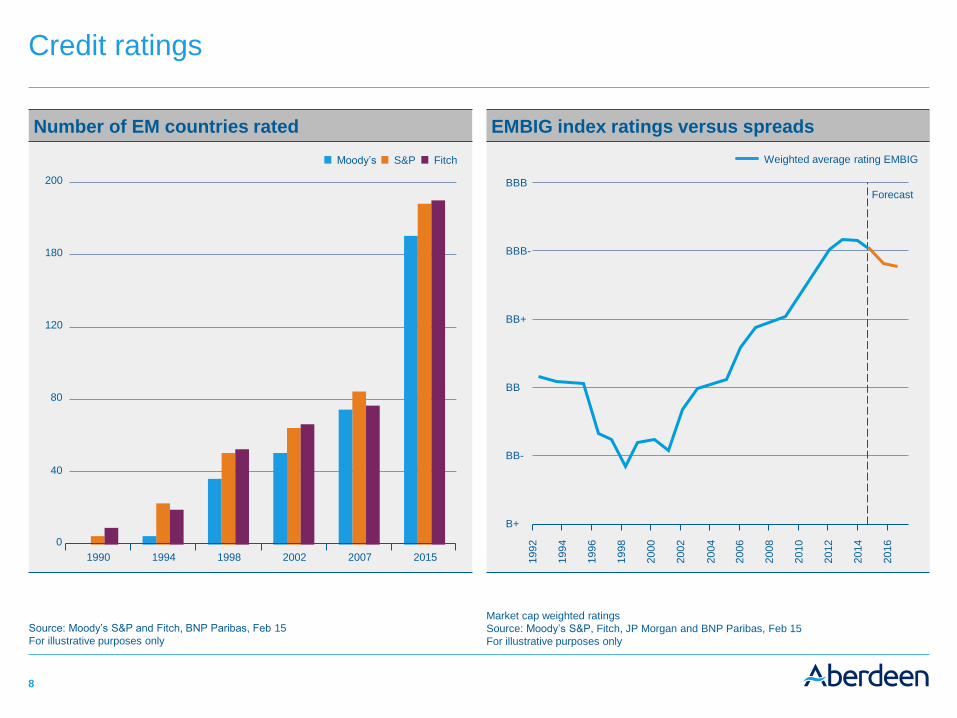
Credit ratings
Number of EM countries rated EMBIG index ratings versus spreads
Source: Moody’s S&P and Fitch, BNP Paribas, Feb 15
For illustrative purposes only
Market cap weighted ratings
Source: Moody’s S&P, Fitch, JP Morgan and BNP Paribas, Feb 15
For illustrative purposes only
1990 1994 1998 2002 2007 2015
0
40
80
120
180
200
Moody’s S&P Fitch Weighted average rating EMBIG
1992
1994
1996
1998
2000
2002
2004
2006
2008
2010
2012
2014
2016
BBB-
BBB
BB+
BB
BB-
B+
Forecast

9
EM universe – From IG to Frontiers

10
The EMD universe
Total EMD debt stock: USD 9.4trn Size of the EMD market by investment type
Source: JP Morgan, 31 Mar 15
Indexes are unmanaged and have been provided for comparison purposes only. No fees or expenses are reflected. Individuals cannot invest directly in an index. For illustrative purposes only
• EMD local debt is nearly three times the value of external debt
0
1
2
3
4
5
6
7
8
9
10
2007 2008 2009 2010 2011 2012 2013 2014
Local Sovereign USD Sovereign USD Corporate
USD Corporate
$1,655bn
(18%)
Local Sovereign
$6,999bn
(75%)
USD Sovereign
$723bn
(8%)

11
Investible EMD universe
Record high corporate issuance continues to fuel the increase in EM market capitalization
Source: JP Morgan, 31 Mar 15
EM Corporate = CEMBI Broad, EM Sovereign = EMBI Global, EM Local = GBI-EM Broad Diversified
Indexes are unmanaged and have been provided for comparison purposes only. No fees or expenses are reflected. Individuals cannot invest directly in an index. For illustrative purposes only
28 35 55 79 123 147 198 159 240 344 419
620 716 793 809
185 203 250 271 292 299
295 249
342
407 457
579 586
651 676
116 174
249
416
525 652
899 861
1,111
1,433
1,445
1,535 1,481
1,574 1,545
0
500
1,000
1,500
2,000
2,500
3,000
3,500
2001 2002 2003 2004 2005 2006 2007 2008 2009 2010 2011 2012 2013 2014 2015
EM External Corporates EM External Sovereigns EM Local SovereignsUSD bn

12
Comparison of sovereign indices
Hard Currency1
Hard Currency
Investment Grade2
Hard Currency
Frontiers3
Local Currency4
Market cap. US$676bn US$235bn US$73.1bn US$916bn
Average rating Baa3/BBB- Baa1/BBB B1/B+ Baa2/BBB+
Inv. Grade (%) 60 100 - 85
No. of countries 62 25 31 16
Yield (%) 5.57 4.44 7.00 6.34
Modified duration (years) 7.16 7.71 5.42 4.96
Source: JP Morgan, Aberdeen Asset Management, 31 Mar 15
1. JPM EMBI Global Diversified Index
2. JPM EMBI Global Diversified Investment Grade Index
3. JPM NEXGEM Index
4. JPM GBI-EM Global Diversified Index
In determining average credit rating, ratings from Moody’s, Standard & Poors, or Fitch will apply. Every security is assigned an average credit rating. The higher rating will apply for split rated
securities. The average credit quality is a market-weighted average of all the securities. Indexes are unmanaged and have been provided for comparison purposes only. No fees or expenses
are reflected. Individuals cannot invest directly in an index. For illustrative purposes only

13
Mexican operating costs remain one of the lowest in the world
Mexico (BBB+): Reform can lead to substantial FDI in the coming years
Private Sector Direct Investment (US$ billions)
Source: Rystad Energy, Morgan Stanley Commodity Research, Dec 14
* Conventional. For illustrative purposes only
10
20
30
40
50
2002 2003 2004 2005 2006 2007 2008 2009 2010 2011 2012 2013* 2014F 2015F 2016F 2017F 2018F 2019F
Cash costs with royalties
Cumulative global liquids production, mmb/d
Saudi Arabia Iraq
Mexico China UAE
Canada ex Oilsands UK US*
Nigeria Russia
Venezuela
Canada Oilsands
$0
0
$10
$20
$30
$40
$50
$60
10 20 30 40 50 60 70 80 90
Operating costs with royalty effects, $/bbl
Source: Banamex, Jan 15. * $13bn via Inheuser-Busch Inbev’s acquisition of beer company Grupo Modelo
Forecasts are offered as opinion and are not reflective of potential performance, are not guaranteed and actual events or results may differ materially. For illustrative purposes only

14
Indonesia (BB+): Phasing out subsidies is key to increased public investment
Source: CEIC, MOF estimates, media reports, Bank of America Merrill Lynch Global Research estimates, Feb 15
Estimates are offered as opinion and are not reflective of potential performance, are not guaranteed and actual events or results may differ materially. For illustrative purposes only
Capital expenditure Energy subsidies % GDP
4.5%
4.0%
3.5%
3.0%
2.5%
2.0%
1.5%
1.0%
0.5%
0.0%
2006 2007 2008 2009 2010 2011 2012 2013 2014 2015
Government
budget estimates

15
Russia (BB+): External balances remain strong
Imports to show strong substitution effect External debt breakdown
Source: CBR, VTB Capital Research, Mar 15
For illustrative purposes only
Source: CBR, VTB Capital Research, Mar 15
For illustrative purposes only
Corporates, USD bn
Sovereign, USD bn
Banks, USD bn
Total external debt, % of annual GDP
Quasi-sovereign, USD bn
800
700
600
500
400
300
200
100
0
39%
37%
35%
33%
31%
29%
27%
25%
2006 2007 2008 2009 2010 2011 2012 2013 2014 2008 2009 2010 2011 2012 2013 2014 2015
-40
-30
-20
-10
0
10
20
0
100
200
300
500
600
800
900
700
400
YoY % Disposable income available for non-food spending, USD bn (RHS)
16
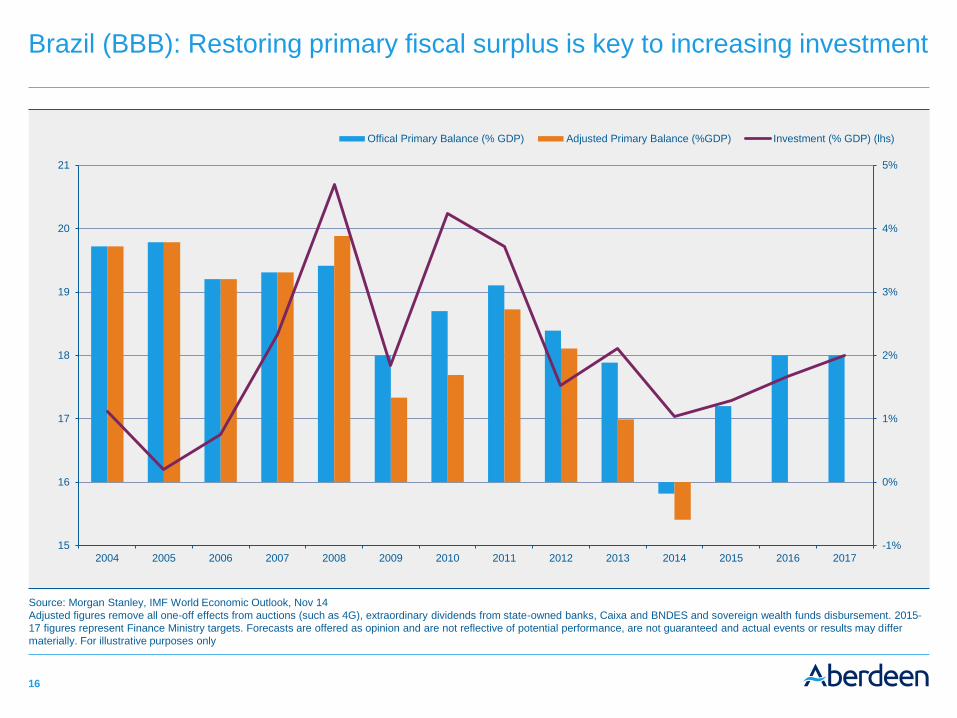
Brazil (BBB): Restoring primary fiscal surplus is key to increasing investment
Source: Morgan Stanley, IMF World Economic Outlook, Nov 14
Adjusted figures remove all one-off effects from auctions (such as 4G), extraordinary dividends from state-owned banks, Caixa and BNDES and sovereign wealth funds disbursement. 2015-
17 figures represent Finance Ministry targets. Forecasts are offered as opinion and are not reflective of potential performance, are not guaranteed and actual events or results may differ
materially. For illustrative purposes only
-1%
0%
1%
2%
3%
4%
5%
15
16
17
18
19
20
21
2004 2005 2006 2007 2008 2009 2010 2011 2012 2013 2014 2015 2016 2017
Offical Primary Balance (% GDP) Adjusted Primary Balance (%GDP) Investment (% GDP) (lhs)

17
Mongolia (B): Through Rio Tinto glasses
Trade balance is improving despite 20% drop in copper prices since end 2011
Source: Bloomberg, 31 Dec 14
For illustrative purposes only
-
200,000
400,000
600,000
800,000
1,000,000
1,200,000
1,400,000
(2,500)
(2,000)
(1,500)
(1,000)
(500)
-
500
Dec 11 Jun 12 Dec 12 Jun 13 Dec 13 Jun 14
Chinese Copper Demand from Mongolia (tonnes) Trade Balance (12 month rolling US$mn)

18
Challenges and opportunities within fixed income

19
Developed market bond yields are collapsing
YTM breakdown of JPMorgan GBI YTM breakdown of JPMorgan EMU GBI
Source: JPMorgan, 28 Feb 15
Figures may appear not to add due to rounding. Indexes are unmanaged and have been provided for comparison purposes only. No fees or expenses are reflected. Individuals cannot invest
directly in an index. For illustrative purposes only
Between 0% and 1%
46.1%
Between 1% and 2%
34.3%
>2%
12.4%
<0%
7.2
• More than 7% of the index constituents have
negative yields
• JPMorgan GBI Global average yield is 0.99%
Between 0% and 1%
51.1%
Between 1% and 2%
19.2%
>2%
4.3%
<0%
25.3
• More than 25% of the index constituents have
negative yields
• JPMorgan EMU GBI average yield is 0.56%

20
EM valuations stand out
Source: JP Morgan, 6 May 15
EM HC Sovereign: JPM EMBI Global Diversified Index; EM LC Sovereign: JPM GBI-EM Global Diversified Index; DM Sovereign: JPM GBI Global Index
For illustrative purposes only
0
1
2
3
4
5
6
7
8
2010 2011 2012 2013 2014 2015
EM Local Currency EM Hard Currency DM Sovereign

21
Institutional flows remain supportive
EM debt flows (US$bn)
Source: IIF, EPRF, May 15
Note: IIF includes both institutional and retail flows and EPFR is retail only. For illustrative purposes only
• Since 2010 there have only been four months of debt outflows from emerging market debt
• IIF reports that there have been inflows of $1 trillion during that time, 10 times the amount reported by
EPFR
-30
-20
-10
0
10
20
30
40
Jan 10 Jul 10 Jan 11 Jul 11 Jan 12 Jul 12 Jan 13 Jul 13 Jan 14 Jul 14 Jan 15
IIF EPFR
22
Disclaimer
Important: The above is strictly for private circulation and information purposes only and should not be considered as an offer, or solicitation, to deal in any of the investments mentioned
herein. Aberdeen Asset Management Inc. (“AAMI”) does not warrant the accuracy, adequacy or completeness of the information and materials contained in this document and expressly
disclaims liability for errors or omissions in such information and materials. Past performance is not necessarily a guide to the future. Any research or analysis used in the preparation of this
document has been procured by AAMI or its affiliates for their own use and may have been acted on for their own purpose. The results thus obtained are made available only coincidentally
and the information is not guaranteed as to its accuracy. Some of the information in this document may contain projections or other forward looking statements regarding future events or
future financial performance of countries, markets or companies. These statements are only predictions and actual events or results may differ materially. The reader must make his/her own
assessment of the relevance, accuracy and adequacy of the information contained in this document and make such independent investigations, as he/she may consider necessary or
appropriate for the purpose of such assessment. Any opinion or estimate contained in this document is made on a general basis and is not to be relied on by the reader as advice. Neither
AAMI nor any of its agents have given any consideration to nor have they made any investigation of the investment objectives, financial situation or particular need of the reader, any specific
person or group of persons. Accordingly, no warranty whatsoever is given and no liability whatsoever is accepted for any loss arising whether directly or indirectly as a result of the reader,
any person or group of persons acting on any information, opinion or estimate contained in this document. The information herein including any expressions of opinion or forecast have been
obtained from or is based upon sources believed by AAMI to be reliable but is not guaranteed as to accuracy or completeness. The information is given without obligation and on the
understanding that any person who acts upon it or otherwise changes his position in reliance there on does so entirely at his or her own risk. AAMI reserves the right to make changes and
corrections to its opinions expressed in this document at any time, without notice. Any unauthorized disclosure, use or dissemination, either whole or partial, of this document is prohibited and
this document is not to be reproduced, copied, made available to others.
Returns are presented gross of management fees and include the reinvestment of all income. Actual returns will be reduced by investment advisory fees and other expenses that may be
incurred in the management of the account. A fee schedule is an integral part of a complete presentation and is described in Part II of the firm’s ADV, which is available upon request. The
collection of fees produces a compounding effect on the total rate of return net of management fees. As an example, the effect of investment management fees on the total value of a client’s
portfolio assuming (a) quarterly fee assessment, (b) $1,000,000 investment, (c) portfolio return of 8% a year, and (d) 1.00% annual investment advisory fee would be $10,416 in the first year,
and cumulative effects of $59,816 over five years and $143,430 over ten years. Actual investment advisory fees incurred by clients may vary.
This document does not constitute or form part of any offer for sale or solicitation of any offer to buy or subscribe for any securities nor shall it or any part of it form the basis of or be relied on
in connection with, or act as any inducement to enter into, any contract or commitment whatsoever. This document does not constitute investment advice and AAMI is not holding itself out as
engaging in the business of advising others as to the investing in or the buying or selling of securities. AAMI is not in the business of advising others as to the investing in or the buying or
selling of securities except in those provinces and territories in Canada in which it is duly registered as an advisor or in which it is entitled to rely on an exemption. AAMI is not registered as an
advisor in all provinces and territories of Canada. In considering the prior performance information contained herein, potential investors should bear in mind that past performance is not
necessarily indicative of future results, and there can be no assurance that AAMI will achieve comparable results.
Risk considerations: Foreign securities are more volatile, harder to price and less liquid than U.S. Securities. They are subject to different accounting and regulatory standards, and political
and economic risks. These risk may be enhanced in emerging markets countries.
Fixed income securities are subject to certain risks including, but not limited to: interest rate (changes in interest rates may cause a decline in the market value of an investment), credit
(changes in the financial condition of the issuer, borrower, counterparty, or underlying collateral), prepayment (debt issuers may repay or refinance their loans or obligations earlier than
anticipated), and extension (principal repayments may not occur as quickly as anticipated, causing the expected maturity of a security to increase).
Indexes are unmanaged and have been provided for comparison purposes only. No fees or expenses are reflected. You cannot invest directly in an index.
Standard & Poor’s credit ratings are expressed as letter grades that range from “AAA” to “D” to communicate the agency’s opinion of relative level of credit risk. Ratings from ‘AA’ to ‘CCC’
may be modified by the addition of a plus (+) or minus (-) sign to show relative standing within the major rating categories. The investment grade category is a rating from AAA to BBB-.
Moody's is an independent, unaffiliated research company that rates fixed income securities. Moody’s assigns ratings on the basis of risk and the borrower’s ability to make interest payments.
Typically securities are assigned a rating from ‘Aaa’ to ‘C’, with ‘Aaa’ being the highest quality and ‘C’ the lowest quality.
For Professional Use Only. Not for Public Distribution
© 2015, Aberdeen Asset Management Inc.
aberdeen-asset.ca


![Tales Of Hearts - Story Dialogue Script v1.0 (JP) [By Peckingbird].txt](https://static.fdocuments.in/doc/165x107/577cd1881a28ab9e7894abd1/tales-of-hearts-story-dialogue-script-v10-jp-by-peckingbirdtxt.jpg)


![CUBE-BL-JP-18 CUBE-PK-JP-18 CUBE-YL-JP-18 (JP) …...CUBE-BL-JP-18 CUBE-PK-JP-18 CUBE-YL-JP-18 (JP) 1.2 Litre Capacity [JP] Operating Guide (JP)Please read this entire guide before](https://static.fdocuments.in/doc/165x107/5f0aa9a57e708231d42cb922/cube-bl-jp-18-cube-pk-jp-18-cube-yl-jp-18-jp-cube-bl-jp-18-cube-pk-jp-18-cube-yl-jp-18.jpg)