Emerging Issues in Workers Compensation: Obesity, Overweight & Physical Inactivity Workforce...
46
Emerging Issues in Workers Compensation: Obesity, Overweight & Physical Inactivity Workforce Reintegration of Veterans Neurodegenerative Disorders & Occupational Exposure Robert P. Hartwig, Ph.D., CPCU, Senior Vice President & Chief Economist Insurance Information Institute 110 William Street New York, NY 10038 Workers Compensation Education Conference Orlando, FL August 23, 2005
-
Upload
lindsey-sanders -
Category
Documents
-
view
216 -
download
1
Transcript of Emerging Issues in Workers Compensation: Obesity, Overweight & Physical Inactivity Workforce...
Emerging Issues inWorkers Compensation:
Obesity, Overweight &Physical Inactivity
Workforce Reintegration of Veterans
Neurodegenerative Disorders &Occupational Exposure
Robert P. Hartwig, Ph.D., CPCU, Senior Vice President & Chief EconomistInsurance Information Institute 110 William Street New York, NY 10038
Tel: (212) 346-5520 Fax: (212) 732-1916 [email protected] www.iii.org
Workers Compensation Education ConferenceOrlando, FL
August 23, 2005

Presentation Outline
• Obesity, Overweight, Physical Inactivity & Workers Compensation
• Reintegration of Military Veterans in the Workforce: Implications for Employers & WC Insurers
• Neurodegenerative Disorders & Occupational Exposure
• Terrorism
OBESITY & WORKERS
COMPENSATION
A Heavy BurdenFor Workers Comp?

Avg. Annual Hours Lost Per CA Worker Due to Obesity & Physical Inactivity
15.7516.6513.0
19.8
28.75
36.45
0
10
20
30
40
50
Obesity Physical Inactivity
Hou
rs L
ost
Per
Yea
r
Absences Short-term disability Presenteeism*
*Presenteeism is defined as productivity loss that occurs when workers are on the job but not fully functioning. Source: Topline Report, The Economic Costs of Physical Inactivity, Obesity, and Overweight in California Adults.
Obesity costs employers nearly 2 weeks per year per employee in terms
of lost output/ productivity
Physical inactivity costs employers
nearly 1.5 weeks per year per employee
in terms of lost output/ productivity
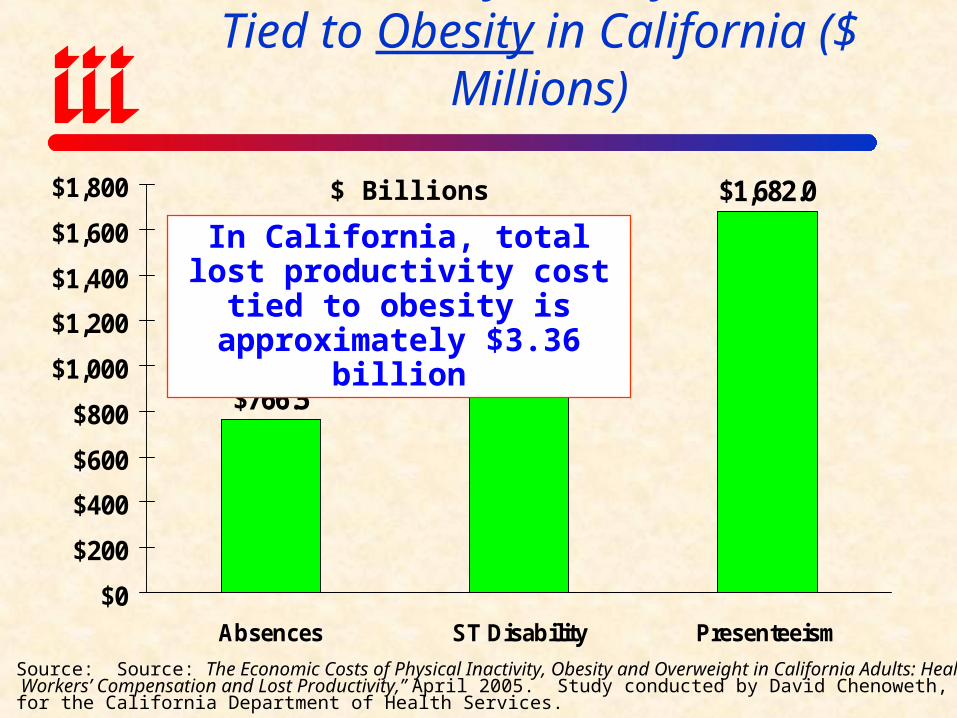
$1,682.0
$766.5$915.3
$0
$200
$400
$600
$800
$1,000
$1,200
$1,400
$1,600
$1,800
Absences ST Disability Presenteeism
Lost Productivity Cost By Risk Factor Tied to Obesity in California ($ Millions)
In California, total lost productivity cost tied to obesity is approximately $3.36 billion
$ Billions
Source: Source: The Economic Costs of Physical Inactivity, Obesity and Overweight in California Adults: Health Care, Workers’ Compensation and Lost Productivity,” April 2005. Study conducted by David Chenoweth, Ph.D., FAWHP, for the California Department of Health Services.
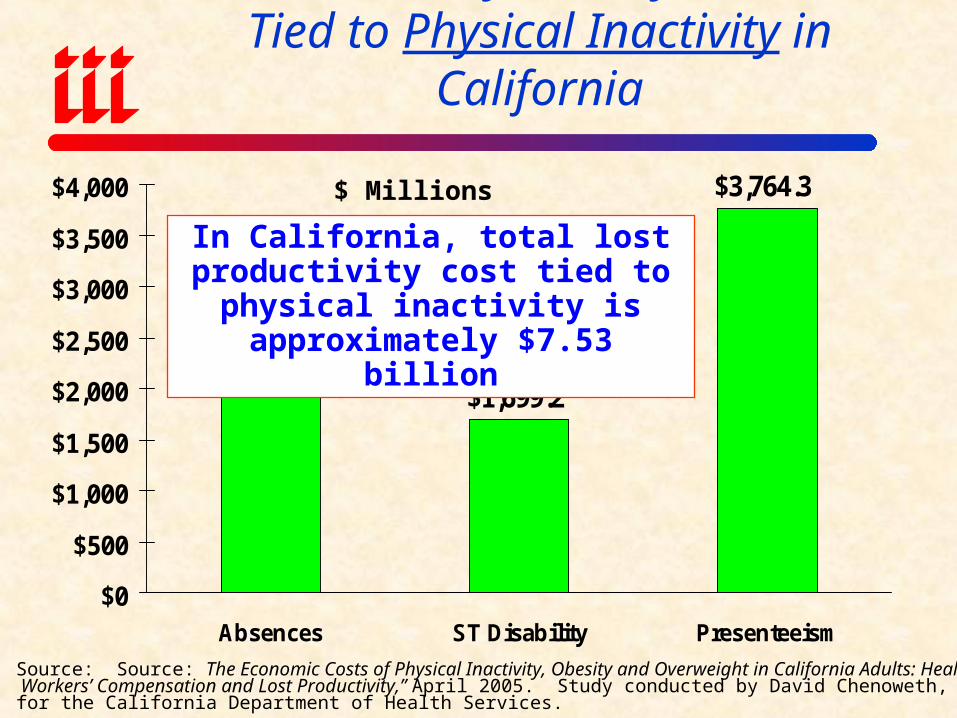
$2,065.1$1,699.2
$3,764.3
$0
$500
$1,000
$1,500
$2,000
$2,500
$3,000
$3,500
$4,000
Absences ST Disability Presenteeism
Lost Productivity Cost By Risk Factor Tied to Physical Inactivity in California
In California, total lost productivity cost tied to physical inactivity is
approximately $7.53 billion
$ Millions
Source: Source: The Economic Costs of Physical Inactivity, Obesity and Overweight in California Adults: Health Care, Workers’ Compensation and Lost Productivity,” April 2005. Study conducted by David Chenoweth, Ph.D., FAWHP, for the California Department of Health Services.
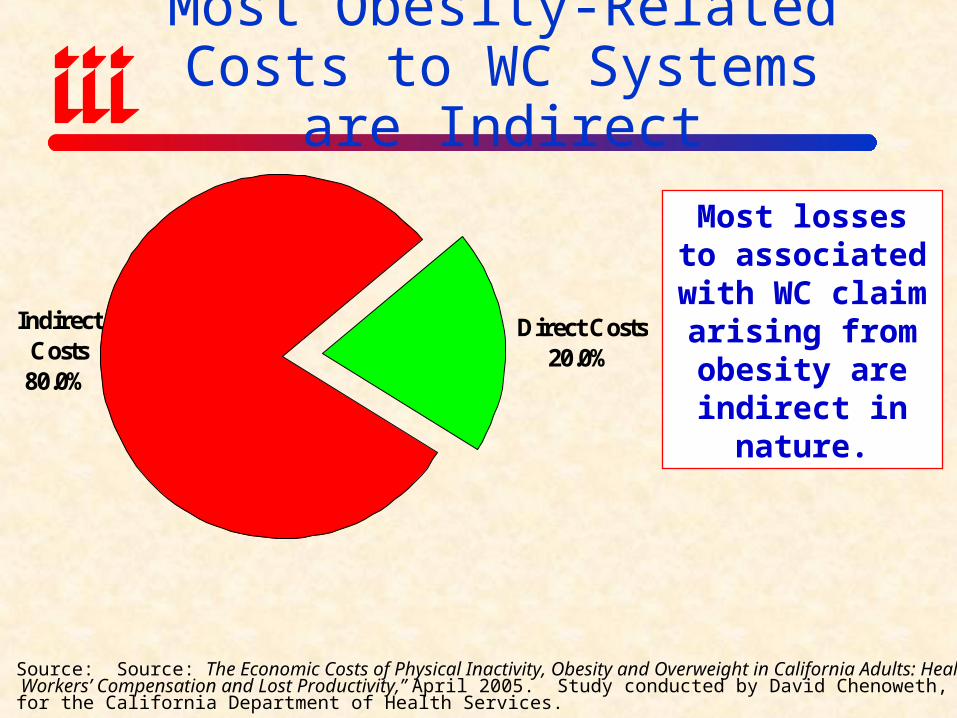
Most Obesity-Related Costs to WC Systems are Indirect
Direct Costs20.0%
Indirect Costs80.0%
Most losses to associated with
WC claim arising from obesity are
indirect in nature.
Source: Source: The Economic Costs of Physical Inactivity, Obesity and Overweight in California Adults: Health Care, Workers’ Compensation and Lost Productivity,” April 2005. Study conducted by David Chenoweth, Ph.D., FAWHP, for the California Department of Health Services.

Direct and Indirect Workers Comp Costs for Obesity in California Adults
(2000 Dollars)
Source: Source: The Economic Costs of Physical Inactivity, Obesity and Overweight in California Adults: Health Care, Workers’ Compensation and Lost Productivity,” April 2005. Study conducted by David Chenoweth, Ph.D., FAWHP, for the California Department of Health Services.
$ Millions
$17.7
$70.6
$0
$10
$20
$30
$40
$50
$60
$70
$80
Direct Indirect
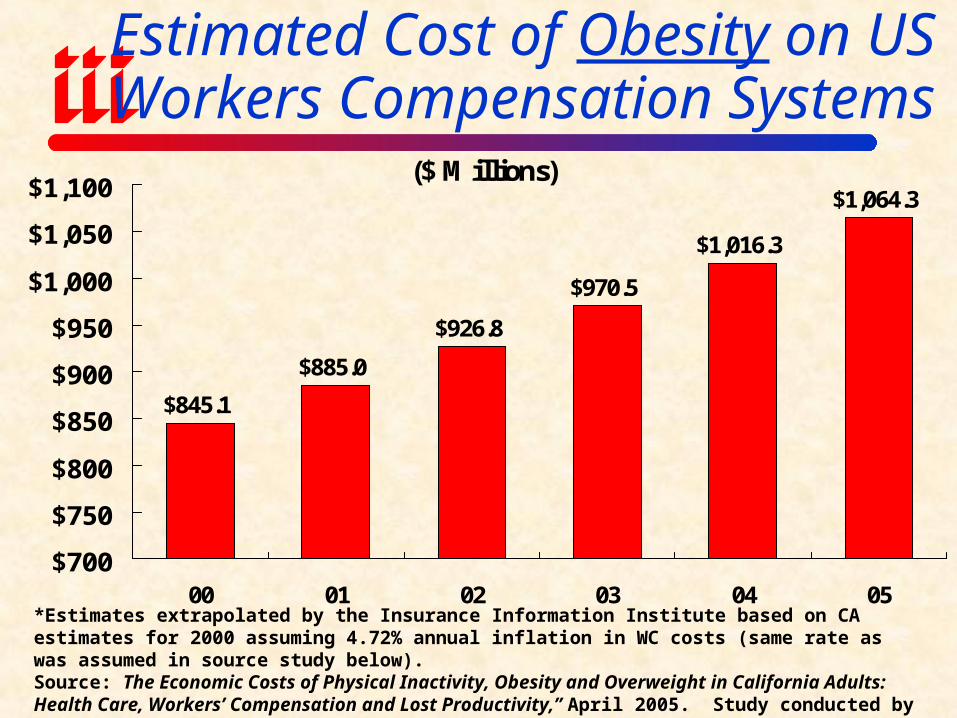
Estimated Cost of Obesity on US Workers Compensation Systems
($ Millions)
$845.1
$885.0
$926.8
$970.5
$1,016.3
$1,064.3
$700
$750
$800
$850
$900
$950
$1,000
$1,050
$1,100
00 01 02 03 04 05*Estimates extrapolated by the Insurance Information Institute based on CA estimates for 2000 assuming 4.72% annual inflation in WC costs (same rate as was assumed in source study below).Source: The Economic Costs of Physical Inactivity, Obesity and Overweight in California Adults: Health Care, Workers’ Compensation and Lost Productivity,” April 2005. Study conducted by David Chenoweth, Ph.D., FAWHP, for the California Department of Health Services.

Estimated Cost of Physical Inactivity on US Workers Compensation Systems
($ Millions)
$2,831.8
$2,392.6
$2,530.9
$2,677.1
$3,168.6
$2,995.5
$2,000
$2,200
$2,400
$2,600
$2,800
$3,000
$3,200
$3,400
00 01 02 03 04 05*Estimates extrapolated by the Insurance Information Institute based on CA estimates for 2000 assuming 5.779% annual inflation in WC costs (same rate as was assumed in source study below).Source: The Economic Costs of Physical Inactivity, Obesity and Overweight in California Adults: Health Care, Workers’ Compensation and Lost Productivity,” April 2005. Study conducted by David Chenoweth, Ph.D., FAWHP, for the California Department of Health Services.

Estimated Obesity Costs as a Percentage of WC Loss & LAE*
Obesity Costs as % of Loss & LAE
3.5%3.9% 4.2% 4.3%
4.0% 4.0%
0.0%0.5%1.0%1.5%2.0%2.5%3.0%3.5%4.0%4.5%
2000 2001 2002 2003 2004 2005
Obesity costs account for about 4% of workers comp losses over
the period from 2000-2005
*Estimates extrapolated by the Insurance Information Institute based on CA estimates for 2000 assuming 5% annual inflation in WC costs (same rate as was assumed in source study below).Source: The Economic Costs of Physical Inactivity, Obesity and Overweight in California Adults: Health Care, Workers’ Compensation and Lost Productivity,” April 2005. Study conducted by David Chenoweth, Ph.D., FAWHP, for the California Department of Health Services. Note: Adjusting for self-insured and entities with high deductible programs would reduce this estimate by an indeterminate sum.

Impact of Obesity on WC Systems Varies With Heath Fitness of Population
Source: Behavioral Risk Factor Surveillance System; Insurance Information Institute
<10%
15%-19%
≥20%
WC systems in the Southeast and Midwest incur a disproportionate burden because
relatively high proportion of workforce is obese
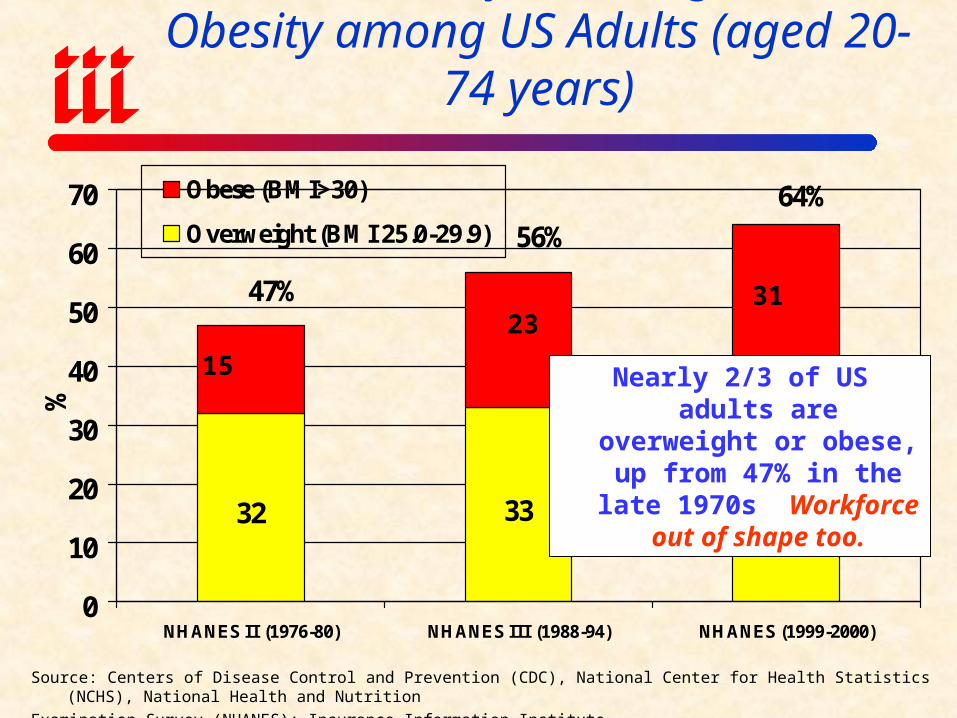
Prevalence of Overweight and Obesity among US Adults (aged 20-74 years)
32 33 33
56%
64%
47%
0
10
20
30
40
50
60
70
NHANES II (1976-80) NHANES III (1988-94) NHANES (1999-2000)
%
Obese (BMI>30)
Overweight (BMI 25.0-29.9)
Source: Centers of Disease Control and Prevention (CDC), National Center for Health Statistics (NCHS), National Health and Nutrition
Examination Survey (NHANES); Insurance Information Institute
Nearly 2/3 of US adults are overweight or obese, up
from 47% in the late 1970s Workforce out of shape too.
15
2331
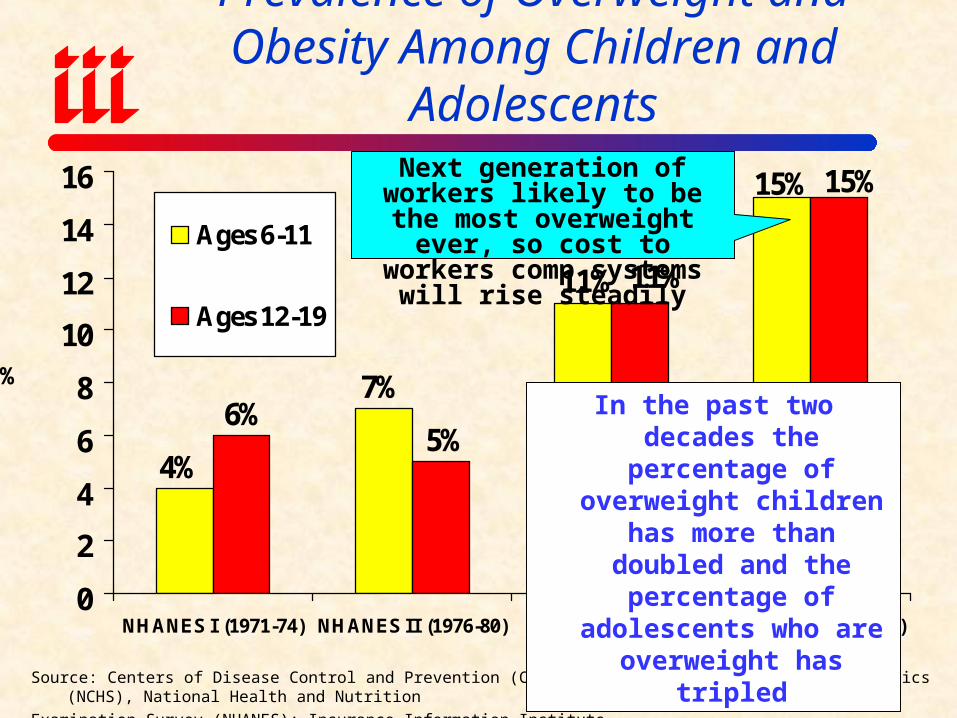
Prevalence of Overweight and Obesity Among Children and Adolescents
15%
7%
4%
11%
15%
11%
5%6%
0
2
4
6
8
10
12
14
16
NHANES I (1971-74) NHANES II (1976-80) NHANES III (1988-94)
NHANES (1999-2000)
Ages 6-11
Ages 12-19
%
Source: Centers of Disease Control and Prevention (CDC), National Center for Health Statistics (NCHS), National Health and Nutrition
Examination Survey (NHANES); Insurance Information Institute
In the past two decades the percentage of overweight children has more than
doubled and the percentage of adolescents who are overweight has tripled
Next generation of workers likely to be the most overweight ever, so cost to workers comp
systems will rise steadily

Issues in Reintegration of Military Veterans
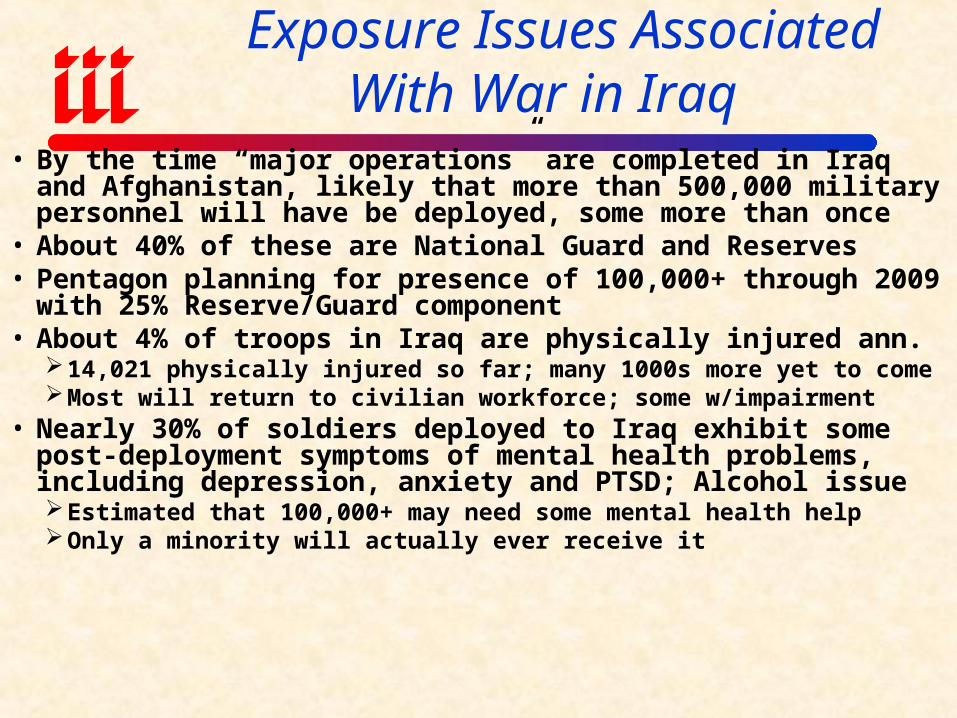
Exposure Issues AssociatedWith War in Iraq
• By the time “major operations” are completed in Iraq and Afghanistan, likely that more than 500,000 military personnel will have be deployed, some more than once
• About 40% of these are National Guard and Reserves• Pentagon planning for presence of 100,000+ through 2009
with 25% Reserve/Guard component• About 4% of troops in Iraq are physically injured ann.
14,021 physically injured so far; many 1000s more yet to comeMost will return to civilian workforce; some w/impairment
• Nearly 30% of soldiers deployed to Iraq exhibit some post-deployment symptoms of mental health problems, including depression, anxiety and PTSD; Alcohol issueEstimated that 100,000+ may need some mental health helpOnly a minority will actually ever receive it
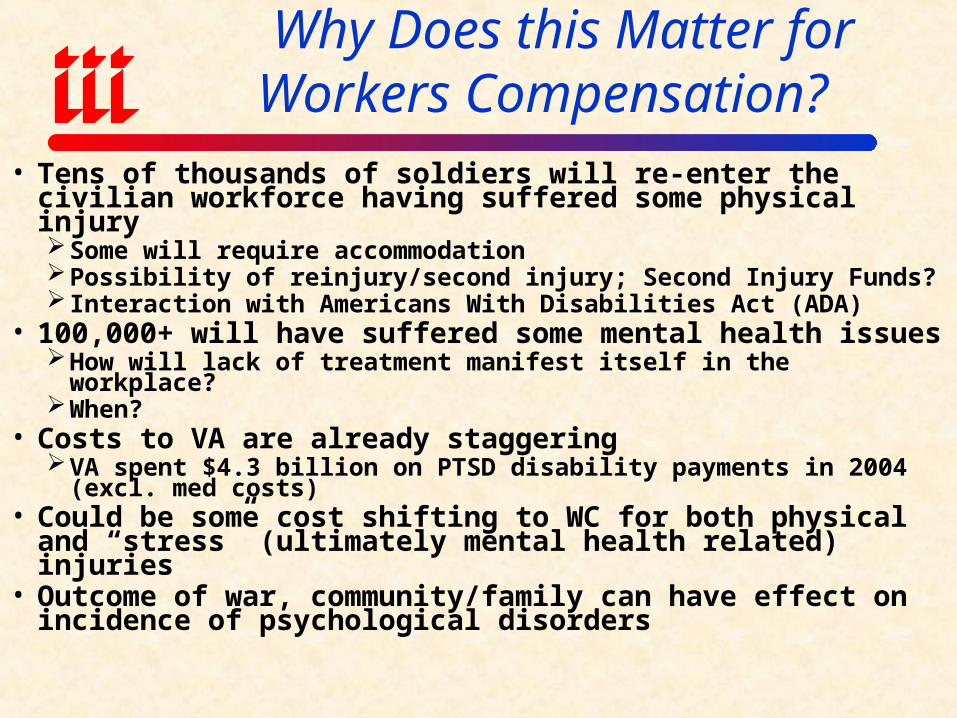
Why Does this Matter forWorkers Compensation?
• Tens of thousands of soldiers will re-enter the civilian workforce having suffered some physical injurySome will require accommodationPossibility of reinjury/second injury; Second Injury Funds? Interaction with Americans With Disabilities Act (ADA)
• 100,000+ will have suffered some mental health issuesHow will lack of treatment manifest itself in the workplace?When?
• Costs to VA are already staggeringVA spent $4.3 billion on PTSD disability payments in 2004 (excl.
med costs)• Could be some cost shifting to WC for both physical and
“stress” (ultimately mental health related) injuries• Outcome of war, community/family can have effect on
incidence of psychological disorders

Why Does this Matter forWorkers Compensation?
• Post Traumatic Stress Disorder, or PTSD, is a psychiatric disorder that can occur following the experience or witnessing of life-threatening events such as military combat, natural disasters, terrorist incidents, serious accidents, or violent personal assaults like rape.*
• While Most Vets Function Normally, PTSD & Related
Issues that Can Affect Workers Comp Injury Frequency and/or SeverityDepression Sleep DeprivationSubstance Abuse Marital/Family ProblemsOccupational Instability Social MaladjustmentAnxiety
*Source: National Center for PTSD; http://www.ncptsd.va.gov/facts/general/fs_what_is_ptsd.html accessed August 20, 2005.
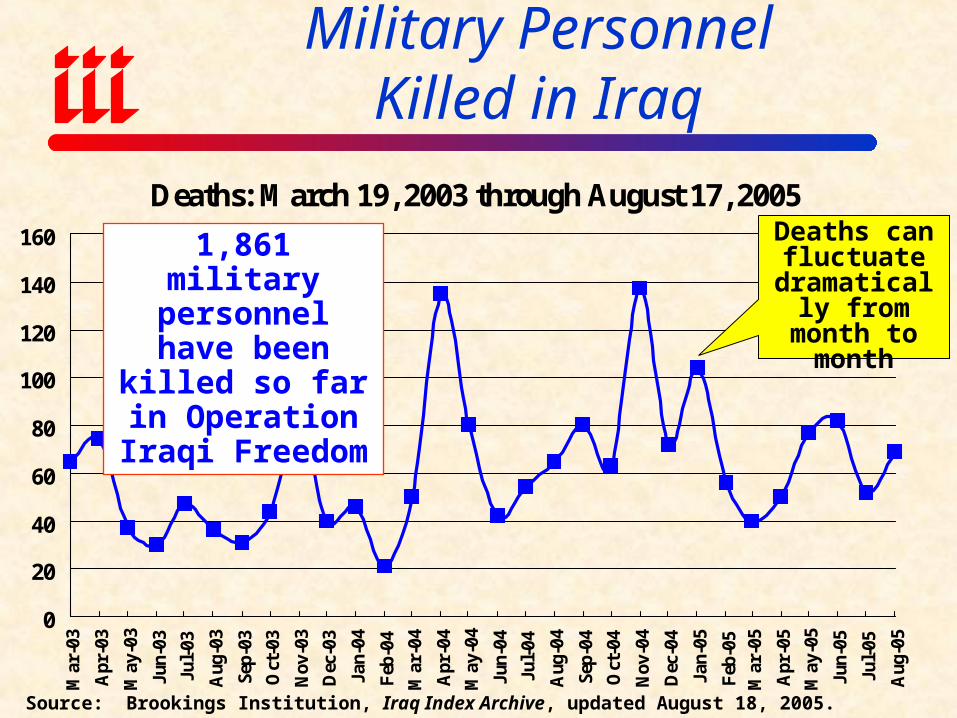
Deaths: March 19, 2003 through August 17, 2005
0
20
40
60
80
100
120
140
160
Mar
-03
Apr
-03
May
-03
Jun-
03
Jul-
03
Aug
-03
Sep-
03
Oct
-03
Nov
-03
Dec
-03
Jan-
04
Feb
-04
Mar
-04
Apr
-04
May
-04
Jun-
04
Jul-
04
Aug
-04
Sep-
04
Oct
-04
Nov
-04
Dec
-04
Jan-
05
Feb
-05
Mar
-05
Apr
-05
May
-05
Jun-
05
Jul-
05
Aug
-05
Military PersonnelKilled in Iraq
Source: Brookings Institution, Iraq Index Archive, updated August 18, 2005.
Deaths can fluctuate
dramatically from month to
month
1,861 military personnel have
been killed so far in Operation Iraqi
Freedom
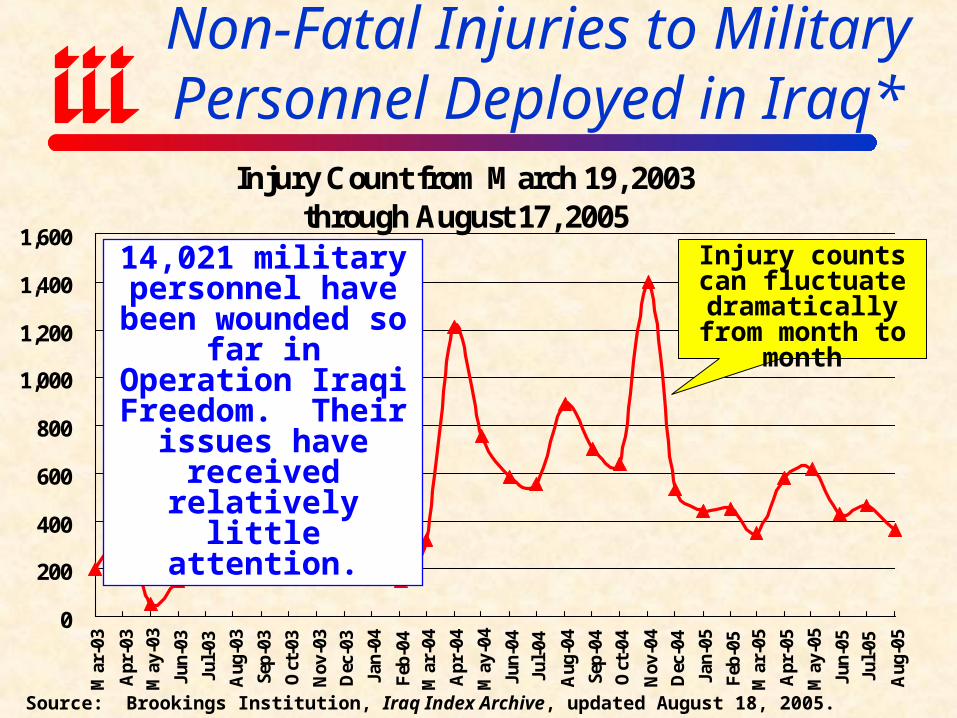
Injury Count from March 19, 2003through August 17, 2005
0
200
400
600
800
1,000
1,200
1,400
1,600
Mar
-03
Apr
-03
May
-03
Jun-
03
Jul-
03
Aug
-03
Sep-
03
Oct
-03
Nov
-03
Dec
-03
Jan-
04
Feb
-04
Mar
-04
Apr
-04
May
-04
Jun-
04
Jul-
04
Aug
-04
Sep-
04
Oct
-04
Nov
-04
Dec
-04
Jan-
05
Feb
-05
Mar
-05
Apr
-05
May
-05
Jun-
05
Jul-
05
Aug
-05
Non-Fatal Injuries to Military Personnel Deployed in Iraq*
Source: Brookings Institution, Iraq Index Archive, updated August 18, 2005.
Injury counts can fluctuate
dramatically from month to month
14,021 military personnel have been
wounded so far in Operation Iraqi Freedom. Their
issues have received relatively little
attention.
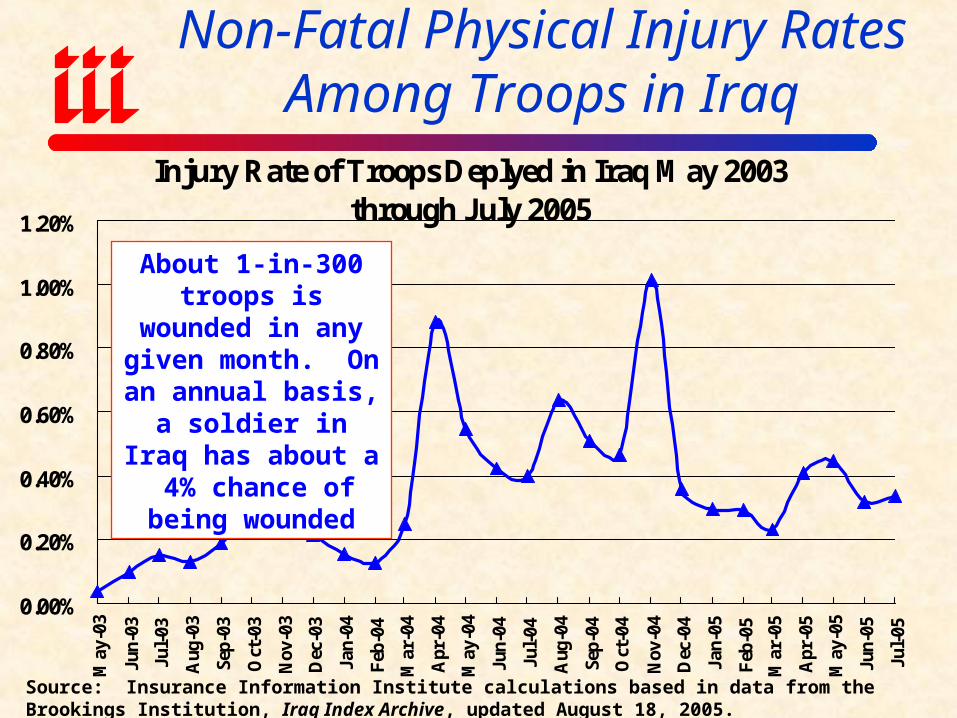
Injury Rate of Troops Deplyed in Iraq May 2003 through July 2005
0.00%
0.20%
0.40%
0.60%
0.80%
1.00%
1.20%
May
-03
Jun-
03
Jul-
03
Aug
-03
Sep-
03
Oct
-03
Nov
-03
Dec
-03
Jan-
04
Feb
-04
Mar
-04
Apr
-04
May
-04
Jun-
04
Jul-
04
Aug
-04
Sep-
04
Oct
-04
Nov
-04
Dec
-04
Jan-
05
Feb
-05
Mar
-05
Apr
-05
May
-05
Jun-
05
Jul-
05
Non-Fatal Physical Injury RatesAmong Troops in Iraq
Source: Insurance Information Institute calculations based in data from the Brookings Institution, Iraq Index Archive, updated August 18, 2005.
About 1-in-300 troops is wounded in any
given month. On an annual basis, a soldier
in Iraq has about a 4% chance of being
wounded

Troops Deployed from May 2003 through July 2005
100
110
120
130
140
150
160
May
-03
Jun-
03
Jul-
03
Aug
-03
Sep-
03
Oct
-03
Nov
-03
Dec
-03
Jan-
04
Feb
-04
Mar
-04
Apr
-04
May
-04
Jun-
04
Jul-
04
Aug
-04
Sep-
04
Oct
-04
Nov
-04
Dec
-04
Jan-
05
Feb
-05
Mar
-05
Apr
-05
May
-05
Jun-
05
Jul-
05
Dec
. 05*
Troop Strength Levels in Iraq Guarantee Significant Flow of Injured
Source: Brookings Institution, Iraq Index Archive, updated August 18, 2005. *Estimate based on Pentagon comments.
Troop strength levels are expected to rise to their highest
levels yet by year-end 2005 ahead of scheduled elections
To date, 40% of troops have been National Guard or
Reservists, meaning 100,000+ people eventually looking to be returned to the workforce soon

Reported Mental Health Problems Among Army & Marine Personnel
After Iraq Deployment*
15.2% 14.7%17.5%
15.7%18.0%
19.9%
27.9% 29.2%
0%
5%
10%
15%
20%
25%
30%
35%
Army Study Group Marine Study Group
DepressionAnxietyPTSDAny of These
Nearly 30% of returning army and marine personnel exhibit at least one
symptom of mental illness.
Source: Hoge, et al, “Combat Duty in Iraq and Afghanistan, Mental Health Problems, and Barriers to Care,” New England Journal of Medicine, v. 351, no.1, July 1, 2004, pp. 13-22.

War Takes a Toll on Mental Health of Military
Source: Han Kang and Kenneth Hyams, Department of Veterans Affairs.
3.0%
6.0%
10.0%
13.0%
19.0%
26.0%
Feb. 13 Jun. 28 9-Dec
Post Traumatic Stress Disorder Any Mental Heath Problem
Incidence of PTSD more than tripled and other
mental health problems doubled in 2004
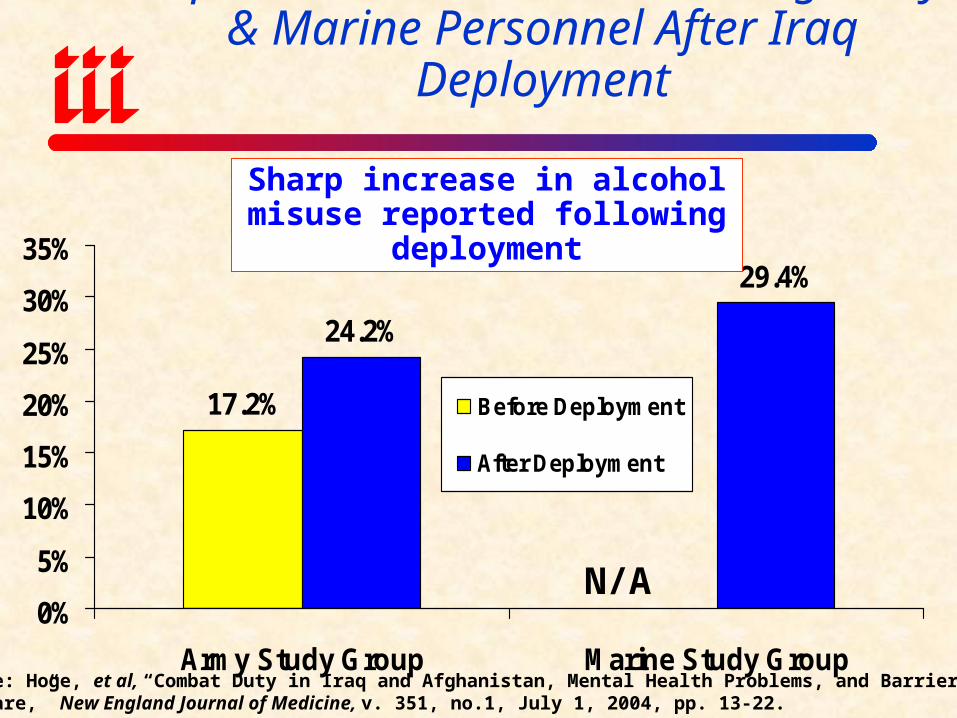
Reported Alcohol Misuse Among Army & Marine Personnel After Iraq Deployment
17.2%
24.2%
29.4%
0%
5%
10%
15%
20%
25%
30%
35%
Army Study Group Marine Study Group
Before Deployment
After Deployment
Sharp increase in alcohol misuse reported following deployment
Source: Hoge, et al, “Combat Duty in Iraq and Afghanistan, Mental Health Problems, and Barriers to Care,” New England Journal of Medicine, v. 351, no.1, July 1, 2004, pp. 13-22.
N/A
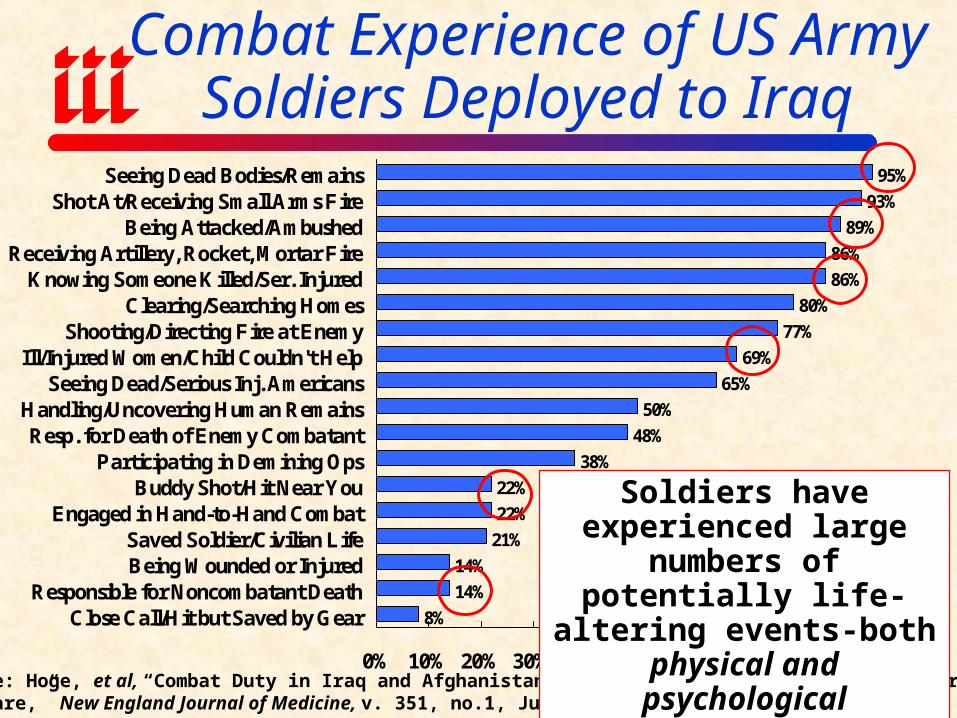
Combat Experience of US ArmySoldiers Deployed to Iraq
93%
89%
86%
86%
80%
77%
69%
65%
50%
48%
38%
22%
22%
21%
14%
14%
8%
95%
0% 10% 20% 30% 40% 50% 60% 70% 80% 90% 100%
Seeing Dead Bodies/RemainsShot At/Receiving Small Arms Fire
Being Attacked/AmbushedReceiving Artillery, Rocket, Mortar Fire
Knowing Someone Killed/Ser. InjuredClearing/Searching Homes
Shooting/Directing Fire at EnemyIll/Injured Women/Child Couldn't Help
Seeing Dead/Serious Inj. AmericansHandling/Uncovering Human RemainsResp. for Death of Enemy Combatant
Participating in Demining OpsBuddy Shot/Hit Near You
Engaged in Hand-to-Hand CombatSaved Soldier/Civilian LifeBeing Wounded or Injured
Responsible for Noncombatant DeathClose Call/Hit but Saved by Gear
Source: Hoge, et al, “Combat Duty in Iraq and Afghanistan, Mental Health Problems, and Barriers to Care,” New England Journal of Medicine, v. 351, no.1, July 1, 2004, pp. 13-22.
Soldiers have experienced large numbers of potentially
life-altering events-both physical and psychological
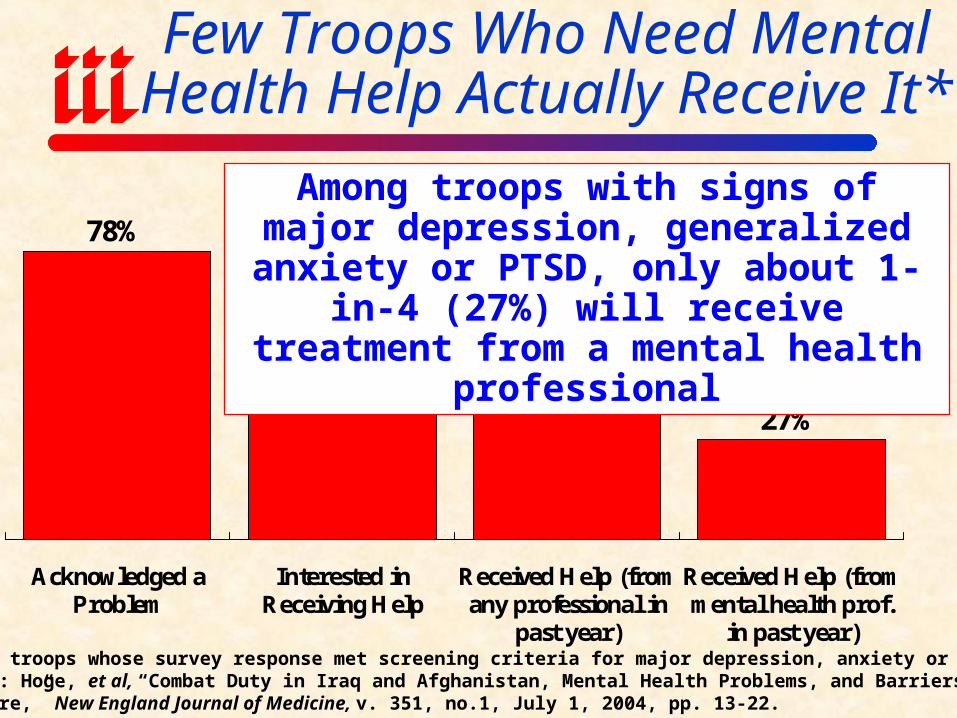
Few Troops Who Need Mental Health Help Actually Receive It*
78%
43% 40%
27%
Acknowledged aProblem
Interested inReceiving Help
Received Help (fromany professional in
past year)
Received Help (frommental health prof.
in past year)
Among troops with signs of major depression, generalized anxiety or PTSD,
only about 1-in-4 (27%) will receive treatment from a mental health professional
*Among troops whose survey response met screening criteria for major depression, anxiety or PTSD.Source: Hoge, et al, “Combat Duty in Iraq and Afghanistan, Mental Health Problems, and Barriers to Care,” New England Journal of Medicine, v. 351, no.1, July 1, 2004, pp. 13-22.
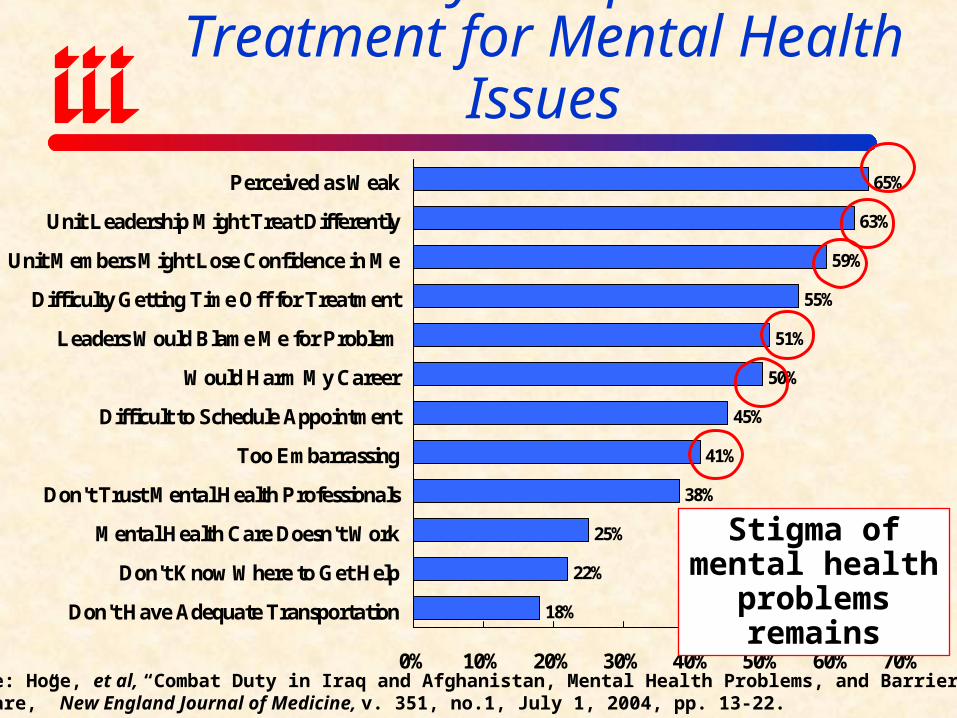
Reasons Why Troops Don’t Seek Treatment for Mental Health Issues
63%
59%
55%
51%
50%
45%
41%
38%
25%
22%
18%
65%
0% 10% 20% 30% 40% 50% 60% 70%
Perceived as Weak
Unit Leadership Might Treat Differently
Unit Members Might Lose Confidence in Me
Difficulty Getting Time Off for Treatment
Leaders Would Blame Me for Problem
Would Harm My Career
Difficult to Schedule Appointment
Too Embarrassing
Don't Trust Mental Health Professionals
Mental Health Care Doesn't Work
Don't Know Where to Get Help
Don't Have Adequate Transportation
Source: Hoge, et al, “Combat Duty in Iraq and Afghanistan, Mental Health Problems, and Barriers to Care,” New England Journal of Medicine, v. 351, no.1, July 1, 2004, pp. 13-22.
Stigma of mental health problems
remains
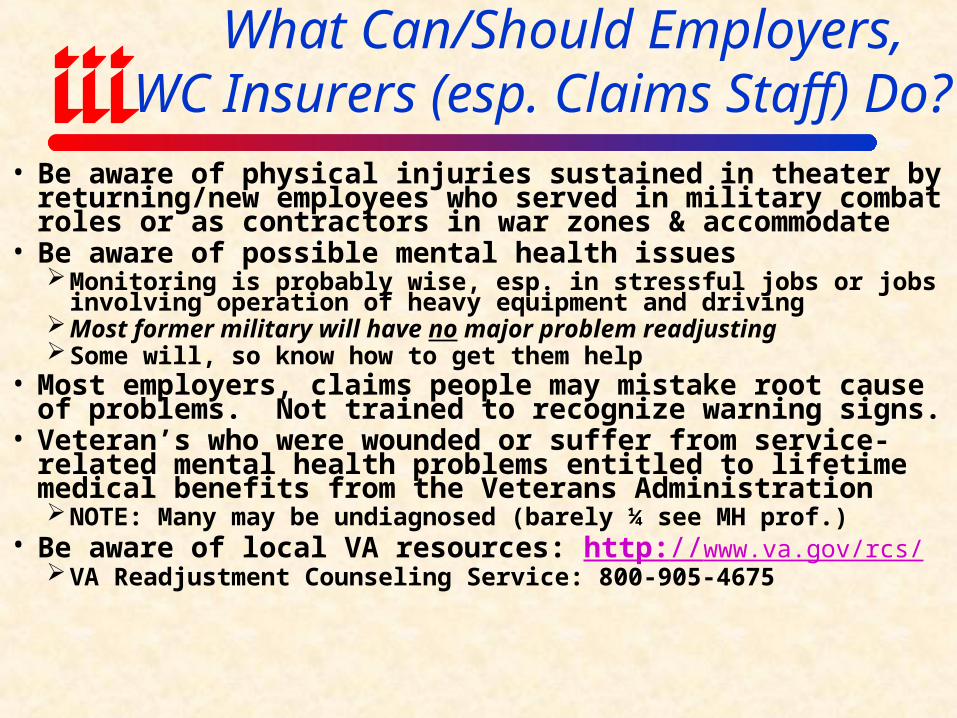
What Can/Should Employers,WC Insurers (esp. Claims Staff) Do?
• Be aware of physical injuries sustained in theater by returning/new employees who served in military combat roles or as contractors in war zones & accommodate
• Be aware of possible mental health issuesMonitoring is probably wise, esp. in stressful jobs or jobs involving
operation of heavy equipment and driving Most former military will have no major problem readjustingSome will, so know how to get them help
• Most employers, claims people may mistake root cause of problems. Not trained to recognize warning signs.
• Veteran’s who were wounded or suffer from service-related mental health problems entitled to lifetime medical benefits from the Veterans AdministrationNOTE: Many may be undiagnosed (barely ¼ see MH prof.)
• Be aware of local VA resources: http://www.va.gov/rcs/ VA Readjustment Counseling Service: 800-905-4675

The Defense Base Act:What is It & Its Relationship to WC?
• Congress passed DBA in 1941 to cover construction workers in lend/lease military bases outside continental US & broadened several times since
• DBA extends USL&H Act to civilian workers on bases overseas & contractors employees outside USAdministered by US Department of Labor
• Covers all US citizens employed on job site (e.g., Iraq), 3rd party and local nationals, subcontractors
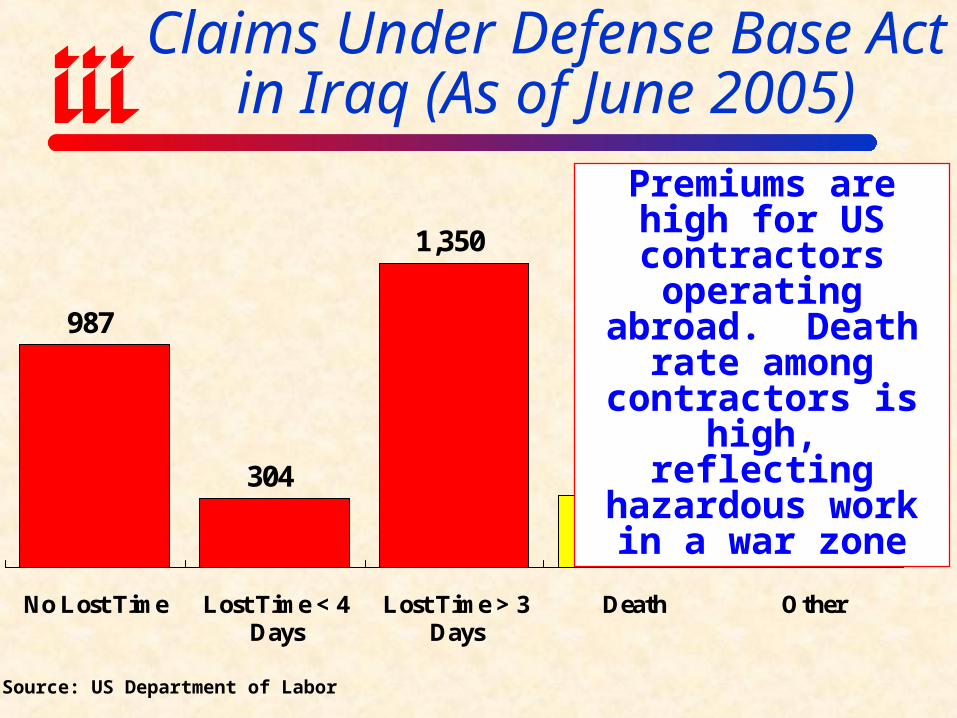
Claims Under Defense Base Actin Iraq (As of June 2005)
987
304
1,350
317220
No Lost Time Lost Time < 4Days
Lost Time > 3Days
Death Other
Premiums are high for US contractors operating abroad. Death rate among
contractors is high, reflecting hazardous work in a war zone
Source: US Department of Labor

Degenerative Neurological Diseases &
Occupational Risk
The Next Frontier for Workers Comp?
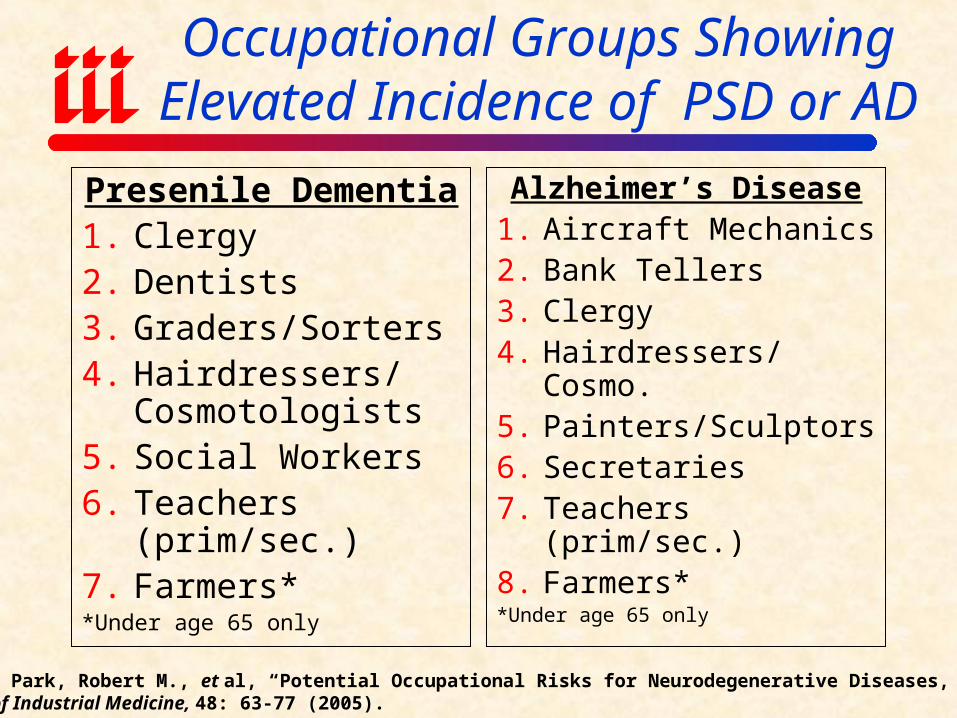
Occupational Groups Showing Elevated Incidence of PSD or AD
Presenile Dementia1. Clergy2. Dentists3. Graders/Sorters4. Hairdressers/
Cosmotologists5. Social Workers6. Teachers (prim/sec.)7. Farmers**Under age 65 only
Alzheimer’s Disease1. Aircraft Mechanics2. Bank Tellers3. Clergy4. Hairdressers/Cosmo.5. Painters/Sculptors6. Secretaries7. Teachers (prim/sec.)8. Farmers**Under age 65 only
Source: Park, Robert M., et al, “Potential Occupational Risks for Neurodegenerative Diseases,” AmericanJournal of Industrial Medicine, 48: 63-77 (2005).

Occupational Groups Showing Elevated Incidence of PD or MND
Parkinson’s Disease
1. Biological Scientists
2. Post-Secondary Teachers
3. Clergy
4. Other Religious Workers
5. Welding**For deaths under age 65 only
Motor Neuron Disease
1. Graders & Sorters (non-agricultural)
2. Hairdressers
3. Teachers (prim/sec.)
4. Veterinarians
5. Farmers
Source: Park, Robert M., et al, “Potential Occupational Risks for Neurodegenerative Diseases,” AmericanJournal of Industrial Medicine, 48: 63-77 (2005).

Casual Theories About Occupations With Elevated Odds of
Neurodegenerative Diseases
Profession Associative Theory
Hairdressers Increased risk of PSD, AD and MND, suggesting risk associated with dyes, components of hair care products & other exposures in hairdressing, manicure
Farmers Increased risk for all 4 NDDs, esp. before age 65. Suggests risk associated with pesticides.
Teachers, Clergy & Other Professionals
Elevated risk for all 4 NDDs described as “perplexing.” Possibly educated professionals at lower risk of death for other diseases (less smoking, better health care). Mixed/no evidence of educational attainment link. Risk factors for teachers may include stress and exposure to infectious agents.
Welding PD-like disorder associated with manganese fumes from arc-welding (manifestation of manganism). Studies in US, Europe, Korea suggest link.
TERRORISM & WORKERS
COMPENSATION
Is TRIA Enough?
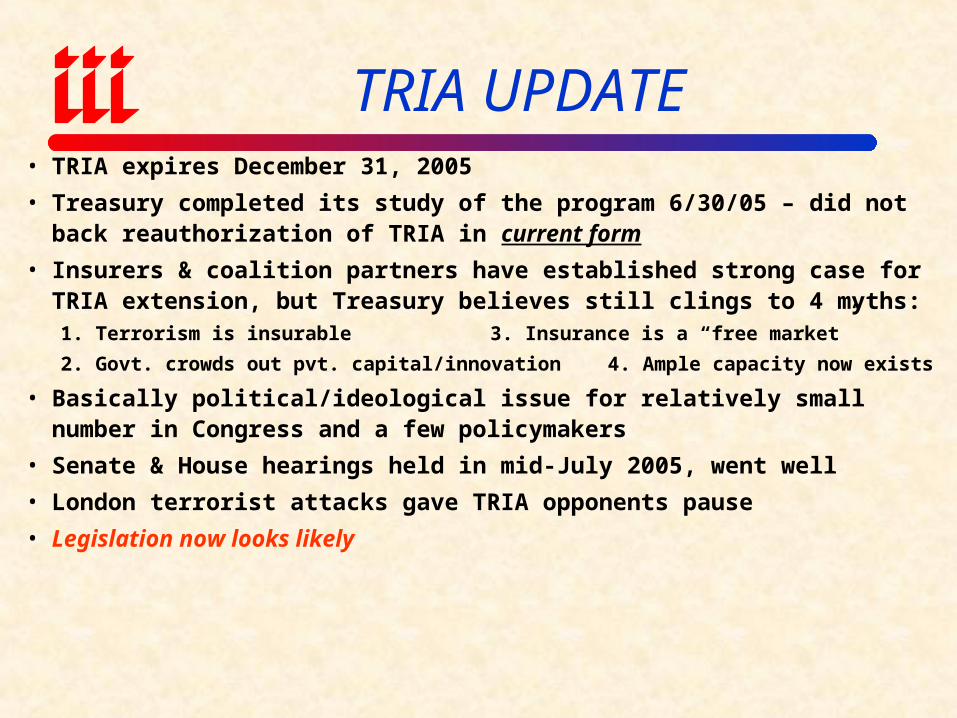
TRIA UPDATE• TRIA expires December 31, 2005
• Treasury completed its study of the program 6/30/05 – did not back reauthorization of TRIA in current form
• Insurers & coalition partners have established strong case for TRIA extension, but Treasury believes still clings to 4 myths:1. Terrorism is insurable 3. Insurance is a “free market”
2. Govt. crowds out pvt. capital/innovation 4. Ample capacity now exists
• Basically political/ideological issue for relatively small number in Congress and a few policymakers
• Senate & House hearings held in mid-July 2005, went well
• London terrorist attacks gave TRIA opponents pause
• Legislation now looks likely
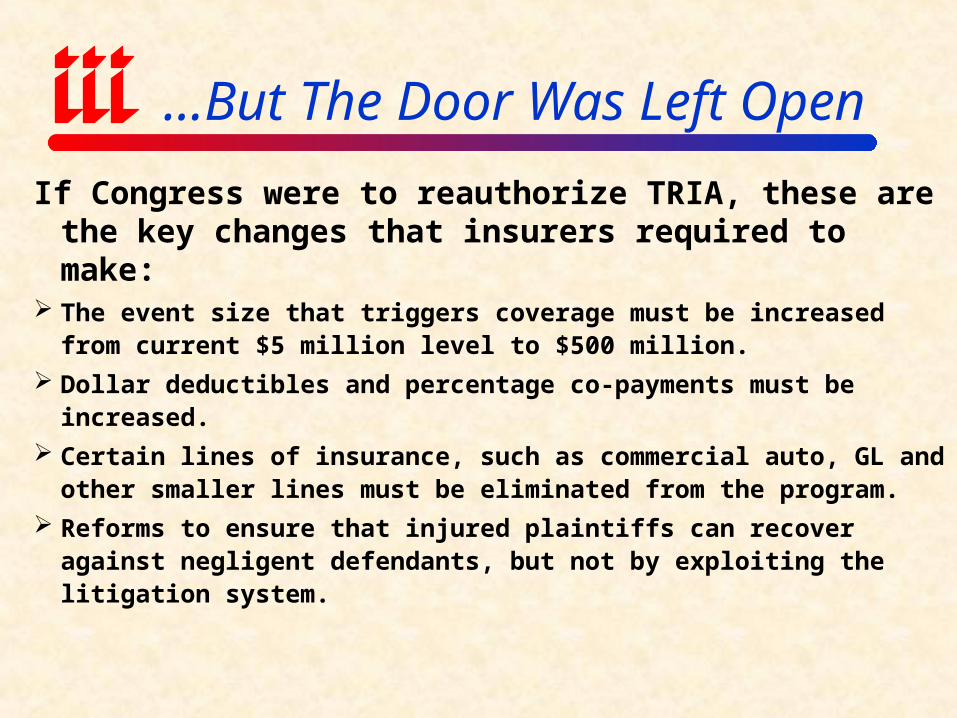
…But The Door Was Left Open
If Congress were to reauthorize TRIA, these are the key changes that insurers required to make:
The event size that triggers coverage must be increased from current $5 million level to $500 million.
Dollar deductibles and percentage co-payments must be increased.
Certain lines of insurance, such as commercial auto, GL and other smaller lines must be eliminated from the program.
Reforms to ensure that injured plaintiffs can recover against negligent defendants, but not by exploiting the litigation system.

Terrorism InsuranceMarket Overview
Workers Comp is the Most TRIA-Dependant Line

Terrorism Coverage: Take-Up Rates by Region
Source: Marsh, Inc.; Insurance Information Institute
30.3%26.2%
21.8%18.6%
53.2% 52.5%46.7%
34.2%
Northeast Midwest South West
2003 2004Terrorism take-up rates
are highest in the Northeast and Midwest
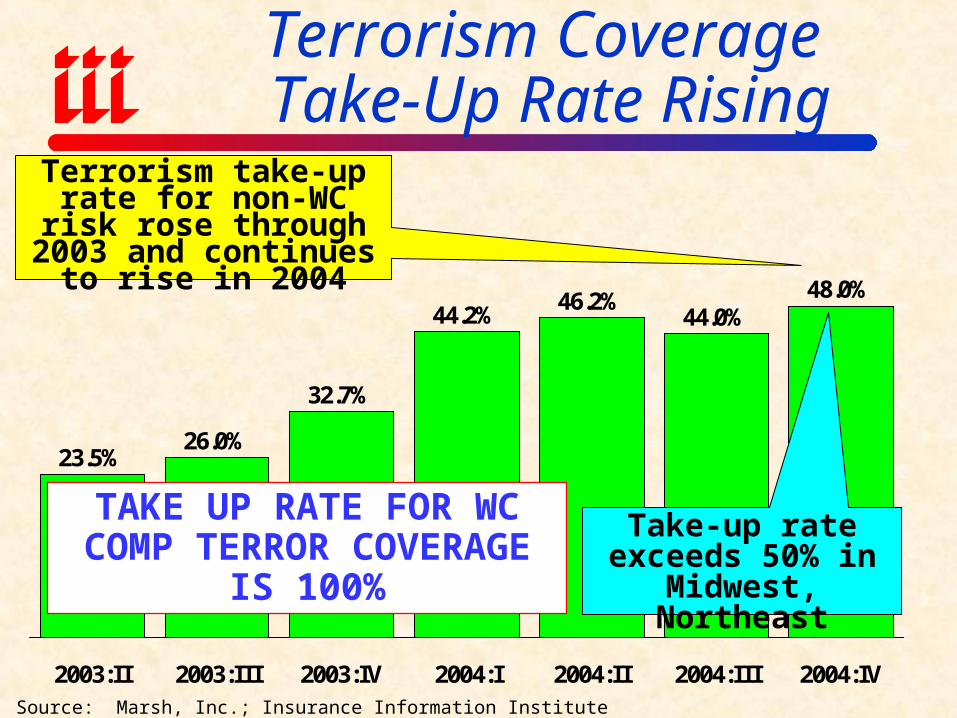
Terrorism Coverage Take-Up Rate Rising
Source: Marsh, Inc.; Insurance Information Institute
23.5%26.0%
32.7%
44.2%46.2%
44.0%48.0%
2003:II 2003:III 2003:IV 2004:I 2004:II 2004:III 2004:IV
Terrorism take-up rate for non-WC risk rose
through 2003 and continues to rise in 2004
TAKE UP RATE FOR WC COMP TERROR
COVERAGE IS 100%
Take-up rate exceeds 50% in Midwest,
Northeast
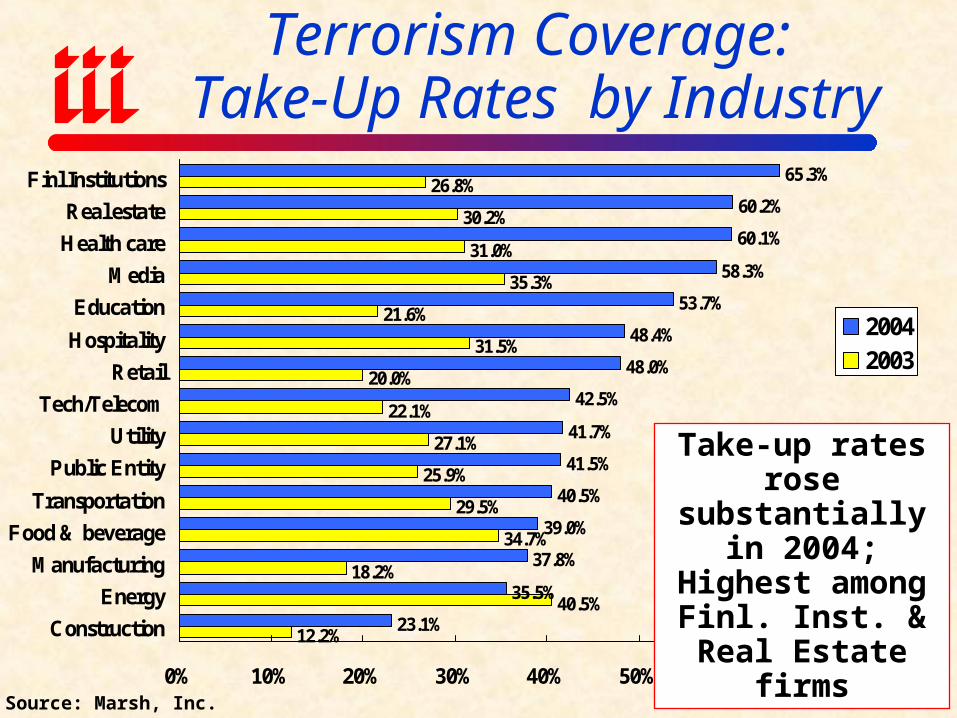
Terrorism Coverage: Take-Up Rates by Industry
60.2%
60.1%
58.3%
53.7%
48.4%
48.0%
42.5%
41.7%
41.5%
40.5%
39.0%
37.8%
35.5%
23.1%
26.8%
30.2%
31.0%
35.3%
21.6%
31.5%
20.0%
22.1%
27.1%
25.9%
29.5%
34.7%
18.2%
40.5%
12.2%
65.3%
0% 10% 20% 30% 40% 50% 60% 70%
Finl Institutions
Real estate
Health care
Media
Education
Hospitality
Retail
Tech/Telecom
Utility
Public Entity
Transportation
Food & beverage
Manufacturing
Energy
Construction
20042003
Source: Marsh, Inc.
Take-up rates rose substantially in 2004; Highest
among Finl. Inst. & Real Estate firms
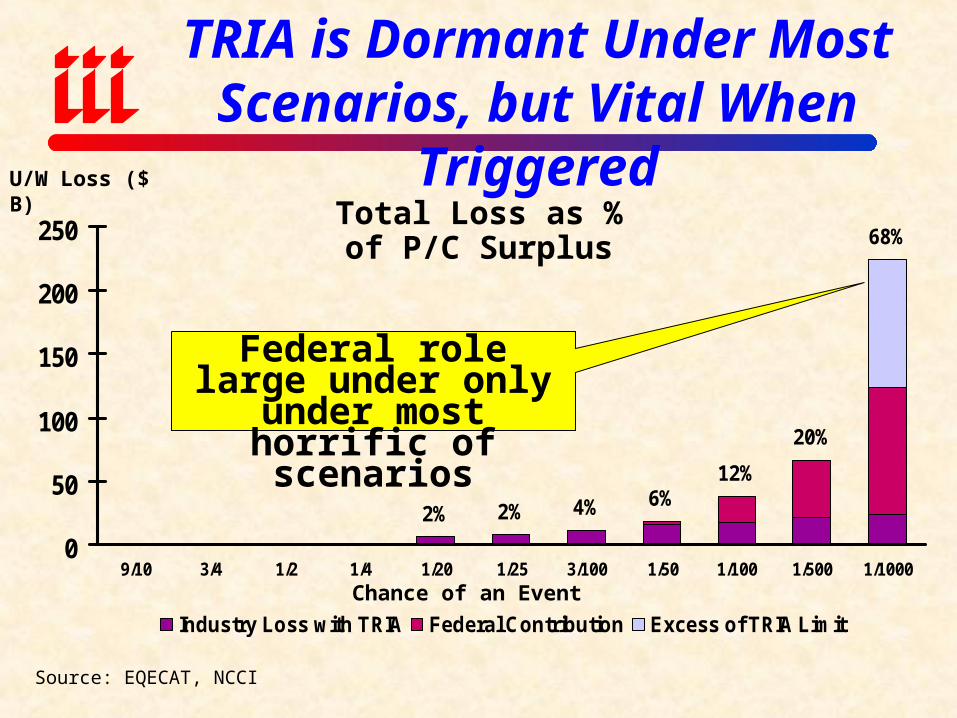
2% 2% 4% 6%12%
20%
68%
0
50
100
150
200
250
9/10 3/4 1/2 1/4 1/20 1/25 3/100 1/50 1/100 1/500 1/1000
Industry Loss with TRIA Federal Contribution Excess of TRIA Limit
TRIA is Dormant Under Most Scenarios, but Vital When Triggered
Chance of an Event
Total Loss as % of P/C Surplus
U/W Loss ($ B)
Source: EQECAT, NCCI
Federal role large under only under most
horrific of scenarios
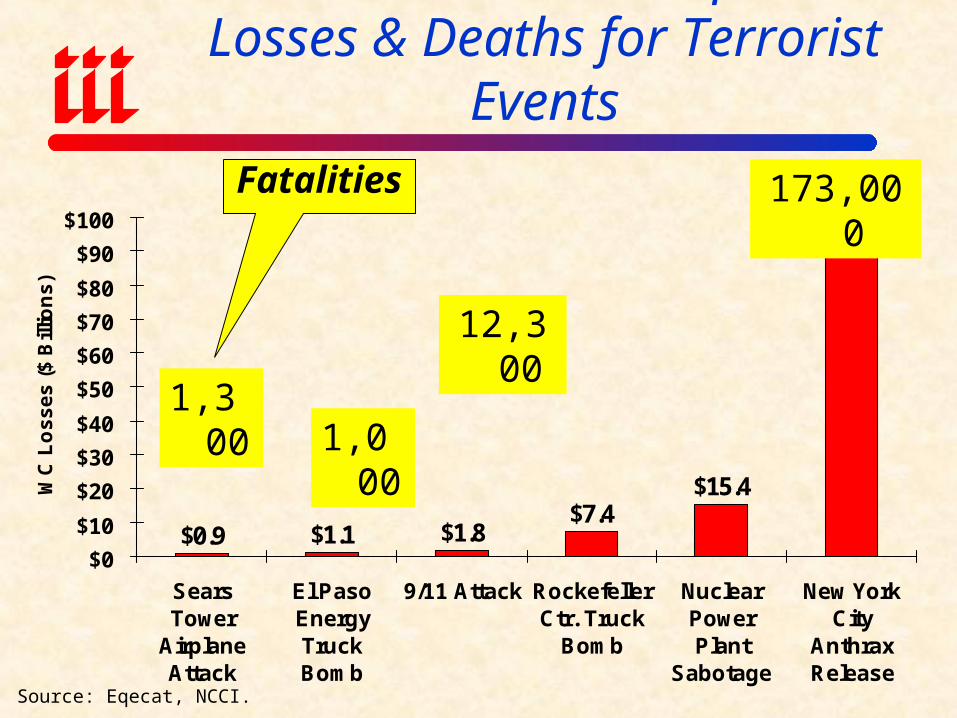
$0.9 $1.1 $1.8$7.4
$15.4
$91.0
$0
$10
$20
$30
$40
$50
$60
$70
$80
$90
$100
SearsTower
AirplaneAttack
El PasoEnergyTruckBomb
9/11 Attack RockefellerCtr. Truck
Bomb
NuclearPowerPlant
Sabotage
New YorkCity
AnthraxRelease
WC
Lo
ss
es
($
Bill
ion
s)
Source: Eqecat, NCCI.
Estimated Workers Comp Insured Losses & Deaths for Terrorist Events
1,000
12,300
173,000
1,300
Fatalities
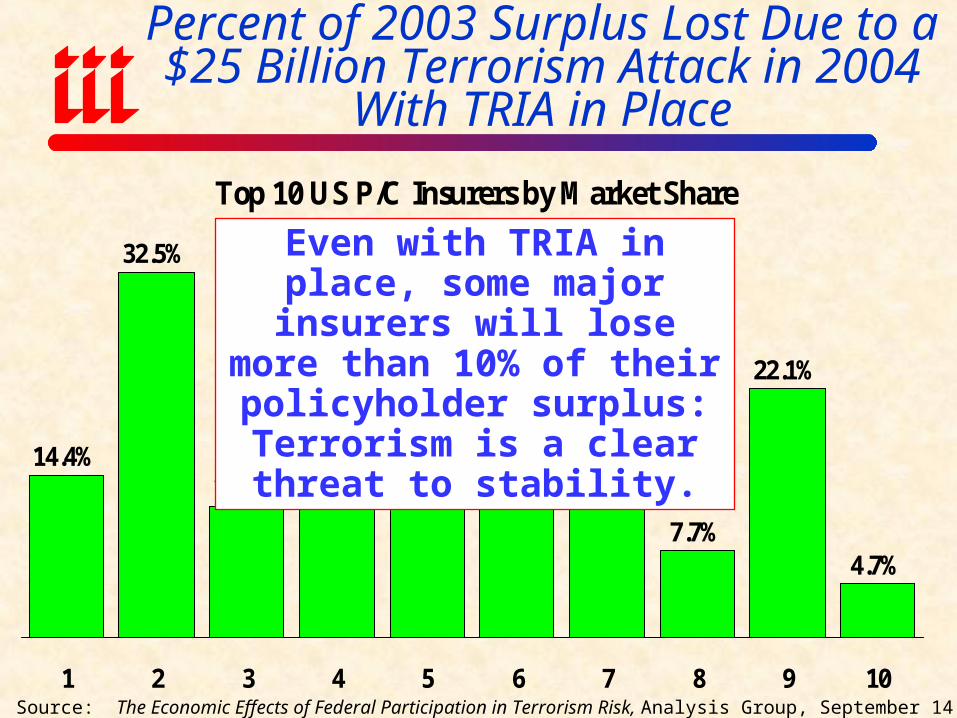
Percent of 2003 Surplus Lost Due to a $25 Billion Terrorism Attack in 2004
With TRIA in Place
Source: The Economic Effects of Federal Participation in Terrorism Risk, Analysis Group, September 14, 2004.
Top 10 US P/C Insurers by Market Share
14.4%
32.5%
11.7% 12.6% 13.3%14.7%
11.7%
7.7%
22.1%
4.7%
1 2 3 4 5 6 7 8 9 10
Even with TRIA in place, some major insurers will lose more
than 10% of their policyholder surplus: Terrorism is a clear
threat to stability.

Insurance Information Institute On-Line
If you would like a copy of this presentation, please give me your business card with e-mail address