EMERGING ECONOMIES: GROWTH, RESILIENCE, IMPACT, INVESTMENT
41
EMERGING ECONOMIES: GROWTH, RESILIENCE, IMPACT, INVESTMENT MICHAEL SPENCE APRIL 18, 2013 PIONEER IN BEIJING
description
EMERGING ECONOMIES: GROWTH, RESILIENCE, IMPACT, INVESTMENT. MICHAEL SPENCE APRIL 18, 2013 PIONEER IN BEIJING. Emerging Economies – Changing Landscape and New Classifications. Old Model Most countries pre-middle income Open economy growth model understood - PowerPoint PPT Presentation
Transcript of EMERGING ECONOMIES: GROWTH, RESILIENCE, IMPACT, INVESTMENT
EMERGING ECONOMIES: GROWTH, RESILIENCE, IMPACT, INVESTMENT
MICHAEL SPENCEAPRIL 18, 2013
PIONEER IN BEIJING
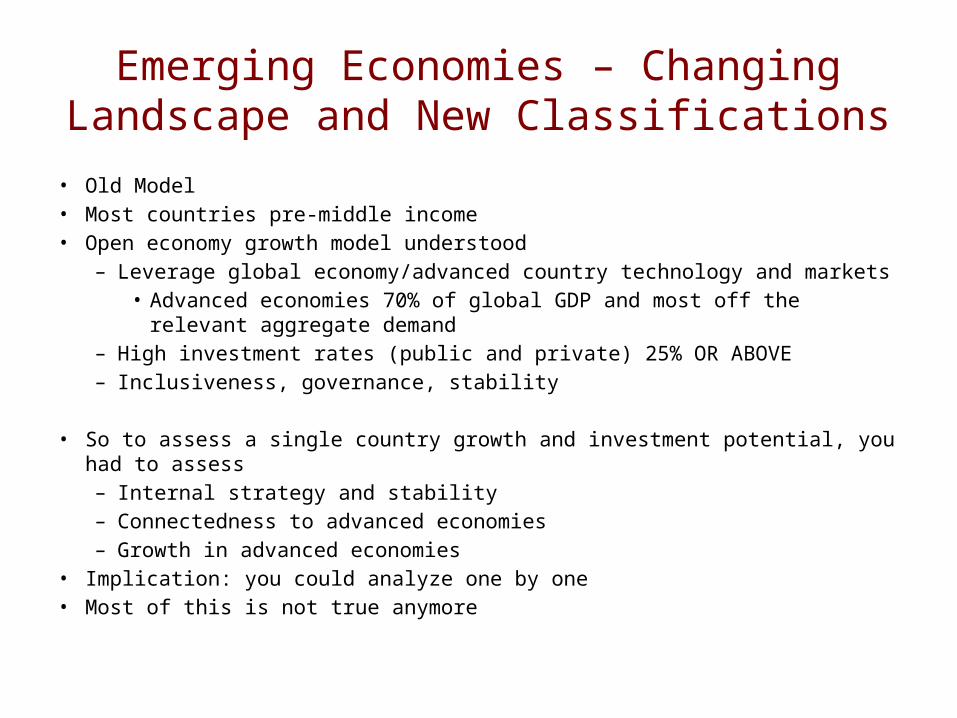
Emerging Economies – Changing Landscape and New Classifications
• Old Model• Most countries pre-middle income • Open economy growth model understood
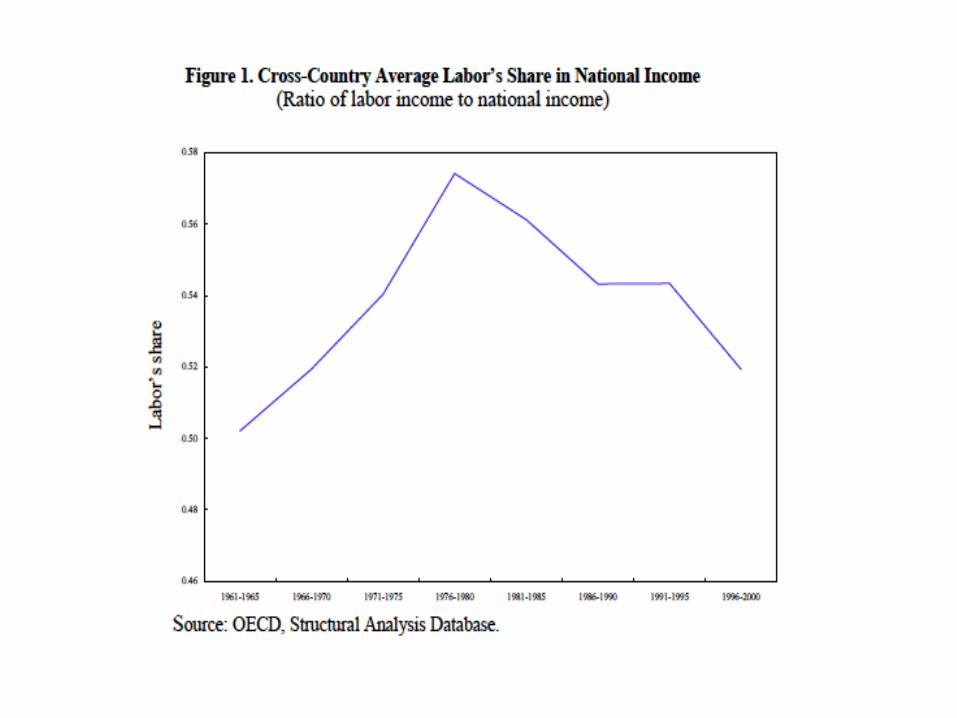
– Leverage global economy/advanced country technology and markets• Advanced economies 70% of global GDP and most off the relevant aggregate
demand– High investment rates (public and private) 25% OR ABOVE– Inclusiveness, governance, stability
• So to assess a single country growth and investment potential, you had to assess– Internal strategy and stability– Connectedness to advanced economies– Growth in advanced economies
• Implication: you could analyze one by one• Most of this is not true anymore
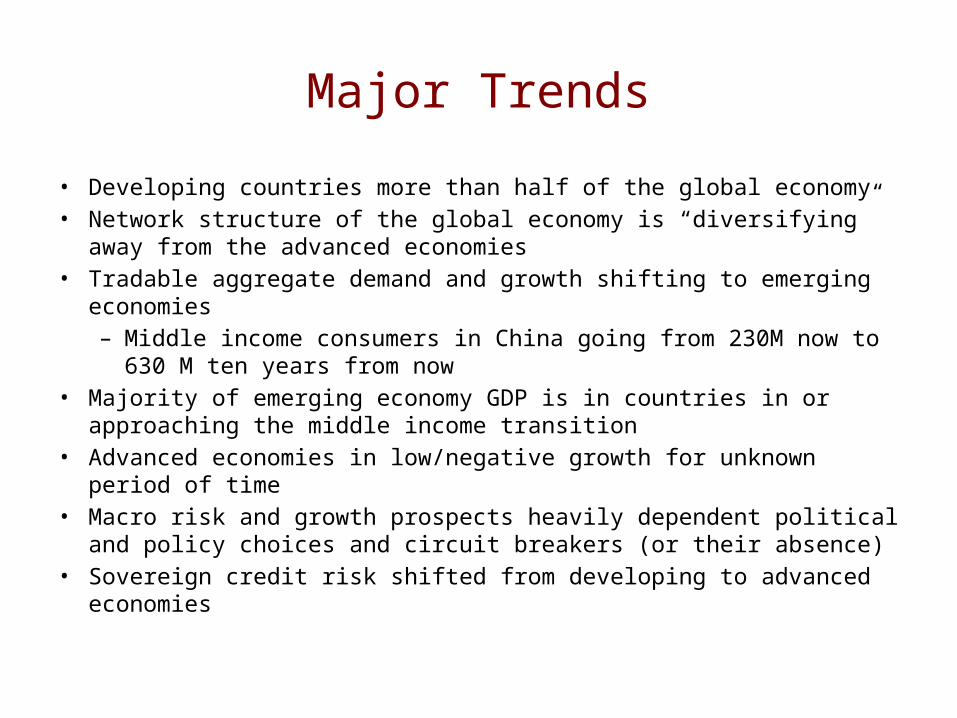
Major Trends
• Developing countries more than half of the global economy• Network structure of the global economy is “diversifying” away from the
advanced economies• Tradable aggregate demand and growth shifting to emerging economies
– Middle income consumers in China going from 230M now to 630 M ten years from now
• Majority of emerging economy GDP is in countries in or approaching the middle income transition
• Advanced economies in low/negative growth for unknown period of time• Macro risk and growth prospects heavily dependent political and policy
choices and circuit breakers (or their absence) • Sovereign credit risk shifted from developing to advanced economies
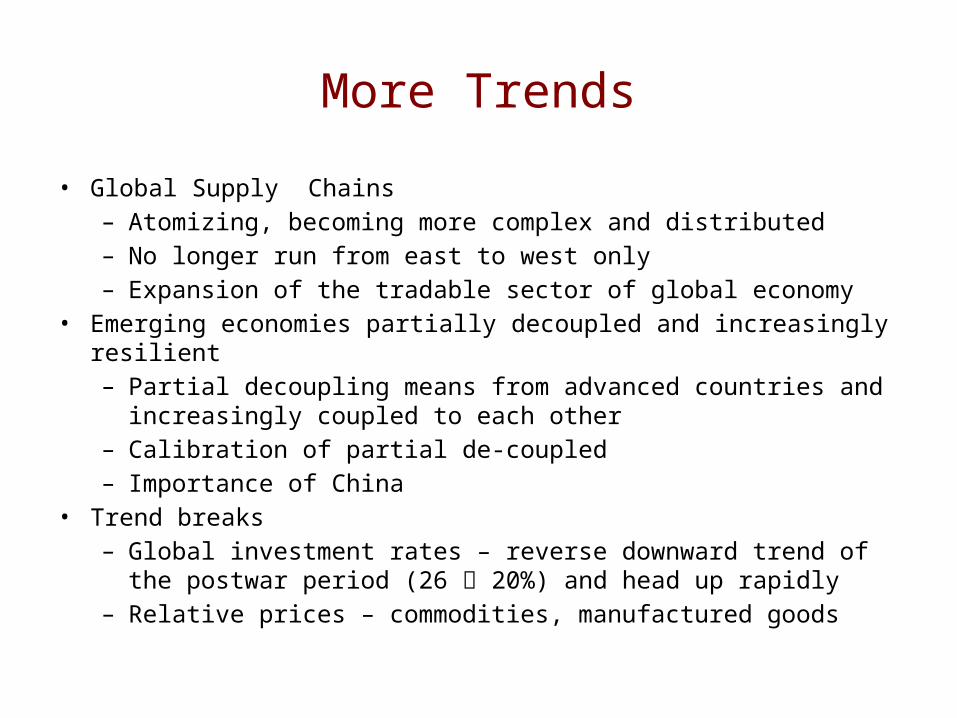
More Trends
• Global Supply Chains– Atomizing, becoming more complex and distributed– No longer run from east to west only– Expansion of the tradable sector of global economy
• Emerging economies partially decoupled and increasingly resilient– Partial decoupling means from advanced countries and increasingly
coupled to each other – Calibration of partial de-coupled– Importance of China
• Trend breaks – Global investment rates – reverse downward trend of the postwar
period (26 20%) and head up rapidly– Relative prices – commodities, manufactured goods
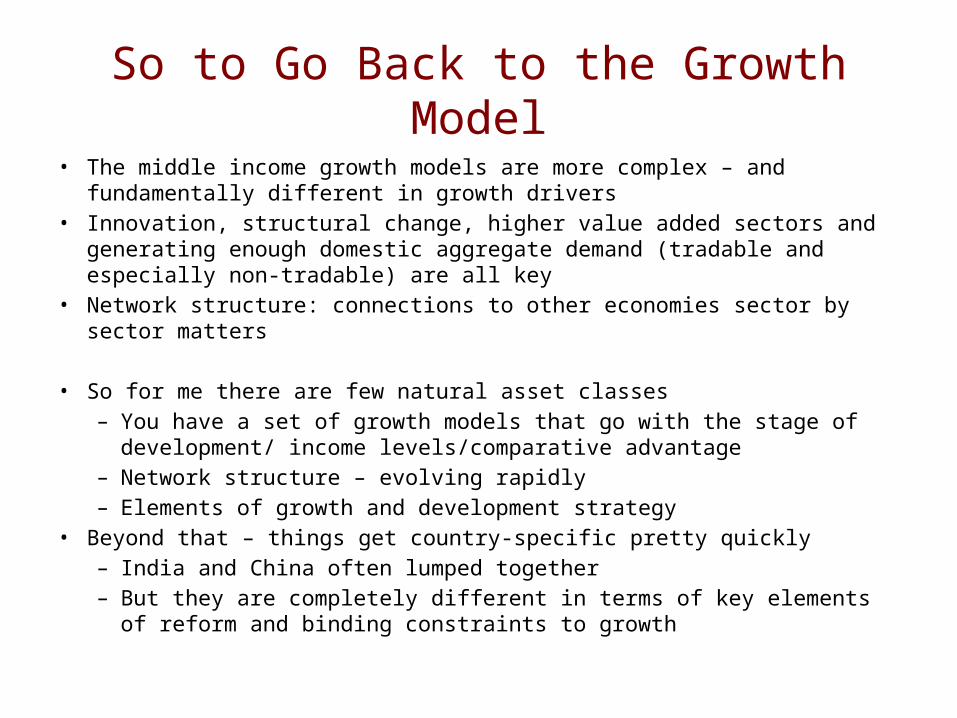
So to Go Back to the Growth Model• The middle income growth models are more complex – and fundamentally
different in growth drivers• Innovation, structural change, higher value added sectors and generating enough
domestic aggregate demand (tradable and especially non-tradable) are all key• Network structure: connections to other economies sector by sector matters
• So for me there are few natural asset classes – You have a set of growth models that go with the stage of development/
income levels/comparative advantage– Network structure – evolving rapidly– Elements of growth and development strategy
• Beyond that – things get country-specific pretty quickly– India and China often lumped together– But they are completely different in terms of key elements of reform and
binding constraints to growth
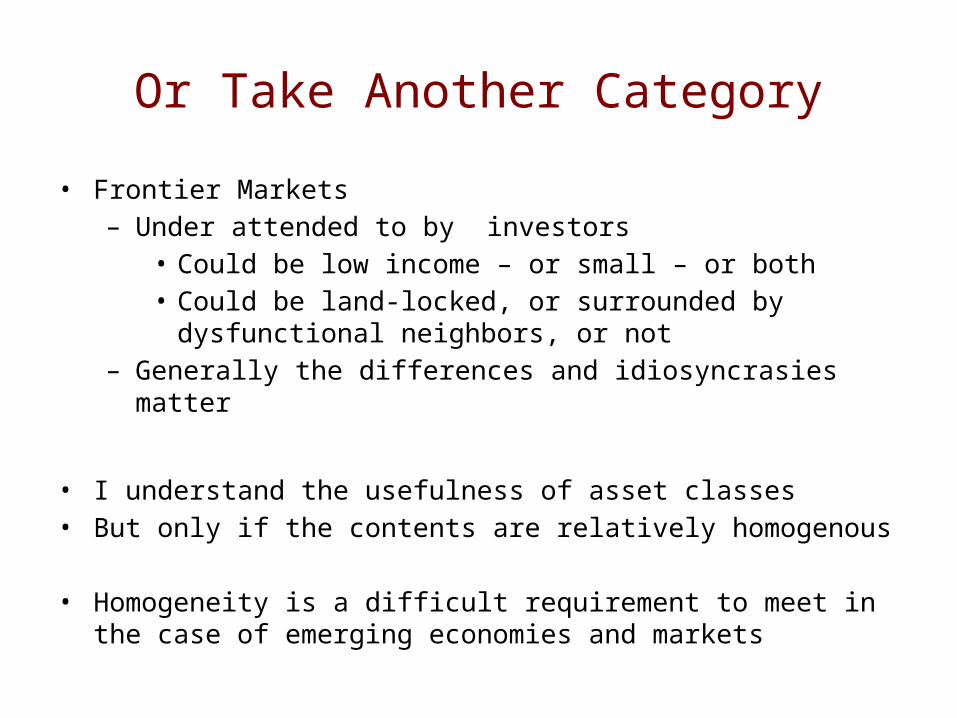
Or Take Another Category
• Frontier Markets– Under attended to by investors
• Could be low income – or small – or both• Could be land-locked, or surrounded by dysfunctional neighbors,
or not– Generally the differences and idiosyncrasies matter
• I understand the usefulness of asset classes• But only if the contents are relatively homogenous
• Homogeneity is a difficult requirement to meet in the case of emerging economies and markets
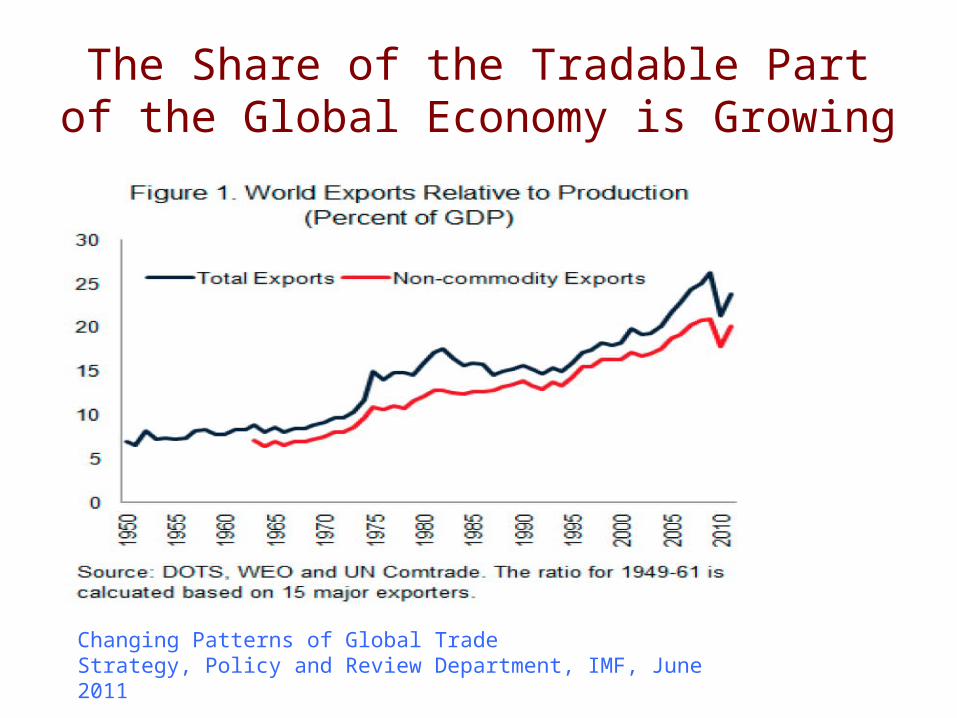
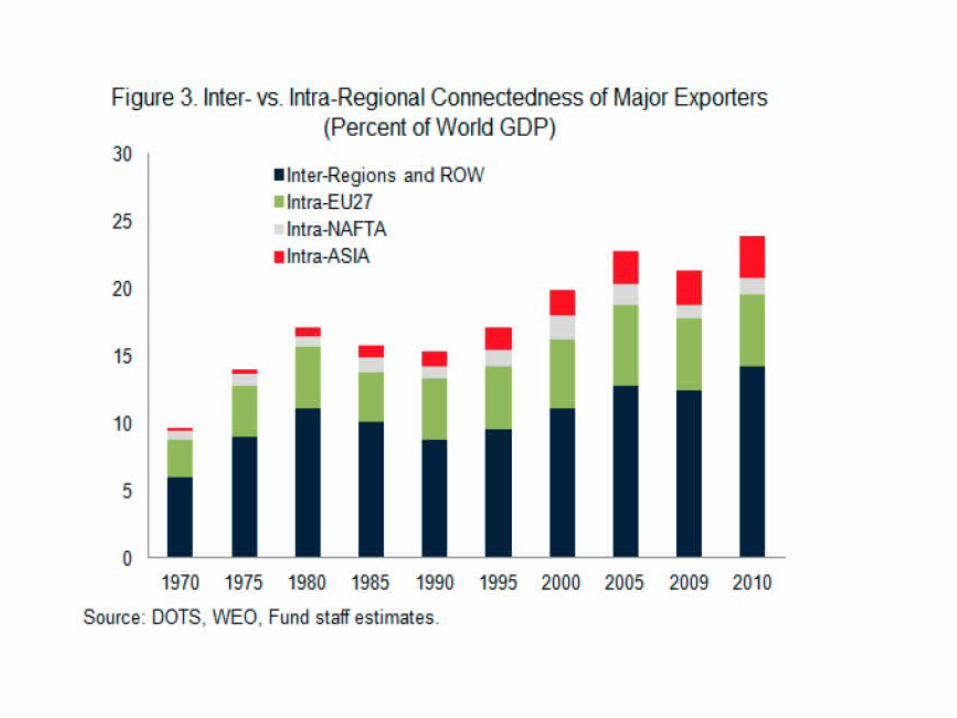
The Share of the Tradable Part of the Global Economy is Growing
Changing Patterns of Global TradeStrategy, Policy and Review Department, IMF, June 2011
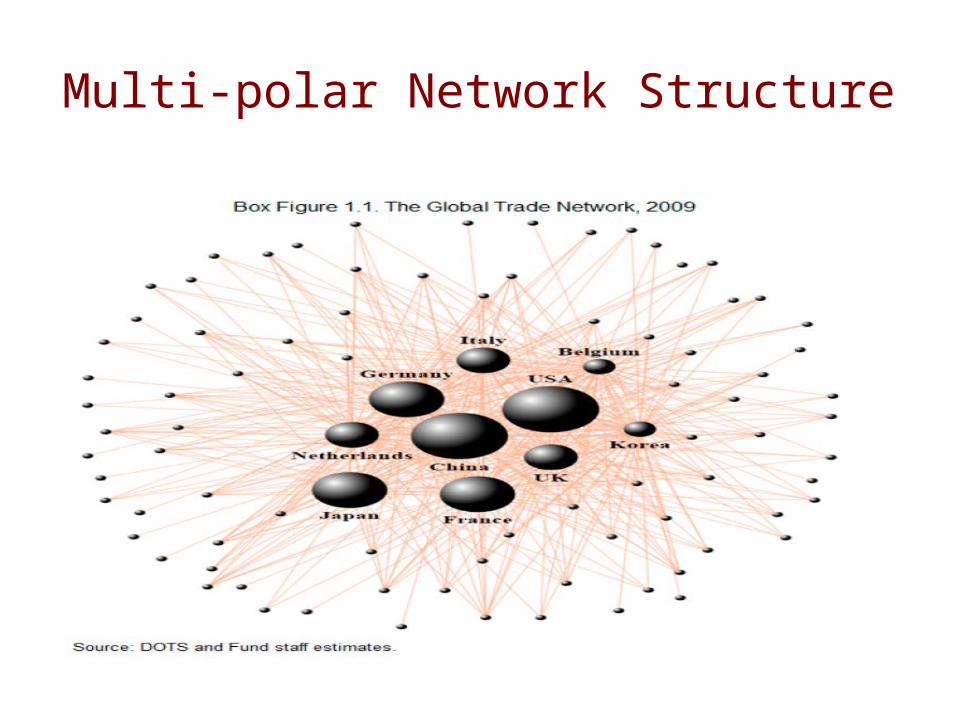
Multi-polar Network Structure
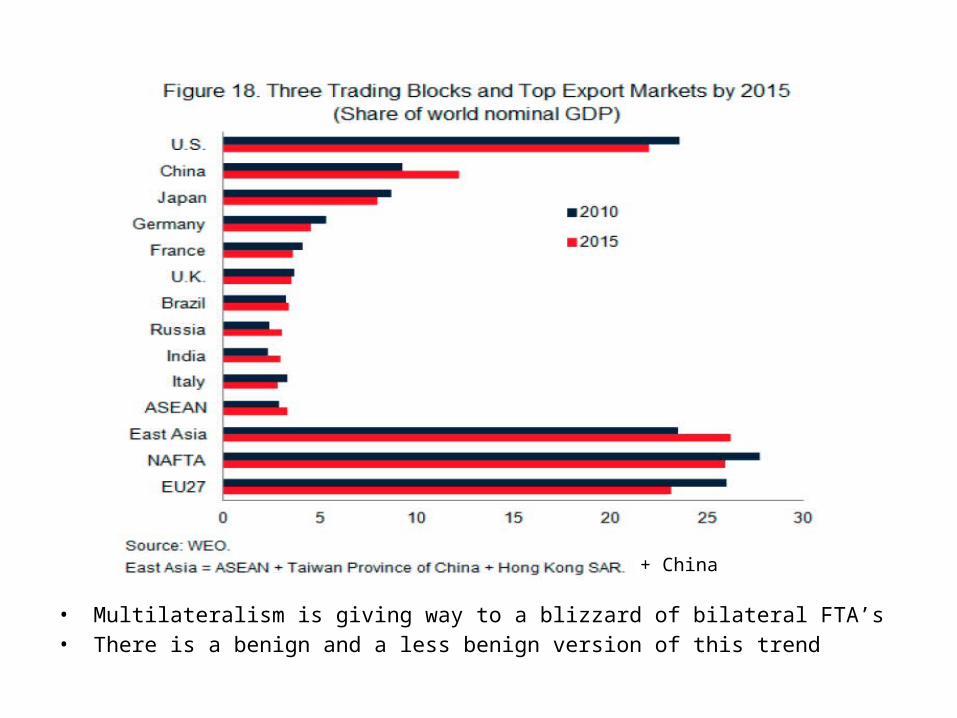
• Multilateralism is giving way to a blizzard of bilateral FTA’s • There is a benign and a less benign version of this trend
+ China
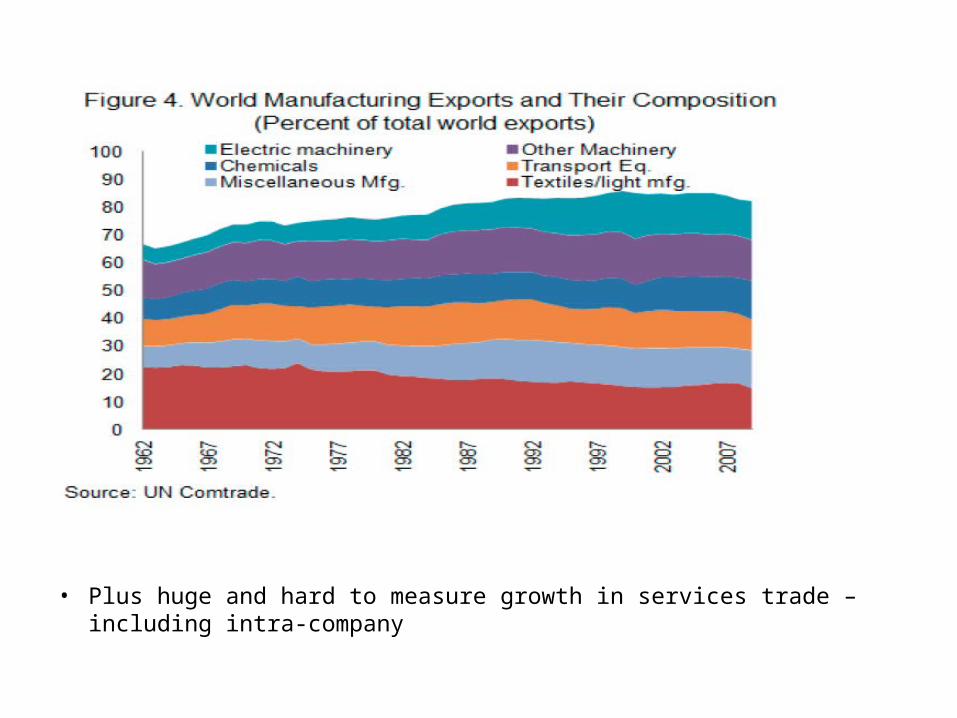
• Plus huge and hard to measure growth in services trade – including intra-company
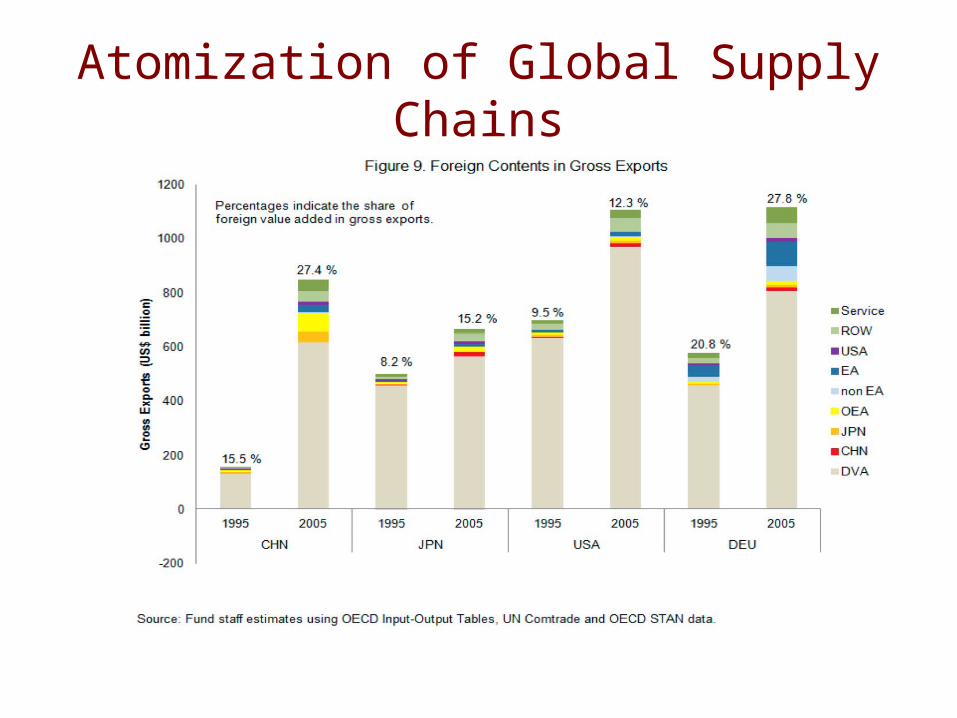
Atomization of Global Supply Chains
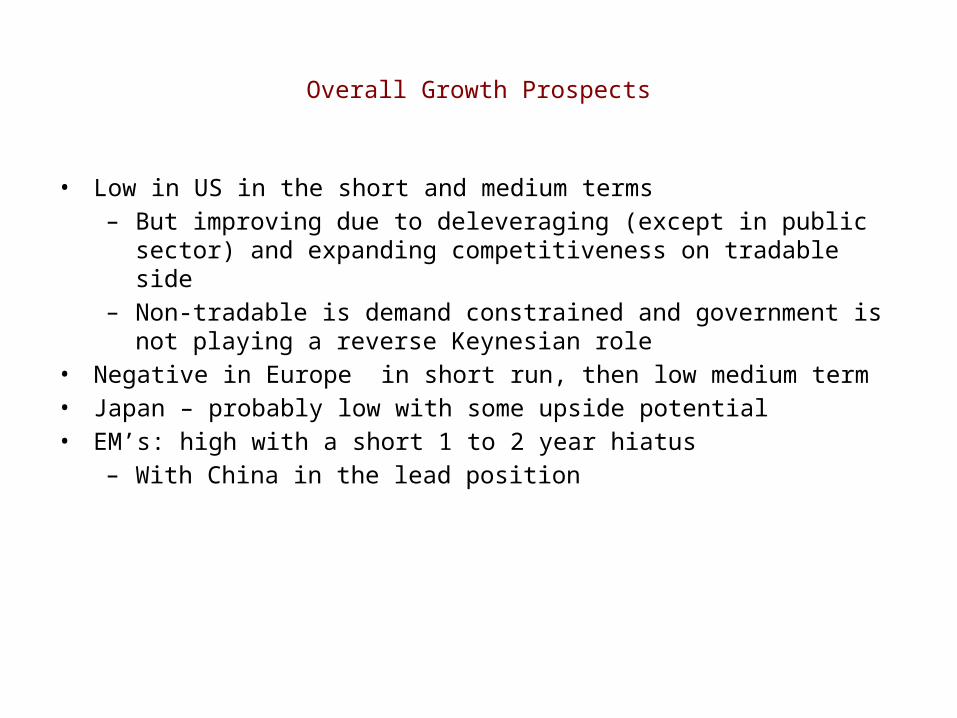
Overall Growth Prospects
• Low in US in the short and medium terms– But improving due to deleveraging (except in public sector) and expanding
competitiveness on tradable side– Non-tradable is demand constrained and government is not playing a reverse
Keynesian role• Negative in Europe in short run, then low medium term• Japan – probably low with some upside potential• EM’s: high with a short 1 to 2 year hiatus
– With China in the lead position
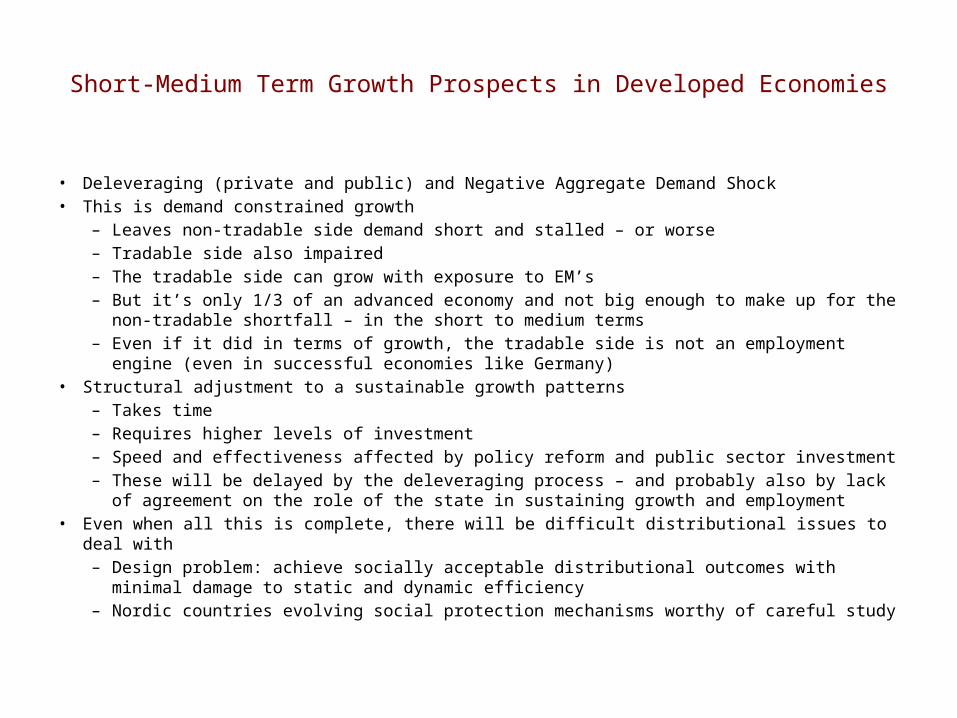
Short-Medium Term Growth Prospects in Developed Economies
• Deleveraging (private and public) and Negative Aggregate Demand Shock• This is demand constrained growth
– Leaves non-tradable side demand short and stalled – or worse– Tradable side also impaired– The tradable side can grow with exposure to EM’s– But it’s only 1/3 of an advanced economy and not big enough to make up for the non-tradable
shortfall – in the short to medium terms– Even if it did in terms of growth, the tradable side is not an employment engine (even in successful
economies like Germany)• Structural adjustment to a sustainable growth patterns
– Takes time– Requires higher levels of investment– Speed and effectiveness affected by policy reform and public sector investment– These will be delayed by the deleveraging process – and probably also by lack of agreement on the
role of the state in sustaining growth and employment• Even when all this is complete, there will be difficult distributional issues to deal with
– Design problem: achieve socially acceptable distributional outcomes with minimal damage to static and dynamic efficiency
– Nordic countries evolving social protection mechanisms worthy of careful study
Major EM Growth
• Looks good or promising• Indonesia 6%• Brazil - growth slowdown but growth is inclusive• India – impact of Europe and self-inflicted wounds• Mexico• Turkey• Many African Countries• China
– Is the main event– I will come to it shortly
17
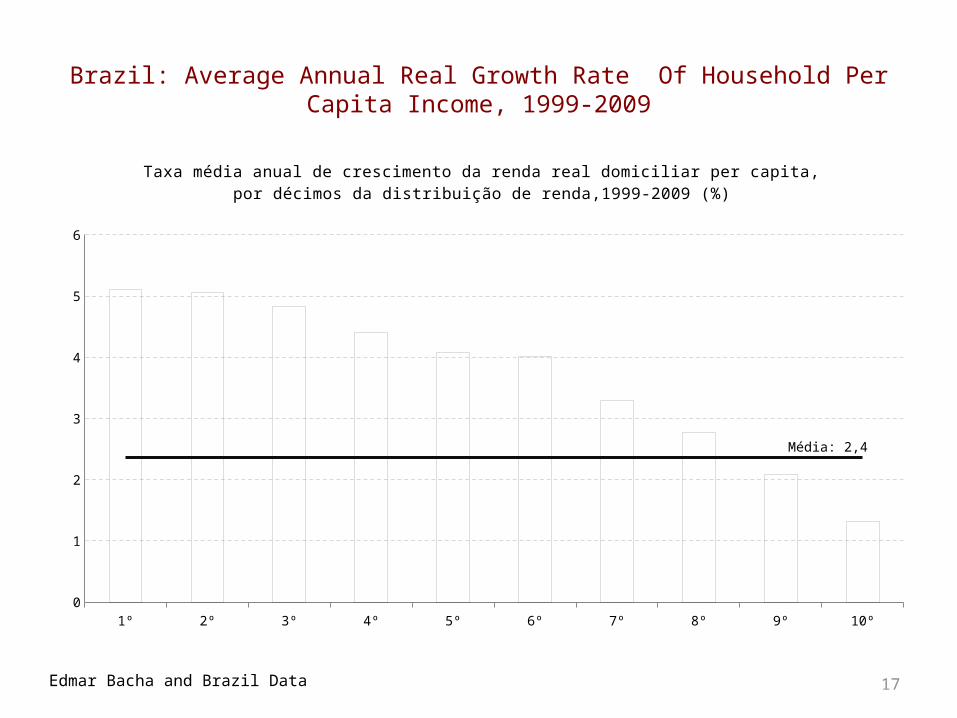
Brazil: Average Annual Real Growth Rate Of Household Per Capita Income, 1999-2009
1º 2º 3º 4º 5º 6º 7º 8º 9º 10º0
1
2
3
4
5
6
Média: 2,4
Taxa média anual de crescimento da renda real domiciliar per capita, por décimos da distribuição de renda,1999-2009 (%)
Edmar Bacha and Brazil Data
18
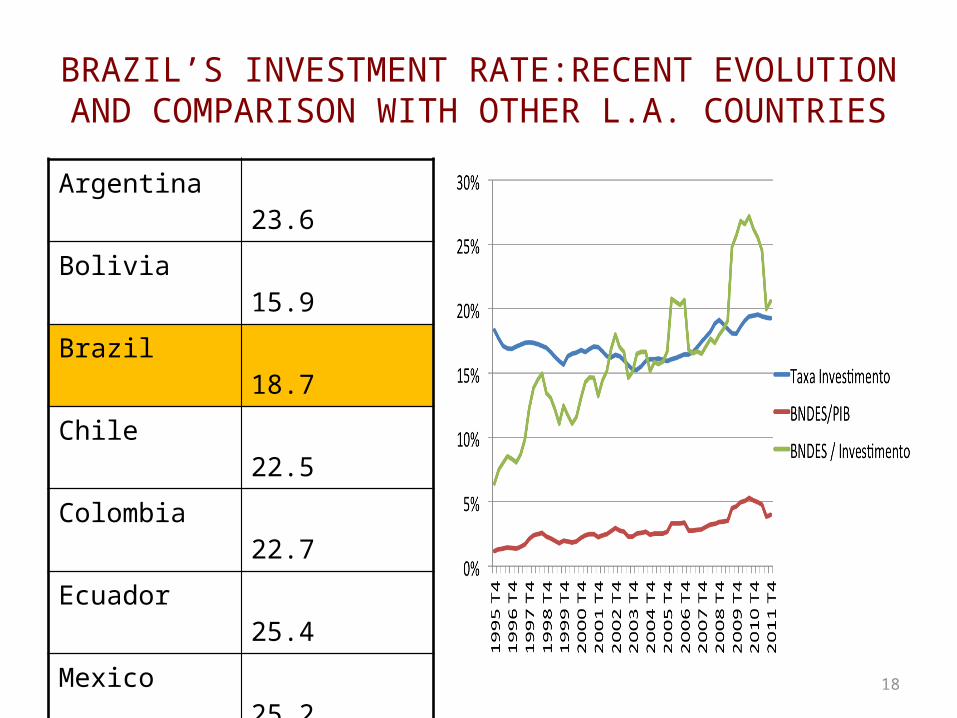
BRAZIL’S INVESTMENT RATE:RECENT EVOLUTION AND COMPARISON WITH OTHER L.A. COUNTRIES
Argentina 23.6
Bolivia 15.9 Brazil 18.7 Chile 22.5 Colombia 22.7
Ecuador 25.4 Mexico 25.2 Panama 24.3 Paraguay 18.3
Peru 22.8 Uruguay 19.6 Mean 21.7
Resilience Partial Decoupling
• Post crisis evidence - • Key is aggregate demand and its composition• What is new is that EM’s are large enough and rich enough to generate enough
demand (that matches comparative advantage) to sustain high growth– Size (50% of global economy)– Middle income levels– Trade within the group– The network structure of the global economy is becoming more complex and
is less developed country centric– Fiscal stability and capacity to invest
• But they cannot make up for a large drop in developed country demand – hence the negative short run impact of Europe – via the China channel
• Also not immune to systemic risk coming from developed countries
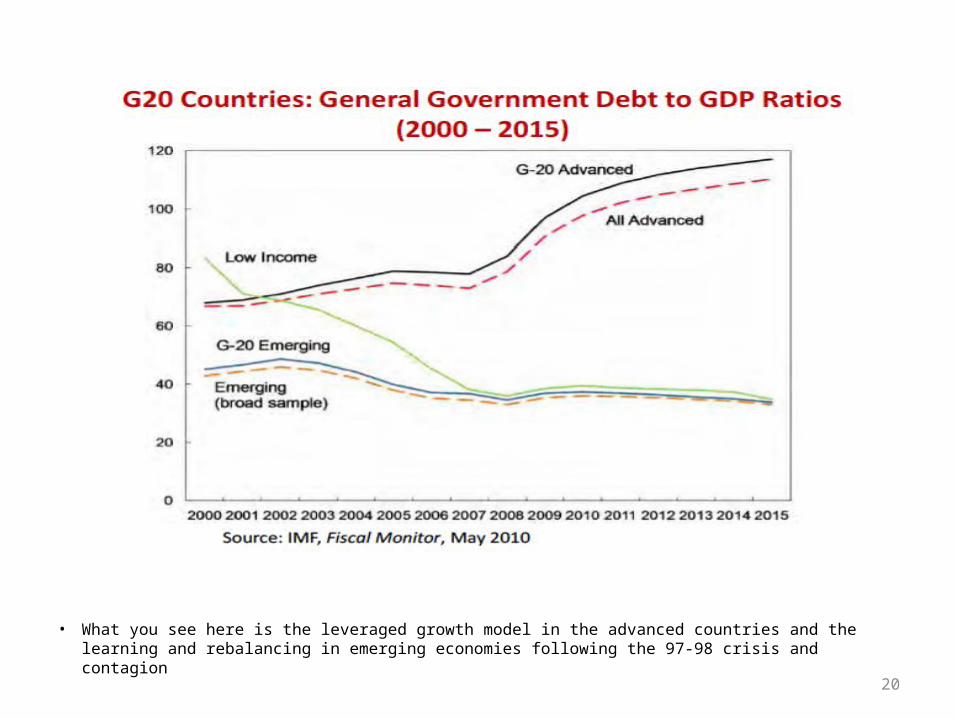
• What you see here is the leveraged growth model in the advanced countries and the learning and rebalancing in emerging economies following the 97-98 crisis and contagion
20
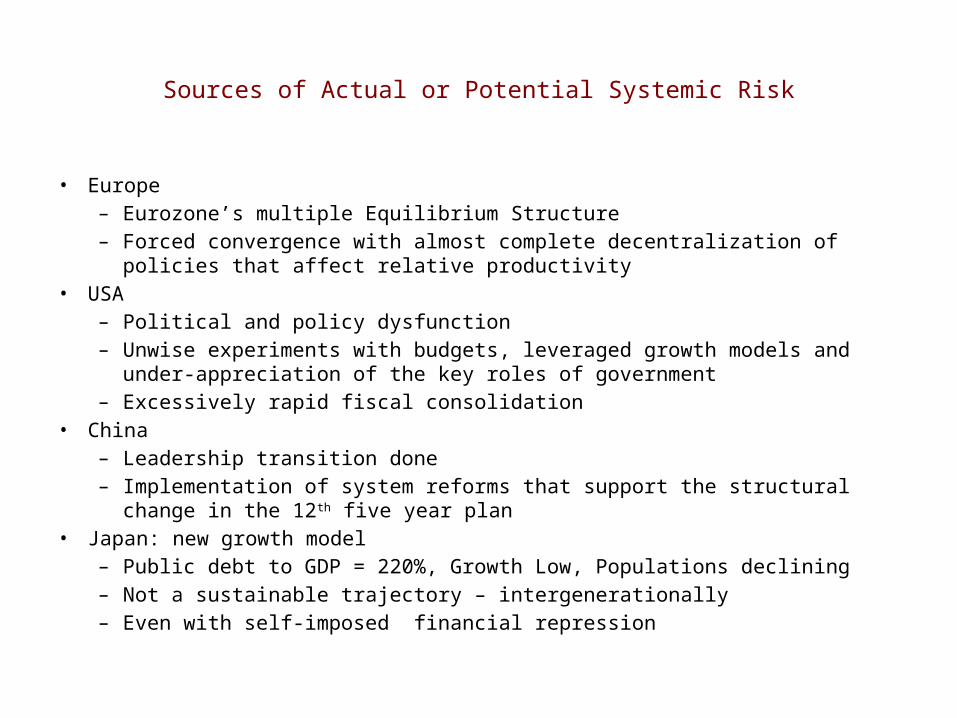
Sources of Actual or Potential Systemic Risk
• Europe– Eurozone’s multiple Equilibrium Structure– Forced convergence with almost complete decentralization of policies that affect relative
productivity• USA
– Political and policy dysfunction– Unwise experiments with budgets, leveraged growth models and under-appreciation of the
key roles of government– Excessively rapid fiscal consolidation
• China– Leadership transition done– Implementation of system reforms that support the structural change in the 12th five year plan
• Japan: new growth model – Public debt to GDP = 220%, Growth Low, Populations declining– Not a sustainable trajectory – intergenerationally– Even with self-imposed financial repression
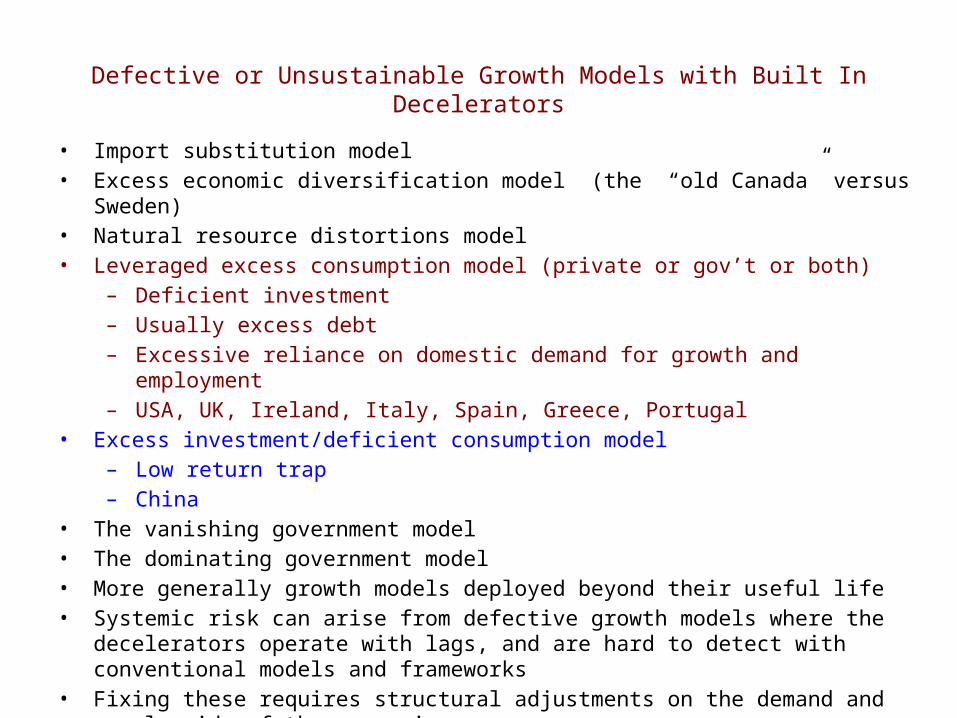
Defective or Unsustainable Growth Models with Built In Decelerators
• Import substitution model• Excess economic diversification model (the “old Canada” versus Sweden)• Natural resource distortions model• Leveraged excess consumption model (private or gov’t or both)
– Deficient investment– Usually excess debt– Excessive reliance on domestic demand for growth and employment– USA, UK, Ireland, Italy, Spain, Greece, Portugal
• Excess investment/deficient consumption model – Low return trap– China
• The vanishing government model• The dominating government model• More generally growth models deployed beyond their useful life• Systemic risk can arise from defective growth models where the decelerators operate with lags,
and are hard to detect with conventional models and frameworks• Fixing these requires structural adjustments on the demand and supply side of the economies
China and the Middle Income Transition
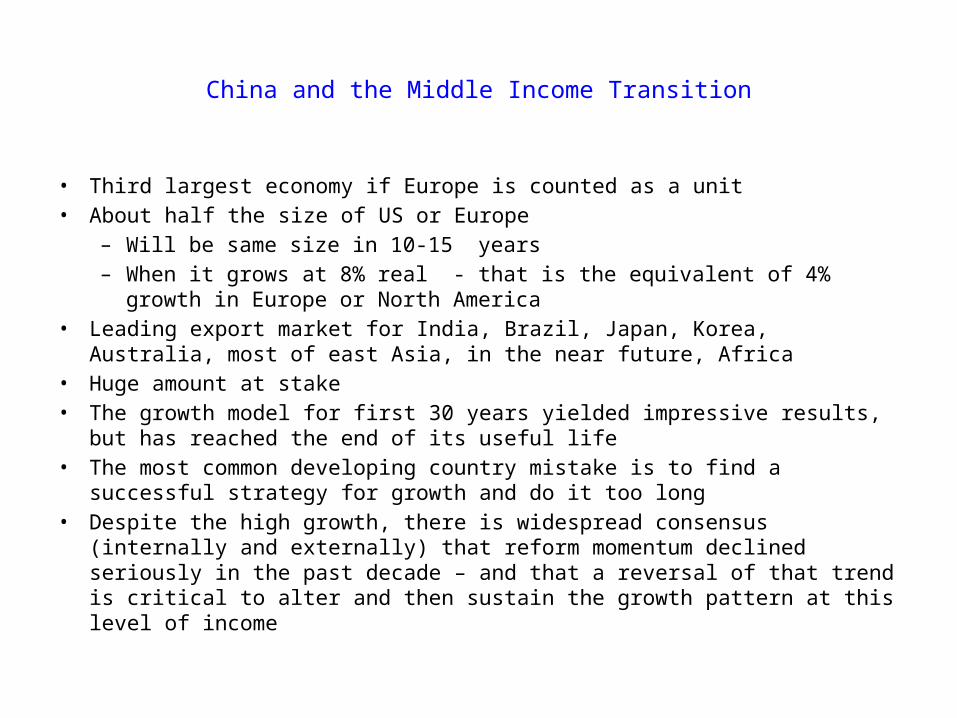
• Third largest economy if Europe is counted as a unit• About half the size of US or Europe
– Will be same size in 10-15 years– When it grows at 8% real - that is the equivalent of 4% growth in Europe or North
America• Leading export market for India, Brazil, Japan, Korea, Australia, most of east Asia, in
the near future, Africa• Huge amount at stake• The growth model for first 30 years yielded impressive results, but has reached the
end of its useful life• The most common developing country mistake is to find a successful strategy for
growth and do it too long• Despite the high growth, there is widespread consensus (internally and externally)
that reform momentum declined seriously in the past decade – and that a reversal of that trend is critical to alter and then sustain the growth pattern at this level of income

China 2030 World Bank and NDRC
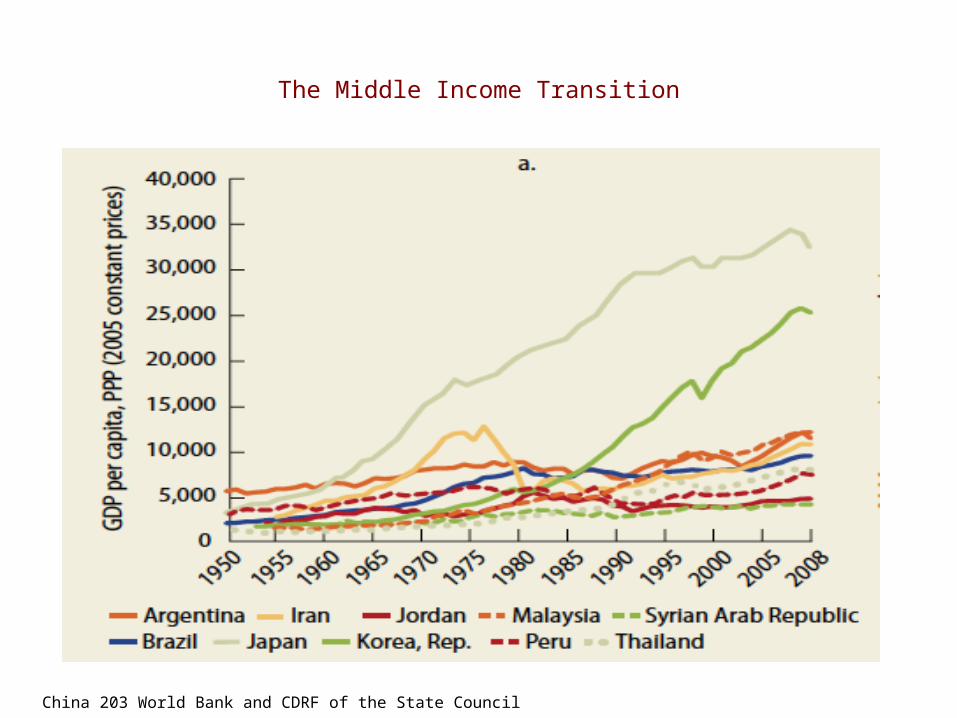
The Middle Income Transition
China 203 World Bank and CDRF of the State Council
Five High Speed Transitions
• Japan• Korea• Taiwan/China• Hong Kong/China• Singapore
• None at China’s scale• None with strong global economic headwinds• No predecessor was systemically important
• Most importantly – China’s growth depends on no slippage in generating domestic aggregate demand– Unlike earlier cases (Korea, Taiwan. China, Japan)– One way to do that is high and rising investment levels – but that will drive investment
returns (private and social) down and is not a sustainable growth pattern– This is all well understood in China – so the challenge is to shift the mix to consumption
and high return investment – and that takes major system reforms
26
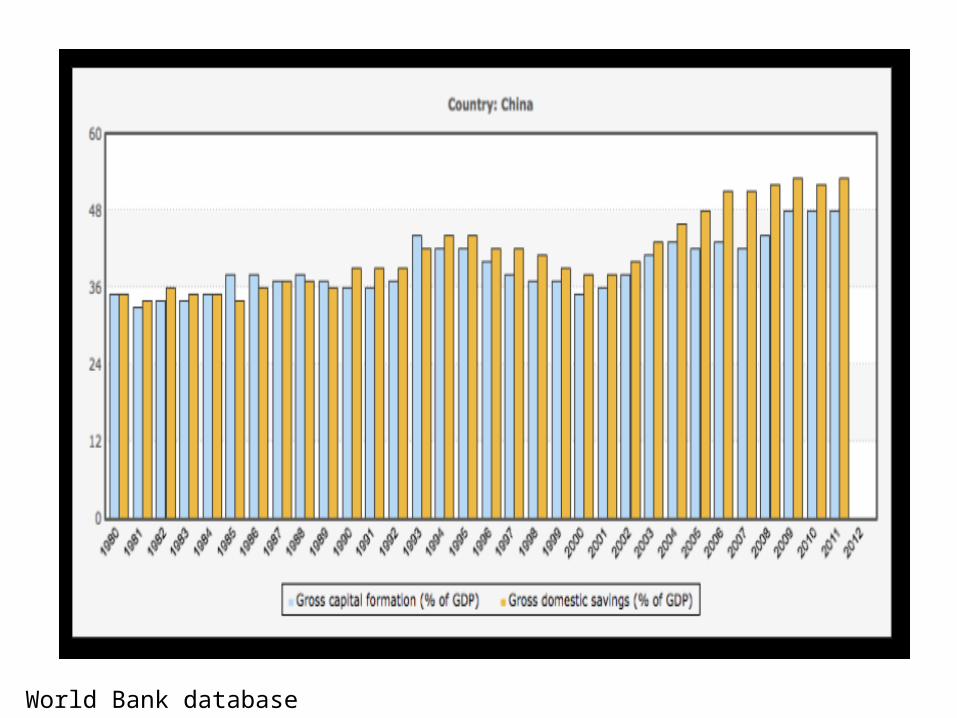
World Bank database
28
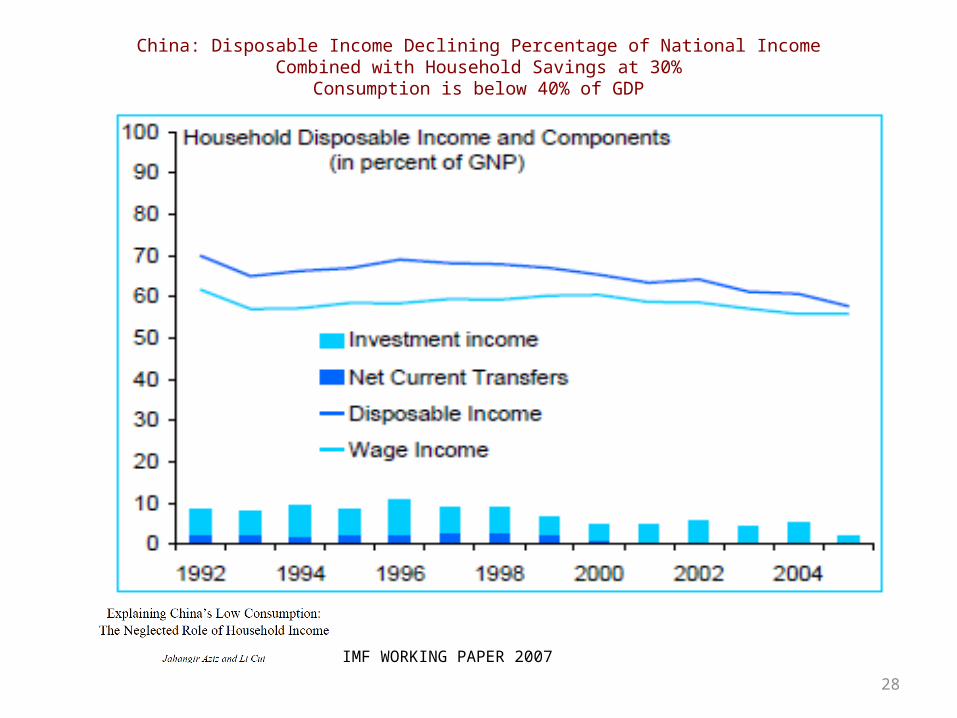
China: Disposable Income Declining Percentage of National IncomeCombined with Household Savings at 30%
Consumption is below 40% of GDP
IMF WORKING PAPER 2007
29
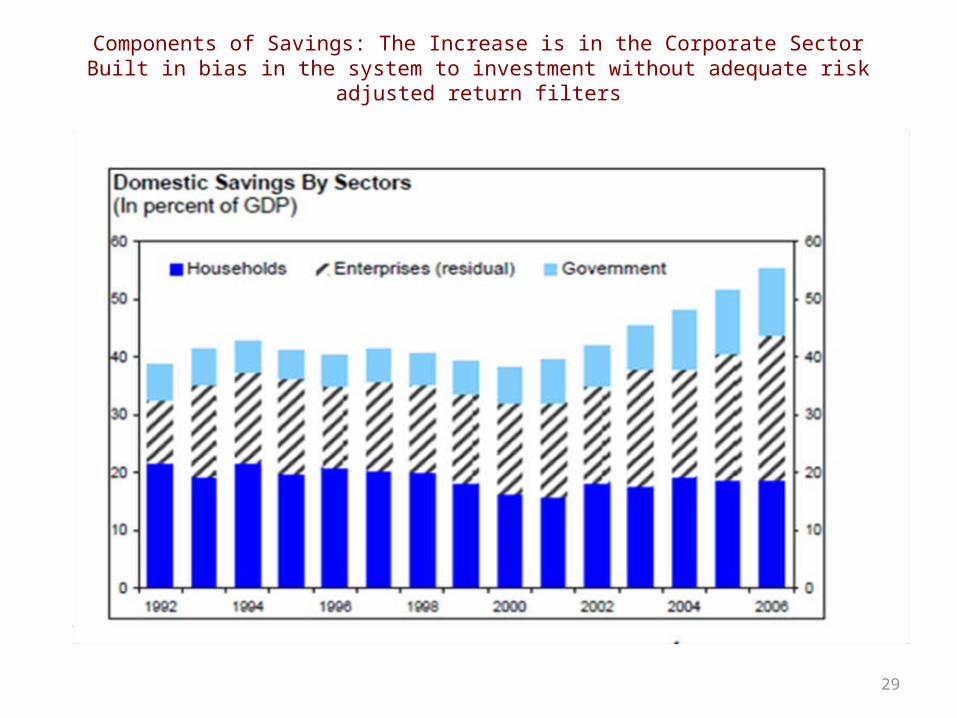
Components of Savings: The Increase is in the Corporate SectorBuilt in bias in the system to investment without adequate risk adjusted return filters
30
Requirements
• Major change in the investment system– Shift from investment led to rate of return lead growth
• Shift in structure of income side of the economy – shift toward the household sector• Elimination of low return investment• Competition and innovation
– Expansion of market side of economy– SOE’s transitioned fully into private sector – with competition, removal of privilege
market access, and altered corporate governance• As market takes larger role, innovation and human capital investment is central• Financial sector development to expand savings options and recycle savings to productive
(high return) investment• Management of public assets
– They will not shrink the state balance sheet replicating the western model• Social insurance and services – focus on inclusion• Urban service sector will take over from labor intensive process manufacturing as main entry
level employment engine
China Has to Climb the Valued Added Ladder
• To support the Income Growth• That means structural transformation
– The lower value added parts of the tradable sector will go to earlier stage developing countries (or be eliminated by technology)
• Keys to Implementation– More household income
• Lower household savings– Less low return investment (public and SOE)– More market lead diversification and innovation, less state– Supporting policies
• Competition policy • Human capital and technology• Financial sector development
• Major implementation risk– Vested interests cloaked in ideological differences, equity issues and (deliberate
misinterpretation of ) failures in the west– SOE’s and competition– Reform momentum and the governance structure
The Multispeed World and the Convergence Pattern will Hold for Some Time
• The return to sustainable growth patterns will be slow but we will get there• Convergence internationally will be accompanied by divergence within countries
– In incomes, opportunity etc– The employment problem will become a distributional one
• Managing the distributional aspects of rapid technological change and globalization will be major challenge for the next decade or more
• Longer term – if we get there – the global economy will triple in size (or more) and the natural resource base of the planet will not support it – not that is on the existing growth models
Investment in EM’s
• Tailwinds in terms of growth• Especially in middle income consumer categories with high income elasticities
(autos, consumer appliances and electronics e.g.)• Investment in infrastructure• Capital equipment• Capital markets vary considerably in openness and accessibility across countries
– China for example is high growth and systemically important but not yet an accessible investment environment for external investors
– But there are indirect channels including via countries and companies that are networked to the Chinese growth engine via trade or FDI
• Multinationals with access to EM’s is one avenue• Not all assets are overpriced – but detailed country specific knowledge is
required
Continued
• Indirect Channels– Taking a broad perspective through the lens of the network structure of the
global economy, and the increasing competitiveness in tradable sectors of several economies
– Countries, sectors and companies that are position to participate in EM Growth
• Massive investment book coming from EM growth and urbanization• If China is successful,
– it will “export” up to 100 million lower skill jobs in the labor intensive process manufacturing and assembly parts of the tradable sector• These will go to earlier stage developing countries• In that component of the frontier markets – there is a huge opportunity
– and the challenge is to figure out who will take advantage of it.– It will produce 400 Million new middle class consumers in 10 years
Structural Adjustment Challenges in the Developed Economies
• Growth– Deleveraging– Structural and competitive adaptation to “new normal” aggregate demand– Governments out of fiscal ammunition
• Employment– Two powerful forces– Labor saving technology (blue and white collar)– Technology assisted globalization– Driving employment to non-routine on the non tradable side and high value
added on the tradable side– Technology and The Employment Challenge - January 2013
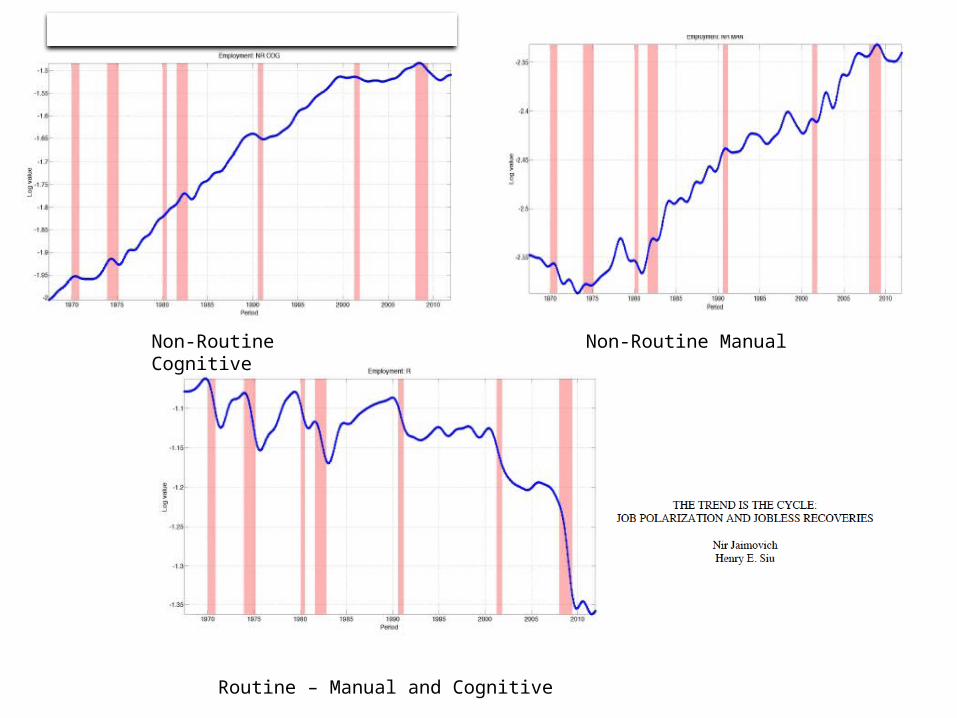
Non-Routine Cognitive Non-Routine Manual
Routine – Manual and Cognitive
38
AgricultureM
iningUtilitiesConstructionM
anufacturing IM
anufacturing II (w/o Pharm
a)Pharm
aM
anufacturing III (w/o Electronics, Autos, and Aero
ElectronicsAutoAeroW
holesale TradeRetail TradeTransportation and W
arehousingInform
ationFinance/InsuranceReal Estate, Rental, LeasingLegal ServicesAccounting, Tax Prep, Payroll, BookkeepingArchitectural &
Engineering ServicesSpecialized DesignCom
puter Systems Design
Managem
ent, Scientific, and Consulting R&
DAdvertisingO
ther Professional, Scientific, and Technical ServicesM
anagement of Com
panies and EnterprisesO
ffice Adm
inistrative ServicesFacilities SupportEm
ployment Services Tradable
Business Support ServicesTravel Arrangem
ent & Reservation Services
Investigation and Security ServicesServices to Buildings and Dw
ellingsO
ther Support ServicesW
aste managem
ent and remediation service
EducationHealth CareArts &
Entertainment
Accomm
odation and FoodO
ther Services (Auto Repair, Dry Cleaning)Governm
ent
-2,000-1,000
01,000
2,0003,000
4,0005,000
6,0007,000
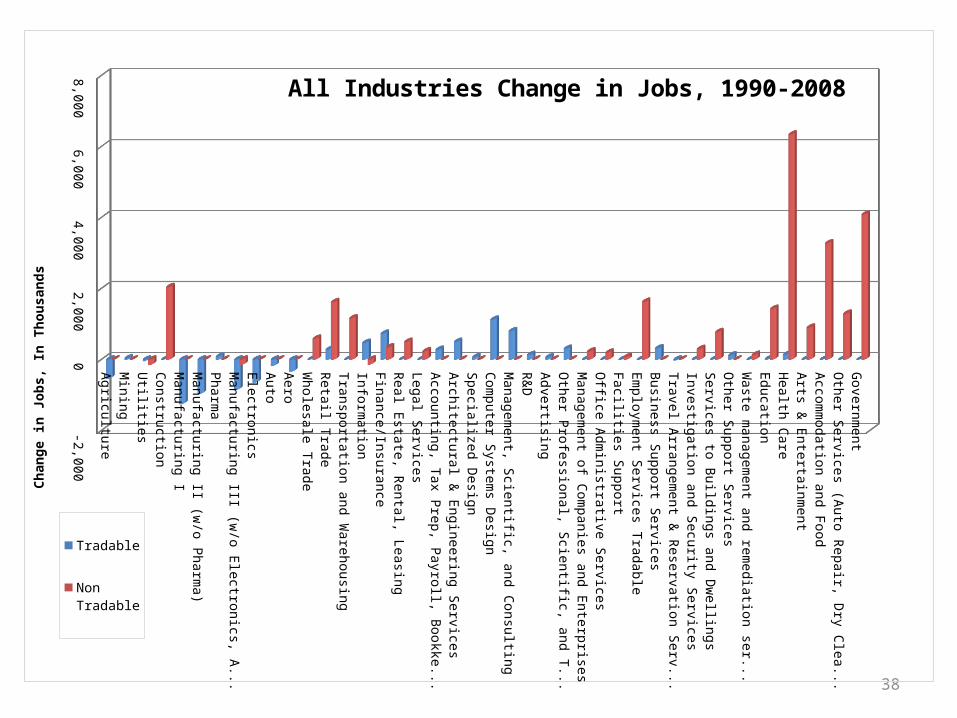
All Industries Change in Jobs, 1990-2008
Tradable
Non Tradable
Chan
ge in
Jobs
, In
Thou
sand
s

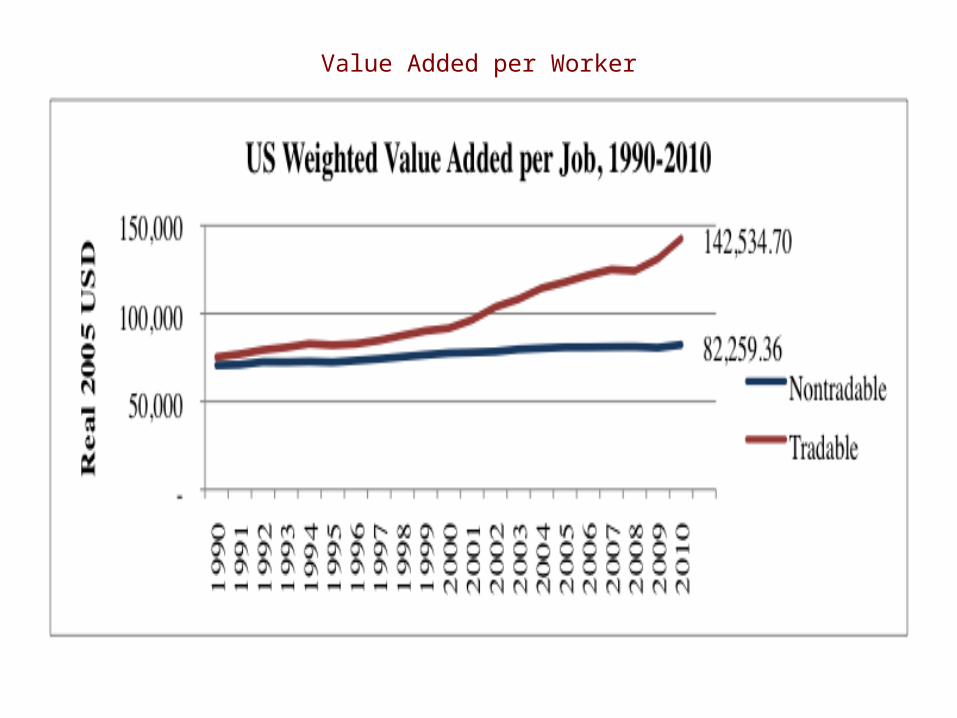
Value Added per Worker