Emerging Challenges and Strategic Implications for Indian ...
9
Research, Innovations and Technology Volume:01/Issue:01/June-2021 www.ritjournal.com www.ritjournal.com [1] @ Research, Innovations and Technology Emerging Challenges and Strategic Implications for Indian Mutual Fund Industry in Post Covid-19 Regime 1 Mr. Rajeev Kumar Sinha, 2 Prof. (Dr.) Angad Tiwary 1 Assistant Professor, School of Commerce & Management, ARKA JAIN University, Jamshedpur. Jharkhand, India Email: 2 Professor, School of Commerce & Management, ARKA JAIN University, Jamshedpur. Jharkhand, India Email: ABSTRACT In India, return in the mutual fund drastically decline due to COVID-19 situation The positive things here is that if we see the capital market history in India, after an adverse situation its always come back by a sharp growth. Investment in mutual funds always based on the best portfolio theory will support ours investment in the adverse market situation and minimize the risk factor in the open market. Inventors always tries to put in selected funds and scheme so that they will get good return in the future and meet their future liabilities and AMC help them to switching from one fund to another funds to minimize the risk factors in the adverse situation of stock markets due to recession, lockdown, inflation, deflation, stagflation and others factors also and sanitized their portfolio against the risk factors involved in the capital market. In this research paper, we are trying to find out the impact of COVID-19 on the Indian Economy and fluctuation in mutual fund performance in the different sector and bring out deliberate inference and recommend premeditated map for coating the mutual funds on escalation pathway in post-COVID-19 for the outstanding quarters of financial year 2020- 2021. Keywords: Mutual Fund, Standard Deviation, Beta, Coefficient of Determination, NAV —————————— —————————— 1 INTRODUCTION In the mutual funds Industry, with a sharp growth of 21% in the year 2015, the Assets Under Management was stood at INR 13, 460 billion and mutual fund industry itself grown by year by year and after 2015 the retail segment shown the fastest growth in this capital markets and provide the better return in the long term investment plan and AUM growth shown parallel growth in the economy also. In India a large no. of population are moving towards the interment in capital market for their wealth maximization and looking for the best portfolio to invest now, it’s the responsibility of financial service sector and AMC to provide a good opportunities and better portfolio to these new investors in the major part of the country. Mutual fund industry has a lot of opportunity and challenges to increase the annual turnover in the share markets and provides good tax saving investment plan and manage the money of the people in such a way that investors can get optimum return in their future earning, In this scenario mutual fund industry has to increase the financial product as well as financial services to the investors in the capital market. SEBI is working on the behalf of the investors and makes transparency between the retails investors and Company so that investors can good return in the capital market after facing a lot of risk factors in the financial sectors. By using the financial leverage technology, the mutual funds always launch innovative products for the potential investors and increased their online financial distribution channels to get more and more investors in the Indian market. [1] Growth in Mutual Fund Assets 2020 - Assets Under management (in Rs. Crore) [2] Mutual Funds Dec 2019 June 2020 Change %Change SBI Mutual fund 352632 364,363 11,731 3.33 HDFC Mutual fund 382,517 356,183 -26,334 -6.88 ICICI Prudential Mutual fund 361,507 326,291 -35,215 -9.74 Aditya Birla Sun life mutual fund 249,926 214,592 -35,334 -14.14 Nippon India Mutual fund 204,371 180,061 -24,310 -11.90 Kotak Mahindra mutual fund 176,961 167,326 -9,636 -5.45 Axis Mutual Fund 122,867 134,316 11,449 9.32
Transcript of Emerging Challenges and Strategic Implications for Indian ...
Research, Innovations and Technology Volume:01/Issue:01/June-2021 www.ritjournal.com
www.ritjournal.com [1] @ Research, Innovations and Technology
Emerging Challenges and Strategic Implications for Indian Mutual
Fund Industry in Post Covid-19 Regime
1 Mr. Rajeev Kumar Sinha, 2 Prof. (Dr.) Angad Tiwary
1 Assistant Professor, School of Commerce & Management, ARKA JAIN University, Jamshedpur. Jharkhand, India
Email: 2 Professor, School of Commerce & Management, ARKA JAIN University, Jamshedpur. Jharkhand, India
Email:
ABSTRACT In India, return in the mutual fund drastically decline due to COVID-19 situation The positive things here is that if we see the
capital market history in India, after an adverse situation its always come back by a sharp growth. Investment in mutual funds
always based on the best portfolio theory will support ours investment in the adverse market situation and minimize the risk
factor in the open market. Inventors always tries to put in selected funds and scheme so that they will get good return in the
future and meet their future liabilities and AMC help them to switching from one fund to another funds to minimize the risk
factors in the adverse situation of stock markets due to recession, lockdown, inflation, deflation, stagflation and others factors
also and sanitized their portfolio against the risk factors involved in the capital market. In this research paper, we are trying to
find out the impact of COVID-19 on the Indian Economy and fluctuation in mutual fund performance in the different sector
and bring out deliberate inference and recommend premeditated map for coating the mutual funds on escalation pathway in
post-COVID-19 for the outstanding quarters of financial year 2020- 2021.
Keywords: Mutual Fund, Standard Deviation, Beta, Coefficient of Determination, NAV
—————————— ——————————
1 INTRODUCTION
In the mutual funds Industry, with a sharp growth of 21% in the
year 2015, the Assets Under Management was stood at INR 13,
460 billion and mutual fund industry itself grown by year by year
and after 2015 the retail segment shown the fastest growth in this
capital markets and provide the better return in the long term
investment plan and AUM growth shown parallel growth in the
economy also.
In India a large no. of population are moving towards the
interment in capital market for their wealth maximization and
looking for the best portfolio to invest now, it’s the responsibility
of financial service sector and AMC to provide a good
opportunities and better portfolio to these new investors in the
major part of the country. Mutual fund industry has a lot of
opportunity and challenges to increase the annual turnover in the
share markets and provides good tax saving investment plan and
manage the money of the people in such a way that investors can
get optimum return in their future earning, In this scenario mutual
fund industry has to increase the financial product as well as
financial services to the investors in the capital market. SEBI is
working on the behalf of the investors and makes transparency
between the retails investors and Company so that investors can
good return in the capital market after facing a lot of risk factors in
the financial sectors. By using the financial leverage technology,
the mutual funds always launch innovative products for the
potential investors and increased their online financial distribution
channels to get more and more investors in the Indian market. [1]
Growth in Mutual Fund Assets 2020 - Assets Under
management (in Rs. Crore) [2]
Mutual Funds Dec 2019 June 2020 Change %Change
SBI Mutual
fund
352632 364,363 11,731 3.33
HDFC Mutual
fund
382,517 356,183 -26,334 -6.88
ICICI
Prudential
Mutual fund
361,507 326,291 -35,215 -9.74
Aditya Birla
Sun life mutual
fund
249,926 214,592 -35,334 -14.14
Nippon India
Mutual fund
204,371 180,061 -24,310 -11.90
Kotak
Mahindra
mutual fund
176,961 167,326 -9,636 -5.45
Axis Mutual
Fund
122,867 134,316 11,449 9.32

Research, Innovations and Technology Volume:01/Issue:01/June-2021 www.ritjournal.com
www.ritjournal.com [2] @ Research, Innovations and Technology
IDFC mutual
fund
104,630 101,770 -2,860 -2.73
UTI mutual
fund
157,119 133,631 -23,488 -14.95
Franklin
Templeton
Mutual fund
126,475 79,808 -46,667 -36.90
Indian Stock market Outlook: [3] The Indian stock market movement is always fluctuated during the
pandemic, recession and other adverse situation with a major
downfall point and after that positive movement of economy and
sentiments of investors and trust of FII, FDI and others financial
institution again boost the stock market with a new height. This is
what has happened during the current bullish recoveries in Indian,
US and European stock markets
As we know that National Stock Exchange touch 7500 level after
a drastic downfall during the period of COVID-19 , if we saw the
historical data , the Indian stock market perform amazing in the
March 2021and both NSE and BSE reached at a landmark point
showing the continuous growth in Nifty and Sensex and boost the
Indian economy with a reputed benchmark.so, there is always a
fundamental issue with stock market and risk and return factors is
solved by fundament and technical analysis inside the stock
exchange and portfolio management always play a big role to
minimize the risk factor involved in the investment.
Countries across the world announced lockdowns. In India, the
first lockdown was imposed on March 25. The lockdown had a
severe impact on the first quarter of the Financial Year 2020-21,
and it was projected that India will perform poorly in April-June
and July-September quarter due to drop in manufacturing and
service activities. However, what followed was completely
ironical as Indian stock markets witnessed a rise. So was the case
with Dow Jones, it moved towards V-shaped recovery at the back
contracted GDP estimates, falling economic data and other KPI's
2 LITERATURE REVIEW
Strategy over panic
In the current situation of the mutual funds industry, a lot of major
investors pull ot their money and keeping those money in safer side
of the investment plan, but the expert believed that pull out money
is not the right decision for the investors, they have to analysis the
situation and make better portfolio for the investment in mutual
funds. Pandemic condition is not forever and after some time in
future situation will be normal and in favour of investors to
overcome all their loss due to pandemic.
Corona virus impact on equity: buy, sell or stay
How much have equity investors lost in 2020
(The Economics Times)
AMFI believe that the six major debt funds having best credit
quality and reasonable liquidity also and there are sufficient
liquidity is available in the capital market for the potential
investors and investor have to keep their investment in diversified
portfolio to minimize the risk factor involve in the mutual funds.
RBI’s assurance
In the pandemic situation, the Reserve Bank of India (RBI) also
support to the investors to minimize their risk factor in mutual
funds market and provided support stressed mutual funds with a
highly liquidity window by putting Rs. 50,000crore in the capital
market and assured investors for the panic situation and monitor
the each and every pro and cons in the mutual funds to against any
adverse situation and will maintain the liquidity position in the
market Major mutual fund houses facing liquidity problem in this
present situation of COVID-19 and RBI support funds will
definitely give financial motivation and backbone to their industry
to faces the challenge in the adverse market condition. Industry
experts has given the suggestion to new investors to put their
money in portfolio based scheme to minimize the risk factors and
already invested are required to maintain portfolio and switch over
to better diversified portlier to sustain in the capital market.
Mutual Fund Investment: How Budget 2020 will impact mutual fund investors
A Tax Deduction at Source (TDS) at 10% on the dividend income
above Rs 5000 before it is distributed to the investors has been
introduced in the Union Budget 2020 , which shown the following
implication on the mutual funds investment.
New tax regime: A positive sign for mutual fund investments with
effect from FY 20-21, a fresh tax system has introduced in the
union budget in which an advantage has been given to taxpayers
from a lower slab rates by forgoing a preponderance of tax-
30-45% loss 36%
45-60% loss 12%
Over 60% loss 4%
less than 15% loss 14%
15-30% loss 33%

Research, Innovations and Technology Volume:01/Issue:01/June-2021 www.ritjournal.com
www.ritjournal.com [3] @ Research, Innovations and Technology
deduction benefits to lower their tax burden. Taxpayers will also
have the alternative to carry on with the obtainable tax system.
Taxpayers has a liberty in instruments and they are in the position
to select the better fund to minimize the risk factors and they have
an option to choose those funds, which are having high return
without saving the tax.
In the existing tax regime, potential investor s has to invest in those
tax saving fund only where they have to face the challenge of
locking period, hidden charges, administrative expenses and these
factors increase the time period of return on investment avenue
also. Tax saver bound to invest on those kind of funds, in which
high return is not there and sometimes these investment not
associative d with their future planning of investment. Now as per
the new tax regime, taxpayers can invest in wealth creation funds
based on their capability of risk factors in the capital market and
achieve their financial long term goal to meet their future liabilities
and these investment create a liquidity also for the future prospect
of life.
COVID-19 Pandemic
Due to COVID19 Pandemic, the investment in the mutual funds
are very challenging and highly risky. The impact of pandemic is
decline the phase of economy not only in mutual fund but also in
the others sectors of invent and worldwide all the developed and
developing country are facing the problem in their economy and
GDP growth rate goes down to negative digits.
In the latest report of Franklin Templeton, six major debt mutual
funds facing problem due to COVID-19 and their growth decline
sharply. It decline the India’s credit situation and all the Non-
banking financial companies facing huge problem to maintain their
liquidity position and major investors withdrawn their money from
the mutual funds due to the fear factors of adverse situation of
capital market in India and rest of the world also. This pandemic
situation put mutual funds industry in big trouble and people are
not investing in open market due to high volatile markets under the
wings of Pandemic worldwide.
Experts say that the six Franklin Templeton mutual funds schemes,
which were closed were high-risk funds and other MF schemes do
not face redemption risks. The Association of Mutual Funds of
India (AMFI) assured investors that it was a one-off incident and
that it will have no contagion effect on other credit-risk funds.
Objectives of the Study
The objectives of the paper are given below:
(a) To analyze the impact of COVID-19 on the current situation
of mutual funds and economic conation of the country for the
remaining time period of financial year 2020=21.
(b) To analyze the comparative analysis of mutual funds
investment on pre and post period of COVID-19
(c) To draw financial strategic implications for the investment in
mutual fund industry after pandemic for the rest period of FY
2020-21
3 METHODOLOGY Research Methodology is a systematic or step by step procedure to
carry out the research process. Varieties of research methods like
qualitative and quantitative techniques are used to achieve research
objectives. It can also be defined as the way to find out solution to
a research problem.
(a) The study being analytical in nature and do a comparative
analysis between the Nov, 2019 to Nov, 2020, which is taken
from the data available at the website of Association of Mutual
Funds in India (AMFI)
(b) The analyses are presented in a series of Tables, which are
self-explanatory.
4 MODELING AND ANALYSIS ECONOMIC OUTLOOK FOR FY 2020-21 [4]
Goldman Sachs told in it latest report that GDP growth rate of India
will be faster than any other country if the proper effective
COVID-19 vaccination is available in India and become the third
largest economy of the world and in term of growth in the economy
India’s gross domestic product will be reduce to 10.3% in FY
2020-21 against a contraction of 14.8% forecast as per the report
was published in the global financial services and . GDP growth is
estimated at 13% in FY22 compared with 15.7% projected
In the Financial Year 2022, India’s fiscal deficit is reduced to 6.5%
as earlier it was expected to 8%, according to Goldman Sachs. The
central government’s plus states’ fiscal deficit is estimated to
narrow from 11.5% to 9.5% of the GDP in the same duration, the
report said. “This suggests that the total fiscal policy contribution
to growth will decline further in FY22.”
Consumer Price Index is the barometer of the financial derivatives,
which measures the inflation rate and estimated at 6.2% in FY21,
and it will decline to 4.6 % in the financial year 2022 as food price
decrease based on the supply and demand function in the seasonal
variation.

Research, Innovations and Technology Volume:01/Issue:01/June-2021 www.ritjournal.com
www.ritjournal.com [4] @ Research, Innovations and Technology
Status of Indian mutual funds industry from the period April
1, 2020 to Nov 20, 2020 (INR in Crore) [5]
Sr.
No.
Scheme
Category
No. of
Folios as
on
November
30, 2020
Funds
mobiliz
ed for
the
period
(Since
April
01, 2020
to
Novemb
er 30,
2020)
Repurch
ase/
Redempt
ion for
the
period
(Since
April 01,
2020 to
Novemb
er 30,
2020)
Net
Inflow
(+ve)/
Outflo
w (-ve)
for the
period
(Since
April
01,
2020 to
Novem
ber 30,
2020)
Net Assets
Under
Managemen
t as on
November
30, 2020
A Open ended
Schemes
I
Income/De
bt Oriented
Schemes
1 Overnight
Fund 116364
2104639
.35
2128913.
02
-
24273.6
7
57514.60
2 Liquid
Fund 2164701
2519811
.65
2489861.
98
29949.6
7 375646.63
3
Ultra Short
Duration
Fund
733257 126788.
71 98375.85
28412.8
7 104930.96
4
Low
Duration
Fund
1134891 189117.
05
125051.8
4
64065.2
1 150945.44
5
Money
Market
Fund
458938 173602.
96
134561.8
7
39041.0
9 99003.22
6
Short
Duration
Fund
612061 114421.
64 62556.04
51865.5
8 153019.42
7
Medium
Duration
Fund
291821 9610.93 11708.32 -
2097.40 27375.56
8
Medium to
Long
Duration
Fund
121753 4094.73 2706.90 1387.83 11980.95
9
Long
Duration
Fund
30569 1235.48 536.39 699.09 2516.95
10 Dynamic
Bond Fund 286866
11946.2
3 6232.40 5713.83 25061.81
11 Corporate
Bond Fund 639905
96923.3
9 37458.69
59464.7
0 149604.31
12 Credit Risk
Fund 372020 1902.05 30001.45
-
28099.428545.08
0
13
Banking
and PSU
Fund
358114 96709.3
6 52928.80
43780.5
7 123449.37
14 Gilt Fund 217987 19583.6
2 9544.28
10039.3
4 20301.89
15
Gilt Fund
with 10
year
constant
duration
57593 937.31 443.17 494.14 1525.16
16 Floater
Fund 204728
47687.3
0 27199.59
20487.7
1 55707.62
Sub total - I
(1+2+3+4+
5+6+7+8+9
+10+11+12
+13+14+15
+16)
7801568 5519011
.76
5218080.
59
300931.
16 1387128.97
II
Growth/Eq
uity
Oriented
Schemes
17 Multi Cap
Fund 9495460
20950.7
9 27808.76
-
6857.96 160052.73
18 Large Cap
Fund 10316712
24380.6
5 27681.11
-
3300.46 163104.47
19
Large &
Mid Cap
Fund
4834111 10630.3
8 9862.81 767.57 66391.80
20 Mid Cap
Fund 6441713
12727.4
9 15036.33
-
2308.83 100696.95
21 Small Cap
Fund 4959637 8915.37 9566.42 -651.06 59209.50
22 Dividend
Yield Fund 448580 165.14 404.19 -239.05 4409.67
23
Value
Fund/Contr
a Fund
3886059 5189.96 9434.16 -
4244.20 56573.12
24 Focused
Fund 3753444
11693.7
4 9407.46 2286.28 60524.70
25
Sectoral/Th
ematic
Funds
7029274 15757.8
2 13598.88 2158.93 75594.15
26 ELSS 1238547 8176.64 6934.57 1242.08 110953.34
Sub total -
II
(17+18+19
+20+21+22
+23+24+25
+26)
63550397 118587.
97
129734.6
8
-
11146.6
9
857510.44
III Hybrid
Schemes

Research, Innovations and Technology Volume:01/Issue:01/June-2021 www.ritjournal.com
www.ritjournal.com [5] @ Research, Innovations and Technology
27
Conservati
ve Hybrid
Fund
377917 1727.37 2670.79 -943.42 11826.38
28
Balanced
Hybrid
Fund/Aggr
essive
Hybrid
Fund
4918476 7984.85 24197.66
-
16212.8
1
118310.29
29
Dynamic
Asset
Allocation/
Balanced
Advantage
2674916 11275.4
8 15685.79
-
4410.31 94088.57
30 Multi Asset
Allocation 721631 2564.93 2271.40 293.53 13533.38
31 Arbitrage
Fund 397903
49915.5
8 35593.61
14321.9
8 62781.39
32
Equity
Savings
Fund
298466 759.54 3866.67 -
3107.14 10032.17
Sub total -
III
(27+28+29
+30+31+32
)
9389309 74227.7
5 84285.91
-
10058.1
7
310572.18
IV
Solution
Oriented
Schemes
33 Retirement
Fund 2546069 1173.85 923.82 250.03 11407.90
34 Childrens'
Fund 2890935 473.34 220.27 253.07 9866.12
Sub total -
IV (33+34) 5437004 1647.19 1144.10 503.10 21274.02
V Other
Schemes
35 Index
Funds 775616 6388.37 4785.86 1602.50 14301.14
36 GOLD
ETFs 838149 5871.13 1161.52 4709.61 13239.88
37 Other ETFs 3248481 60521.2
1 39247.70
21273.5
0 233668.70
38
Fund of
funds
investing
overseas
464020 4495.71 1123.34 3372.37 7641.97
Sub total -
V
(35+36+37
+38)
5326266 77276.4
1 46318.43
30957.9
9 268851.70
Total A-
Open ended 91504544
5790751
.09
5479563.
71
311187.
39 2845337.31
Schemes
B
Close
Ended
Schemes
I
Income/De
bt Oriented
Schemes
I Fixed Term
Plan 521582 76.44 30110.07
-
30033.6
3
118458.77
Ii
Capital
Protection
Oriented
Schemes
59827 0.00 1867.84 -
1867.84 2628.95
iii
Infrastructu
re Debt
Fund
89 0.00 0.00 0.00 2328.01
Iv Other Debt 18947 0.00 2875.94 -
2875.94 779.43
Sub total
(i+ii+iii+iv
)
600445 76.44 34853.85
-
34777.4
1
124195.16
II
Growth/Eq
uity
Oriented
Schemes
I ELSS 457228 0.00 150.49 -150.49 4438.92
Ii Others 1113484 0.00 3202.03 -
3202.03 26547.92
Sub total
(i+ii) 1570712 0.00 3352.53
-
3352.53 30986.84
III Other
Schemes 0 0.00 0.00 0.00 0.00
Total B -
Close
ended
Schemes
2171157 76.44 38206.38
-
38129.9
3
155181.99
C Interval
Schemes
I
Income/De
bt Oriented
Schemes
3632 3.61 43.75 -40.14 385.14
II
Growth/Eq
uity
Oriented
Schemes
0 0.00 0.00 0.00 0.00
III Other
Schemes 0 0.00 0.00 0.00 0.00

Research, Innovations and Technology Volume:01/Issue:01/June-2021 www.ritjournal.com
www.ritjournal.com [6] @ Research, Innovations and Technology
Total C -
Interval
Schemes
3632 3.61 43.75 -40.14 385.14
Grand
Total
(A+B+C)
93679333 5790831
.14
5517813.
83
273017.
32 3000904.44
Fund of
Funds
Scheme
(Domestic)
1015460 10253.7
6 3697.60 6556.16 21934.62
Mutual Funds Capital Gains Taxation for FY 2019-2020 In the mutual fund industry, a capital gain indicates the difference
between the ask rate and bid rate in their investment and difference
of selling price and buying price after paying the brokerage charge
shows the actual benefit to the potential investor in the mutual
fund. [5]
For instance, Mr. Y has invested Rs. 5 Lakh in the equity funds on
April 1, 2017 and due to better portfolio, its value become Rs. 7
lakh on April1, 2020. In this condition his capital gain is Rs.
2,00,000
The mutual funds capital gains taxation depends on the type of
mutual fund scheme and the investment tenure. On the basis of
investment tenure, there are two types of capital gains tax – Short
Term Capital Gains Tax (STCG) and Long Term Capital Gains Tax
(LTCG).
Type of Schemes Particulars Short Term
capital gains
tax
Long term
capital gain tax
Equity oriented
Schemes
Holding
Period
Up to 12
months
More than 12
months
Tax rate 15 % 10%
Non-Equity
oriented Schemes
Holding
Period
Up to 36
months
More than 36
months
Tax rate Income tax
Slab rate of
investor
In long term capital gain, Rs. 1 lakh per annum is exempted from
the investment of equity mutual funds and above this figure only
came in the bracket of taxable income.
For example, if Mr. X long-term capital gain in FY 2019-20 is Rs
1.7 lakh, only Rs. 70,000 will be taxable as LTCG.
Mutual Funds Dividends Taxation for FY 2020-2021
Dividend is a part of the profit that a company earns and distributes
amongst its investors. Dividend Distribution Tax is a liability that
a company must pay to the government according to the dividend
paid to the company’s investors.
As of FY 2019-20, DDT is payable to the government not by the
investor but by the fund house managing the mutual fund. In most
schemes, DDT rate is around 30%. However, according to the
recent budget for FY 2020-21, Dividend is taxable at the hands of
the investor and not the fund house. Hence, as it stands DDT has
been abolished under the new tax regime.
Tax Benefit of Mutual Funds Equity-Linked Savings Scheme (ELSS) is a type of equity fund
and the only mutual fund scheme which qualifies for a tax
deduction of Rs. 1.5 lakh per annum under Section 80C of the
Income Tax Act. An ELSS comes with a lock-in period of 3 years
which means an investment made in it cannot be withdrawn before
3 years.
Securities Transaction Tax (STT) A Securities Transaction Tax (STT) is applicable at the rate of
0.001% on equity oriented mutual funds at the time of redemption
of units. An investor is not required to pay STT separately as it is
deducted from the mutual fund returns
List of Top tax Saving ( ELSS) Mutual Funds for FY 2020 [6]
Fund name 3 years return 5 years return
Mirae Asset Tax saver 19.82% -
Axis Long term Equity fund 19.21% 13.20%
Tata india Tax saving Fund 17.50 % 13.76%
Motilal Oswal Long term equity
funds
17.13%
Invesco India Tax plan 15.52% 11.98%
DSP tax saving Fund 15.25% 12.08%
Aditya Birla sun life tax relief 96 14.83% 11.54%
Kotak tax saver 14.57% 11.03%
Dividend Distribution Tax (DDT) in the hand of mutual fund
investors [7]
Investors Resident
/Individual/HUF
Domestic
Company NRI
Dividend
All Schemes Tax Free in the
hands of Investors
Tax on distributed
income ( payable by
the scheme) rates
Equity oriented
scheme
10%+12%
Surcharge+ 4%
Cess
10%+12%
Surcharge+
4% Cess
10%+12%
Surcharge+
4% Cess
11.648 % 11.648 % 11.648 %
Infrastructure debt
funds
25%+12%
Surcharge+4% Cess
30%+12%
Surcharge+4%
Cess
5%+12%
Surcharge+4
% Cess
29.12% 34.944% 5.824%

Research, Innovations and Technology Volume:01/Issue:01/June-2021 www.ritjournal.com
www.ritjournal.com [7] @ Research, Innovations and Technology
Other than equity
oriented scheme and
IDF
25%+12%
Surcharge+4% Cess
30%+12%
Surcharge+4%
Cess
25%+12%
Surcharge+4
% Cess
29.12% 34.944% 29.12%
(Source: taxrockon 2018-19/ FY 2018-19)
4.2 Analysis of Mutual Fund Investments in Nov 2019 and Nov
2020
Net AUMs as on November 30, 2020, increased for both, debt
funds and equity funds. The inflows for debt mutual funds nearly
halved in November 2020 from the previous month while outflows
from equity funds continue to rise. [8]
Scheme wise composition of Mutual Fund Assets
The proportionate share of equity-oriented schemes is now 41.1%
of the industry assets in February 2019, up from 40.8% in February
2018. The proportionate share of debt-oriented schemes is 29.1%
of industry assets in February 2019, down from 35.1% in February
2018.
Total Assets (Rs. Trillion)
Months- (COVID-19 effects) Total Assets (Rs. Trillion)
Nov’19 26.94
Dec’19 27.26
Jan’20 28.19
Feb’20 28.29
Mar’20 24.71
April’20 23.53
May’20 24.28
June.20 26.07
July’20 27.28
Aug’20 27.28
Sept’20 27.74
Oct’20 28.34
Nov’20 29.83
(Assets are measured as average assets for the month. Rs. Trillion
is equivalent to Rs. Lakh Cr )
Assets managed by the Indian mutual fund industry has increased
from Rs. 26.94 trillion in November 2019 to Rs. 29.83 trillion in
November 2020. That represents 10.73% increase in assets over
November 2019
Scheme wise Composition of Assets [9]
Months Debt oriented
scheme ( in %)
Equity oriented
scheme ( in %)
ETFs
& FoFs
( in %)
Liquid/
Money
market (
in %)
Nov’19 28.4 42.5 6 22.7
Dec’19 28.8 42.3 6 22.5
Jan’20 28.6 42.0 7 22.8
Feb’20 29.0 42.1 7 22.0
Mar’20 31.7 39.7 7 21.8
April’20 31.0 38.8 7 23.3
May’20 29.3 38.9 7 24.9
June.20 28.5 39.4 7 25.0
July’20 30.1 39.3 7 23.1
Aug’20 30.3 40.1 8 21.6
Sept’20 31.0 40.0 8 20.9
Oct’20 32.1 39.6 8 20.1
Nov’20 32.8 39.7 8 19.3
The proportionate share of equity-oriented schemes is now 39.7%
of the industry assets in November 2020, down from 42.5% in
November 2019. The proportionate share of debt-oriented schemes
is 32.8% of industry assets in November 2020, up from 28.4% in
November 2019.
Investor Type-wise Composition of Mutual Fund Assets
Individual investors now hold a lower share of industry assets, i.e.
51.5% in November 2020, compared with 53.7% in November
2019. Institutional investors account for 48.5% of the assets, of
which corporates are 94%. The rest are Indian and foreign
institutions and banks.
Months Individuals (in %) Institutions ( in %)
Nov’19 53.7 46.3
Dec’19 53.4 46.6
Jan’20 52.7 47.3
Feb’20 53.7 47.3
Mar’20 52,2 47.8
April’20 52.1 47.9
May’20 50.7 49.3
June.20 50/5 49.5
July’20 52.9 47.1
Aug’20 51,5 48.5
Sept’20 52.0 48.0
Oct’20 51.7 48.3
Nov’20 51.5 48.5
Institutions include domestic and foreign institutions and banks.
HNIs are investors who invest with a ticket size of Rs.2 lakhs or
above.
Investor Categories Across Scheme Types
Equity-oriented schemes derive 88% of their assets from
individual investors (Retail + HNI) Institutional investors
dominate liquid and money market schemes (84%), debt oriented
schemes (61%) and ETFs, FOFs (91%).
Institutions include domestic and foreign institutions and banks.
HNIs are investors who invest with a ticket size of Rs. 2 lakhs or
above. Equity-oriented schemes include equity and balanced
funds.
Research, Innovations and Technology Volume:01/Issue:01/June-2021 www.ritjournal.com
www.ritjournal.com [8] @ Research, Innovations and Technology
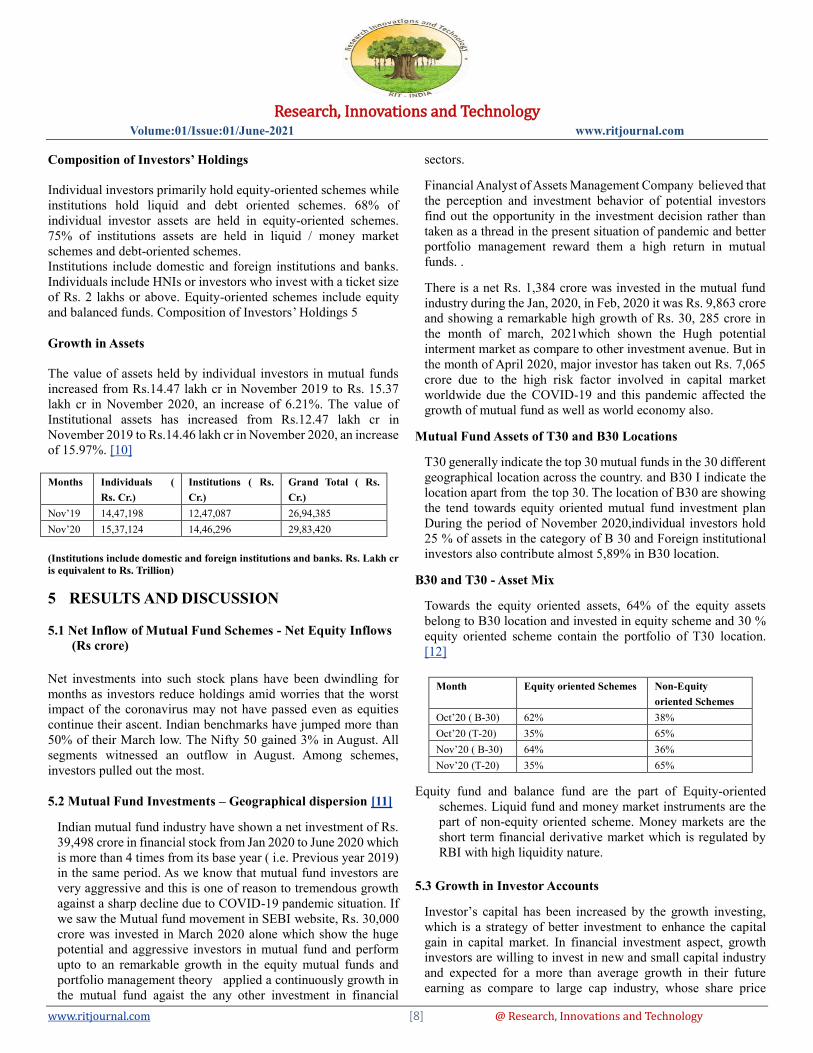
Composition of Investors’ Holdings
Individual investors primarily hold equity-oriented schemes while
institutions hold liquid and debt oriented schemes. 68% of
individual investor assets are held in equity-oriented schemes.
75% of institutions assets are held in liquid / money market
schemes and debt-oriented schemes.
Institutions include domestic and foreign institutions and banks.
Individuals include HNIs or investors who invest with a ticket size
of Rs. 2 lakhs or above. Equity-oriented schemes include equity
and balanced funds. Composition of Investors’ Holdings 5
Growth in Assets
The value of assets held by individual investors in mutual funds
increased from Rs.14.47 lakh cr in November 2019 to Rs. 15.37
lakh cr in November 2020, an increase of 6.21%. The value of
Institutional assets has increased from Rs.12.47 lakh cr in
November 2019 to Rs.14.46 lakh cr in November 2020, an increase
of 15.97%. [10]
Months Individuals (
Rs. Cr.)
Institutions ( Rs.
Cr.)
Grand Total ( Rs.
Cr.)
Nov’19 14,47,198 12,47,087 26,94,385
Nov’20 15,37,124 14,46,296 29,83,420
(Institutions include domestic and foreign institutions and banks. Rs. Lakh cr
is equivalent to Rs. Trillion)
5 RESULTS AND DISCUSSION
5.1 Net Inflow of Mutual Fund Schemes - Net Equity Inflows
(Rs crore)
Net investments into such stock plans have been dwindling for
months as investors reduce holdings amid worries that the worst
impact of the coronavirus may not have passed even as equities
continue their ascent. Indian benchmarks have jumped more than
50% of their March low. The Nifty 50 gained 3% in August. All
segments witnessed an outflow in August. Among schemes,
investors pulled out the most.
5.2 Mutual Fund Investments – Geographical dispersion [11]
Indian mutual fund industry have shown a net investment of Rs.
39,498 crore in financial stock from Jan 2020 to June 2020 which
is more than 4 times from its base year ( i.e. Previous year 2019)
in the same period. As we know that mutual fund investors are
very aggressive and this is one of reason to tremendous growth
against a sharp decline due to COVID-19 pandemic situation. If
we saw the Mutual fund movement in SEBI website, Rs. 30,000
crore was invested in March 2020 alone which show the huge
potential and aggressive investors in mutual fund and perform
upto to an remarkable growth in the equity mutual funds and
portfolio management theory applied a continuously growth in
the mutual fund agaist the any other investment in financial
sectors.
Financial Analyst of Assets Management Company believed that
the perception and investment behavior of potential investors
find out the opportunity in the investment decision rather than
taken as a thread in the present situation of pandemic and better
portfolio management reward them a high return in mutual
funds. .
There is a net Rs. 1,384 crore was invested in the mutual fund
industry during the Jan, 2020, in Feb, 2020 it was Rs. 9,863 crore
and showing a remarkable high growth of Rs. 30, 285 crore in
the month of march, 2021which shown the Hugh potential
interment market as compare to other investment avenue. But in
the month of April 2020, major investor has taken out Rs. 7,065
crore due to the high risk factor involved in capital market
worldwide due the COVID-19 and this pandemic affected the
growth of mutual fund as well as world economy also.
Mutual Fund Assets of T30 and B30 Locations
T30 generally indicate the top 30 mutual funds in the 30 different
geographical location across the country. and B30 I indicate the
location apart from the top 30. The location of B30 are showing
the tend towards equity oriented mutual fund investment plan
During the period of November 2020,individual investors hold
25 % of assets in the category of B 30 and Foreign institutional
investors also contribute almost 5,89% in B30 location.
B30 and T30 - Asset Mix
Towards the equity oriented assets, 64% of the equity assets
belong to B30 location and invested in equity scheme and 30 %
equity oriented scheme contain the portfolio of T30 location.
[12]
Month Equity oriented Schemes Non-Equity
oriented Schemes
Oct’20 ( B-30) 62% 38%
Oct’20 (T-20) 35% 65%
Nov’20 ( B-30) 64% 36%
Nov’20 (T-20) 35% 65%
Equity fund and balance fund are the part of Equity-oriented
schemes. Liquid fund and money market instruments are the
part of non-equity oriented scheme. Money markets are the
short term financial derivative market which is regulated by
RBI with high liquidity nature.
5.3 Growth in Investor Accounts
Investor’s capital has been increased by the growth investing,
which is a strategy of better investment to enhance the capital
gain in capital market. In financial investment aspect, growth
investors are willing to invest in new and small capital industry
and expected for a more than average growth in their future
earning as compare to large cap industry, whose share price
Research, Innovations and Technology Volume:01/Issue:01/June-2021 www.ritjournal.com
www.ritjournal.com [9] @ Research, Innovations and Technology
growth are at par with the market premium and systematic risk
beta is around one shown the market growth rate and industry
growth rate involved with the same proportionate.
According to the AMFI report, the net Assets under management
(AUM) shown the positive growth in both debt funds as well as
equity funds .there was a remarkable growth in the inflows of
cash in the debt mutual fund which is almost showing 50percent
growth on November 30, 2020 as compare to October 2020.
There was a continues growth in equity funds and outflow of
cash in the equity fund increases by a high volume in the capital
market
6 CONCLUSION
I. According to the credit rating agency CRISIL published
in dec’2020 states that there will be a growth of double
digit in mutual funds as the potential investors are looking
for a better return in the investment of mutual fund for
their capital gain and by the year 2026 , the assets under
management will show a landmark of more than Rs.
50,000 crore and this kind of growth shows the investors
believe in mutual funds and return in the mutual funds
perform a high return as compare to other investment
avenue. [13]
II. Mutual fund investment is always contain a risk factors
of market volatility , so that investors always looked for
safer side of investment but getting less return to mutual
funds. But at present time , the investors believe in mutual
funds interment and by better portfolio management the
are taking the risk factors in a systemic ways and getting
good return also and this enhance the assets under
management by a remarkable figure of Rs. 30 lakh core
on Nov, 2020.
III. The huge population of the country moving towards the
financial investment and looking for a better return.
Inflation is one of the major factor in economy which
insist us to do the investment to meet our future liabilities
and Up to a certain level of inflation is good for the
growth of economy and beyond that make a negative
impact in the economy and financial sector of the country.
GDP growth rate and increase in per in per capita income
of the income of the country is the primary factors for
outflow of cash in the capital market.
IV. In the capital market, better portfolio management with
diversify nature minimize the risk factor involves in the
open market investment and increase the chance of higher
return in long term investment plan in mutual fund.
Market risk factors, business risk and interest risk is
associated with the high return and in mutual fund
investment risk and return factor showing the perfect
positive correlation between them. In the international
funds also a lot of risk factors like currency convertibility,
hedging, arbitration and inflation associated with higher
return and with the help of fundamental analysis and
technical analysis, we are a better portfolio for a long term
investment. Currency exchange rate with high risk of
volatility is associated with foreign exchange market and
to get information about the performance of international
mutual fund are easy due to a lot of regulatory factors or
international project appraisal involved in the capital
investment and theses markets also affected by political
and economic change of these countries.
V. Indian mutual fund industry shown a fast growth over the
years .and mutual fund showing the fast growth year by
year and best performing mutual fund is keep on changing
year by year which is based on demand and supply
principle of the capital market. Various rating agency
likes CRISIL, ICRA, FITCH, Standards and Poor, CARE
etc. are actively participated in the capital market and
ranking the mutual funds scheme on the basis of basis of
their performance and NAV calculation. On the basis of
Qualitative and quantitative factors involved in the better
return, these agency give their judgment on the some
parameters like standard deviation, Net assets value, asset
size, sharp ratio, coefficient of determination etc. and
with the help of these factors we makes a better portfolio
for the better investment and our investment will show
the better return in the best perfuming mutual fund in
India.
REFERENCES
[1] https://www2.deloitte.com/in/en/pages/financial-services/articles/mutual-fund-
industry-in-india.html
[2] https://www.moneycontrol.com/news/business/mutual-funds/mutual-fund-assets-to-touch-rs-50-lakh-crore-by-2025-crisil-6240461.html
[3] https://www.outlookindia.com/website/story/opinion-why-are-stock-markets-
booming-when-economic-chips-are-down/358511 [4] https://www.bloombergquint.com/economy-finance/goldman-sachs-raises-
india-gdp-forecast-for-2020-21
[5] https://www.sebi.gov.in/statistics/mutual-fund/mf-investment-objectives.html [6] https://www.paisabazaar.com/mutual-funds/tax-benefit-of-mutual-fund/
[7] https://www.financialexpress.com/money/mutual-funds/mutual-fund-
investment-how-budget-2020-will-impact-mutual-fund-investors/1860756/ [8] https://www.mutualfundssahihai.com/en/what-dividend-distribution-tax
[9] https://www.amfiindia.com/Themes/Theme1/downloads/home/industry-
trends.pdf [10]
https://www.amfiindia.com/Themes/Theme1/downloads/home/B30vsT30.pdf
[11] https://www.newindianexpress.com/business/2020/jul/06/despite-covid-19-pandemic-mutual-funds-investments-rise-four-fold-2165977.html
[12] https://www.fincash.com/l/best-performing-mutual-funds
[13] https://groww.in/blog/best-international-mutual-funds-in-india/