Emergency Transfers of Fisheries Limited Entry Permits ... Report 14-5N... · Emergency Transfers...
98
Emergency Transfers of Alaska’s Commercial Fisheries Limited Entry Permits, 1975 ‐ 2013 CFEC Report 14‐5N August 2014 Prepared by Kurt Iverson, Yvonne Fink, and Marcus Gho State of Alaska Commercial Fisheries Entry Commission 8800 Glacier Highway, Suite 109 Juneau, Alaska 99801
Transcript of Emergency Transfers of Fisheries Limited Entry Permits ... Report 14-5N... · Emergency Transfers...
Emergency Transfers of Alaska’s Commercial Fisheries Limited Entry Permits, 1975 ‐ 2013 CFEC Report 14‐5N August 2014 Prepared by Kurt Iverson, Yvonne Fink, and Marcus Gho State of Alaska Commercial Fisheries Entry Commission 8800 Glacier Highway, Suite 109 Juneau, Alaska 99801

EO/ADA Compliance Statement The Commission is administratively attached to the Alaska Department of Fish and Game (ADF&G). The Alaska Department of Fish and Game (ADF&G) administers all programs and activities free from discrimination based on race, color, national origin, age, sex, religion, marital status, pregnancy, parenthood, or disability. The department administers all programs and activities in compliance with Title VI of the Civil Rights Act of 1964, Section 504 of the Rehabilitation Act of 1973, Title II of the Americans with Disabilities Act of 1990, the Age Discrimination Act of 1975, and Title IX of the Education Amendments of 1972. If you believe you have been discriminated against in any program, activity, or facility please write: ADF&G ADA Coordinator, P.O. Box 115526, Juneau, AK 99811‐5526. The department’s ADA Coordinator can be reached via phone at the following num‐bers: (VOICE) 907‐465‐6077, (Statewide Telecommunication Device for the Deaf) 1‐800‐478‐3648, (Juneau TDD) 907‐465‐3646, or (FAX) 907‐465‐6078. You may also contact the U.S. Fish and Wildlife Service, 4040 N. Fairfax Drive, Suite 300 Webb, Arling‐ton, VA 22203 Office of Equal Opportunity, U.S. Department of the Interior, Washington DC 20240. For information on alternative formats and questions on this publication, please contact the following: Commercial Fisheries Entry Commission (CFEC) Research Section 8800 Glacier Highway, Suite 109 P.O. Box 110302 Juneau, Alaska 99811‐0302 (907) 789‐6160 phone (907) 789‐6170 fax [email protected]

i Emergency Transfers of Alaska’s Commercial Fisheries Limited Entry Permits, 1975 ‐ 2013
Abstract Emergency Transfers of Alaska’s Commercial Fisheries Limited Entry Permits, 1975 ‐ 2013 CFEC Report 14‐05N August 2014 Prepared by Kurt Iverson, Research and Planning Project Leader Yvonne Fink, Licensing Project Leader Marcus Gho, Economist In 1973, the Alaska State Legislature passed a law authorizing a program to limit the number of permits in the state’s commercial fisheries. Permits are issued to individuals, and are renewed annually. Most per‐mits are fully transferable; within the parameters of state laws and regulations, permits can be sold, traded, given away, or inherited. The law also authorizes a means for the “emergency transfer” of permits, where‐by an individual can temporarily transfer their permit to another person if a medical condition or other temporary and unforeseen event prevents them from fishing. This report provides basic data and background information specific to emergency transfers of Alaska’s commercial fisheries limited entry permits. The annual number of emergency transfers is shown by individ‐ual fishery and for all fisheries combined. Data is provided on the residency (rural/urban, local/ nonlocal, and Alaska/non‐Alaska residents) and ages of persons who transfer and receive permits by emergency transfer. Summary information from a mandatory survey of the parties who emergency transfer permits is provided, showing the various reason(s) given for transfers, the relationships between the parties to emer‐gency transfers, and the financial terms associated with transfers. The report also provides details on emergency transfer regulations, and mentions some of the policy con‐siderations for implementing the regulations.
Acknowledgements The authors would like to thank CFEC employees Craig Farrington, Brandilynn Billings, Marissa Teske, Jennifer Wilson, Kristin Bomengen, and Frank Glass for their help in preparing this document.

ii Emergency Transfers of Alaska’s Commercial Fisheries Limited Entry Permits, 1975 ‐ 2013
Table of Contents
Introduction .................................................................................................................................................. 1
Basic Procedures for Granting an Emergency Transfer ................................................................................ 1
Regulation Changes ...................................................................................................................................... 3
Emergency Transfers of Non‐transferable and Interim‐use Permits ........................................................... 4
Other Emergency Transfers Specifically Authorized by Statute ................................................................... 5
Emergency Transfer‐Permanent Transfers (ET‐PT) ...................................................................................... 6
Emergency Transfers of Two Years or More ................................................................................................ 7
General Notes on the Data Presented in the Tables .................................................................................... 8
Number of Emergency Transfers ................................................................................................................ 10
Emergency Transfers of One or More Years .............................................................................................. 33
Emergency Transfers by Resident Type and/or Relationship ..................................................................... 48
Ages of Permit Holders in Emergency Transfers ........................................................................................ 73
Reasons for Emergency Transfers and Terms of Transfer .......................................................................... 85
Appendix A: Alaska’s Limited Entry Fisheries ............................................................................................ 91
Appendix B: CFEC Emergency Transfer Regulations .................................................................................. 93
List of Tables and Figures
Table 1. Administrative Hearings for Requests of Emergency Transfers of Limited Entry Permits, 2000‐2013 ..... 3
Table 2. Summary of Emergency Transfers of Limited Entry Permits for All Fisheries Combined, 1975‐2013...... 11
Table 3. Interim‐Use Permits (IUP) in Emergency Transfers .................................................................................. 12
Table 4. Summary of Emergency Transfers of Limited Entry Permits, by Permit Type, 1975‐2013....................... 14
Table 5. Consecutive Years of Emergency Transfers of Limited Entry Permits, by Permit Type, 1994‐2013 ......... 35
Table 6. Number of Emergency Transfers Between Resident Types, 1994 ‐ 2013 ................................................ 50
Table 7. Rates of Emergency Transfers by Resident Type: Total Permit Holdings Compared to Total Emergency Transfers From the Resident Type, 1994 ‐ 2013 ................................................................... 51
Table 8. Relationship of Emergency Transferors to Transfer Recipients, by Resident Type ................................. 52
Table 9. Relationship of Emergency Transferors to Transfer Recipients, by Permit Type .................................... 55
Table 10. Ages of Emergency Transferors (From) and Transfer Recipients (To) by Permit Type ............................ 74
Table 11. Emergency Transfer Survey: Reasons Given for Transfers, by Year, 1994 ‐ 2013 .................................. 89
Table 12. Emergency Transfer Survey: Terms of Remuneration to the Transferor, by Year, 1994 ‐ 2013 ............ 90
Table 13a. Total Number of Limited Entry Permits Issued by Permit Type and Resident Type: Alaska’s Limited Entry Fisheries ........................................................................................................................... 91
Figure 1. Average Age of Emergency Transferors and Transfer Recipients.............................................. 73
1 Emergency Transfers of Alaska’s Commercial Fisheries Limited Entry Permits, 1975 ‐ 2013
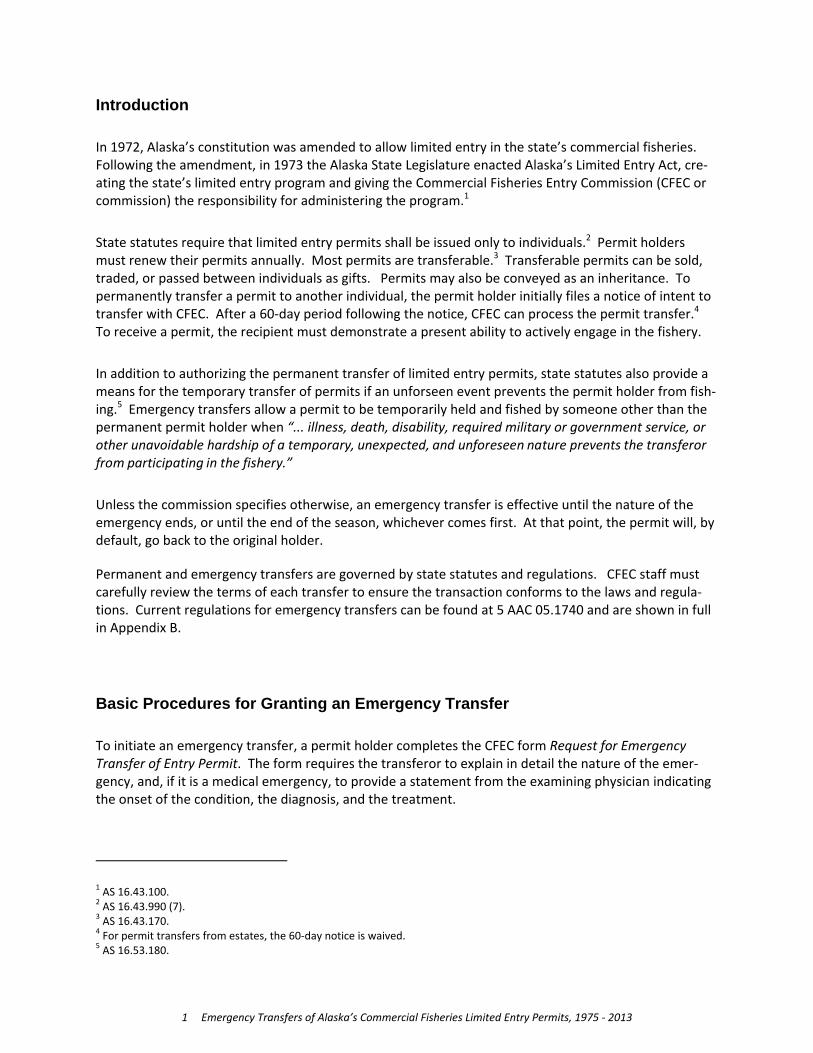
Introduction
In 1972, Alaska’s constitution was amended to allow limited entry in the state’s commercial fisheries. Following the amendment, in 1973 the Alaska State Legislature enacted Alaska’s Limited Entry Act, cre‐ating the state’s limited entry program and giving the Commercial Fisheries Entry Commission (CFEC or commission) the responsibility for administering the program.1
State statutes require that limited entry permits shall be issued only to individuals.2 Permit holders must renew their permits annually. Most permits are transferable.3 Transferable permits can be sold, traded, or passed between individuals as gifts. Permits may also be conveyed as an inheritance. To permanently transfer a permit to another individual, the permit holder initially files a notice of intent to transfer with CFEC. After a 60‐day period following the notice, CFEC can process the permit transfer.4 To receive a permit, the recipient must demonstrate a present ability to actively engage in the fishery.
In addition to authorizing the permanent transfer of limited entry permits, state statutes also provide a means for the temporary transfer of permits if an unforseen event prevents the permit holder from fish‐ing.5 Emergency transfers allow a permit to be temporarily held and fished by someone other than the permanent permit holder when “... illness, death, disability, required military or government service, or other unavoidable hardship of a temporary, unexpected, and unforeseen nature prevents the transferor from participating in the fishery.”
Unless the commission specifies otherwise, an emergency transfer is effective until the nature of the emergency ends, or until the end of the season, whichever comes first. At that point, the permit will, by default, go back to the original holder.
Permanent and emergency transfers are governed by state statutes and regulations. CFEC staff must carefully review the terms of each transfer to ensure the transaction conforms to the laws and regula‐tions. Current regulations for emergency transfers can be found at 5 AAC 05.1740 and are shown in full in Appendix B.
Basic Procedures for Granting an Emergency Transfer
To initiate an emergency transfer, a permit holder completes the CFEC form Request for Emergency Transfer of Entry Permit. The form requires the transferor to explain in detail the nature of the emer‐gency, and, if it is a medical emergency, to provide a statement from the examining physician indicating the onset of the condition, the diagnosis, and the treatment.
1 AS 16.43.100. 2 AS 16.43.990 (7). 3 AS 16.43.170. 4 For permit transfers from estates, the 60‐day notice is waived. 5 AS 16.53.180.

2 Emergency Transfers of Alaska’s Commercial Fisheries Limited Entry Permits, 1975 ‐ 2013
The parties to an emergency transfer are required to provide the terms of their agreement. They also indicate the status of their relationship. Each party completes his/her respective section; the form is signed by both parties and is notarized.
If the basis for an emergency transfer continues into the following year, CFEC may grant a second trans‐fer for the second year. After the second year, CFEC will not grant an emergency transfer unless the permit holder demonstrates an extraordinary circumstance that is allowable under the regulations.
There are no special provisions under the law authorizing CFEC to issue emergency transfers due to old age or for chronic medical problems. Nor are matters of choice, such as working another job, accepta‐ble under the regulations as reasons for granting an emergency transfer.
CFEC staff place a high priority on processing emergency transfers. For example, in 2012, 96% of the requested transfers were processed within four days of their receipt at CFEC. In the event of a sudden emergency during the fishing season, a transfer will often be completed immediately by CFEC staff. The recipient of the transferred permit can begin fishing as soon as practicable using a copy of the complet‐ed emergency transfer form signed by CFEC staff. The recipient’s embossed plastic CFEC “permit card” is mailed to them within two days.
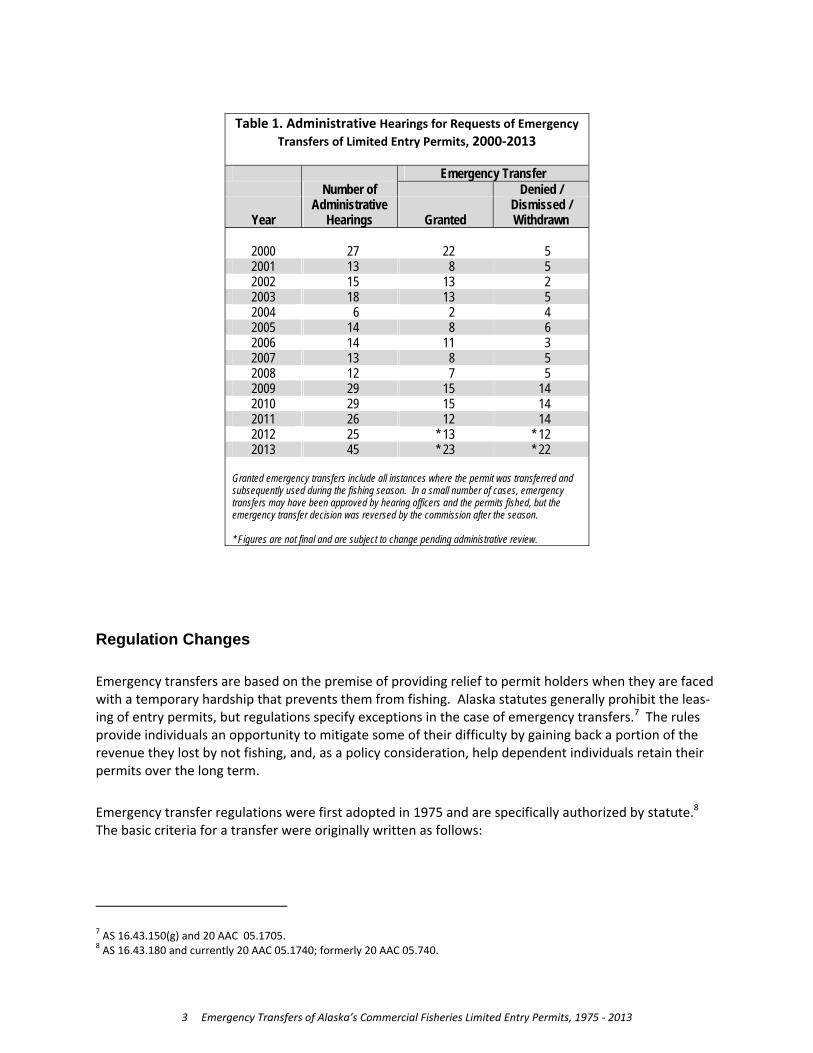
If an applicant’s request for an emergency transfer is denied by the CFEC Licensing staff, regulations al‐low the applicant to contest the denial by requesting an administrative hearing before a CFEC paralegal or hearing officer.6 As a quasi‐judicial agency, CFEC hearings are governed by administrative procedural rules, including rules of evidence. Decisions are issued based upon the record. As with all emergency transfers, hearings requested during the fishing season are given high priority, and are normally resolved within one to three days. Most hearings are conducted by telephone. Since 2000, CFEC paralegals and hearing officers have addressed an average of twenty emergency transfer appeals each year (Table 1).
Following a decision by a hearing officer or paralegal, applicants may appeal again if they so desire, this time by filing a petition for administrative review to the CFEC commissioners. Relatively few requests for emergency transfers are appealed to the commissioners. However, to ensure consistency with the governing statutes and regulations, all transfer cases that were brought to a paralegal or hearing officer are eventually reviewed by the commissioners. At their discretion, the commissioners may issue a con‐curring opinion or overturn the hearing officer’s ruling. In reaching their decision, the commission’s re‐view may also offer clarifications of law or regulations.
6 20 AAC 05.1760.
3 Emergency Transfers of Alaska’s Commercial Fisheries Limited Entry Permits, 1975 ‐ 2013
Table 1. Administrative Hearings for Requests of Emergency
Transfers of Limited Entry Permits, 2000‐2013
Emergency Transfer Number of Denied / Administrative Dismissed /
Year Hearings Granted Withdrawn
2000 27 22 5 2001 13 8 5 2002 15 13 2 2003 18 13 5 2004 6 2 4 2005 14 8 6 2006 14 11 3 2007 13 8 5 2008 12 7 5 2009 29 15 14 2010 29 15 14 2011 26 12 14 2012 25 * 13 * 12 2013 45 * 23 * 22
Granted emergency transfers include all instances where the permit was transferred and subsequently used during the fishing season. In a small number of cases, emergency transfers may have been approved by hearing officers and the permits fished, but the emergency transfer decision was reversed by the commission after the season. * Figures are not final and are subject to change pending administrative review.
Regulation Changes
Emergency transfers are based on the premise of providing relief to permit holders when they are faced with a temporary hardship that prevents them from fishing. Alaska statutes generally prohibit the leas‐ing of entry permits, but regulations specify exceptions in the case of emergency transfers.7 The rules provide individuals an opportunity to mitigate some of their difficulty by gaining back a portion of the revenue they lost by not fishing, and, as a policy consideration, help dependent individuals retain their permits over the long term.
Emergency transfer regulations were first adopted in 1975 and are specifically authorized by statute.8 The basic criteria for a transfer were originally written as follows:
7 AS 16.43.150(g) and 20 AAC 05.1705. 8 AS 16.43.180 and currently 20 AAC 05.1740; formerly 20 AAC 05.740.

4 Emergency Transfers of Alaska’s Commercial Fisheries Limited Entry Permits, 1975 ‐ 2013
The commission will grant an emergency transfer if the proposed transferee is presently able to participate actively in the fishery and if the transferor establishes that sickness, injury, or other unavoidable hardship prevents him from participating in the fishery.
Since then, the regulations have been amended several times. It appears that the most significant changes were made in the early 1980s. For example, in January 1980, the section was rewritten to spec‐ify the terms for the emergency transfer of interim‐use permits, and to provide additional examples of unavoidable hardship:
The commission will grant an emergency transfer of an entry or interim‐use permit if the proposed transferee is not a permit holder in the fishery and is presently able to partici‐pate actively in the fishery, and if it is established that illness, disability, death, required military or government service, or other unavoidable hardship prevents the transferor from participating in the fishery.
And in January 1983, a new section was added that put limits on granting emergency transfers repeat‐edly over subsequent years:
Except for extraordinary circumstances, requests for an emergency transfer in subse‐quent years will be considered only upon a showing of a new unavoidable hardship of an unexpected and unforeseen nature which prevents the permit holder from fishing.
Then later, in November 1994, a “subsequent years” provision was amended to allow an emergency transfer on the same basis for a second year. Apart from the changes noted above, other minor modifi‐cations have been made to the regulations, none of which have significantly altered the basic criteria for an emergency transfer.
Emergency Transfers of Non-transferable and Interim-use Permits
Some limited entry permits are non‐transferable. Under the statutes, when CFEC determines that lim‐ited entry is necessary in an open‐access fishery, the agency first establishes the maximum number of permits that will be issued. Following adoption of the maximum number, CFEC develops a point system that ranks individuals who apply for a permit. The point system rankings reflect the relative hardship an applicant would bear if excluded from the fishery. Within the hardship rankings, the agency is required to determine a minor economic hardship point level. Eligible applicants who accrue points at or below the minor economic hardship level are issued non‐transferable permits. Non‐transferable permits re‐main valid for the permit holder’s lifetime, but they cannot be passed to other individuals and the per‐mits are permanently forfeited when the permit holder dies. All limited entry permits – both transfera‐ble and non‐transferable – must be renewed each year, and can be revoked if the permit holder fails to renew the permit for two consecutive years. From 1975 through 2013, CFEC issued a total of 16,565 limited entry permits: 14,189 were transferable, and 2,376 were non‐transferable.

5 Emergency Transfers of Alaska’s Commercial Fisheries Limited Entry Permits, 1975 ‐ 2013
Emergency transfers of non‐transferable permits are permissible, but only under certain conditions con‐sistent with regulations.9 The transfer request must usually come during the fishing season, and will be granted only to allow the continued operation of a vessel or set gillnet site and fishing gear, or in the case of an underwater dive fishery, the transferor’s dive fishing operation.
Interim‐use permits (IUP) issued in limited entry fisheries are also authorized for emergency transfers. State statutes and regulations specify that if a fishery is undergoing a moratorium or limited entry pro‐gram, and an applicant’s status is not yet finalized, CFEC is authorized to grant an emergency transfer of the applicant’s interim‐use permit.10 The standard for granting an emergency transfer of an IUP is not as rigorous as that of transferring a standard permanent permit. Under the IUP circumstances, the statute calls for granting an emergency transfer “...to alleviate hardship.” Moreover, interim‐use permits may be transferred repeatedly from one year to the next. It is likely the legislature adopted this more re‐laxed standard due to concerns that the interim‐use permit holder cannot permanently transfer their permit until their permit claim has been made final by the commission.
The more lenient standard for granting emergency transfers for interim‐use permits has raised ques‐tions in the past. At present, however, the vast majority of permit applications have been adjudicated, and there are far fewer instances where these standards might apply.11
Moreover, the commission has attempted to contain interim‐use emergency transfers by providing the following restrictive definition of hardship in 20 AAC 05.1770(13):
“hardship,” with respect to the emergency transfer of interim‐use permits, means priva‐tion and suffering, and does not include the results of a permit holder’s own economic decisions, nor the results of economic, biological, or regulatory variables which are nor‐mally part of the risk of doing business as a fisherman.
There is a provision in the regulations that allows emergency transfers of interim‐use permits in open‐access fisheries. The transfers would occur only under special circumstances that allow a fishing opera‐tion to continue if obtaining another interim‐use permit is exceptionally time‐consuming or difficult.12 These circumstances have occurred very rarely and were more common in the past, when communica‐tion technology was less developed.
Other Emergency Transfers Specifically Authorized by Statute
AS 16.43.180 also authorizes the temporary emergency transfer of entry permits in the event of re‐quired military or government service, or if a permit becomes part of an estate due to the death of a
9 20 AAC 05.1740 (b). 10 AS 16.43.180 and 20 AAC 05.1740 (a). 11 As of August 1, 2014, twenty‐nine applications were pending a final determination, and the applicants might qualify for an emergency transfer of their interim‐use permit. Seven applications were before hearing officers, 21 were before the commis‐sioners, and 1 was under remand to the commission from the Alaska Superior Court. 12 20 AAC 05.1740 (b).

6 Emergency Transfers of Alaska’s Commercial Fisheries Limited Entry Permits, 1975 ‐ 2013
permit holder. Regulations allow permits in an estate to be emergency transferred beyond two years, pending the final disposition of the permit holder’s assets.13
The statues that apply to required military or government service were added by the Legislature in 1978, and the definitions for the services are provided in the regulations.14 Included in this service category are assignments required by law in federal, state, or local governments. This also includes some forms of voluntary service, provided the service is not the permit holder’s primary occupation. Most common‐ly, transfers in this category apply to permit holders who serve on the Alaska Board of Fisheries or in the Alaska Legislature, and who have to forgo fishing in order to serve the State. Military service by persons who serve in the National Guard or other military reserve forces would also be included.
Emergency Transfer-Permanent Transfers (ET-PT)
To initiate a permanent transfer of an entry permit, a permit holder must first file a Notice of Intent to Transfer form with CFEC. After the form is received, there is a 60‐day waiting period before the perma‐nent transfer can take place.
Occasionally, emergency (temporary) transfers arise out of situations where two parties have a permit sale agreement, but the required waiting period interferes with the recipient’s ability to participate in the fishery. Under these circumstances, CFEC will consider issuing an Emergency Transfer‐Permanent Transfer, or ET‐PT. The transaction is first processed as a temporary transfer, which allows the recipient to use the permit immediately. Then, at a point in time past the 60‐day waiting period, a second trans‐fer is administered to secure the transaction permanently. The permanent transfer typically occurs after the fishing season ends.
An ET‐PT is issued by CFEC with strict requirements. The parties to the sale must first submit all the re‐quired documents for the eventual sale of the permit. They must also provide a signed statement speci‐fying why the temporary transfer is necessary to avoid lost fishing time due to the 60‐day waiting peri‐od. The documents are carefully reviewed and validated by the licensing staff before granting and pro‐cessing the temporary transfer.
Since 1994, CFEC has issued 1,870 ET‐PTs. A small number of ET‐PTs (130, or 7% of the total ET‐PTs15) have failed to result in a permanent transfer between the two parties after the ET was issued. The ma‐jority of these were the result of unforeseen and often tragic circumstances to one of the parties of the transfer. For example, after an ET is issued the subsequent sale might fall through if the permanent permit holder dies and the permit enters probate. Divorces, accidents, and other personal circumstanc‐es might also prevent the intended sale. In some cases, CFEC has had reason to question whether the parties to the transaction might be attempting to use an ET‐PT to circumvent the medical or true emer‐gency requirements of a traditional emergency transfer. Under these circumstances, CFEC staff will re‐quire additional information before completing the transfer. It is not uncommon for CFEC to deny a re‐
13 20 AAC 05.1740 and 05.1750. 14 § 5 ch 123 SLA 1978 and 20 AAC 05.1770 (a) (11) and (12). 15 CFEC internal licensing statistics.
7 Emergency Transfers of Alaska’s Commercial Fisheries Limited Entry Permits, 1975 ‐ 2013
quest for an ET‐PT. As with all denials of permit transfers, the applicants have the right to appeal the denial to a hearing officer.
Emergency Transfers of Two Years or More
As mentioned, an emergency transfer is effective until the nature of the emergency ends, or until the end of the season (in practice, normally the end of the calendar year), whichever comes first. At that point, the permit will, by default, go back to the original holder.
The regulations do, however, authorize a second emergency transfer when the condition that prevented the permit holder from participating in the fishery persists, and prevents the permit holder from partici‐pating in the following year. 16 This portion of the regulations was passed in 1994, although prior to that time, commission policy had allowed repeated transfers under certain circumstances. Allowing two years helps the commission address situations where emergencies might last more than one year but the nature of the emergency does not prevent an individual from fishing at a point in time in the future. The conditions under which emergency transfers may be extended beyond two years are currently spec‐ified as follows:
(1) a new unavoidable hardship of an unexpected and unforeseen nature that prevents the permit holder from fishing; or
(2) a continuation of the basis for the first emergency transfer in addition to extraordi‐nary circumstances; for purposes of this paragraph, “extraordinary circumstances” are circumstances beyond the control of the permit holder that can be addressed by granting an emergency transfer, such as
(A) the failure of a good faith attempt to participate in the fishery;
(B) a realistic intent to return to the fishery within a reasonable period of time after the first emergency transfer based upon a high probability of removal of the disability or unavoidable hardship that gave rise to the first emergen‐cy transfer; or
(C) an intent to permanently transfer the permit that cannot presently be ful‐filled in spite of substantial, good faith efforts to do so; “extraordinary circum‐stances” do not include the effects of economic, biological, or regulatory varia‐bles that are normally part of the risk of doing business as a fisherman, such as an economic choice, retirement from the fishery, permanent illness or disability, or lack of a market for the sale of a permit.
16 20 AAC 05.1740 (i).

8 Emergency Transfers of Alaska’s Commercial Fisheries Limited Entry Permits, 1975 ‐ 2013
This subset of regulations emphasizes extraordinary circumstances and potential hardship faced by permit holders. Using this standard, the commission may review transfers on a case‐by‐case basis, and focus more highly on the nature and extent of a situation that might give rise to an emergency transfer. As a matter of policy, the commission must attempt to hit a balance between portions of the law that disallow the leasing of permits and avoiding the potential of creating of a class of “absentee landlords” of fishing permits, while at the same time adhering to other portions of the law that allow emergency transfers, with the goal of serving fishermen and fishing families who have legitimate intentions of re‐maining in the fishery but who are faced with a temporary hardship. Following the second grant of an emergency transfer, licensing staff warn the permit holder in writing that future emergency transfers are unlikely to be granted and will only be considered if the applicant can show a new or an extraordinary circumstance.
As previously noted, AS 16.43.180 authorizes continuing emergency transfers for interim‐use permits, or for permits that are part of an estate. Permits held by persons who are committed to certain govern‐ment services are also allowed emergency transfers that might go beyond two years.
Another class of permits that could be emergency transferred for more than two years are those associ‐ated with the Wassillie court settlement. Wassillie class members were allowed to apply for permanent entry permits in the salmon fisheries long after the qualification date due to misadvice or lack of ade‐quate assistance they received during the original application period. By the time the case was settled and individual claims had been adjudicated, many of the successful applicants were elderly and too dis‐abled to participate in the fishery. The commission allowed these applicants an extraordinary circum‐stances status to compensate for the years they were excluded from the fishery. This status also al‐lowed successful Wassillie applicants to emergency transfer their permits for more than two consecutive years.
General Notes on the Data Presented in the Tables
CFEC issues two general classes of commercial fishing permits: interim‐use permits and limited entry permits. Limited entry permits are issued in fisheries that have undergone limitation. Interim‐use per‐mits are issued primarily in open‐access fisheries, but they are also issued to individuals in limited fisher‐ies during the period when a person’s application for a limited permit is being processed, and also dur‐ing the period after the fishery has been limited, but before the application period begins. All CFEC permits are defined by regulation as a distinct combination of a finfish or shellfish species, a gear type, and an administrative area.
The first limited entry permits were issued in 1975 in 19 of the state’s salmon fisheries. Since then, more fisheries have been limited at different points in time. By the end of 2013, limited entry permits had been issued in 65 fisheries: 26 salmon fisheries; 19 herring fisheries; 9 crab fisheries; 5 sablefish fisheries; 3 shrimp fisheries; and 3 dive fisheries (geoduck, sea cucumber, and sea urchin).
In some limited fisheries, CFEC created more than one permit type to help constrain increases in fishing power. Some of the permit constraints restrict the amount of gear that can be used, while others limit
9 Emergency Transfers of Alaska’s Commercial Fisheries Limited Entry Permits, 1975 ‐ 2013
the length of the vessel. In other fisheries, non‐severable permits were issued which combine permissi‐ble gear types and/or harvestable species. To date, a total of 79 permit types have been issued in the 65 limited fisheries.17
Appendix A provides a table that lists the state’s limited entry fisheries, and shows statistics on the number of permanent permits initially issued. The table is excerpted from the CFEC report Changes in the Distribution of Alaska’s Limited Entry Permits, 1975‐2013.
Some sections of this report provide time‐series data for individual fisheries. In particular, for fisheries shown in Table 4, the first year in the time series corresponds to the year when limited entry was adopted and limited permits (either permanent or interim‐use) were first issued for the fishery. Normal‐ly, the bulk of limited entry permits are issued within the first two years after a fishery is limited; how‐ever, some permits might not be issued for several years if a person’s application is denied and the ap‐plicant contests their initial determination through the CFEC appeals process. Applicants who are await‐ing final adjudication of their permit claims can continue to fish using interim‐use permits during the intervening period. As a result, unless otherwise noted, figures referring to the ‘total number of per‐mits’ in a fishery represent the combined totals of interim‐use and permanent permits for each respec‐tive year. On occasion, a person might hold both an interim‐use permit and a permanent permit in a fishery in the same year. In these circumstances, the tables count only the permanent permit in the ‘to‐tal number of permits’ category.
Four distinct fisheries were subject to a moratorium on new participants prior to the date when CFEC implemented the fishery’s limited entry program. The fisheries and the respective moratorium years include the Southeast Alaska Dungeness crab pot fishery (1992‐1996) and the Southeast Alaska sea ur‐chin, sea cucumber, and geoduck dive fisheries (1996‐2000). Because statutes authorize emergency transfers of interim‐use permits in fisheries subject to a moratorium, the moratorium years are included in the tables for these respective permit types.
Not all limited entry fisheries are shown in the fishery‐specific Tables 5, 9, and 10. If no emergency transfers have occurred in a permit fishery, it will not appear in the tables.
Data for Table 8 (Relationship of Parties in the Transfer), Table 11 (Reasons for Transfer), and Table 12 (Terms of the Transfer) come primarily from the survey portion of the CFEC emergency transfer forms. In a small number of cases, the survey data is incomplete, which accounts for the differences in the to‐tals between these tables and the tables that summarize all emergency transfers.
Emergency transfer forms have changed over the years, including the survey questions that were added to the forms in 1994. Many of the statistics in this report are therefore restricted to the years from 1994 through 2013.
17 By the end of 2013, maximum number regulations had been adopted for 66 limited fisheries. No permanent entry permits have been issued for the Prince William Sound sablefish pot gear fishery; therefore, the permit type does not appear in this report. In addition, 2 fisheries were placed under a vessel limited entry program from 2004. Statutes that enabled one of the vessel‐permit programs were allowed to sunset by the Alaska Legislature in 2013. Traditional emergency transfers were not authorized in the vessel‐permit program.
10 Emergency Transfers of Alaska’s Commercial Fisheries Limited Entry Permits, 1975 ‐ 2013
Number of Emergency Transfers
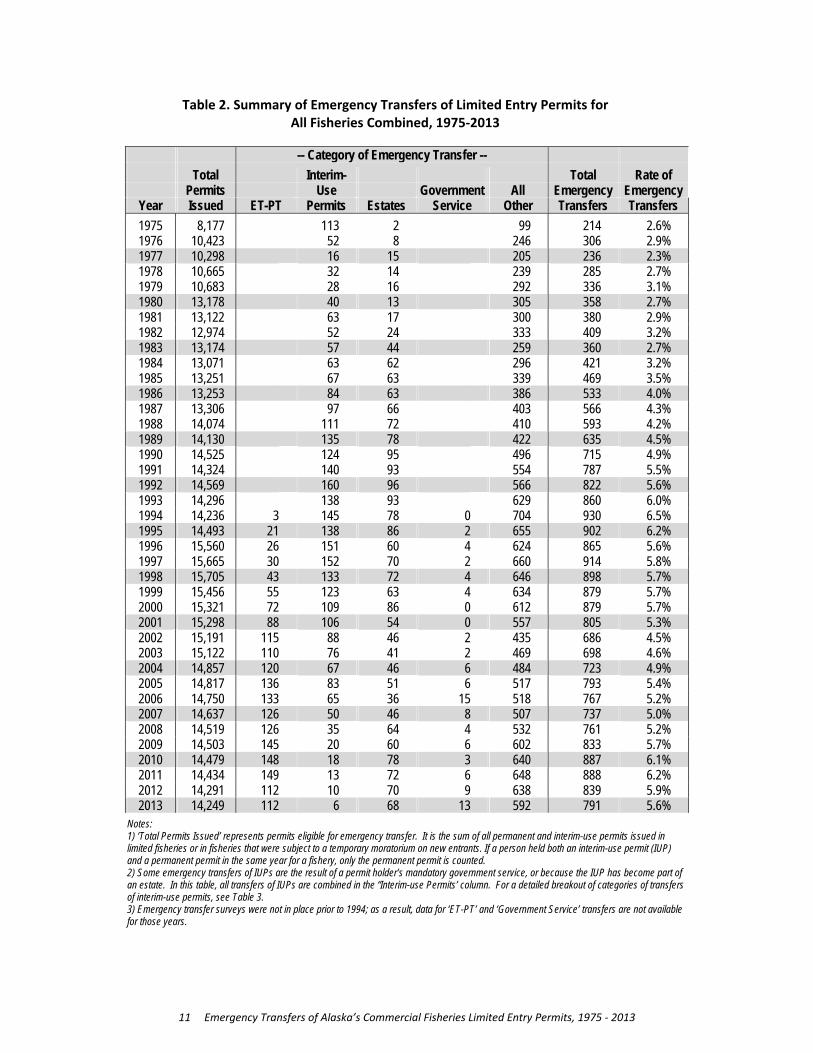
Table 2: Summary of Emergency Transfers of Alaska’s Limited Entry Permits, All Fisheries Combined Table 3: Interim‐Use Permits (IUP) in Emergency Transfers Table 4: Summary of Emergency Transfers by Permit Type, 1975‐2013 Table 2 provides a summary of the number of emergency transfers of limited entry permits for each year since 1975. The total number of permits eligible for an emergency transfer is provided in the se‐cond column. This figure includes the sum of all limited entry and interim‐use permits that were issued in limited fisheries, plus any interim‐use permits that may have been issued in fisheries that were tem‐porarily subject to a moratorium on new entrants. From the 1970s through 2004, as more fisheries came under limitation, the total number of issued permits increases.
Five categories of emergency transfers are shown for each year. The annual rate of emergency transfers is expressed as the total number of emergency transfers relative to the total number of eligible permits that were issued. The rates tended to rise steadily each year from 1975 to 1994, which was the year with the highest annual rate of emergency transfers, at 6.5% of all permits. After falling somewhat through the period of the late 1990s to 2002, rates again began to rise, and in 2011, the rates reached 6.2%. The long‐term rate of emergency transfers over the entire 1975‐2013 period was 5.6%.
Table 2 also helps illustrate how the number of emergency transfers steadily rose over time to peak in the years from 1993 through 2000. These years correspond to a period of high earnings in the salmon fisheries statewide. The bulk of emergency transfers occur in the salmon fisheries.
Note that the categories for ET‐PT and Government Service do not show any transfers until 1994 and 1995, respectively. This is an artifact of data collection: emergency transfer survey forms did not include a means to track the categories prior to 1994. Although there are no statistics for the categories before 1994, ET‐PT and Government Service emergency transfers were in fact granted as far back as the mid‐ 1980s.
Also note that Table 2 provides unique counts of emergency transfers of interim‐use permits and per‐mits associated with estates; however, the two categories are not completely exclusive from one anoth‐er. In many cases, the death of a permit holder who held an interim‐use permit in a limited fishery is good cause for an emergency transfer of his/her permit until the permit holder’s estate can be fully set‐tled. Table 3 helps illustrate the overlap of the two categories. Within the interim‐use permit category, a substantial number of transfers in each year are associated with estates, typically ranging from 25% to 35% of the total IUP transfers ‐ in some years, IUPs associated with estates approach nearly one‐half of the annual IUP emergency transfer total. For the sake of establishing either/or categories, Table 2 groups these blended IUP/Estate transfers into the interim‐use permit category.
Table 4 provides data similar to Table 2, but breaks out the information by individual fisheries. The first year in a permit fishery series corresponds to the year when interim‐use permits or permanent permits were first eligible for emergency transfer in the fishery.
11 Emergency Transfers of Alaska’s Commercial Fisheries Limited Entry Permits, 1975 ‐ 2013
Table 2. Summary of Emergency Transfers of Limited Entry Permits for All Fisheries Combined, 1975‐2013
-- Category of Emergency Transfer -- Total Interim- Total Rate of Permits Use Government All Emergency Emergency
Year Issued ET-PT Permits Estates Service Other Transfers Transfers 1975 8,177 113 2
99 214 2.6%
1976 10,423 52 8
246 306 2.9% 1977 10,298 16 15 205 236 2.3% 1978 10,665 32 14 239 285 2.7% 1979 10,683 28 16
292 336 3.1%
1980 13,178 40 13 305 358 2.7% 1981 13,122 63 17 300 380 2.9% 1982 12,974 52 24 333 409 3.2% 1983 13,174 57 44 259 360 2.7% 1984 13,071 63 62
296 421 3.2%
1985 13,251 67 63 339 469 3.5% 1986 13,253 84 63 386 533 4.0% 1987 13,306 97 66
403 566 4.3%
1988 14,074 111 72
410 593 4.2% 1989 14,130 135 78 422 635 4.5% 1990 14,525 124 95 496 715 4.9% 1991 14,324 140 93
554 787 5.5%
1992 14,569 160 96 566 822 5.6% 1993 14,296 138 93 629 860 6.0% 1994 14,236 3 145 78 0 704 930 6.5% 1995 14,493 21 138 86 2 655 902 6.2% 1996 15,560 26 151 60 4 624 865 5.6% 1997 15,665 30 152 70 2 660 914 5.8% 1998 15,705 43 133 72 4 646 898 5.7% 1999 15,456 55 123 63 4 634 879 5.7% 2000 15,321 72 109 86 0 612 879 5.7% 2001 15,298 88 106 54 0 557 805 5.3% 2002 15,191 115 88 46 2 435 686 4.5% 2003 15,122 110 76 41 2 469 698 4.6% 2004 14,857 120 67 46 6 484 723 4.9% 2005 14,817 136 83 51 6 517 793 5.4% 2006 14,750 133 65 36 15 518 767 5.2% 2007 14,637 126 50 46 8 507 737 5.0% 2008 14,519 126 35 64 4 532 761 5.2% 2009 14,503 145 20 60 6 602 833 5.7% 2010 14,479 148 18 78 3 640 887 6.1% 2011 14,434 149 13 72 6 648 888 6.2% 2012 14,291 112 10 70 9 638 839 5.9% 2013 14,249 112 6 68 13 592 791 5.6%
Notes: 1) ‘Total Permits Issued’ represents permits eligible for emergency transfer. It is the sum of all permanent and interim-use permits issued in limited fisheries or in fisheries that were subject to a temporary moratorium on new entrants. If a person held both an interim-use permit (IUP) and a permanent permit in the same year for a fishery, only the permanent permit is counted. 2) Some emergency transfers of IUPs are the result of a permit holder’s mandatory government service, or because the IUP has become part of an estate. In this table, all transfers of IUPs are combined in the “Interim-use Permits’ column. For a detailed breakout of categories of transfers of interim-use permits, see Table 3. 3) Emergency transfer surveys were not in place prior to 1994; as a result, data for ‘ET-PT’ and ‘Government Service’ transfers are not available for those years.

12 Emergency Transfers of Alaska’s Commercial Fisheries Limited Entry Permits, 1975 ‐ 2013
Table 3. Interim‐Use Permits (IUP) in Emergency Transfers
Interim-Use Permit Category
Year
Total IUP
Emergency Transfers
Gov’t Service Estate
All Other
1975 113 . 1 112 1976 52 . 2 50 1977 16 . 1 15 1978 32 . 1 31 1979 28 . 4 24 1980 40 . 6 34 1981 63 . 6 57 1982 52 . 7 45 1983 57 . 8 49 1984 63 . 13 50 1985 67 . 22 45 1986 84 . 22 62 1987 97 . 27 70 1988 111 . 38 73 1989 135 . 47 88 1990 124 . 43 81 1991 140 . 41 99 1992 160 . 45 115 1993 138 . 46 92 1994 145 . 48 97 1995 138 . 45 93 1996 151 1 45 105 1997 152 2 47 103 1998 133 1 41 91 1999 123 1 38 84 2000 109 1 33 75 2001 106 1 37 68 2002 88 1 34 53 2003 76 3 32 41 2004 67 2 31 34 2005 83 2 34 47 2006 65 2 25 38 2007 50 2 24 24 2008 35 1 12 22 2009 20 1 5 14 2010 18 1 4 13 2011 13 1 4 8 2012 10 1 3 6 2013 6 0 2 4
Data provided in Table 4 indicates that within salmon management areas, set gillnet permits tend to have somewhat higher rates of emer‐gency transfers than other permit types. One notable exception is the set gillnet fishery in Cook Inlet, where the permits have a moderate‐ly low all‐years emergency transfer rate of 2.8%.
Among salmon drift gillnet permits, the highest average emergency transfer rate is in the Bristol Bay fishery, at 8.5%. The highest rate for salm‐on purse seine permits is in the Chignik fishery, with an all‐years average transfer rate of 10.9%.
Among all fisheries, the highest rates of emer‐gency transfers are consistently found in the sablefish longline fisheries in Southeast Alaska, where rates have fluctuated from roughly 20% to 50% of the permits since 2000. For permits in both the Northern and Southern Southeast sablefish fisheries, a substantial number of the emergency transfers were associated with in‐terim‐use permits. Emergency transfers of IUPs are subject to a somewhat less rigorous stand‐ard for approval than permanent permits, as was explained in previous sections. The South‐east king crab fisheries show similar trends as the sablefish fisheries, with relatively high emergency transfer rates, again influenced by a significant number of interim‐use permits.
Table 4 illustrates how individual fisheries can influence statewide statistics on emergency transfers. The combined set and drift gillnet salmon fisheries in Bristol Bay typically repre‐sent from 35 to 40 percent of the annual emer‐gency transfers processed by CFEC. The drift gillnet fishery alone, which has the highest number of permit holders of all limited entry fisheries, frequently accounts for over 200 emergency transfers per year.
Table 4 also indicates that some permit types account for minimal or no emergency transfers over lengthy periods of time. These permits usually apply to fisheries that have been closed, either for conservation reasons or due to mar‐ket conditions. Notable examples include per‐mits for Cook Inlet Dungeness crab, Bristol Bay herring roe on kelp, and the herring fisheries in Prince William Sound and Cook Inlet. Other permits, such as those for the herring fisheries in Western Alaska ‐ Goodnews Bay, Nelson and Nunivak Islands, Cape Romanzof, and Norton

13 Emergency Transfers of Alaska’s Commercial Fisheries Limited Entry Permits, 1975 ‐ 2013
Sound – also show very low emergency transfer rates. Again, this is probably due to inconsistent partic‐ipation in the fisheries, which have been impacted in recent years by market conditions.
The moratorium years in the Southeast Alaska Dungeness crab pot fishery were from 1992 through 1996. Table 4 shows two classes of permits issued for the fishery in those years, depending upon the length of the participating vessel: under 50 feet, or 50 feet and over. When the moratorium ended and a limited entry program was implemented in 1997, the regulations created four classes of Dungeness crab permits, each one corresponding to a specific number of allowable pots. As a result, the tables in the fishery‐specific sections of this report show Southeast Alaska Dungeness crab permits separated into distinct types for moratorium and post‐moratorium years. The Southeast Alaska dive fisheries were also subject to moratoria from 1996 through 2000. However, unlike the Dungeness crab fishery, the permit types for the dive fisheries did not change between the moratorium years and the years following lim‐ited entry; the permit designations stayed the same, and the fishery‐specific tables reflect this.
There is a separate anomaly with permits for the Southeast Alaska pot shrimp fishery. For the first six years of limited entry from 1996 through 2001, two permit types were issued. By 2002, one of the per‐mit types had been phased out, leaving only the “Southeast shrimp, pot gear” (no vessel length speci‐fied) permit type.
Similar to Table 2, the figures in Table 4 for ‘Total Permits Issued‘ represent the sum of interim‐use per‐mits and permanent permits that were issued in fisheries that were subject to limited entry. “Total Permits Issued’ therefore represents the number of permits that were eligible for emergency transfer in each year. On occasion, a person will hold both an interim‐use permit and a permanent permit in a fishery in the same year. In these circumstances, the tables count only the permanent permit in the ‘To‐tal Permits Issued’ column.

Table 4. Summary of Emergency Transfers of Limited Entry Permits, by Permit Type, 1975‐2013
14 Emergency Transfers of Alaska’s Commercial Fisheries Limited Entry Permits, 1975 ‐ 2013
Table 4. Summary of Emergency Transfers of Limited Entry Permits, by Permit Type, 1975‐2013
Category of Emergency Transfer Total Permit Permits ET - Total ET Type Year Issued PT IUP Estate Gov’t Other ETs Rate
Salmon Power Troll
1975 1,044 6 1 7 14 1.3%
1976 976 10 0 22 32 3.3% 1977 968 3 1 17 21 2.2%
1978 976 3 1 11 15 1.5%
1979 978 2 0 19 21 2.1% 1980 974 2 1 18 21 2.2%
1981 970 3 1 10 14 1.4%
1982 968 4 2 20 26 2.7% 1983 968 6 0 16 22 2.3%
1984 963 2 0 10 12 1.2%
1985 963 1 1 8 10 1.0% 1986 957 2 4 13 19 2.0%
1987 957 1 2 10 13 1.4%
1988 956 1 5 15 21 2.2% 1989 955 1 6 5 12 1.3%
1990 956 2 2 13 17 1.8%
1991 958 2 3 21 26 2.7% 1992 957 1 3 18 22 2.3%
1993 956 2 5 26 33 3.5%
1994 954 0 1 4 0 20 25 2.6% 1995 954 0 1 5 0 21 27 2.8%
1996 965 0 0 2 0 13 15 1.6%
1997 967 1 0 1 0 19 21 2.2% 1998 967 1 0 0 0 23 24 2.5%
1999 965 3 0 2 0 24 29 3.0%
2000 963 6 0 3 0 17 26 2.7% 2001 965 8 0 4 0 16 28 2.9%
2002 965 3 0 2 0 21 26 2.7%
2003 965 8 0 1 0 16 25 2.6% 2004 961 12 0 1 0 15 28 2.9%
2005 961 9 0 2 1 20 32 3.3%
2006 961 5 0 1 0 19 25 2.6% 2007 961 5 0 2 0 21 28 2.9%
2008 961 3 0 1 0 21 25 2.6%
2009 961 3 0 2 1 16 22 2.3% 2010 962 5 0 5 0 19 29 3.0%
2011 962 16 0 8 1 29 54 5.6%
2012 961 4 0 5 0 25 34 3.5% 2013 961 2 0 4 1 25 32 3.3%
Salmon Hand Troll
1980 2,436 5 0 0 5 0.2%
1981 2,048 8 0 0 8 0.4% 1982 1,909 2 0 4 6 0.3%
1983 2,150 0 1 5 6 0.3%
1984 2,147 0 1 5 6 0.3% 1985 2,030 0 3 13 16 0.8%
1986 1,983 0 2 13 15 0.8%
1987 1,937 0 3 14 17 0.9% 1988 1,870 1 3 19 23 1.2%
1989 1,817 0 2 6 8 0.4%
1990 1,782 0 1 11 12 0.7% 1991 1,741 0 1 12 13 0.7%
1992 1,688 0 1 10 11 0.7%
1993 1,633 2 2 19 23 1.4% 1994 1,579 0 0 3 0 13 16 1.0%
1995 1,540 5 1 1 0 10 17 1.1%
1996 1,501 4 1 0 0 8 13 0.9% 1997 1,459 1 1 0 0 8 10 0.7%
1998 1,409 0 0 1 0 7 8 0.6%
1999 1,370 9 0 0 0 9 18 1.3%
2000 1,329 8 0 0 0 5 13 1.0%
2001 1,295 9 0 0 0 3 12 0.9%
Category of Emergency Transfer Total Permit Permits ET - Total ET Type Year Issued PT IUP Estate Gov’t Other ETs Rate
Salmon Hand Troll continued
2002 1,247 8 0 1 0 5 14 1.1% 2003 1,189 12 0 0 0 12 24 2.0%
2004 1,139 13 0 1 0 9 23 2.0%
2005 1,108 15 1 1 0 6 23 2.1% 2006 1,104 20 0 0 0 8 28 2.5%
2007 1,083 12 0 1 0 7 20 1.8%
2008 1,065 15 0 1 0 10 26 2.4% 2009 1,055 16 0 2 0 6 24 2.3%
2010 1,044 6 1 3 0 10 20 1.9%
2011 1,037 18 0 2 0 15 35 3.4% 2012 1,019 13 0 0 0 12 25 2.5%
2013 1,002 10 0 0 0 12 22 2.2%
Southeast Salmon Purse Seine
1975 444 3 0 4 7 1.6%
1976 416 0 0 6 6 1.4% 1977 414 0 0 8 8 1.9%
1978 420 0 1 8 9 2.1%
1979 418 0 1 1 2 0.5% 1980 417 1 0 4 5 1.2%
1981 418 0 1 13 14 3.3%
1982 421 1 1 12 14 3.3% 1983 421 2 2 5 9 2.1%
1984 422 2 3 7 12 2.8%
1985 420 2 3 9 14 3.3% 1986 420 2 3 8 13 3.1%
1987 420 2 2 9 13 3.1%
1988 420 3 1 15 19 4.5% 1989 420 2 2 20 24 5.7%
1990 420 2 1 10 13 3.1%
1991 420 2 3 15 20 4.8% 1992 420 2 3 13 18 4.3%
1993 419 2 1 26 29 6.9%
1994 418 0 1 1 0 24 26 6.2% 1995 418 1 1 2 0 19 23 5.5%
1996 417 0 1 2 0 19 22 5.3%
1997 416 0 1 1 0 18 20 4.8% 1998 416 2 1 2 0 26 31 7.5%
1999 416 0 1 1 0 18 20 4.8%
2000 416 0 1 1 0 24 26 6.3% 2001 415 3 1 2 0 23 29 7.0%
2002 415 6 1 1 0 6 14 3.4%
2003 416 2 1 2 0 6 11 2.6% 2004 414 0 0 2 2 6 10 2.4%
2005 415 4 0 4 0 11 19 4.6%
2006 414 0 0 1 0 11 12 2.9% 2007 415 3 0 1 0 7 11 2.7%
2008 380 0 0 1 0 15 16 4.2%
2009 379 2 0 1 0 17 20 5.3% 2010 379 2 0 2 0 13 17 4.5%
2011 379 3 0 1 0 22 26 6.9%
2012 315 2 0 0 0 24 26 8.3% 2013 315 2 0 0 0 21 23 7.3%
Southeast Salmon Drift Gillnet
1975 497 5 0 9 14 2.8%
1976 483 5 0 20 25 5.2% 1977 474 0 1 18 19 4.0%
1978 490 3 0 10 13 2.7%
1979 491 3 0
15 18 3.7%
1980 489 2 0 11 13 2.7%
1981 487 3 0
11 14 2.9%
1982 485 4 0
8 12 2.5%

Table 4. Summary of Emergency Transfers of Limited Entry Permits, by Permit Type, 1975‐2013
15 Emergency Transfers of Alaska’s Commercial Fisheries Limited Entry Permits, 1975 ‐ 2013
Category of Emergency Transfer Total Permit Permits ET - Total ET Type Year Issued PT IUP Estate Gov’t Other ETs Rate
Southeast Salmon Drift Gillnet continued 1983 480 2 0 3 5 1.0%
1984 481 2 0 8 10 2.1%
1985 485 3 3 8 14 2.9% 1986 488 3 1 14 18 3.7%
1987 486 4 2 7 13 2.7%
1988 485 5 0 10 15 3.1% 1989 485 5 2 8 15 3.1%
1990 486 4 4 9 17 3.5%
1991 485 6 4 10 20 4.1% 1992 485 10 1 14 25 5.2%
1993 482 10 0 16 26 5.4%
1994 482 0 7 1 0 25 33 6.8% 1995 483 1 7 2 0 12 22 4.6%
1996 483 0 10 3 0 17 30 6.2%
1997 482 1 7 2 0 17 27 5.6% 1998 479 0 4 2 0 20 26 5.4%
1999 481 2 6 2 0 25 35 7.3%
2000 480 2 5 3 0 22 32 6.7% 2001 482 2 9 1 0 22 34 7.1%
2002 482 4 6 1 0 14 25 5.2%
2003 477 2 2 1 0 11 16 3.4% 2004 478 1 3 2 0 11 17 3.6%
2005 478 5 3 2 1 13 24 5.0%
2006 477 5 3 1 0 11 20 4.2% 2007 476 2 3 0 1 18 24 5.0%
2008 475 5 2 0 0 19 26 5.5%
2009 474 3 1 1 0 17 22 4.6% 2010 474 1 1 5 0 20 27 5.7%
2011 474 2 1 1 0 32 36 7.6%
2012 474 0 1 1 0 32 34 7.2% 2013 473 1 0 2 2 18 23 4.9%
Southeast Roe Herring Purse Seine
1977 50 0 0 0 0 0.0%
1978 48 0 0 0 0 0.0% 1979 49 0 0 2 2 4.1%
1980 50 0 0 0 0 0.0%
1981 51 0 0 0 0 0.0% 1982 50 0 0 0 0 0.0%
1983 51 0 0 1 1 2.0%
1984 50 0 0 1 1 2.0% 1985 52 0 0 1 1 1.9%
1986 52 0 0 0 0 0.0%
1987 52 0 0 0 0 0.0% 1988 52 0 0 0 0 0.0%
1989 51 0 0 2 2 3.9%
1990 51 0 0 0 0 0.0% 1991 51 2 0 1 3 5.9%
1992 51 1 0 1 2 3.9%
1993 51 2 1 0 3 5.9% 1994 51 0 0 1 0 0 1 2.0%
1995 51 0 0 0 0 1 1 2.0%
1996 51 0 0 0 0 0 0 0.0% 1997 51 0 0 0 0 0 0 0.0%
1998 51 0 0 0 0 0 0 0.0%
1999 51 0 0 0 0 1 1 2.0% 2000 51 0 0 0 0 0 0 0.0%
2001 51 0 0 1 0 2 3 5.9%
2002 51 0 0 2 0 3 5 9.8% 2003 51 0 1 1 0 4 6 11.8%
2004 51 1 2 1 0 2 6 11.8%
2005 51 0 2 2 0 3 7 13.7% 2006 51 0 2 1 0 3 6 11.8%
2007 51 0 2 0 0 1 3 5.9%
2008 50 0 1 0 0 2 3 6.0%
Category of Emergency Transfer Total Permit Permits ET - Total ET Type Year Issued PT IUP Estate Gov’t Other ETs Rate
Southeast Roe Herring Purse Seine continued 2009 50 0 1 1 0 0 2 4.0%
2010 49 0 0 1 0 3 4 8.2%
2011 48 0 0 1 0 2 3 6.3% 2012 48 1 0 0 0 1 2 4.2%
2013 48 0 0 0 0 0 0 0.0%
Southeast Roe Herring Gillnet
1978 159 2 0 0 2 1.3%
1979 122 2 0 0 2 1.6% 1980 130 1 0 1 2 1.5%
1981 129 4 0 0 4 3.1%
1982 132 2 0 3 5 3.8% 1983 133 4 0 0 4 3.0%
1984 134 7 0 2 9 6.7%
1985 133 1 0 0 1 0.8% 1986 128 1 0 2 3 2.3%
1987 125 2 0 3 5 4.0%
1988 125 2 0 2 4 3.2% 1989 122 6 0 2 8 6.6%
1990 118 2 0 2 4 3.4%
1991 121 3 1 7 11 9.1% 1992 120 2 0 3 5 4.2%
1993 120 1 1 2 4 3.3%
1994 121 0 2 1 0 6 9 7.4% 1995 121 0 3 1 0 7 11 9.1%
1996 121 0 2 1 0 2 5 4.1%
1997 120 0 3 0 0 5 8 6.7% 1998 115 0 1 0 0 2 3 2.6%
1999 116 1 3 0 0 8 12 10.3%
2000 115 0 1 1 0 2 4 3.5% 2001 114 1 2 0 0 3 6 5.3%
2002 115 0 3 0 0 5 8 7.0%
2003 115 1 1 0 0 11 13 11.3% 2004 117 0 2 0 0 13 15 12.8%
2005 116 3 1 0 0 4 8 6.9%
2006 115 1 2 0 0 4 7 6.1% 2007 113 1 1 0 0 4 6 5.3%
2008 113 1 0 0 0 10 11 9.7%
2009 111 1 0 0 0 13 14 12.6% 2010 111 1 0 0 0 8 9 8.1%
2011 111 0 0 0 0 3 3 2.7%
2012 111 0 0 0 0 2 2 1.8% 2013 111 2 0 0 0 3 5 4.5%
Northern Southeast Herring Spawn-On-Kelp Pound
1995 140 0 0 0 0 0 0 0.0%
1996 15 0 0 0 0 0 0 0.0% 1997 135 0 6 0 0 0 6 4.4%
1998 132 0 6 0 0 0 6 4.5%
1999 112 1 3 0 0 8 12 10.7% 2000 113 0 2 2 0 6 10 8.8%
2001 112 0 0 0 0 9 9 8.0%
2002 111 0 1 0 0 6 7 6.3% 2003 111 2 0 0 0 8 10 9.0%
2004 110 0 1 0 0 4 5 4.5%
2005 110 2 4 0 0 6 12 10.9% 2006 109 0 1 0 0 10 11 10.1%
2007 109 2 1 0 0 12 15 13.8%
2008 109 4 0 0 0 8 12 11.0% 2009 109 4 0 0 0 3 7 6.4%
2010 109 1 0 0 0 5 6 5.5%
2011 112 1 0 0 0 10 11 9.8% 2012 111 0 0 0 0 5 5 4.5%
2013 111 0 0 0 0 0 0 0.0%
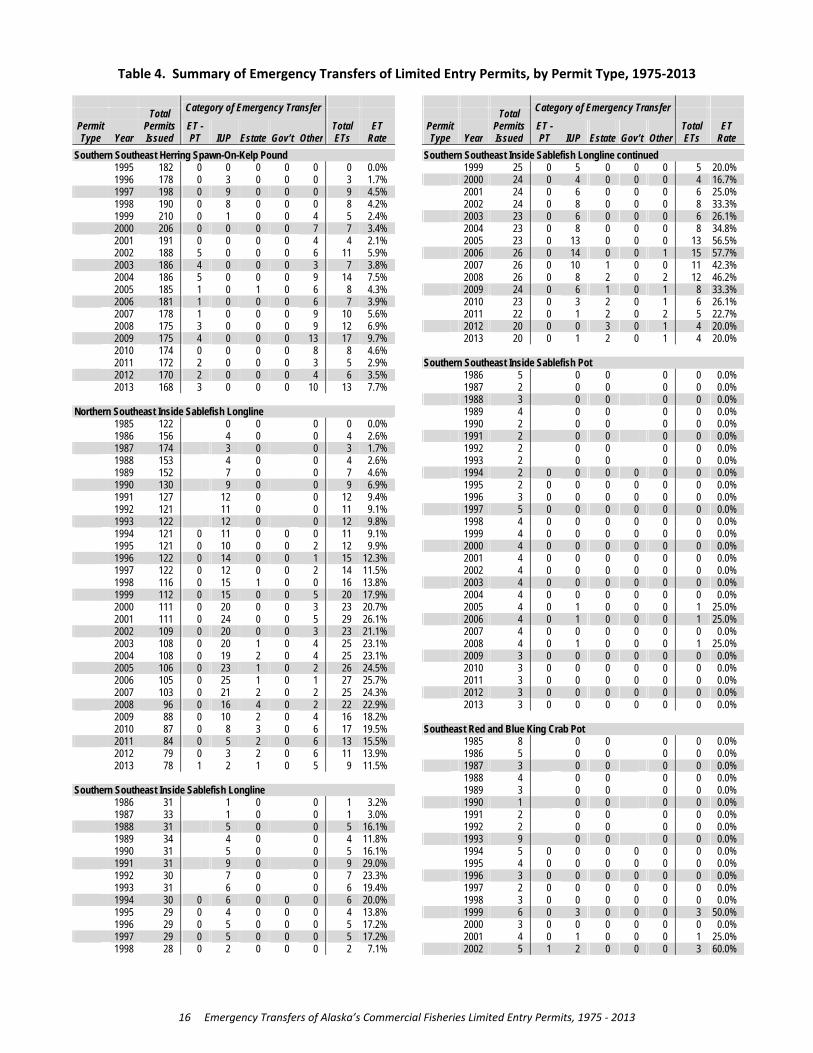
Table 4. Summary of Emergency Transfers of Limited Entry Permits, by Permit Type, 1975‐2013
16 Emergency Transfers of Alaska’s Commercial Fisheries Limited Entry Permits, 1975 ‐ 2013
Category of Emergency Transfer Total Permit Permits ET - Total ET Type Year Issued PT IUP Estate Gov’t Other ETs Rate
Southern Southeast Herring Spawn-On-Kelp Pound
1995 182 0 0 0 0 0 0 0.0%
1996 178 0 3 0 0 0 3 1.7% 1997 198 0 9 0 0 0 9 4.5%
1998 190 0 8 0 0 0 8 4.2%
1999 210 0 1 0 0 4 5 2.4% 2000 206 0 0 0 0 7 7 3.4%
2001 191 0 0 0 0 4 4 2.1%
2002 188 5 0 0 0 6 11 5.9% 2003 186 4 0 0 0 3 7 3.8%
2004 186 5 0 0 0 9 14 7.5%
2005 185 1 0 1 0 6 8 4.3% 2006 181 1 0 0 0 6 7 3.9%
2007 178 1 0 0 0 9 10 5.6%
2008 175 3 0 0 0 9 12 6.9% 2009 175 4 0 0 0 13 17 9.7%
2010 174 0 0 0 0 8 8 4.6%
2011 172 2 0 0 0 3 5 2.9% 2012 170 2 0 0 0 4 6 3.5%
2013 168 3 0 0 0 10 13 7.7%
Northern Southeast Inside Sablefish Longline
1985 122 0 0 0 0 0.0%
1986 156 4 0 0 4 2.6% 1987 174 3 0 0 3 1.7%
1988 153 4 0 0 4 2.6%
1989 152 7 0 0 7 4.6% 1990 130 9 0 0 9 6.9%
1991 127 12 0 0 12 9.4%
1992 121 11 0 0 11 9.1% 1993 122 12 0 0 12 9.8%
1994 121 0 11 0 0 0 11 9.1%
1995 121 0 10 0 0 2 12 9.9% 1996 122 0 14 0 0 1 15 12.3%
1997 122 0 12 0 0 2 14 11.5%
1998 116 0 15 1 0 0 16 13.8% 1999 112 0 15 0 0 5 20 17.9%
2000 111 0 20 0 0 3 23 20.7%
2001 111 0 24 0 0 5 29 26.1% 2002 109 0 20 0 0 3 23 21.1%
2003 108 0 20 1 0 4 25 23.1%
2004 108 0 19 2 0 4 25 23.1% 2005 106 0 23 1 0 2 26 24.5%
2006 105 0 25 1 0 1 27 25.7%
2007 103 0 21 2 0 2 25 24.3% 2008 96 0 16 4 0 2 22 22.9%
2009 88 0 10 2 0 4 16 18.2%
2010 87 0 8 3 0 6 17 19.5% 2011 84 0 5 2 0 6 13 15.5%
2012 79 0 3 2 0 6 11 13.9%
2013 78 1 2 1 0 5 9 11.5%
Southern Southeast Inside Sablefish Longline
1986 31 1 0 0 1 3.2%
1987 33 1 0 0 1 3.0% 1988 31 5 0 0 5 16.1%
1989 34 4 0 0 4 11.8%
1990 31 5 0 0 5 16.1% 1991 31 9 0 0 9 29.0%
1992 30 7 0 0 7 23.3%
1993 31 6 0 0 6 19.4% 1994 30 0 6 0 0 0 6 20.0%
1995 29 0 4 0 0 0 4 13.8%
1996 29 0 5 0 0 0 5 17.2% 1997 29 0 5 0 0 0 5 17.2%
1998 28 0 2 0 0 0 2 7.1%
Category of Emergency Transfer Total Permit Permits ET - Total ET Type Year Issued PT IUP Estate Gov’t Other ETs Rate
Southern Southeast Inside Sablefish Longline continued
1999 25 0 5 0 0 0 5 20.0% 2000 24 0 4 0 0 0 4 16.7%
2001 24 0 6 0 0 0 6 25.0%
2002 24 0 8 0 0 0 8 33.3% 2003 23 0 6 0 0 0 6 26.1%
2004 23 0 8 0 0 0 8 34.8%
2005 23 0 13 0 0 0 13 56.5% 2006 26 0 14 0 0 1 15 57.7%
2007 26 0 10 1 0 0 11 42.3%
2008 26 0 8 2 0 2 12 46.2% 2009 24 0 6 1 0 1 8 33.3%
2010 23 0 3 2 0 1 6 26.1%
2011 22 0 1 2 0 2 5 22.7% 2012 20 0 0 3 0 1 4 20.0%
2013 20 0 1 2 0 1 4 20.0%
Southern Southeast Inside Sablefish Pot
1986 5 0 0 0 0 0.0%
1987 2 0 0 0 0 0.0% 1988 3 0 0 0 0 0.0%
1989 4 0 0 0 0 0.0%
1990 2 0 0 0 0 0.0% 1991 2 0 0 0 0 0.0%
1992 2 0 0 0 0 0.0%
1993 2 0 0 0 0 0.0% 1994 2 0 0 0 0 0 0 0.0%
1995 2 0 0 0 0 0 0 0.0%
1996 3 0 0 0 0 0 0 0.0% 1997 5 0 0 0 0 0 0 0.0%
1998 4 0 0 0 0 0 0 0.0%
1999 4 0 0 0 0 0 0 0.0% 2000 4 0 0 0 0 0 0 0.0%
2001 4 0 0 0 0 0 0 0.0%
2002 4 0 0 0 0 0 0 0.0% 2003 4 0 0 0 0 0 0 0.0%
2004 4 0 0 0 0 0 0 0.0%
2005 4 0 1 0 0 0 1 25.0% 2006 4 0 1 0 0 0 1 25.0%
2007 4 0 0 0 0 0 0 0.0%
2008 4 0 1 0 0 0 1 25.0% 2009 3 0 0 0 0 0 0 0.0%
2010 3 0 0 0 0 0 0 0.0%
2011 3 0 0 0 0 0 0 0.0% 2012 3 0 0 0 0 0 0 0.0%
2013 3 0 0 0 0 0 0 0.0%
Southeast Red and Blue King Crab Pot
1985 8 0 0 0 0 0.0%
1986 5 0 0 0 0 0.0% 1987 3 0 0 0 0 0.0%
1988 4 0 0 0 0 0.0%
1989 3 0 0 0 0 0.0% 1990 1 0 0 0 0 0.0%
1991 2 0 0 0 0 0.0%
1992 2 0 0 0 0 0.0% 1993 9 0 0 0 0 0.0%
1994 5 0 0 0 0 0 0 0.0%
1995 4 0 0 0 0 0 0 0.0% 1996 3 0 0 0 0 0 0 0.0%
1997 2 0 0 0 0 0 0 0.0%
1998 3 0 0 0 0 0 0 0.0% 1999 6 0 3 0 0 0 3 50.0%
2000 3 0 0 0 0 0 0 0.0%
2001 4 0 1 0 0 0 1 25.0% 2002 5 1 2 0 0 0 3 60.0%

Table 4. Summary of Emergency Transfers of Limited Entry Permits, by Permit Type, 1975‐2013
17 Emergency Transfers of Alaska’s Commercial Fisheries Limited Entry Permits, 1975 ‐ 2013
Category of Emergency Transfer Total Permit Permits ET - Total ET Type Year Issued PT IUP Estate Gov’t Other ETs Rate
Southeast Red and Blue King Crab Pot continued
2003 6 0 0 0 0 0 0 0.0%
2004 4 0 0 0 0 0 0 0.0% 2005 4 0 2 0 0 0 2 50.0%
2006 3 0 0 0 0 0 0 0.0%
2007 3 0 0 0 0 0 0 0.0% 2008 5 0 0 0 0 0 0 0.0%
2009 6 0 0 0 0 0 0 0.0%
2010 6 0 0 0 0 0 0 0.0% 2011 6 0 0 0 0 0 0 0.0%
2012 6 0 0 0 0 0 0 0.0%
2013 6 0 0 0 0 0 0 0.0%
Southeast Red, Blue, and Brown King Crab Pot
1985 6 0 0 0 0 0.0%
1986 4 0 0 0 0 0.0% 1987 5 0 0 0 0 0.0%
1988 4 0 0 0 0 0.0%
1989 4 0 0 0 0 0.0% 1990 2 0 0 0 0 0.0%
1991 3 0 0 0 0 0.0%
1992 3 0 0 0 0 0.0% 1993 3 1 0 0 1 33.3%
1994 4 0 0 0 0 0 0 0.0%
1995 3 0 0 0 0 0 0 0.0% 1996 3 0 0 0 0 1 1 33.3%
1997 2 0 0 0 0 1 1 50.0%
1998 2 0 0 0 0 0 0 0.0% 1999 2 0 0 0 0 1 1 50.0%
2000 4 0 0 0 0 0 0 0.0%
2001 3 0 0 0 0 1 1 33.3% 2002 5 0 0 0 0 1 1 20.0%
2003 5 0 0 0 0 1 1 20.0%
2004 6 0 0 0 0 1 1 16.7% 2005 7 0 0 0 0 1 1 14.3%
2006 7 0 0 0 0 1 1 14.3%
2007 7 0 0 0 0 0 0 0.0% 2008 7 0 0 0 0 0 0 0.0%
2009 7 0 0 0 0 0 0 0.0%
2010 7 0 0 0 0 0 0 0.0% 2011 7 0 0 0 0 0 0 0.0%
2012 7 0 0 0 0 0 0 0.0%
2013 7 0 0 0 0 0 0 0.0%
Southeast Brown King Crab Pot
1986 4 0 0 0 0 0.0%
1987 5 0 0 0 0 0.0% 1988 5 0 0 0 0 0.0%
1989 5 0 0 0 0 0.0%
1990 4 0 0 0 0 0.0% 1991 3 0 0 0 0 0.0%
1992 4 0 0 0 0 0.0%
1993 4 0 0 0 0 0.0% 1994 4 0 0 0 0 0 0 0.0%
1995 4 0 0 0 0 0 0 0.0%
1996 4 0 0 0 0 0 0 0.0% 1997 3 0 0 0 0 0 0 0.0%
1998 3 0 0 0 0 0 0 0.0%
1999 3 0 0 0 0 0 0 0.0% 2000 4 0 0 0 0 0 0 0.0%
2001 5 0 0 0 0 0 0 0.0%
2002 5 0 0 0 0 1 1 20.0% 2003 5 0 0 0 0 1 1 20.0%
2004 6 0 0 0 0 0 0 0.0%
2005 6 0 0 0 0 1 1 16.7% 2006 7 0 0 0 0 0 0 0.0%
Category of Emergency Transfer Total Permit Permits ET - Total ET Type Year Issued PT IUP Estate Gov’t Other ETs Rate
Southeast Brown King Crab Pot continued
2007 7 0 0 0 0 0 0 0.0%
2008 8 0 0 0 0 0 0 0.0% 2009 9 0 0 0 0 0 0 0.0%
2010 8 0 0 0 0 0 0 0.0%
2011 9 0 0 0 0 1 1 11.1% 2012 9 0 0 0 0 1 1 11.1%
2013 9 0 0 0 0 0 0 0.0%
Southeast Red, Blue King/Tanner Crab Pot
1985 22 1 0 0 1 4.5%
1986 16 1 0 0 1 6.3% 1987 15 1 0 0 1 6.7%
1988 21 0 0 0 0 0.0%
1989 22 0 0 0 0 0.0% 1990 24 1 0 0 1 4.2%
1991 20 0 0 1 1 5.0%
1992 21 1 0 2 3 14.3% 1993 28 1 0 1 2 7.1%
1994 29 0 3 0 0 2 5 17.2%
1995 28 0 1 0 0 0 1 3.6% 1996 28 0 2 0 0 0 2 7.1%
1997 28 0 3 0 0 0 3 10.7%
1998 28 0 2 0 0 0 2 7.1% 1999 27 0 2 0 0 0 2 7.4%
2000 28 0 3 0 0 0 3 10.7%
2001 27 0 5 0 0 2 7 25.9% 2002 26 0 3 0 0 2 5 19.2%
2003 24 0 3 0 0 2 5 20.8%
2004 22 0 3 1 0 0 4 18.2% 2005 22 0 1 0 0 0 1 4.5%
2006 21 0 3 0 0 0 3 14.3%
2007 21 0 3 0 0 0 3 14.3% 2008 18 0 0 0 0 0 0 0.0%
2009 16 0 0 0 0 0 0 0.0%
2010 16 0 0 0 0 0 0 0.0% 2011 17 1 1 0 0 0 2 11.8%
2012 16 0 2 0 0 0 2 12.5%
2013 15 1 1 0 0 0 2 13.3%
Southeast Brown King/Tanner Crab Pot
1985 8 0 0 0 0 0.0%
1986 6 0 0 0 0 0.0% 1987 11 0 0 0 0 0.0%
1988 13 0 0 0 0 0.0%
1989 11 0 0 0 0 0.0% 1990 8 0 0 0 0 0.0%
1991 8 1 0 0 1 12.5%
1992 8 0 0 0 0 0.0% 1993 3 1 0 0 1 33.3%
1994 3 0 1 0 0 0 1 33.3%
1995 3 0 1 0 0 0 1 33.3% 1996 3 0 1 0 0 0 1 33.3%
1997 3 0 2 0 0 0 2 66.7%
1998 4 0 2 0 0 0 2 50.0% 1999 4 0 2 0 0 0 2 50.0%
2000 4 0 2 0 0 0 2 50.0%
2001 4 0 1 0 0 0 1 25.0% 2002 3 0 0 0 0 1 1 33.3%
2003 5 0 0 0 0 0 0 0.0%
2004 4 0 0 0 0 0 0 0.0% 2005 4 0 0 0 0 0 0 0.0%
2006 6 0 0 0 0 1 1 16.7%
2007 5 0 0 0 0 0 0 0.0% 2008 5 0 0 0 0 0 0 0.0%
2009 5 0 0 1 0 0 1 20.0%
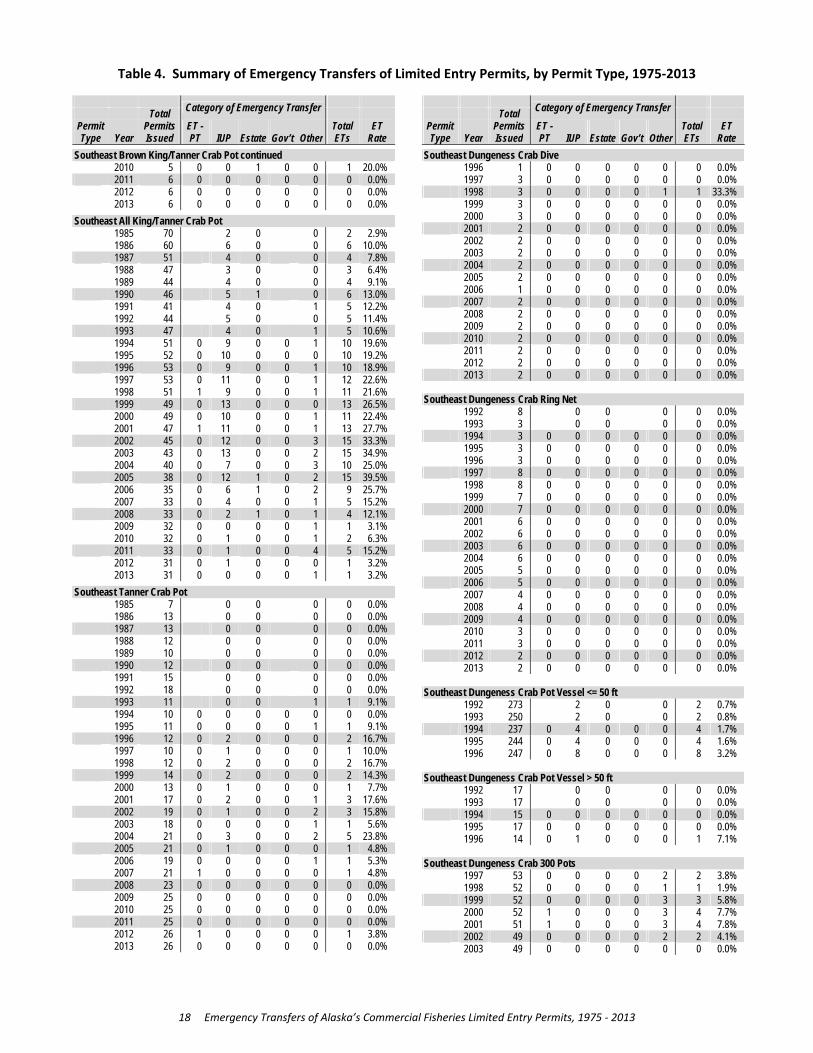
Table 4. Summary of Emergency Transfers of Limited Entry Permits, by Permit Type, 1975‐2013
18 Emergency Transfers of Alaska’s Commercial Fisheries Limited Entry Permits, 1975 ‐ 2013
Category of Emergency Transfer Total Permit Permits ET - Total ET Type Year Issued PT IUP Estate Gov’t Other ETs Rate
Southeast Brown King/Tanner Crab Pot continued
2010 5 0 0 1 0 0 1 20.0% 2011 6 0 0 0 0 0 0 0.0%
2012 6 0 0 0 0 0 0 0.0%
2013 6 0 0 0 0 0 0 0.0% Southeast All King/Tanner Crab Pot
1985 70 2 0 0 2 2.9%
1986 60 6 0 0 6 10.0% 1987 51 4 0 0 4 7.8%
1988 47 3 0 0 3 6.4%
1989 44 4 0 0 4 9.1% 1990 46 5 1 0 6 13.0%
1991 41 4 0 1 5 12.2%
1992 44 5 0 0 5 11.4% 1993 47 4 0 1 5 10.6%
1994 51 0 9 0 0 1 10 19.6%
1995 52 0 10 0 0 0 10 19.2% 1996 53 0 9 0 0 1 10 18.9%
1997 53 0 11 0 0 1 12 22.6%
1998 51 1 9 0 0 1 11 21.6% 1999 49 0 13 0 0 0 13 26.5%
2000 49 0 10 0 0 1 11 22.4%
2001 47 1 11 0 0 1 13 27.7% 2002 45 0 12 0 0 3 15 33.3%
2003 43 0 13 0 0 2 15 34.9%
2004 40 0 7 0 0 3 10 25.0% 2005 38 0 12 1 0 2 15 39.5%
2006 35 0 6 1 0 2 9 25.7%
2007 33 0 4 0 0 1 5 15.2% 2008 33 0 2 1 0 1 4 12.1%
2009 32 0 0 0 0 1 1 3.1%
2010 32 0 1 0 0 1 2 6.3% 2011 33 0 1 0 0 4 5 15.2%
2012 31 0 1 0 0 0 1 3.2%
2013 31 0 0 0 0 1 1 3.2% Southeast Tanner Crab Pot
1985 7 0 0 0 0 0.0%
1986 13 0 0 0 0 0.0% 1987 13 0 0 0 0 0.0%
1988 12 0 0 0 0 0.0%
1989 10 0 0 0 0 0.0% 1990 12 0 0 0 0 0.0%
1991 15 0 0 0 0 0.0%
1992 18 0 0 0 0 0.0% 1993 11 0 0 1 1 9.1%
1994 10 0 0 0 0 0 0 0.0%
1995 11 0 0 0 0 1 1 9.1% 1996 12 0 2 0 0 0 2 16.7%
1997 10 0 1 0 0 0 1 10.0%
1998 12 0 2 0 0 0 2 16.7% 1999 14 0 2 0 0 0 2 14.3%
2000 13 0 1 0 0 0 1 7.7%
2001 17 0 2 0 0 1 3 17.6% 2002 19 0 1 0 0 2 3 15.8%
2003 18 0 0 0 0 1 1 5.6%
2004 21 0 3 0 0 2 5 23.8% 2005 21 0 1 0 0 0 1 4.8%
2006 19 0 0 0 0 1 1 5.3%
2007 21 1 0 0 0 0 1 4.8% 2008 23 0 0 0 0 0 0 0.0%
2009 25 0 0 0 0 0 0 0.0%
2010 25 0 0 0 0 0 0 0.0% 2011 25 0 0 0 0 0 0 0.0%
2012 26 1 0 0 0 0 1 3.8%
2013 26 0 0 0 0 0 0 0.0%
Category of Emergency Transfer Total Permit Permits ET - Total ET Type Year Issued PT IUP Estate Gov’t Other ETs Rate
Southeast Dungeness Crab Dive
1996 1 0 0 0 0 0 0 0.0%
1997 3 0 0 0 0 0 0 0.0% 1998 3 0 0 0 0 1 1 33.3%
1999 3 0 0 0 0 0 0 0.0%
2000 3 0 0 0 0 0 0 0.0% 2001 2 0 0 0 0 0 0 0.0%
2002 2 0 0 0 0 0 0 0.0%
2003 2 0 0 0 0 0 0 0.0% 2004 2 0 0 0 0 0 0 0.0%
2005 2 0 0 0 0 0 0 0.0%
2006 1 0 0 0 0 0 0 0.0% 2007 2 0 0 0 0 0 0 0.0%
2008 2 0 0 0 0 0 0 0.0%
2009 2 0 0 0 0 0 0 0.0% 2010 2 0 0 0 0 0 0 0.0%
2011 2 0 0 0 0 0 0 0.0%
2012 2 0 0 0 0 0 0 0.0% 2013 2 0 0 0 0 0 0 0.0%
Southeast Dungeness Crab Ring Net
1992 8 0 0 0 0 0.0%
1993 3 0 0 0 0 0.0% 1994 3 0 0 0 0 0 0 0.0%
1995 3 0 0 0 0 0 0 0.0%
1996 3 0 0 0 0 0 0 0.0% 1997 8 0 0 0 0 0 0 0.0%
1998 8 0 0 0 0 0 0 0.0%
1999 7 0 0 0 0 0 0 0.0% 2000 7 0 0 0 0 0 0 0.0%
2001 6 0 0 0 0 0 0 0.0%
2002 6 0 0 0 0 0 0 0.0% 2003 6 0 0 0 0 0 0 0.0%
2004 6 0 0 0 0 0 0 0.0%
2005 5 0 0 0 0 0 0 0.0% 2006 5 0 0 0 0 0 0 0.0%
2007 4 0 0 0 0 0 0 0.0%
2008 4 0 0 0 0 0 0 0.0% 2009 4 0 0 0 0 0 0 0.0%
2010 3 0 0 0 0 0 0 0.0%
2011 3 0 0 0 0 0 0 0.0% 2012 2 0 0 0 0 0 0 0.0%
2013 2 0 0 0 0 0 0 0.0%
Southeast Dungeness Crab Pot Vessel <= 50 ft
1992 273 2 0 0 2 0.7%
1993 250 2 0 0 2 0.8% 1994 237 0 4 0 0 0 4 1.7%
1995 244 0 4 0 0 0 4 1.6%
1996 247 0 8 0 0 0 8 3.2%
Southeast Dungeness Crab Pot Vessel > 50 ft
1992 17 0 0 0 0 0.0%
1993 17 0 0 0 0 0.0% 1994 15 0 0 0 0 0 0 0.0%
1995 17 0 0 0 0 0 0 0.0%
1996 14 0 1 0 0 0 1 7.1%
Southeast Dungeness Crab 300 Pots
1997 53 0 0 0 0 2 2 3.8%
1998 52 0 0 0 0 1 1 1.9% 1999 52 0 0 0 0 3 3 5.8%
2000 52 1 0 0 0 3 4 7.7%
2001 51 1 0 0 0 3 4 7.8% 2002 49 0 0 0 0 2 2 4.1%
2003 49 0 0 0 0 0 0 0.0%

Table 4. Summary of Emergency Transfers of Limited Entry Permits, by Permit Type, 1975‐2013
19 Emergency Transfers of Alaska’s Commercial Fisheries Limited Entry Permits, 1975 ‐ 2013
Category of Emergency Transfer Total Permit Permits ET - Total ET Type Year Issued PT IUP Estate Gov’t Other ETs Rate
Southeast Dungeness Crab 300 Pots continued
2004 49 0 0 0 0 0 0 0.0% 2005 49 0 0 0 0 0 0 0.0%
2006 49 2 0 0 0 0 2 4.1%
2007 49 1 0 0 0 0 1 2.0% 2008 49 0 0 0 0 0 0 0.0%
2009 49 0 0 0 0 0 0 0.0%
2010 49 0 0 0 0 0 0 0.0% 2011 49 1 0 0 0 1 2 4.1%
2012 49 0 0 0 0 0 0 0.0%
2013 49 1 0 0 0 0 1 2.0% Southeast Dungeness Crab 225 Pots
1997 48 0 0 0 0 1 1 2.1%
1998 48 0 1 0 0 3 4 8.3% 1999 48 0 1 1 0 2 4 8.3%
2000 47 1 0 1 0 2 4 8.5%
2001 46 1 0 0 0 4 5 10.9% 2002 44 2 0 0 0 1 3 6.8%
2003 44 2 0 0 0 1 3 6.8%
2004 44 0 0 0 0 1 1 2.3% 2005 44 0 0 0 0 0 0 0.0%
2006 44 0 0 0 0 1 1 2.3%
2007 44 1 0 0 1 3 5 11.4% 2008 44 0 0 0 1 1 2 4.5%
2009 44 1 0 0 0 1 2 4.5%
2010 43 1 0 0 0 0 1 2.3% 2011 43 0 0 0 0 0 0 0.0%
2012 43 0 0 0 0 2 2 4.7%
2013 42 1 0 0 0 0 1 2.4% Southeast Dungeness Crab 150 Pots
1997 88 1 0 0 1 5 7 8.0%
1998 89 1 0 0 0 2 3 3.4% 1999 88 0 2 0 0 1 3 3.4%
2000 87 0 1 1 0 1 3 3.4%
2001 88 1 0 1 0 1 3 3.4% 2002 86 2 0 1 0 3 6 7.0%
2003 85 1 0 0 0 3 4 4.7%
2004 84 1 0 0 0 2 3 3.6% 2005 85 0 0 0 0 3 3 3.5%
2006 84 0 0 0 0 3 3 3.6%
2007 82 0 0 0 0 3 3 3.7% 2008 82 0 0 0 0 5 5 6.1%
2009 82 0 0 0 0 5 5 6.1%
2010 84 0 0 0 0 4 4 4.8% 2011 83 1 0 0 0 2 3 3.6%
2012 83 2 0 0 0 4 6 7.2%
2013 83 2 0 0 0 1 3 3.6% Southeast Dungeness Crab 75 Pots
1997 125 0 4 0 0 3 7 5.6%
1998 127 2 5 0 0 5 12 9.4% 1999 121 0 1 0 0 2 3 2.5%
2000 117 0 0 0 0 2 2 1.7%
2001 114 2 0 0 0 1 3 2.6% 2002 111 1 0 0 0 2 3 2.7%
2003 108 0 0 0 0 2 2 1.9%
2004 105 2 0 0 0 3 5 4.8% 2005 103 0 0 0 0 1 1 1.0%
2006 103 0 0 0 1 0 1 1.0%
2007 101 1 0 0 0 2 3 3.0% 2008 101 0 0 0 0 3 3 3.0%
2009 101 1 0 1 0 2 4 4.0%
2010 112 1 0 0 0 2 3 2.7% 2011 111 1 0 0 0 0 1 0.9%
2012 104 0 0 1 0 1 2 1.9%
2013 103 2 0 0 0 1 3 2.9%
Category of Emergency Transfer Total Permit Permits ET - Total ET Type Year Issued PT IUP Estate Gov’t Other ETs Rate
Southeast Shrimp Beam Trawl
1998 48 0 1 0 0 0 1 2.1%
1999 37 0 0 0 0 0 0 0.0% 2000 37 0 0 0 0 0 0 0.0%
2001 35 0 1 0 0 0 1 2.9%
2002 35 0 0 0 0 1 1 2.9% 2003 30 0 0 0 0 0 0 0.0%
2004 28 0 0 0 0 0 0 0.0%
2005 27 0 0 0 0 0 0 0.0% 2006 26 0 0 0 0 0 0 0.0%
2007 26 0 0 0 0 0 0 0.0%
2008 26 0 0 0 0 0 0 0.0% 2009 28 0 0 0 0 0 0 0.0%
2010 26 0 0 0 0 0 0 0.0%
2011 26 0 0 0 0 1 1 3.8% 2012 26 0 0 0 0 2 2 7.7%
2013 26 1 0 0 0 0 1 3.8%
Southeast Shrimp Otter Trawl
1997 7 0 0 0 0 0 0 0.0%
1998 3 0 0 0 0 0 0 0.0% 2003 1 0 0 0 0 0 0 0.0%
2004 1 0 0 0 0 0 0 0.0%
2005 1 0 0 0 0 0 0 0.0% 2006 1 0 0 0 0 0 0 0.0%
2007 1 0 0 0 0 0 0 0.0%
2008 1 0 0 0 0 0 0 0.0% 2009 1 0 0 0 0 0 0 0.0%
2010 1 0 0 0 0 0 0 0.0%
2011 1 0 0 0 0 0 0 0.0% 2012 1 0 0 0 0 0 0 0.0%
2013 1 0 0 0 0 0 0 0.0%
Southeast Shrimp Pot Gear
1996 372 0 1 0 0 0 1 0.3%
1997 322 0 0 0 0 0 0 0.0% 1998 347 0 1 0 0 3 4 1.2%
1999 338 0 0 0 0 2 2 0.6%
2000 337 1 0 0 0 1 2 0.6% 2001 326 1 1 0 0 1 3 0.9%
2002 317 0 1 0 0 3 4 1.3%
2003 305 1 1 0 0 3 5 1.6% 2004 301 0 1 0 0 5 6 2.0%
2005 292 2 0 0 0 5 7 2.4%
2006 289 2 0 0 0 2 4 1.4% 2007 283 1 0 0 0 3 4 1.4%
2008 277 1 0 0 0 2 3 1.1%
2009 277 2 0 0 0 3 5 1.8% 2010 274 2 0 0 0 3 5 1.8%
2011 272 4 0 0 0 1 5 1.8%
2012 269 0 0 0 0 4 4 1.5% 2013 266 2 0 1 0 4 7 2.6%
Southeast Sea Urchin Dive
1996 245 0 0 0 0 0 0 0.0%
1997 298 0 0 3 0 9 12 4.0% 1998 236 0 0 0 0 6 6 2.5%
1999 177 0 0 0 0 3 3 1.7%
2000 128 1 0 0 0 3 4 3.1% 2001 82 5 0 0 0 3 8 9.8%
2002 82 5 0 0 0 4 9 11.0%
2003 81 7 0 0 0 4 11 13.6% 2004 82 3 0 0 0 3 6 7.3%
2005 83 2 0 0 0 1 3 3.6%
2006 80 2 0 0 0 0 2 2.5% 2007 78 0 0 0 0 0 0 0.0%

Table 4. Summary of Emergency Transfers of Limited Entry Permits, by Permit Type, 1975‐2013
20 Emergency Transfers of Alaska’s Commercial Fisheries Limited Entry Permits, 1975 ‐ 2013
Category of Emergency Transfer Total Permit Permits ET - Total ET Type Year Issued PT IUP Estate Gov’t Other ETs Rate
Southeast Sea Urchin Dive continued
2008 73 0 0 0 0 0 0 0.0%
2009 71 0 0 0 0 1 1 1.4% 2010 71 2 0 0 0 0 2 2.8%
2011 67 0 0 0 0 0 0 0.0%
2012 63 0 0 0 0 0 0 0.0% 2013 60 1 0 0 0 2 3 5.0%
Southeast Geoduck Clams Dive
1996 116 0 0 0 0 0 0 0.0%
1997 92 0 0 0 0 0 0 0.0% 1998 130 0 0 1 0 5 6 4.6%
1999 103 0 0 0 0 0 0 0.0%
2000 93 0 4 0 0 0 4 4.3% 2001 86 0 0 0 0 0 0 0.0%
2002 78 0 2 0 0 0 2 2.6%
2003 80 0 1 0 0 2 3 3.8% 2004 84 3 2 0 0 1 6 7.1%
2005 95 5 0 1 0 3 9 9.5%
2006 110 0 0 0 0 3 3 2.7% 2007 105 0 0 0 0 4 4 3.8%
2008 96 0 0 0 0 3 3 3.1%
2009 94 0 0 0 0 4 4 4.3% 2010 91 1 0 0 0 6 7 7.7%
2011 90 0 0 0 0 6 6 6.7%
2012 89 0 0 0 0 8 8 9.0% 2013 90 1 0 0 0 9 10 11.1%
Southeast Sea Cucumber Dive
1996 370 0 0 1 0 1 2 0.5%
1997 316 0 0 2 0 2 4 1.3% 1998 286 0 0 1 0 4 5 1.7%
1999 261 0 0 0 0 4 4 1.5%
2000 278 0 6 0 0 2 8 2.9% 2001 388 4 1 1 0 8 14 3.6%
2002 387 3 0 0 0 7 10 2.6%
2003 367 3 0 0 0 6 9 2.5% 2004 350 4 0 0 0 5 9 2.6%
2005 331 4 0 0 0 8 12 3.6%
2006 321 2 0 0 0 10 12 3.7% 2007 312 7 0 0 0 6 13 4.2%
2008 307 5 0 0 0 9 14 4.6%
2009 295 2 0 0 0 11 13 4.4% 2010 291 9 0 0 0 15 24 8.2%
2011 285 7 0 0 1 6 14 4.9%
2012 283 6 0 0 1 9 16 5.7% 2013 280 2 0 0 1 15 18 6.4%
Southeast Abalone Dive
1996 39 0 0 0 0 0 0 0.0%
1997 13 0 0 0 0 0 0 0.0% 1998 7 0 0 0 0 0 0 0.0%
Yakutat Salmon Set Gillnet
1975 171 5 0 1 6 3.5%
1976 156 0 0 13 13 8.3% 1977 159 0 0 17 17 10.7%
1978 163 0 1 11 12 7.4%
1979 167 0 0 18 18 10.8% 1980 167 0 0 20 20 12.0%
1981 167 0 1 15 16 9.6%
1982 164 0 1 5 6 3.7% 1983 165 1 0 9 10 6.1%
1984 164 0 2 7 9 5.5%
1985 164 0 4 7 11 6.7% 1986 164 0 6 5 11 6.7%
Category of Emergency Transfer Total Permit Permits ET - Total ET Type Year Issued PT IUP Estate Gov’t Other ETs Rate
Yakutat Salmon Set Gillnet continued
1987 165 1 7 8 16 9.7%
1988 165 2 4 14 20 12.1% 1989 166 4 1 16 21 12.7%
1990 166 3 3 14 20 12.0%
1991 168 1 2 21 24 14.3% 1992 170 1 3 19 23 13.5%
1993 171 2 3 17 22 12.9%
1994 171 0 2 2 0 14 18 10.5% 1995 171 1 1 5 0 12 19 11.1%
1996 171 0 1 3 0 18 22 12.9%
1997 170 1 2 1 0 23 27 15.9% 1998 170 0 1 1 0 23 25 14.7%
1999 170 1 1 2 0 21 25 14.7%
2000 170 1 1 2 0 19 23 13.5% 2001 169 1 1 1 0 16 19 11.2%
2002 167 0 1 1 0 7 9 5.4%
2003 167 1 1 1 0 17 20 12.0% 2004 168 3 1 1 0 9 14 8.3%
2005 168 6 0 2 0 8 16 9.5%
2006 167 2 0 1 0 7 10 6.0% 2007 166 5 0 1 0 11 17 10.2%
2008 165 5 0 0 0 12 17 10.3%
2009 167 2 0 0 0 14 16 9.6% 2010 167 3 0 1 0 15 19 11.4%
2011 167 1 0 3 0 19 23 13.8%
2012 168 3 0 1 0 6 10 6.0% 2013 168 2 0 0 0 5 7 4.2%
Prince William Sound Salmon Purse Seine
1975 274 3 0 3 6 2.2%
1976 277 4 2 4 10 3.6% 1977 273 0 0 3 3 1.1%
1978 271 0 0 2 2 0.7%
1979 268 2 1 6 9 3.4% 1980 270 2 2 8 12 4.4%
1981 270 3 1 7 11 4.1%
1982 270 1 1 7 9 3.3% 1983 270 1 3 6 10 3.7%
1984 269 0 3 4 7 2.6%
1985 271 1 2 9 12 4.4% 1986 271 2 1 11 14 5.2%
1987 269 2 2 6 10 3.7%
1988 270 3 2 5 10 3.7% 1989 270 3 1 13 17 6.3%
1990 271 1 1 20 22 8.1%
1991 271 1 0 13 14 5.2% 1992 271 2 0 5 7 2.6%
1993 270 2 0 6 8 3.0%
1994 270 0 1 0 0 8 9 3.3% 1995 268 0 1 0 0 10 11 4.1%
1996 267 0 0 0 0 2 2 0.7%
1997 269 0 1 0 0 1 2 0.7% 1998 267 0 1 0 0 7 8 3.0%
1999 267 0 0 1 0 11 12 4.5%
2000 268 0 1 2 0 4 7 2.6% 2001 268 0 1 1 0 7 9 3.4%
2002 267 2 0 2 0 3 7 2.6%
2003 266 0 0 1 0 2 3 1.1% 2004 266 2 0 0 0 3 5 1.9%
2005 266 1 0 0 0 4 5 1.9%
2006 266 1 0 0 0 3 4 1.5% 2007 266 0 0 1 0 4 5 1.9%
2008 267 1 0 2 0 9 12 4.5%
2009 267 1 0 1 0 12 14 5.2% 2010 268 2 1 3 0 16 22 8.2%

Table 4. Summary of Emergency Transfers of Limited Entry Permits, by Permit Type, 1975‐2013
21 Emergency Transfers of Alaska’s Commercial Fisheries Limited Entry Permits, 1975 ‐ 2013
Category of Emergency Transfer Total Permit Permits ET - Total ET Type Year Issued PT IUP Estate Gov’t Other ETs Rate
Prince William Sound Salmon Purse Seine continued
2011 267 2 0 1 0 12 15 5.6%
2012 267 2 0 2 0 14 18 6.7% 2013 267 1 0 3 0 21 25 9.4%
Prince William Sound Salmon Drift Gillnet
1975 533 2 0 10 12 2.3%
1976 534 1 1 23 25 4.7% 1977 532 0 0 15 15 2.8%
1978 544 0 1 18 19 3.5%
1979 549 2 1 17 20 3.6% 1980 545 1 1 10 12 2.2%
1981 546 3 0 19 22 4.0%
1982 543 3 1 28 32 5.9% 1983 543 2 1 16 19 3.5%
1984 543 2 3 18 23 4.2%
1985 544 3 3 24 30 5.5% 1986 544 2 3 33 38 7.0%
1987 542 2 2 23 27 5.0%
1988 541 3 2 21 26 4.8% 1989 542 2 3 24 29 5.4%
1990 541 1 3 23 27 5.0%
1991 541 2 2 18 22 4.1% 1992 541 1 0 27 28 5.2%
1993 541 1 1 31 33 6.1%
1994 541 0 1 1 0 32 34 6.3% 1995 542 1 2 1 0 34 38 7.0%
1996 539 1 0 1 0 27 29 5.4%
1997 540 1 0 1 0 31 33 6.1% 1998 541 1 1 5 0 23 30 5.5%
1999 541 0 1 4 0 32 37 6.8%
2000 541 1 1 6 0 27 35 6.5% 2001 541 1 1 3 0 21 26 4.8%
2002 540 1 1 2 0 24 28 5.2%
2003 540 2 1 2 0 24 29 5.4% 2004 540 3 0 1 0 19 23 4.3%
2005 538 3 0 1 0 27 31 5.8%
2006 538 2 1 1 0 28 32 5.9% 2007 537 3 0 2 0 25 30 5.6%
2008 537 3 0 2 0 29 34 6.3%
2009 537 4 0 3 0 56 63 11.7% 2010 537 6 0 3 0 51 60 11.2%
2011 537 3 0 4 0 54 61 11.4%
2012 537 9 0 3 0 47 59 11.0% 2013 536 1 0 4 0 44 49 9.1%
Prince William Sound Salmon Set Gillnet
1975 26 0 0 0 0 0.0%
1976 28 0 0 0 0 0.0% 1977 29 0 0 1 1 3.4%
1978 28 0 0 0 0 0.0%
1979 30 1 0 1 2 6.7% 1980 30 0 0 0 0 0.0%
1981 31 0 0 0 0 0.0%
1982 30 0 0 0 0 0.0% 1983 30 0 0 0 0 0.0%
1984 30 0 0 0 0 0.0%
1985 30 0 0 1 1 3.3% 1986 30 0 0 0 0 0.0%
1987 30 0 0 0 0 0.0%
1988 30 0 0 0 0 0.0% 1989 30 0 0 1 1 3.3%
1990 30 0 0 1 1 3.3%
1991 30 0 0 2 2 6.7% 1992 30 0 0 2 2 6.7%
1993 30 0 0 1 1 3.3%
Category of Emergency Transfer Total Permit Permits ET - Total ET Type Year Issued PT IUP Estate Gov’t Other ETs Rate
Prince William Sound Salmon Set Gillnet continued
1994 30 0 0 0 0 3 3 10.0% 1995 30 0 0 0 0 1 1 3.3%
1996 30 0 0 0 0 0 0 0.0%
1997 30 0 0 0 0 1 1 3.3% 1998 30 0 0 0 0 0 0 0.0%
1999 30 0 0 0 0 1 1 3.3%
2000 30 0 0 0 0 2 2 6.7% 2001 30 1 0 0 0 2 3 10.0%
2002 30 1 0 0 0 3 4 13.3%
2003 30 0 0 0 0 5 5 16.7% 2004 30 0 0 0 0 3 3 10.0%
2005 30 0 0 0 0 3 3 10.0%
2006 29 0 0 0 0 3 3 10.3% 2007 30 2 0 0 0 4 6 20.0%
2008 29 0 0 0 0 2 2 6.9%
2009 29 0 0 1 0 4 5 17.2% 2010 29 0 0 1 0 4 5 17.2%
2011 29 0 0 0 0 5 5 17.2%
2012 29 0 0 0 0 4 4 13.8% 2013 29 0 0 0 0 2 2 6.9%
Prince William Sound Roe Herring Purse Seine
1977 107 2 0 2 4 3.7%
1978 102 2 1 1 4 3.9% 1979 104 1 2 1 4 3.8%
1980 102 1 2 0 3 2.9%
1981 103 1 2 0 3 2.9% 1982 104 1 2 3 6 5.8%
1983 105 1 2 4 7 6.7%
1984 106 1 3 1 5 4.7% 1985 106 0 0 1 1 0.9%
1986 107 1 0 1 2 1.9%
1987 106 2 1 0 3 2.8% 1988 106 2 0 1 3 2.8%
1989 106 2 0 0 2 1.9%
1990 107 2 0 0 2 1.9% 1991 107 2 0 1 3 2.8%
1992 107 2 1 1 4 3.7%
1993 107 2 0 1 3 2.8% 1994 107 0 2 0 0 1 3 2.8%
1995 106 0 0 0 0 0 0 0.0%
1996 105 0 0 0 0 0 0 0.0% 1997 106 0 1 0 0 0 1 0.9%
1998 106 0 2 0 0 3 5 4.7%
1999 106 0 1 0 0 2 3 2.8% 2000 104 0 0 0 0 0 0 0.0%
2001 104 0 0 0 0 0 0 0.0%
2002 104 0 0 0 0 0 0 0.0% 2003 104 0 0 0 0 0 0 0.0%
2004 104 0 0 0 0 0 0 0.0%
2005 104 0 0 0 0 0 0 0.0% 2006 104 0 0 0 0 0 0 0.0%
2007 105 0 0 0 0 0 0 0.0%
2008 105 0 0 0 0 0 0 0.0% 2009 105 0 0 0 0 0 0 0.0%
2010 105 0 0 0 0 0 0 0.0%
2011 105 0 0 0 0 0 0 0.0% 2012 105 0 0 0 0 0 0 0.0%
2013 105 0 0 0 0 0 0 0.0%
Prince William Sound Roe Herring Gillnet
1980 20 0 0 0 0 0.0%
1981 21 0 0 0 0 0.0% 1982 24 0 0 0 0 0.0%
1983 24 0 0 1 1 4.2%

Table 4. Summary of Emergency Transfers of Limited Entry Permits, by Permit Type, 1975‐2013
22 Emergency Transfers of Alaska’s Commercial Fisheries Limited Entry Permits, 1975 ‐ 2013
Category of Emergency Transfer Total Permit Permits ET - Total ET Type Year Issued PT IUP Estate Gov’t Other ETs Rate
Prince William Sound Roe Herring Gillnet continued
1984 24 0 0 2 2 8.3% 1985 24 0 0 1 1 4.2%
1986 24 0 0 0 0 0.0%
1987 24 0 0 1 1 4.2% 1988 24 0 0 1 1 4.2%
1989 24 0 0 0 0 0.0%
1990 24 0 0 2 2 8.3% 1991 24 0 0 2 2 8.3%
1992 24 0 0 2 2 8.3%
1993 24 0 0 2 2 8.3% 1994 24 0 0 0 0 2 2 8.3%
1995 24 0 0 0 0 1 1 4.2%
1996 24 0 0 0 0 0 0 0.0% 1997 24 0 0 0 0 1 1 4.2%
1998 24 0 0 0 0 2 2 8.3%
1999 24 0 0 0 0 1 1 4.2% 2000 24 0 0 0 0 0 0 0.0%
2001 24 0 0 0 0 0 0 0.0%
2002 24 0 0 0 0 0 0 0.0% 2003 24 0 0 0 0 0 0 0.0%
2004 24 0 0 0 0 0 0 0.0%
2005 24 0 0 0 0 0 0 0.0% 2006 24 0 0 0 0 0 0 0.0%
2007 24 0 0 0 0 0 0 0.0%
2008 24 0 0 0 0 0 0 0.0% 2009 24 0 0 0 0 0 0 0.0%
2010 24 0 0 0 0 0 0 0.0%
2011 24 0 0 0 0 0 0 0.0% 2012 24 0 0 0 0 0 0 0.0%
2013 24 0 0 0 0 0 0 0.0%
Prince William Sound Herring Spawn-On-Kelp Pound
1987 118 4 0 0 4 3.4%
1988 129 0 2 3 5 3.9% 1989 129 0 2 3 5 3.9%
1990 129 0 3 3 6 4.7%
1991 128 0 1 2 3 2.3% 1992 128 0 1 4 5 3.9%
1993 128 0 1 7 8 6.3%
1994 128 0 0 1 0 19 20 15.6% 1995 128 0 0 0 0 0 0 0.0%
1996 128 0 0 0 0 0 0 0.0%
1997 128 0 0 1 0 13 14 10.9% 1998 128 1 0 0 0 4 5 3.9%
1999 127 0 0 0 0 0 0 0.0%
2000 127 0 0 0 0 0 0 0.0% 2001 128 0 0 0 0 0 0 0.0%
2002 128 0 0 0 0 0 0 0.0%
2003 128 0 0 0 0 0 0 0.0% 2004 128 0 0 0 0 0 0 0.0%
2005 128 0 0 0 0 0 0 0.0%
2006 128 0 0 0 0 0 0 0.0% 2007 128 0 0 0 0 0 0 0.0%
2008 128 0 0 0 0 0 0 0.0%
2009 128 0 0 0 0 0 0 0.0% 2010 128 0 0 0 0 0 0 0.0%
2011 128 0 0 0 0 0 0 0.0%
2012 128 0 0 0 0 0 0 0.0% 2013 128 0 0 0 0 0 0 0.0%
Prince William Sound Sablefish Fixed Gear Vessel to 90 ft
1996 1 0 0 0 0 0 0 0.0%
1997 2 0 0 0 0 0 0 0.0% 1998 2 0 0 0 0 0 0 0.0%
1999 1 0 0 0 0 0 0 0.0%
Category of Emergency Transfer Total Permit Permits ET - Total ET Type Year Issued PT IUP Estate Gov’t Other ETs Rate
Prince William Sound Sablefish Fixed Gear Vessel to 90 ft continued
2000 1 0 0 0 0 0 0 0.0% 2001 1 0 0 0 0 0 0 0.0%
2002 1 0 0 0 0 0 0 0.0%
2003 1 0 0 0 0 0 0 0.0% 2004 1 0 0 0 0 0 0 0.0%
2005 1 0 0 0 0 0 0 0.0%
2006 1 0 0 0 0 0 0 0.0% 2007 1 0 0 0 0 0 0 0.0%
2008 1 0 0 0 0 0 0 0.0%
2009 1 0 0 0 0 0 0 0.0% 2010 1 0 0 0 0 0 0 0.0%
2011 1 0 0 0 0 0 0 0.0%
2012 1 0 0 0 0 0 0 0.0% 2013 1 0 0 0 0 0 0 0.0%
Prince William Sound Sablefish Fixed Gear Vessel to 60 ft
1996 3 0 0 0 0 0 0 0.0%
1997 2 0 0 0 0 0 0 0.0% 1998 4 0 0 0 0 0 0 0.0%
1999 4 0 0 0 0 0 0 0.0%
2000 3 0 0 0 0 0 0 0.0% 2001 4 0 0 0 0 0 0 0.0%
2002 3 0 0 0 0 0 0 0.0%
2003 3 0 0 0 0 0 0 0.0% 2004 3 0 0 0 0 0 0 0.0%
2005 3 0 0 0 0 0 0 0.0%
2006 3 0 0 0 0 0 0 0.0% 2007 3 0 0 0 0 0 0 0.0%
2008 3 0 0 0 0 0 0 0.0%
2009 3 0 0 0 0 0 0 0.0% 2010 3 0 0 0 0 0 0 0.0%
2011 3 0 0 0 0 0 0 0.0%
2012 3 0 0 0 0 0 0 0.0% 2013 3 0 0 0 0 0 0 0.0%
Prince William Sound Sablefish Net Gear Vessel to 50 ft
1996 1 0 0 0 0 0 0 0.0%
1997 1 0 0 0 0 0 0 0.0% 1998 1 0 0 0 0 0 0 0.0%
1999 1 0 0 0 0 0 0 0.0%
2000 1 0 0 0 0 0 0 0.0% 2001 1 0 0 0 0 0 0 0.0%
2002 1 0 0 0 0 0 0 0.0%
2003 1 0 0 0 0 0 0 0.0% 2004 1 0 0 0 0 0 0 0.0%
2005 1 0 0 0 0 0 0 0.0%
2006 1 0 0 0 0 0 0 0.0% 2007 1 0 0 0 0 0 0 0.0%
2008 1 0 0 0 0 0 0 0.0%
2009 1 0 0 0 0 0 0 0.0% 2010 1 0 0 0 0 0 0 0.0%
2011 1 0 0 0 0 0 0 0.0%
2012 1 0 0 0 0 0 0 0.0% 2013 1 0 0 0 0 0 0 0.0%
Prince William Sound Sablefish Fixed Gear Vessel to 50 ft
1996 56 0 1 0 0 0 1 1.8%
1997 54 0 0 0 0 0 0 0.0% 1998 53 0 1 0 0 3 4 7.5%
1999 42 0 0 0 0 0 0 0.0%
2000 40 0 1 1 0 0 2 5.0% 2001 40 0 1 0 0 0 1 2.5%
2002 41 0 2 0 0 3 5 12.2%
2003 39 2 2 0 0 3 7 17.9% 2004 39 0 1 0 0 2 3 7.7%

Table 4. Summary of Emergency Transfers of Limited Entry Permits, by Permit Type, 1975‐2013
23 Emergency Transfers of Alaska’s Commercial Fisheries Limited Entry Permits, 1975 ‐ 2013
Category of Emergency Transfer Total Permit Permits ET - Total ET Type Year Issued PT IUP Estate Gov’t Other ETs Rate
Prince William Sound Sablefish Fixed Gear Vessel to 50 ft continued
2005 39 0 1 0 0 1 2 5.1%
2006 39 0 3 0 0 4 7 17.9% 2007 38 0 3 0 0 3 6 15.8%
2008 38 0 3 0 0 1 4 10.5%
2009 38 0 2 0 0 1 3 7.9% 2010 38 0 3 0 0 1 4 10.5%
2011 38 0 4 0 0 3 7 18.4%
2012 38 1 3 0 0 4 8 21.1% 2013 38 0 2 1 0 1 4 10.5%
Prince William Sound Sablefish Fixed Gear Vessel to 35 ft
1996 18 0 0 0 0 0 0 0.0%
1997 15 0 0 0 0 0 0 0.0% 1998 15 0 0 0 0 0 0 0.0%
1999 8 0 0 0 0 0 0 0.0%
2000 8 0 0 0 0 0 0 0.0% 2001 10 0 0 0 0 1 1 10.0%
2002 10 0 0 0 0 0 0 0.0%
2003 10 0 0 0 0 0 0 0.0% 2004 10 0 0 0 0 1 1 10.0%
2005 10 0 0 0 0 1 1 10.0%
2006 10 0 0 0 0 0 0 0.0% 2007 10 0 0 0 0 0 0 0.0%
2008 10 0 0 0 0 0 0 0.0%
2009 10 0 0 0 0 0 0 0.0% 2010 10 0 0 0 0 0 0 0.0%
2011 10 0 0 0 0 0 0 0.0%
2012 11 0 0 0 0 0 0 0.0% 2013 11 0 0 0 0 0 0 0.0%
Cook Inlet Salmon Purse Seine
1975 89 0 0 0 0 0.0%
1976 78 0 1 3 4 5.1% 1977 81 0 0 1 1 1.2%
1978 83 0 0 1 1 1.2%
1979 84 0 0 1 1 1.2% 1980 84 1 0 2 3 3.6%
1981 85 1 0 3 4 4.7%
1982 84 0 0 3 3 3.6% 1983 83 0 1 0 1 1.2%
1984 81 1 0 1 2 2.5%
1985 82 0 0 3 3 3.7% 1986 83 1 0 2 3 3.6%
1987 83 0 0 4 4 4.8%
1988 83 1 0 2 3 3.6% 1989 83 0 0 3 3 3.6%
1990 83 0 0 6 6 7.2%
1991 83 0 2 4 6 7.2% 1992 83 0 1 0 1 1.2%
1993 84 0 0 1 1 1.2%
1994 84 0 0 0 0 3 3 3.6% 1995 84 1 0 0 0 3 4 4.8%
1996 85 1 0 0 0 1 2 2.4%
1997 85 0 0 0 0 1 1 1.2% 1998 83 0 1 0 0 2 3 3.6%
1999 83 0 1 0 0 3 4 4.8%
2000 83 0 0 0 0 2 2 2.4% 2001 83 0 0 0 0 0 0 0.0%
2002 82 1 0 0 0 4 5 6.1%
2003 81 1 0 0 0 3 4 4.9% 2004 81 0 0 1 0 4 5 6.2%
2005 82 0 0 1 0 3 4 4.9%
2006 82 0 0 0 0 0 0 0.0% 2007 83 1 0 0 0 0 1 1.2%
2008 82 0 0 0 0 3 3 3.7%
Category of Emergency Transfer Total Permit Permits ET - Total ET Type Year Issued PT IUP Estate Gov’t Other ETs Rate
Cook Inlet Salmon Purse Seine continued
2009 82 2 0 0 0 1 3 3.7% 2010 82 0 0 0 0 2 2 2.4%
2011 83 1 0 0 0 3 4 4.8%
2012 83 0 0 0 0 2 2 2.4% 2013 83 2 0 0 0 0 2 2.4%
Cook Inlet Salmon Drift Gillnet
1975 630 20 0 3 23 3.7%
1976 583 6 1 23 30 5.1% 1977 572 1 0 12 13 2.3%
1978 589 7 0 23 30 5.1%
1979 599 5 0 20 25 4.2% 1980 598 6 0 23 29 4.8%
1981 598 8 0 17 25 4.2%
1982 591 8 0 18 26 4.4% 1983 587 9 3 18 30 5.1%
1984 588 9 3 18 30 5.1%
1985 591 11 4 21 36 6.1% 1986 588 10 4 16 30 5.1%
1987 586 11 2 21 34 5.8%
1988 585 7 3 15 25 4.3% 1989 585 6 1 16 23 3.9%
1990 585 8 2 19 29 5.0%
1991 584 8 1 19 28 4.8% 1992 583 9 3 23 35 6.0%
1993 583 9 4 31 44 7.5%
1994 582 1 10 4 0 30 45 7.7% 1995 582 3 9 1 0 41 54 9.3%
1996 582 2 8 1 0 31 42 7.2%
1997 581 3 7 2 0 30 42 7.2% 1998 579 2 9 4 1 35 51 8.8%
1999 575 1 4 6 1 30 42 7.3%
2000 576 4 3 4 0 35 46 8.0% 2001 574 3 2 5 0 33 43 7.5%
2002 572 3 1 4 1 21 30 5.2%
2003 572 6 1 2 0 16 25 4.4% 2004 571 5 2 1 0 21 29 5.1%
2005 571 5 1 2 0 30 38 6.7%
2006 570 2 0 2 2 15 21 3.7% 2007 571 4 0 1 0 15 20 3.5%
2008 571 4 0 6 0 23 33 5.8%
2009 570 4 0 2 1 26 33 5.8% 2010 569 4 0 3 1 22 30 5.3%
2011 569 6 0 0 0 39 45 7.9%
2012 569 7 0 0 1 47 55 9.7% 2013 569 4 0 0 0 45 49 8.6%
Cook Inlet Salmon Set Gillnet
1975 752 22 0 7 29 3.9%
1976 717 2 0 17 19 2.6% 1977 733 0 3 16 19 2.6%
1978 746 0 0 16 16 2.1%
1979 749 0 2 16 18 2.4% 1980 747 0 0 23 23 3.1%
1981 747 0 0 12 12 1.6%
1982 748 0 0 15 15 2.0% 1983 745 0 1 9 10 1.3%
1984 744 0 1 13 14 1.9%
1985 745 0 1 12 13 1.7% 1986 743 0 2 17 19 2.6%
1987 743 0 3 22 25 3.4%
1988 743 0 0 14 14 1.9% 1989 743 0 2 27 29 3.9%
1990 743 0 1 32 33 4.4%
1991 745 0 4 27 31 4.2%
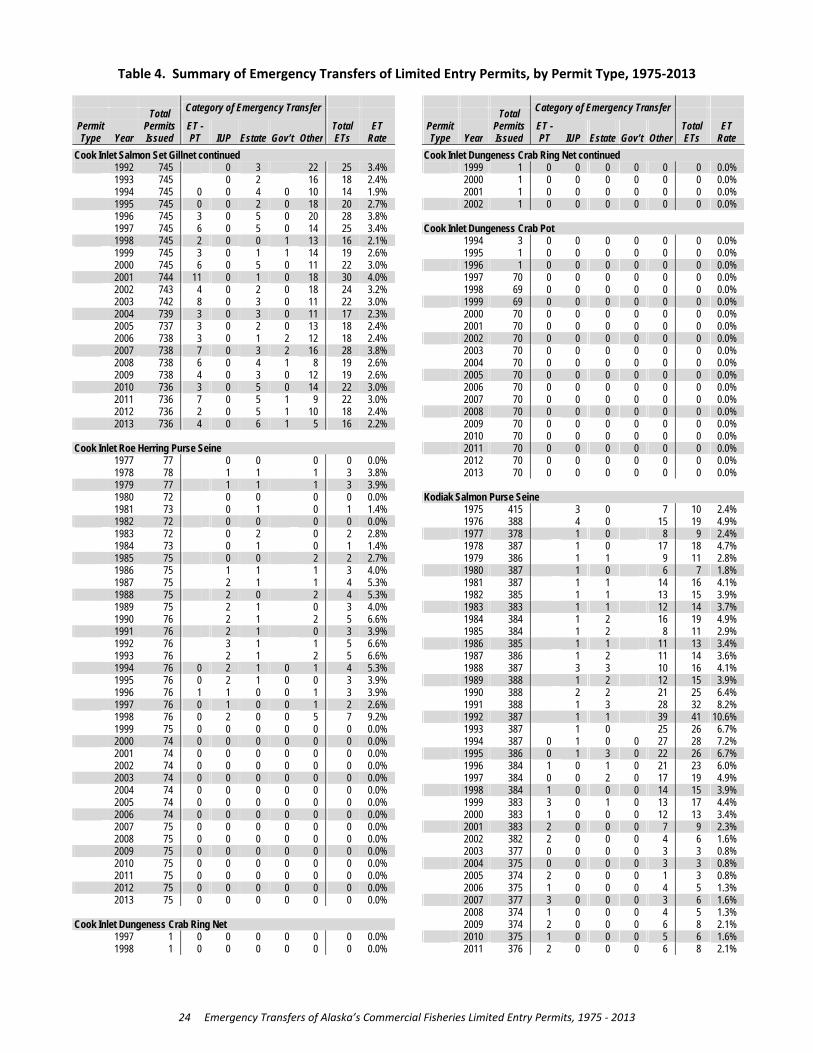
Table 4. Summary of Emergency Transfers of Limited Entry Permits, by Permit Type, 1975‐2013
24 Emergency Transfers of Alaska’s Commercial Fisheries Limited Entry Permits, 1975 ‐ 2013
Category of Emergency Transfer Total Permit Permits ET - Total ET Type Year Issued PT IUP Estate Gov’t Other ETs Rate
Cook Inlet Salmon Set Gillnet continued 1992 745 0 3 22 25 3.4%
1993 745 0 2 16 18 2.4%
1994 745 0 0 4 0 10 14 1.9% 1995 745 0 0 2 0 18 20 2.7%
1996 745 3 0 5 0 20 28 3.8%
1997 745 6 0 5 0 14 25 3.4% 1998 745 2 0 0 1 13 16 2.1%
1999 745 3 0 1 1 14 19 2.6%
2000 745 6 0 5 0 11 22 3.0% 2001 744 11 0 1 0 18 30 4.0%
2002 743 4 0 2 0 18 24 3.2%
2003 742 8 0 3 0 11 22 3.0% 2004 739 3 0 3 0 11 17 2.3%
2005 737 3 0 2 0 13 18 2.4%
2006 738 3 0 1 2 12 18 2.4% 2007 738 7 0 3 2 16 28 3.8%
2008 738 6 0 4 1 8 19 2.6%
2009 738 4 0 3 0 12 19 2.6% 2010 736 3 0 5 0 14 22 3.0%
2011 736 7 0 5 1 9 22 3.0%
2012 736 2 0 5 1 10 18 2.4% 2013 736 4 0 6 1 5 16 2.2%
Cook Inlet Roe Herring Purse Seine
1977 77 0 0 0 0 0.0%
1978 78 1 1 1 3 3.8% 1979 77 1 1 1 3 3.9%
1980 72 0 0 0 0 0.0%
1981 73 0 1 0 1 1.4% 1982 72 0 0 0 0 0.0%
1983 72 0 2 0 2 2.8%
1984 73 0 1 0 1 1.4% 1985 75 0 0 2 2 2.7%
1986 75 1 1 1 3 4.0%
1987 75 2 1 1 4 5.3% 1988 75 2 0 2 4 5.3%
1989 75 2 1 0 3 4.0%
1990 76 2 1 2 5 6.6% 1991 76 2 1 0 3 3.9%
1992 76 3 1 1 5 6.6%
1993 76 2 1 2 5 6.6% 1994 76 0 2 1 0 1 4 5.3%
1995 76 0 2 1 0 0 3 3.9%
1996 76 1 1 0 0 1 3 3.9% 1997 76 0 1 0 0 1 2 2.6%
1998 76 0 2 0 0 5 7 9.2%
1999 75 0 0 0 0 0 0 0.0% 2000 74 0 0 0 0 0 0 0.0%
2001 74 0 0 0 0 0 0 0.0%
2002 74 0 0 0 0 0 0 0.0% 2003 74 0 0 0 0 0 0 0.0%
2004 74 0 0 0 0 0 0 0.0%
2005 74 0 0 0 0 0 0 0.0% 2006 74 0 0 0 0 0 0 0.0%
2007 75 0 0 0 0 0 0 0.0%
2008 75 0 0 0 0 0 0 0.0% 2009 75 0 0 0 0 0 0 0.0%
2010 75 0 0 0 0 0 0 0.0%
2011 75 0 0 0 0 0 0 0.0% 2012 75 0 0 0 0 0 0 0.0%
2013 75 0 0 0 0 0 0 0.0%
Cook Inlet Dungeness Crab Ring Net
1997 1 0 0 0 0 0 0 0.0%
1998 1 0 0 0 0 0 0 0.0%
Category of Emergency Transfer Total Permit Permits ET - Total ET Type Year Issued PT IUP Estate Gov’t Other ETs Rate
Cook Inlet Dungeness Crab Ring Net continued 1999 1 0 0 0 0 0 0 0.0%
2000 1 0 0 0 0 0 0 0.0%
2001 1 0 0 0 0 0 0 0.0% 2002 1 0 0 0 0 0 0 0.0%
Cook Inlet Dungeness Crab Pot
1994 3 0 0 0 0 0 0 0.0%
1995 1 0 0 0 0 0 0 0.0% 1996 1 0 0 0 0 0 0 0.0%
1997 70 0 0 0 0 0 0 0.0%
1998 69 0 0 0 0 0 0 0.0% 1999 69 0 0 0 0 0 0 0.0%
2000 70 0 0 0 0 0 0 0.0%
2001 70 0 0 0 0 0 0 0.0% 2002 70 0 0 0 0 0 0 0.0%
2003 70 0 0 0 0 0 0 0.0%
2004 70 0 0 0 0 0 0 0.0% 2005 70 0 0 0 0 0 0 0.0%
2006 70 0 0 0 0 0 0 0.0%
2007 70 0 0 0 0 0 0 0.0% 2008 70 0 0 0 0 0 0 0.0%
2009 70 0 0 0 0 0 0 0.0%
2010 70 0 0 0 0 0 0 0.0% 2011 70 0 0 0 0 0 0 0.0%
2012 70 0 0 0 0 0 0 0.0%
2013 70 0 0 0 0 0 0 0.0%
Kodiak Salmon Purse Seine
1975 415 3 0 7 10 2.4%
1976 388 4 0 15 19 4.9% 1977 378 1 0 8 9 2.4%
1978 387 1 0 17 18 4.7%
1979 386 1 1 9 11 2.8% 1980 387 1 0 6 7 1.8%
1981 387 1 1 14 16 4.1%
1982 385 1 1 13 15 3.9% 1983 383 1 1 12 14 3.7%
1984 384 1 2 16 19 4.9%
1985 384 1 2 8 11 2.9% 1986 385 1 1 11 13 3.4%
1987 386 1 2 11 14 3.6%
1988 387 3 3 10 16 4.1% 1989 388 1 2 12 15 3.9%
1990 388 2 2 21 25 6.4%
1991 388 1 3 28 32 8.2% 1992 387 1 1 39 41 10.6%
1993 387 1 0 25 26 6.7%
1994 387 0 1 0 0 27 28 7.2% 1995 386 0 1 3 0 22 26 6.7%
1996 384 1 0 1 0 21 23 6.0%
1997 384 0 0 2 0 17 19 4.9% 1998 384 1 0 0 0 14 15 3.9%
1999 383 3 0 1 0 13 17 4.4%
2000 383 1 0 0 0 12 13 3.4% 2001 383 2 0 0 0 7 9 2.3%
2002 382 2 0 0 0 4 6 1.6%
2003 377 0 0 0 0 3 3 0.8% 2004 375 0 0 0 0 3 3 0.8%
2005 374 2 0 0 0 1 3 0.8%
2006 375 1 0 0 0 4 5 1.3% 2007 377 3 0 0 0 3 6 1.6%
2008 374 1 0 0 0 4 5 1.3%
2009 374 2 0 0 0 6 8 2.1% 2010 375 1 0 0 0 5 6 1.6%
2011 376 2 0 0 0 6 8 2.1%

Table 4. Summary of Emergency Transfers of Limited Entry Permits, by Permit Type, 1975‐2013
25 Emergency Transfers of Alaska’s Commercial Fisheries Limited Entry Permits, 1975 ‐ 2013
Category of Emergency Transfer Total Permit Permits ET - Total ET Type Year Issued PT IUP Estate Gov’t Other ETs Rate
Kodiak Salmon Purse Seine continued
2012 376 3 0 0 0 5 8 2.1% 2013 376 0 0 1 0 5 6 1.6%
Kodiak Salmon Beach Seine
1975 23 1 0 0 1 4.3%
1976 23 0 0 0 0 0.0% 1977 31 0 0 1 1 3.2%
1978 34 0 0 2 2 5.9%
1979 34 0 0 0 0 0.0% 1980 35 0 0 3 3 8.6%
1981 35 0 0 2 2 5.7%
1982 35 0 0 1 1 2.9% 1983 35 0 0 0 0 0.0%
1984 35 0 0 2 2 5.7%
1985 34 0 0 1 1 2.9% 1986 34 0 0 1 1 2.9%
1987 33 0 1 1 2 6.1%
1988 33 0 1 0 1 3.0% 1989 33 0 1 0 1 3.0%
1990 33 0 0 0 0 0.0%
1991 33 0 0 1 1 3.0% 1992 33 0 0 3 3 9.1%
1993 34 0 0 0 0 0.0%
1994 34 0 0 0 0 0 0 0.0% 1995 34 0 0 0 0 1 1 2.9%
1996 34 0 0 0 0 1 1 2.9%
1997 34 0 0 0 0 0 0 0.0% 1998 34 0 0 0 0 0 0 0.0%
1999 34 0 0 0 0 1 1 2.9%
2000 34 1 0 0 0 0 1 2.9% 2001 34 0 0 0 0 0 0 0.0%
2002 34 0 0 0 0 0 0 0.0%
2003 33 0 0 0 0 0 0 0.0% 2004 32 0 0 0 0 0 0 0.0%
2005 31 0 0 0 0 0 0 0.0%
2006 31 0 0 0 0 1 1 3.2% 2007 31 0 0 0 0 0 0 0.0%
2008 31 0 0 0 0 0 0 0.0%
2009 31 1 0 0 0 0 1 3.2% 2010 31 0 0 0 0 1 1 3.2%
2011 31 0 0 0 0 0 0 0.0%
2012 31 0 0 0 0 0 0 0.0% 2013 31 0 0 0 0 1 1 3.2%
Kodiak Salmon Set Gillnet
1975 194 6 0 1 7 3.6%
1976 186 3 1 5 9 4.8% 1977 186 0 1 3 4 2.2%
1978 187 0 1 4 5 2.7%
1979 186 0 0 4 4 2.2% 1980 187 0 1 7 8 4.3%
1981 187 0 0 6 6 3.2%
1982 187 1 0 7 8 4.3% 1983 188 0 0 7 7 3.7%
1984 188 0 0 7 7 3.7%
1985 188 0 1 8 9 4.8% 1986 187 0 2 7 9 4.8%
1987 188 0 1 7 8 4.3%
1988 188 0 3 20 23 12.2% 1989 189 0 3 12 15 7.9%
1990 189 1 4 19 24 12.7%
1991 189 1 6 18 25 13.2% 1992 189 1 3 16 20 10.6%
1993 190 1 3 20 24 12.6%
1994 190 0 1 1 0 15 17 8.9%
Category of Emergency Transfer Total Permit Permits ET - Total ET Type Year Issued PT IUP Estate Gov’t Other ETs Rate
Kodiak Salmon Set Gillnet continued 1995 189 0 1 1 0 14 16 8.5%
1996 189 0 1 1 0 19 21 11.1%
1997 188 0 0 1 0 16 17 9.0% 1998 188 1 0 1 0 18 20 10.6%
1999 188 2 0 2 0 17 21 11.2%
2000 188 2 0 2 0 29 33 17.6% 2001 188 0 0 1 0 28 29 15.4%
2002 188 2 0 1 1 26 30 16.0%
2003 188 7 0 0 0 22 29 15.4% 2004 188 3 0 1 0 23 27 14.4%
2005 188 2 0 0 0 25 27 14.4%
2006 188 3 0 0 0 22 25 13.3% 2007 188 1 0 0 0 22 23 12.2%
2008 188 6 0 0 0 20 26 13.8%
2009 188 2 0 3 1 18 24 12.8% 2010 188 1 0 0 0 16 17 9.0%
2011 188 1 0 0 2 24 27 14.4%
2012 188 2 0 0 2 29 33 17.6% 2013 188 1 0 0 3 19 23 12.2%
Kodiak Roe Herring Purse Seine
1981 110 0 0 0 0 0.0%
1982 95 1 0 0 1 1.1% 1983 91 0 0 0 0 0.0%
1984 51 2 0 0 2 3.9%
1985 70 1 0 0 1 1.4% 1986 72 0 0 1 1 1.4%
1987 66 0 0 0 0 0.0%
1988 69 1 1 1 3 4.3% 1989 71 1 0 4 5 7.0%
1990 71 1 0 0 1 1.4%
1991 69 0 0 2 2 2.9% 1992 80 1 0 5 6 7.5%
1993 80 0 0 2 2 2.5%
1994 83 0 0 0 0 3 3 3.6% 1995 80 0 0 0 0 2 2 2.5%
1996 82 0 2 0 0 1 3 3.7%
1997 81 0 1 0 0 3 4 4.9% 1998 74 0 0 0 0 1 1 1.4%
1999 75 0 0 1 0 0 1 1.3%
2000 75 0 0 0 0 0 0 0.0% 2001 73 0 0 0 0 2 2 2.7%
2002 71 1 0 0 0 1 2 2.8%
2003 70 0 1 0 0 0 1 1.4% 2004 68 0 0 0 0 0 0 0.0%
2005 69 0 1 0 0 1 2 2.9%
2006 69 0 0 0 0 0 0 0.0% 2007 68 0 0 0 0 0 0 0.0%
2008 69 0 0 0 0 1 1 1.4%
2009 69 1 0 0 0 2 3 4.3% 2010 68 0 0 0 0 0 0 0.0%
2011 68 0 0 0 0 0 0 0.0%
2012 72 1 0 0 0 0 1 1.4% 2013 72 1 0 0 0 1 2 2.8%
Kodiak Roe Herring Gillnet
1981 184 1 0 0 1 0.5%
1982 174 2 0 0 2 1.1% 1983 157 3 0 0 3 1.9%
1984 110 3 0 0 3 2.7%
1985 120 8 0 5 13 10.8% 1986 118 6 0 3 9 7.6%
1987 107 3 0 3 6 5.6%
1988 105 4 0 6 10 9.5% 1989 112 6 0 2 8 7.1%

Table 4. Summary of Emergency Transfers of Limited Entry Permits, by Permit Type, 1975‐2013
26 Emergency Transfers of Alaska’s Commercial Fisheries Limited Entry Permits, 1975 ‐ 2013
Category of Emergency Transfer Total Permit Permits ET - Total ET Type Year Issued PT IUP Estate Gov’t Other ETs Rate
Kodiak Roe Herring Gillnet continuted
1990 99 2 0 7 9 9.1%
1991 102 2 0 7 9 8.8% 1992 108 3 1 6 10 9.3%
1993 105 0 0 2 2 1.9%
1994 110 0 2 0 0 6 8 7.3% 1995 105 0 3 0 0 3 6 5.7%
1996 106 0 3 0 0 3 6 5.7%
1997 103 0 2 0 0 2 4 3.9% 1998 99 0 0 1 0 0 1 1.0%
1999 97 0 0 0 0 0 0 0.0%
2000 95 0 0 0 0 0 0 0.0% 2001 96 0 0 0 0 1 1 1.0%
2002 96 0 0 0 0 1 1 1.0%
2003 95 1 0 0 0 0 1 1.1% 2004 94 1 0 0 0 1 2 2.1%
2005 96 0 0 0 0 0 0 0.0%
2006 92 0 0 0 0 0 0 0.0% 2007 91 0 0 0 0 0 0 0.0%
2008 89 1 0 0 0 0 1 1.1%
2009 97 0 0 0 0 0 0 0.0% 2010 96 1 0 0 0 0 1 1.0%
2011 91 0 0 0 0 0 0 0.0%
2012 90 0 0 0 0 0 0 0.0% 2013 90 1 0 0 0 0 1 1.1%
Kodiak Roe Herring Gillnet & Seine
1987 1 0 0 0 0 0.0%
1988 1 0 0 0 0 0.0% 1989 1 0 0 0 0 0.0%
1990 1 0 0 0 0 0.0%
1991 1 0 0 0 0 0.0% 1992 2 0 0 0 0 0.0%
1993 2 0 0 0 0 0.0%
1994 2 0 0 0 0 0 0 0.0% 1995 2 0 0 0 0 0 0 0.0%
1996 2 0 0 0 0 0 0 0.0%
1997 2 0 0 0 0 0 0 0.0% 1998 2 0 0 0 0 0 0 0.0%
1999 2 0 0 0 0 0 0 0.0%
2000 2 0 0 0 0 0 0 0.0% 2001 2 0 0 0 0 0 0 0.0%
2002 2 0 0 0 0 0 0 0.0%
2003 2 0 0 0 0 0 0 0.0% 2004 2 0 0 0 0 0 0 0.0%
2005 2 0 0 0 0 0 0 0.0%
2006 2 0 0 0 0 0 0 0.0% 2007 2 0 0 0 0 0 0 0.0%
2008 2 0 0 0 0 0 0 0.0%
2009 2 0 0 0 0 0 0 0.0% 2010 2 0 0 0 0 1 1 50.0%
2011 2 0 0 0 0 0 0 0.0%
2012 2 0 0 0 0 0 0 0.0% 2013 2 0 0 0 0 0 0 0.0%
Kodiak Bait Herring Purse Seine / Gillnet Vessel to 60 ft
2002 5 0 0 0 0 0 0 0.0%
2003 5 0 0 0 0 0 0 0.0% 2004 5 0 0 0 0 0 0 0.0%
2005 5 0 0 0 0 0 0 0.0%
2006 5 0 0 0 0 0 0 0.0% 2007 5 0 0 0 0 0 0 0.0%
2008 5 0 0 0 0 0 0 0.0%
2009 5 0 0 0 0 0 0 0.0% 2010 5 0 0 0 0 0 0 0.0%
2011 5 0 0 0 0 0 0 0.0%
Category of Emergency Transfer Total Permit Permits ET - Total ET Type Year Issued PT IUP Estate Gov’t Other ETs Rate
Kodiak Bait Herring Purse Seine / Gillnet Vessel to 60 ft continued
2012 5 0 0 0 0 0 0 0.0% 2013 5 0 0 0 0 0 0 0.0%
Kodiak Bait Herring Otter Trawl Vessel to 75 ft
2002 1 0 0 0 0 0 0 0.0%
2003 1 0 0 0 0 0 0 0.0% 2004 1 0 0 0 0 0 0 0.0%
2005 1 0 0 0 0 0 0 0.0%
2006 1 0 0 0 0 0 0 0.0% 2007 1 0 0 0 0 0 0 0.0%
2008 1 0 0 0 0 0 0 0.0%
2009 1 0 0 0 0 0 0 0.0% 2010 1 0 0 0 0 0 0 0.0%
2011 1 0 0 0 0 0 0 0.0%
2012 1 0 0 0 0 0 0 0.0% 2013 1 0 0 0 0 0 0 0.0%
Kodiak Bait Herring Otter Trawl Vessel to 70 ft
2002 1 0 0 0 0 0 0 0.0%
2003 1 0 0 0 0 0 0 0.0% 2004 1 0 0 0 0 0 0 0.0%
2005 1 0 0 0 0 0 0 0.0%
2006 1 0 0 0 0 0 0 0.0% 2007 1 0 0 0 0 0 0 0.0%
2008 1 0 0 0 0 0 0 0.0%
2009 1 0 0 0 0 0 0 0.0% 2010 1 0 0 0 0 0 0 0.0%
2011 1 0 0 0 0 0 0 0.0%
2012 1 0 0 0 0 0 0 0.0% 2013 1 0 0 0 0 0 0 0.0%
Kodiak Bait Herring Otter Trawl Vessel to 60 ft
2002 2 0 0 0 0 0 0 0.0%
2003 2 0 0 0 0 0 0 0.0% 2004 2 0 0 0 0 0 0 0.0%
2005 2 0 0 0 0 0 0 0.0%
2006 2 0 0 0 0 0 0 0.0% 2007 2 0 0 0 0 0 0 0.0%
2008 2 0 0 0 0 0 0 0.0%
2009 2 0 0 0 0 0 0 0.0% 2010 2 0 0 0 0 0 0 0.0%
2011 2 0 0 0 0 0 0 0.0%
2012 2 0 0 0 0 0 0 0.0% 2013 2 0 0 0 0 0 0 0.0%
Kodiak Tanner Bairdi Crab Pot Vessel To 120 ft
2003 20 0 0 0 0 0 0 0.0%
2004 16 0 0 0 0 0 0 0.0% 2005 37 0 0 0 0 0 0 0.0%
2006 35 0 0 0 0 1 1 2.9%
2007 35 0 0 0 0 0 0 0.0% 2008 35 0 0 0 0 1 1 2.9%
2009 37 0 0 0 0 0 0 0.0%
2010 37 0 0 0 0 1 1 2.7% 2011 43 1 0 0 0 0 1 2.3%
2012 43 0 0 0 0 0 0 0.0%
2013 41 0 0 0 0 1 1 2.4%
Kodiak Tanner Bairdi Crab Pot Vessel Under 60 ft
2003 113 0 1 0 0 0 1 0.9%
2004 90 0 1 0 0 0 1 1.1% 2005 135 2 4 0 0 2 8 5.9%
2006 135 1 0 0 0 0 1 0.7%
2007 135 2 0 0 0 1 3 2.2% 2008 134 0 0 0 0 1 1 0.7%

Table 4. Summary of Emergency Transfers of Limited Entry Permits, by Permit Type, 1975‐2013
27 Emergency Transfers of Alaska’s Commercial Fisheries Limited Entry Permits, 1975 ‐ 2013
Category of Emergency Transfer Total Permit Permits ET - Total ET Type Year Issued PT IUP Estate Gov’t Other ETs Rate
Kodiak Tanner Bairdi Crab Pot Vessel Under 60 ft continued
2009 137 1 0 0 0 0 1 0.7%
2010 137 1 0 0 0 0 1 0.7% 2011 139 1 0 0 0 5 6 4.3%
2012 138 0 0 0 0 1 1 0.7%
2013 138 0 0 0 0 3 3 2.2%
Chignik Salmon Purse Seine
1975 91 1 0 2 3 3.3%
1976 91 0 0 7 7 7.7% 1977 91 0 0 6 6 6.6%
1978 95 0 1 4 5 5.3%
1979 101 0 1 3 4 4.0% 1980 101 0 1 5 6 5.9%
1981 102 0 1 5 6 5.9%
1982 102 0 1 1 2 2.0% 1983 100 1 1 5 7 7.0%
1984 100 1 2 7 10 10.0%
1985 101 4 1 8 13 12.9% 1986 100 3 1 9 13 13.0%
1987 102 4 1 6 11 10.8%
1988 101 4 2 4 10 9.9% 1989 101 5 2 6 13 12.9%
1990 101 4 2 8 14 13.9%
1991 101 5 2 3 10 9.9% 1992 101 6 2 14 22 21.8%
1993 102 7 1 3 11 10.8%
1994 100 0 7 1 0 9 17 17.0% 1995 100 0 6 1 0 12 19 19.0%
1996 101 0 7 0 0 12 19 18.8%
1997 100 0 6 0 0 6 12 12.0% 1998 100 0 6 0 0 3 9 9.0%
1999 99 0 5 0 0 4 9 9.1%
2000 99 0 5 2 0 6 13 13.1% 2001 98 0 5 1 0 5 11 11.2%
2002 100 0 5 2 0 3 10 10.0%
2003 101 2 5 0 0 3 10 9.9% 2004 100 0 5 0 0 3 8 8.0%
2005 99 0 7 0 0 5 12 12.1%
2006 95 0 3 1 0 2 6 6.3% 2007 92 0 1 1 0 5 7 7.6%
2008 92 1 1 1 0 10 13 14.1%
2009 91 1 0 1 0 14 16 17.6% 2010 91 1 0 1 0 13 15 16.5%
2011 91 2 0 3 0 9 14 15.4%
2012 91 1 0 2 0 9 12 13.2% 2013 91 1 0 1 0 7 9 9.9%
Alaska Peninsula Salmon Purse Seine
1975 123 1 0 1 2 1.6%
1976 113 0 0 3 3 2.7% 1977 113 0 0 3 3 2.7%
1978 123 0 0 4 4 3.3%
1979 123 1 0 5 6 4.9% 1980 125 1 0 5 6 4.8%
1981 127 0 0 1 1 0.8%
1982 127 0 0 3 3 2.4% 1983 127 0 0 2 2 1.6%
1984 126 2 0 2 4 3.2%
1985 127 0 0 7 7 5.5% 1986 125 1 0 2 3 2.4%
1987 125 2 0 4 6 4.8%
1988 124 0 0 3 3 2.4% 1989 126 1 0 5 6 4.8%
1990 126 1 0 4 5 4.0%
1991 126 1 0 8 9 7.1%
Category of Emergency Transfer Total Permit Permits ET - Total ET Type Year Issued PT IUP Estate Gov’t Other ETs Rate
Alaska Peninsula Salmon Purse Seine continued 1992 125 1 1 7 9 7.2%
1993 125 1 0 10 11 8.8%
1994 124 0 0 2 0 4 6 4.8% 1995 124 0 0 1 0 2 3 2.4%
1996 124 0 0 0 0 6 6 4.8%
1997 122 0 0 0 0 5 5 4.1% 1998 122 0 0 1 0 6 7 5.7%
1999 121 0 0 1 0 7 8 6.6%
2000 121 0 0 1 0 6 7 5.8% 2001 121 0 1 1 0 5 7 5.8%
2002 121 0 1 1 0 3 5 4.1%
2003 118 0 0 0 0 1 1 0.8% 2004 121 2 0 1 0 1 4 3.3%
2005 119 1 0 1 0 1 3 2.5%
2006 119 1 0 0 0 3 4 3.4% 2007 118 0 0 0 0 1 1 0.8%
2008 118 1 0 0 0 6 7 5.9%
2009 119 0 0 1 0 4 5 4.2% 2010 119 0 0 0 0 7 7 5.9%
2011 119 0 0 0 0 3 3 2.5%
2012 119 1 0 0 0 3 4 3.4% 2013 119 0 0 0 0 8 8 6.7%
Alaska Peninsula Salmon Drift Gillnet
1975 158 0 0 1 1 0.6%
1976 154 0 0 0 0 0.0% 1977 156 0 0 0 0 0.0%
1978 158 0 0 5 5 3.2%
1979 161 0 0 3 3 1.9% 1980 163 1 0 2 3 1.8%
1981 164 0 0 4 4 2.4%
1982 164 0 0 3 3 1.8% 1983 165 1 0 8 9 5.5%
1984 165 1 0 9 10 6.1%
1985 165 2 0 6 8 4.8% 1986 165 1 0 6 7 4.2%
1987 165 0 0 5 5 3.0%
1988 163 0 0 7 7 4.3% 1989 164 1 0 3 4 2.4%
1990 164 0 0 6 6 3.7%
1991 164 1 0 11 12 7.3% 1992 164 1 0 7 8 4.9%
1993 164 1 1 6 8 4.9%
1994 164 0 1 0 0 10 11 6.7% 1995 164 0 2 1 0 6 9 5.5%
1996 164 2 4 0 0 11 17 10.4%
1997 164 2 3 0 0 11 16 9.8% 1998 164 1 2 0 0 17 20 12.2%
1999 164 1 2 0 0 15 18 11.0%
2000 161 0 1 0 0 8 9 5.6% 2001 160 0 0 0 0 7 7 4.4%
2002 160 1 0 0 0 6 7 4.4%
2003 160 0 0 0 0 9 9 5.6% 2004 161 1 0 0 0 11 12 7.5%
2005 162 0 0 0 0 8 8 4.9%
2006 162 0 0 0 0 8 8 4.9% 2007 162 0 0 0 0 8 8 4.9%
2008 162 1 0 2 0 10 13 8.0%
2009 162 0 0 0 0 10 10 6.2% 2010 162 2 0 1 0 4 7 4.3%
2011 162 0 0 2 0 3 5 3.1%
2012 162 1 0 1 0 7 9 5.6% 2013 162 1 0 2 0 5 8 4.9%
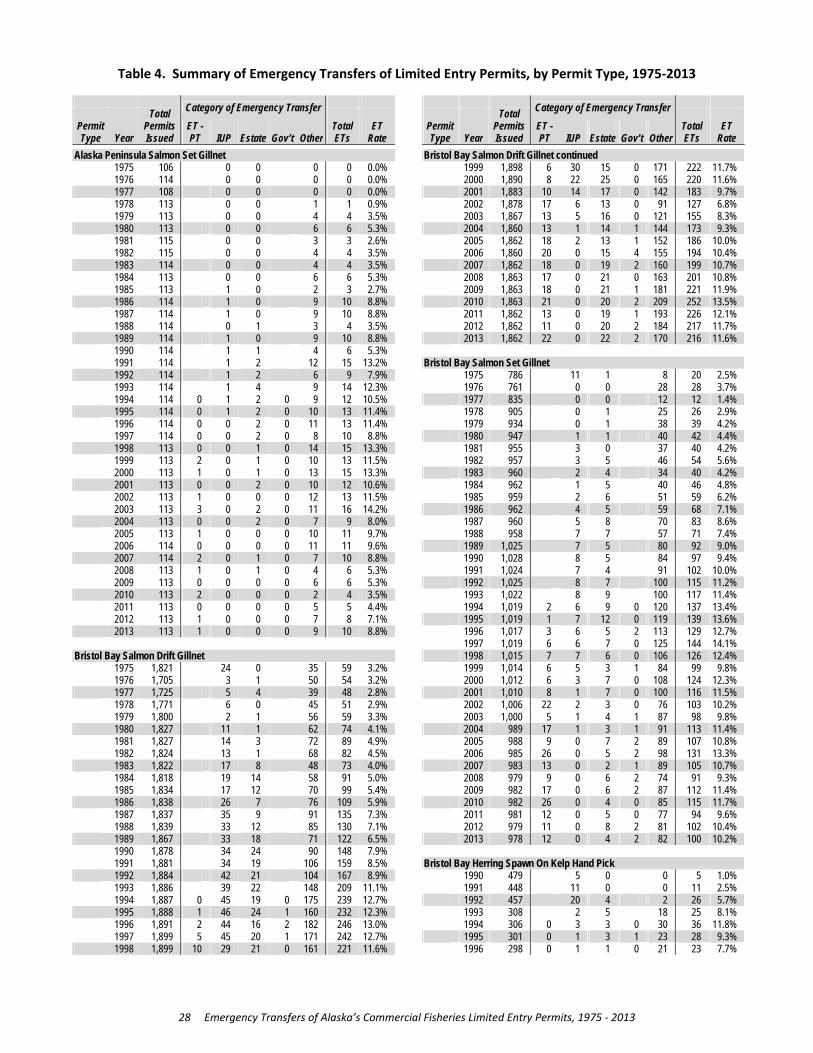
Table 4. Summary of Emergency Transfers of Limited Entry Permits, by Permit Type, 1975‐2013
28 Emergency Transfers of Alaska’s Commercial Fisheries Limited Entry Permits, 1975 ‐ 2013
Category of Emergency Transfer Total Permit Permits ET - Total ET Type Year Issued PT IUP Estate Gov’t Other ETs Rate
Alaska Peninsula Salmon Set Gillnet
1975 106 0 0 0 0 0.0%
1976 114 0 0 0 0 0.0% 1977 108 0 0 0 0 0.0%
1978 113 0 0 1 1 0.9%
1979 113 0 0 4 4 3.5% 1980 113 0 0 6 6 5.3%
1981 115 0 0 3 3 2.6%
1982 115 0 0 4 4 3.5% 1983 114 0 0 4 4 3.5%
1984 113 0 0 6 6 5.3%
1985 113 1 0 2 3 2.7% 1986 114 1 0 9 10 8.8%
1987 114 1 0 9 10 8.8%
1988 114 0 1 3 4 3.5% 1989 114 1 0 9 10 8.8%
1990 114 1 1 4 6 5.3%
1991 114 1 2 12 15 13.2% 1992 114 1 2 6 9 7.9%
1993 114 1 4 9 14 12.3%
1994 114 0 1 2 0 9 12 10.5% 1995 114 0 1 2 0 10 13 11.4%
1996 114 0 0 2 0 11 13 11.4%
1997 114 0 0 2 0 8 10 8.8% 1998 113 0 0 1 0 14 15 13.3%
1999 113 2 0 1 0 10 13 11.5%
2000 113 1 0 1 0 13 15 13.3% 2001 113 0 0 2 0 10 12 10.6%
2002 113 1 0 0 0 12 13 11.5%
2003 113 3 0 2 0 11 16 14.2% 2004 113 0 0 2 0 7 9 8.0%
2005 113 1 0 0 0 10 11 9.7%
2006 114 0 0 0 0 11 11 9.6% 2007 114 2 0 1 0 7 10 8.8%
2008 113 1 0 1 0 4 6 5.3%
2009 113 0 0 0 0 6 6 5.3% 2010 113 2 0 0 0 2 4 3.5%
2011 113 0 0 0 0 5 5 4.4%
2012 113 1 0 0 0 7 8 7.1% 2013 113 1 0 0 0 9 10 8.8%
Bristol Bay Salmon Drift Gillnet
1975 1,821 24 0 35 59 3.2%
1976 1,705 3 1 50 54 3.2% 1977 1,725 5 4 39 48 2.8%
1978 1,771 6 0 45 51 2.9%
1979 1,800 2 1 56 59 3.3% 1980 1,827 11 1 62 74 4.1%
1981 1,827 14 3 72 89 4.9%
1982 1,824 13 1 68 82 4.5% 1983 1,822 17 8 48 73 4.0%
1984 1,818 19 14 58 91 5.0%
1985 1,834 17 12 70 99 5.4% 1986 1,838 26 7 76 109 5.9%
1987 1,837 35 9 91 135 7.3%
1988 1,839 33 12 85 130 7.1% 1989 1,867 33 18 71 122 6.5%
1990 1,878 34 24 90 148 7.9%
1991 1,881 34 19 106 159 8.5% 1992 1,884 42 21 104 167 8.9%
1993 1,886 39 22 148 209 11.1%
1994 1,887 0 45 19 0 175 239 12.7% 1995 1,888 1 46 24 1 160 232 12.3%
1996 1,891 2 44 16 2 182 246 13.0%
1997 1,899 5 45 20 1 171 242 12.7% 1998 1,899 10 29 21 0 161 221 11.6%
Category of Emergency Transfer Total Permit Permits ET - Total ET Type Year Issued PT IUP Estate Gov’t Other ETs Rate
Bristol Bay Salmon Drift Gillnet continued
1999 1,898 6 30 15 0 171 222 11.7%
2000 1,890 8 22 25 0 165 220 11.6% 2001 1,883 10 14 17 0 142 183 9.7%
2002 1,878 17 6 13 0 91 127 6.8%
2003 1,867 13 5 16 0 121 155 8.3% 2004 1,860 13 1 14 1 144 173 9.3%
2005 1,862 18 2 13 1 152 186 10.0%
2006 1,860 20 0 15 4 155 194 10.4% 2007 1,862 18 0 19 2 160 199 10.7%
2008 1,863 17 0 21 0 163 201 10.8%
2009 1,863 18 0 21 1 181 221 11.9% 2010 1,863 21 0 20 2 209 252 13.5%
2011 1,862 13 0 19 1 193 226 12.1%
2012 1,862 11 0 20 2 184 217 11.7% 2013 1,862 22 0 22 2 170 216 11.6%
Bristol Bay Salmon Set Gillnet
1975 786 11 1 8 20 2.5%
1976 761 0 0 28 28 3.7% 1977 835 0 0 12 12 1.4%
1978 905 0 1 25 26 2.9%
1979 934 0 1 38 39 4.2% 1980 947 1 1 40 42 4.4%
1981 955 3 0 37 40 4.2%
1982 957 3 5 46 54 5.6% 1983 960 2 4 34 40 4.2%
1984 962 1 5 40 46 4.8%
1985 959 2 6 51 59 6.2% 1986 962 4 5 59 68 7.1%
1987 960 5 8 70 83 8.6%
1988 958 7 7 57 71 7.4% 1989 1,025 7 5 80 92 9.0%
1990 1,028 8 5 84 97 9.4%
1991 1,024 7 4 91 102 10.0% 1992 1,025 8 7 100 115 11.2%
1993 1,022 8 9 100 117 11.4%
1994 1,019 2 6 9 0 120 137 13.4% 1995 1,019 1 7 12 0 119 139 13.6%
1996 1,017 3 6 5 2 113 129 12.7%
1997 1,019 6 6 7 0 125 144 14.1% 1998 1,015 7 7 6 0 106 126 12.4%
1999 1,014 6 5 3 1 84 99 9.8%
2000 1,012 6 3 7 0 108 124 12.3% 2001 1,010 8 1 7 0 100 116 11.5%
2002 1,006 22 2 3 0 76 103 10.2%
2003 1,000 5 1 4 1 87 98 9.8% 2004 989 17 1 3 1 91 113 11.4%
2005 988 9 0 7 2 89 107 10.8%
2006 985 26 0 5 2 98 131 13.3% 2007 983 13 0 2 1 89 105 10.7%
2008 979 9 0 6 2 74 91 9.3%
2009 982 17 0 6 2 87 112 11.4% 2010 982 26 0 4 0 85 115 11.7%
2011 981 12 0 5 0 77 94 9.6%
2012 979 11 0 8 2 81 102 10.4% 2013 978 12 0 4 2 82 100 10.2%
Bristol Bay Herring Spawn On Kelp Hand Pick
1990 479 5 0 0 5 1.0%
1991 448 11 0 0 11 2.5% 1992 457 20 4 2 26 5.7%
1993 308 2 5 18 25 8.1%
1994 306 0 3 3 0 30 36 11.8% 1995 301 0 1 3 1 23 28 9.3%
1996 298 0 1 1 0 21 23 7.7%

Table 4. Summary of Emergency Transfers of Limited Entry Permits, by Permit Type, 1975‐2013
29 Emergency Transfers of Alaska’s Commercial Fisheries Limited Entry Permits, 1975 ‐ 2013
Category of Emergency Transfer Total Permit Permits ET - Total ET Type Year Issued PT IUP Estate Gov’t Other ETs Rate
Bristol Bay Herring Spawn On Kelp Hand Pick continued
1997 296 0 2 3 0 22 27 9.1% 1998 292 1 2 2 0 21 26 8.9%
1999 290 0 1 3 0 15 19 6.6%
2000 290 2 2 2 0 22 28 9.7% 2001 289 2 4 1 0 19 26 9.0%
2002 287 2 1 0 0 4 7 2.4%
2003 286 0 1 1 0 6 8 2.8% 2004 265 0 1 1 0 4 6 2.3%
2005 267 1 1 0 0 1 3 1.1%
2006 268 0 0 0 0 0 0 0.0% 2007 266 0 0 0 0 0 0 0.0%
2008 266 0 0 0 0 0 0 0.0%
2009 265 0 0 0 0 0 0 0.0% 2010 266 0 0 0 0 0 0 0.0%
2011 266 0 0 0 0 0 0 0.0%
2012 266 0 0 0 0 0 0 0.0% 2013 266 0 0 0 0 0 0 0.0%
Goodnews Bay Herring Gillnet
1998 155 0 0 0 0 0 0 0.0%
1999 148 0 1 0 0 0 1 0.7% 2000 151 0 0 0 0 2 2 1.3%
2001 176 1 1 1 0 1 4 2.3%
2002 172 0 0 0 0 1 1 0.6% 2003 175 0 0 0 0 0 0 0.0%
2004 163 0 0 0 0 0 0 0.0%
2005 152 1 0 0 0 0 1 0.7% 2006 138 0 0 0 0 0 0 0.0%
2007 127 0 0 0 0 0 0 0.0%
2008 127 0 0 0 0 0 0 0.0% 2009 127 0 0 0 0 0 0 0.0%
2010 128 0 0 0 0 1 1 0.8%
2011 120 0 0 0 0 0 0 0.0% 2012 119 0 0 0 0 0 0 0.0%
2013 120 0 0 0 0 1 1 0.8%
Kuskokwim Salmon Gillnet
1976 987 3 0 3 6 0.6%
1977 836 1 1 9 11 1.3% 1978 837 4 3 12 19 2.3%
1979 814 3 1 15 19 2.3%
1980 817 0 1 14 15 1.8% 1981 829 4 0 10 14 1.7%
1982 836 1 2 18 21 2.5%
1983 835 0 2 15 17 2.0% 1984 835 0 7 15 22 2.6%
1985 834 0 7 19 26 3.1%
1986 833 0 6 21 27 3.2% 1987 832 0 3 30 33 4.0%
1988 831 1 4 29 34 4.1%
1989 831 1 7 25 33 4.0% 1990 833 2 8 24 34 4.1%
1991 833 2 8 28 38 4.6%
1992 833 2 8 26 36 4.3% 1993 832 2 9 30 41 4.9%
1994 832 0 2 5 0 41 48 5.8%
1995 832 2 2 6 0 27 37 4.4% 1996 830 1 1 4 0 19 25 3.0%
1997 828 1 0 4 0 16 21 2.5%
1998 828 5 1 3 1 13 23 2.8% 1999 827 6 1 2 0 13 22 2.7%
2000 823 6 2 4 0 14 26 3.2%
2001 818 1 2 2 0 14 19 2.3% 2002 817 7 2 1 0 11 21 2.6%
2003 796 6 2 0 0 3 11 1.4%
Category of Emergency Transfer Total Permit Permits ET - Total ET Type Year Issued PT IUP Estate Gov’t Other ETs Rate
Kuskokwim Salmon Gillnet continued
2004 780 8 1 3 1 8 21 2.7% 2005 770 9 0 2 0 7 18 2.3%
2006 765 11 0 1 1 5 18 2.4%
2007 762 5 0 3 1 4 13 1.7% 2008 753 8 0 2 0 5 15 2.0%
2009 742 19 0 2 0 7 28 3.8%
2010 741 18 0 2 0 14 34 4.6% 2011 732 15 0 2 0 8 25 3.4%
2012 724 8 0 3 0 11 22 3.0%
2013 723 8 0 6 1 11 26 3.6%
Nelson Island Herring Gillnet
1988 181 0 0 0 0 0.0%
1989 183 4 0 0 4 2.2% 1990 165 1 0 0 1 0.6%
1991 149 3 0 0 3 2.0%
1992 149 0 0 0 0 0.0% 1993 158 1 0 0 1 0.6%
1994 163 0 2 0 0 1 3 1.8%
1995 161 0 2 0 0 3 5 3.1% 1996 161 0 1 1 0 3 5 3.1%
1997 161 0 2 0 0 3 5 3.1%
1998 158 0 1 0 0 3 4 2.5% 1999 162 0 1 0 0 4 5 3.1%
2000 160 0 0 0 0 2 2 1.3%
2001 156 3 0 0 0 1 4 2.6% 2002 157 1 1 0 0 0 2 1.3%
2003 146 1 0 0 0 0 1 0.7%
2004 134 1 0 0 0 0 1 0.7% 2005 126 1 0 0 0 0 1 0.8%
2006 128 0 0 0 0 0 0 0.0%
2007 120 0 0 0 0 0 0 0.0% 2008 119 0 0 0 0 0 0 0.0%
2009 137 0 0 0 0 0 0 0.0%
2010 137 0 0 0 0 0 0 0.0% 2011 127 0 0 0 0 0 0 0.0%
2012 127 0 0 0 0 0 0 0.0%
2013 129 1 0 0 0 0 1 0.8%
Nunivak Island Herring Gillnet
1988 60 0 0 0 0 0.0%
1989 55 1 0 0 1 1.8% 1990 47 0 0 0 0 0.0%
1991 50 1 0 0 1 2.0%
1992 52 0 0 0 0 0.0% 1993 51 0 0 0 0 0.0%
1994 53 0 0 0 0 0 0 0.0%
1995 54 0 0 0 0 0 0 0.0% 1996 53 0 0 1 0 0 1 1.9%
1997 52 0 0 0 0 0 0 0.0%
1998 54 0 0 0 0 0 0 0.0% 1999 53 0 0 0 0 0 0 0.0%
2000 53 1 0 0 0 0 1 1.9%
2001 51 0 0 0 0 0 0 0.0% 2002 51 0 0 0 0 0 0 0.0%
2003 47 1 0 0 0 0 1 2.1%
2004 51 0 0 0 0 0 0 0.0% 2005 46 0 0 0 0 0 0 0.0%
2006 36 0 0 0 0 0 0 0.0%
2007 36 0 0 0 0 0 0 0.0% 2008 36 0 0 0 0 0 0 0.0%
2009 36 0 0 0 0 0 0 0.0%
2010 36 0 0 0 0 0 0 0.0% 2011 36 0 0 0 0 0 0 0.0%
2012 36 0 0 0 0 0 0 0.0%
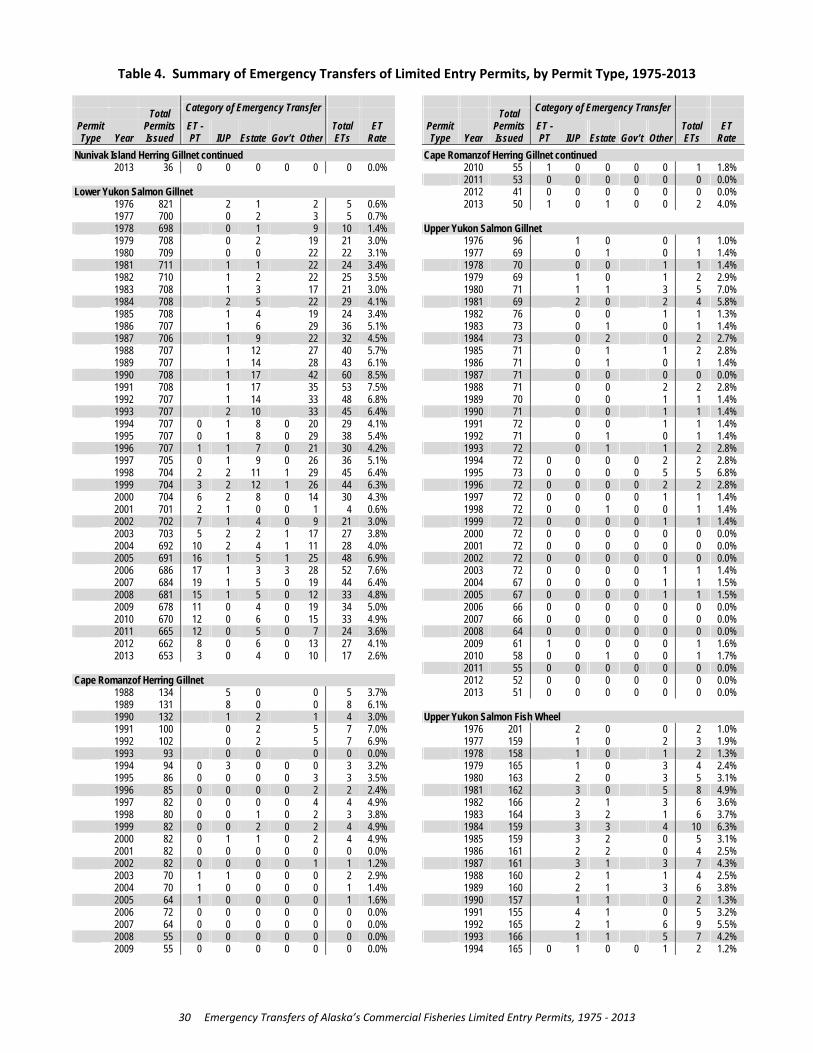
Table 4. Summary of Emergency Transfers of Limited Entry Permits, by Permit Type, 1975‐2013
30 Emergency Transfers of Alaska’s Commercial Fisheries Limited Entry Permits, 1975 ‐ 2013
Category of Emergency Transfer Total Permit Permits ET - Total ET Type Year Issued PT IUP Estate Gov’t Other ETs Rate
Nunivak Island Herring Gillnet continued
2013 36 0 0 0 0 0 0 0.0%
Lower Yukon Salmon Gillnet
1976 821 2 1 2 5 0.6%
1977 700 0 2 3 5 0.7% 1978 698 0 1 9 10 1.4%
1979 708 0 2 19 21 3.0%
1980 709 0 0 22 22 3.1% 1981 711 1 1 22 24 3.4%
1982 710 1 2 22 25 3.5%
1983 708 1 3 17 21 3.0% 1984 708 2 5 22 29 4.1%
1985 708 1 4 19 24 3.4%
1986 707 1 6 29 36 5.1% 1987 706 1 9 22 32 4.5%
1988 707 1 12 27 40 5.7%
1989 707 1 14 28 43 6.1% 1990 708 1 17 42 60 8.5%
1991 708 1 17 35 53 7.5%
1992 707 1 14 33 48 6.8% 1993 707 2 10 33 45 6.4%
1994 707 0 1 8 0 20 29 4.1%
1995 707 0 1 8 0 29 38 5.4% 1996 707 1 1 7 0 21 30 4.2%
1997 705 0 1 9 0 26 36 5.1%
1998 704 2 2 11 1 29 45 6.4% 1999 704 3 2 12 1 26 44 6.3%
2000 704 6 2 8 0 14 30 4.3%
2001 701 2 1 0 0 1 4 0.6% 2002 702 7 1 4 0 9 21 3.0%
2003 703 5 2 2 1 17 27 3.8%
2004 692 10 2 4 1 11 28 4.0% 2005 691 16 1 5 1 25 48 6.9%
2006 686 17 1 3 3 28 52 7.6%
2007 684 19 1 5 0 19 44 6.4% 2008 681 15 1 5 0 12 33 4.8%
2009 678 11 0 4 0 19 34 5.0%
2010 670 12 0 6 0 15 33 4.9% 2011 665 12 0 5 0 7 24 3.6%
2012 662 8 0 6 0 13 27 4.1%
2013 653 3 0 4 0 10 17 2.6%
Cape Romanzof Herring Gillnet
1988 134 5 0 0 5 3.7%
1989 131 8 0 0 8 6.1% 1990 132 1 2 1 4 3.0%
1991 100 0 2 5 7 7.0%
1992 102 0 2 5 7 6.9% 1993 93 0 0 0 0 0.0%
1994 94 0 3 0 0 0 3 3.2%
1995 86 0 0 0 0 3 3 3.5% 1996 85 0 0 0 0 2 2 2.4%
1997 82 0 0 0 0 4 4 4.9%
1998 80 0 0 1 0 2 3 3.8% 1999 82 0 0 2 0 2 4 4.9%
2000 82 0 1 1 0 2 4 4.9%
2001 82 0 0 0 0 0 0 0.0% 2002 82 0 0 0 0 1 1 1.2%
2003 70 1 1 0 0 0 2 2.9%
2004 70 1 0 0 0 0 1 1.4% 2005 64 1 0 0 0 0 1 1.6%
2006 72 0 0 0 0 0 0 0.0%
2007 64 0 0 0 0 0 0 0.0% 2008 55 0 0 0 0 0 0 0.0%
2009 55 0 0 0 0 0 0 0.0%
Category of Emergency Transfer Total Permit Permits ET - Total ET Type Year Issued PT IUP Estate Gov’t Other ETs Rate
Cape Romanzof Herring Gillnet continued
2010 55 1 0 0 0 0 1 1.8% 2011 53 0 0 0 0 0 0 0.0%
2012 41 0 0 0 0 0 0 0.0%
2013 50 1 0 1 0 0 2 4.0%
Upper Yukon Salmon Gillnet
1976 96 1 0 0 1 1.0%
1977 69 0 1 0 1 1.4% 1978 70 0 0 1 1 1.4%
1979 69 1 0 1 2 2.9%
1980 71 1 1 3 5 7.0% 1981 69 2 0 2 4 5.8%
1982 76 0 0 1 1 1.3%
1983 73 0 1 0 1 1.4% 1984 73 0 2 0 2 2.7%
1985 71 0 1 1 2 2.8%
1986 71 0 1 0 1 1.4% 1987 71 0 0 0 0 0.0%
1988 71 0 0 2 2 2.8%
1989 70 0 0 1 1 1.4% 1990 71 0 0 1 1 1.4%
1991 72 0 0 1 1 1.4%
1992 71 0 1 0 1 1.4% 1993 72 0 1 1 2 2.8%
1994 72 0 0 0 0 2 2 2.8%
1995 73 0 0 0 0 5 5 6.8% 1996 72 0 0 0 0 2 2 2.8%
1997 72 0 0 0 0 1 1 1.4%
1998 72 0 0 1 0 0 1 1.4% 1999 72 0 0 0 0 1 1 1.4%
2000 72 0 0 0 0 0 0 0.0%
2001 72 0 0 0 0 0 0 0.0% 2002 72 0 0 0 0 0 0 0.0%
2003 72 0 0 0 0 1 1 1.4%
2004 67 0 0 0 0 1 1 1.5% 2005 67 0 0 0 0 1 1 1.5%
2006 66 0 0 0 0 0 0 0.0%
2007 66 0 0 0 0 0 0 0.0% 2008 64 0 0 0 0 0 0 0.0%
2009 61 1 0 0 0 0 1 1.6%
2010 58 0 0 1 0 0 1 1.7% 2011 55 0 0 0 0 0 0 0.0%
2012 52 0 0 0 0 0 0 0.0%
2013 51 0 0 0 0 0 0 0.0%
Upper Yukon Salmon Fish Wheel
1976 201 2 0 0 2 1.0%
1977 159 1 0 2 3 1.9% 1978 158 1 0 1 2 1.3%
1979 165 1 0 3 4 2.4%
1980 163 2 0 3 5 3.1% 1981 162 3 0 5 8 4.9%
1982 166 2 1 3 6 3.6%
1983 164 3 2 1 6 3.7% 1984 159 3 3 4 10 6.3%
1985 159 3 2 0 5 3.1%
1986 161 2 2 0 4 2.5% 1987 161 3 1 3 7 4.3%
1988 160 2 1 1 4 2.5%
1989 160 2 1 3 6 3.8% 1990 157 1 1 0 2 1.3%
1991 155 4 1 0 5 3.2%
1992 165 2 1 6 9 5.5% 1993 166 1 1 5 7 4.2%
1994 165 0 1 0 0 1 2 1.2%

Table 4. Summary of Emergency Transfers of Limited Entry Permits, by Permit Type, 1975‐2013
31 Emergency Transfers of Alaska’s Commercial Fisheries Limited Entry Permits, 1975 ‐ 2013
Category of Emergency Transfer Total Permit Permits ET - Total ET Type Year Issued PT IUP Estate Gov’t Other ETs Rate
Upper Yukon Salmon Fish Wheel continued
1995 166 1 1 0 0 3 5 3.0% 1996 165 0 1 1 0 2 4 2.4%
1997 163 0 1 1 0 1 3 1.8%
1998 162 0 1 2 0 1 4 2.5% 1999 162 0 1 0 0 0 1 0.6%
2000 161 0 1 1 0 1 3 1.9%
2001 157 0 0 0 0 0 0 0.0% 2002 156 0 0 1 0 0 1 0.6%
2003 157 0 0 0 0 0 0 0.0%
2004 137 0 0 0 0 0 0 0.0% 2005 135 1 0 0 0 0 1 0.7%
2006 128 1 0 0 0 2 3 2.3%
2007 124 1 0 0 0 2 3 2.4% 2008 124 0 0 0 0 2 2 1.6%
2009 122 0 0 0 0 0 0 0.0%
2010 115 0 0 0 0 2 2 1.7% 2011 115 1 0 0 0 1 2 1.7%
2012 106 0 0 2 0 2 4 3.8%
2013 103 1 0 0 0 1 2 1.9%
Norton Sound Salmon Gillnet
1976 263 0 0 1 1 0.4%
1977 208 0 0 1 1 0.5% 1978 199 0 0 1 1 0.5%
1979 200 0 1 8 9 4.5%
1980 201 0 1 2 3 1.5% 1981 200 0 4 3 7 3.5%
1982 203 0 2 4 6 3.0%
1983 203 0 5 5 10 4.9% 1984 204 2 1 7 10 4.9%
1985 205 2 0 9 11 5.4%
1986 203 1 1 3 5 2.5% 1987 202 0 0 6 6 3.0%
1988 202 0 2 7 9 4.5%
1989 202 0 1 5 6 3.0% 1990 201 0 4 5 9 4.5%
1991 201 0 2 7 9 4.5%
1992 201 0 4 6 10 5.0% 1993 200 0 1 4 5 2.5%
1994 201 0 0 2 0 4 6 3.0%
1995 199 1 0 2 0 8 11 5.5% 1996 199 0 0 1 0 2 3 1.5%
1997 198 1 0 1 0 5 7 3.5%
1998 197 2 0 2 0 6 10 5.1% 1999 194 2 0 0 0 3 5 2.6%
2000 193 4 0 0 0 2 6 3.1%
2001 190 0 0 0 0 1 1 0.5% 2002 185 0 0 0 0 0 0 0.0%
2003 180 0 0 0 0 0 0 0.0%
2004 162 1 0 0 0 2 3 1.9% 2005 154 0 0 0 0 1 1 0.6%
2006 154 2 0 0 0 2 4 2.6%
2007 155 0 0 0 0 3 3 1.9% 2008 167 8 0 1 0 7 16 9.6%
2009 168 9 0 0 0 3 12 7.1%
2010 173 8 0 3 0 6 17 9.8% 2011 178 5 0 3 0 6 14 7.9%
2012 182 7 0 1 0 6 14 7.7%
2013 181 4 0 0 0 3 7 3.9%
Norton Sound Herring Beach Seine
1988 13 1 0 0 1 7.7%
1989 13 1 0 0 1 7.7% 1990 13 0 0 0 0 0.0%
1991 11 2 0 0 2 18.2%
Category of Emergency Transfer Total Permit Permits ET - Total ET Type Year Issued PT IUP Estate Gov’t Other ETs Rate
Norton Sound Herring Beach Seine continued
1992 10 1 0 0 1 10.0% 1993 9 1 0 0 1 11.1%
1994 9 0 2 0 0 0 2 22.2%
1995 9 0 2 0 0 0 2 22.2% 1996 11 0 1 0 0 0 1 9.1%
1997 10 0 1 1 0 0 2 20.0%
1998 10 0 1 1 0 0 2 20.0% 1999 8 0 1 0 0 1 2 25.0%
2000 8 0 1 0 0 1 2 25.0%
2001 8 0 1 0 0 0 1 12.5% 2002 7 0 0 0 0 0 0 0.0%
2003 6 0 0 0 0 0 0 0.0%
2004 4 0 0 0 0 0 0 0.0% 2005 4 0 0 0 0 0 0 0.0%
2006 4 0 0 0 0 0 0 0.0%
2007 4 0 0 0 0 0 0 0.0% 2008 3 0 0 0 0 0 0 0.0%
2009 5 0 0 0 0 0 0 0.0%
2010 6 0 0 0 0 0 0 0.0% 2011 6 0 0 0 0 0 0 0.0%
2012 8 0 0 0 0 0 0 0.0%
2013 8 0 0 0 0 0 0 0.0%
Norton Sound Herring Gillnet
1988 461 5 0 0 5 1.1%
1989 475 13 0 0 13 2.7% 1990 480 12 2 3 17 3.5%
1991 401 5 2 7 14 3.5%
1992 362 8 2 6 16 4.4% 1993 324 5 4 4 13 4.0%
1994 325 0 4 1 0 10 15 4.6%
1995 318 1 4 0 0 9 14 4.4% 1996 327 4 7 0 0 8 19 5.8%
1997 320 0 5 0 0 8 13 4.1%
1998 308 0 3 0 0 0 3 1.0% 1999 298 3 5 0 0 11 19 6.4%
2000 291 1 2 0 0 2 5 1.7%
2001 286 1 4 0 0 2 7 2.4% 2002 283 0 4 1 0 0 5 1.8%
2003 273 0 3 1 0 1 5 1.8%
2004 259 0 0 0 0 0 0 0.0% 2005 262 1 1 0 0 1 3 1.1%
2006 268 0 0 0 0 3 3 1.1%
2007 255 0 0 0 0 0 0 0.0% 2008 249 0 0 1 0 1 2 0.8%
2009 251 1 0 0 0 0 1 0.4%
2010 257 1 0 1 0 4 6 2.3% 2011 263 3 0 2 0 1 6 2.3%
2012 264 0 0 1 0 0 1 0.4%
2013 262 1 0 1 0 1 3 1.1%
Kotzebue Salmon Gillnet
1976 272 6 0 1 7 2.6%
1977 234 2 1 8 11 4.7% 1978 233 2 1 6 9 3.9%
1979 204 0 0 6 6 2.9%
1980 201 0 0 5 5 2.5% 1981 214 0 0 7 7 3.3%
1982 223 1 1 13 15 6.7%
1983 222 0 1 8 9 4.1% 1984 221 0 1 4 5 2.3%
1985 221 0 3 5 8 3.6%
1986 221 0 4 13 17 7.7% 1987 220 0 4 6 10 4.5%
1988 220 0 1 9 10 4.5%
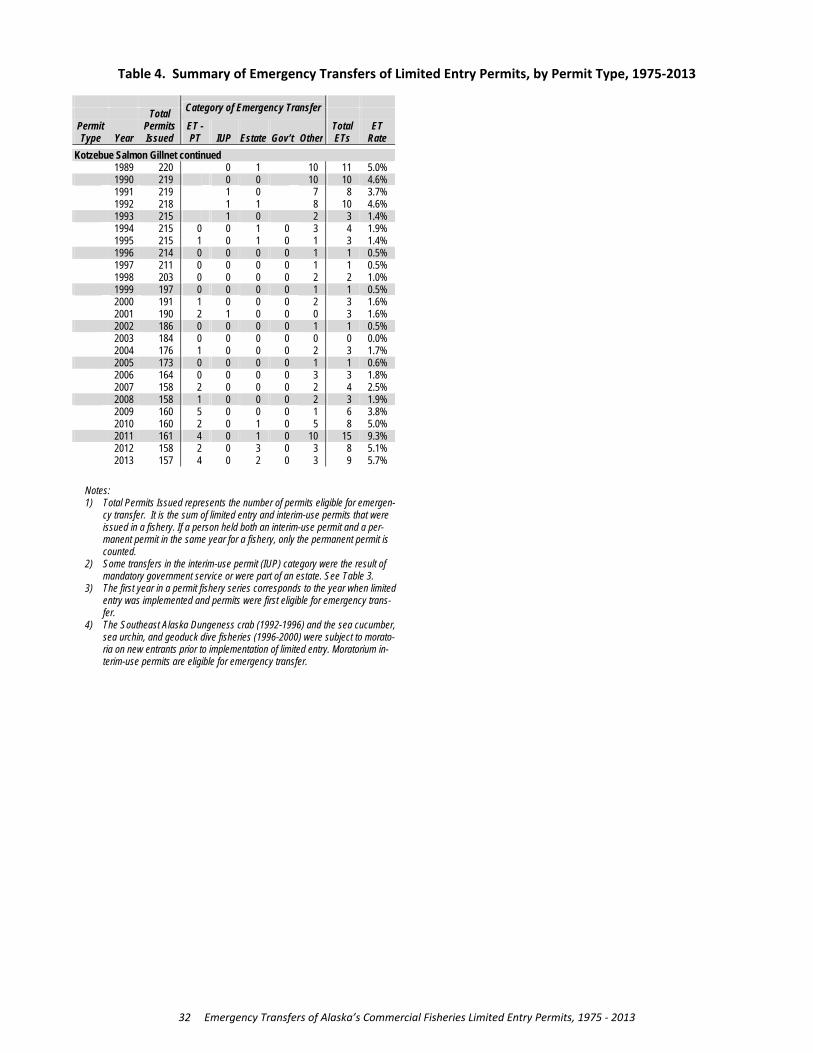
Table 4. Summary of Emergency Transfers of Limited Entry Permits, by Permit Type, 1975‐2013
32 Emergency Transfers of Alaska’s Commercial Fisheries Limited Entry Permits, 1975 ‐ 2013
Category of Emergency Transfer Total Permit Permits ET - Total ET Type Year Issued PT IUP Estate Gov’t Other ETs Rate
Kotzebue Salmon Gillnet continued
1989 220 0 1 10 11 5.0% 1990 219 0 0 10 10 4.6%
1991 219 1 0 7 8 3.7%
1992 218 1 1 8 10 4.6% 1993 215 1 0 2 3 1.4%
1994 215 0 0 1 0 3 4 1.9%
1995 215 1 0 1 0 1 3 1.4% 1996 214 0 0 0 0 1 1 0.5%
1997 211 0 0 0 0 1 1 0.5%
1998 203 0 0 0 0 2 2 1.0% 1999 197 0 0 0 0 1 1 0.5%
2000 191 1 0 0 0 2 3 1.6%
2001 190 2 1 0 0 0 3 1.6% 2002 186 0 0 0 0 1 1 0.5%
2003 184 0 0 0 0 0 0 0.0%
2004 176 1 0 0 0 2 3 1.7% 2005 173 0 0 0 0 1 1 0.6%
2006 164 0 0 0 0 3 3 1.8%
2007 158 2 0 0 0 2 4 2.5% 2008 158 1 0 0 0 2 3 1.9%
2009 160 5 0 0 0 1 6 3.8%
2010 160 2 0 1 0 5 8 5.0% 2011 161 4 0 1 0 10 15 9.3%
2012 158 2 0 3 0 3 8 5.1%
2013 157 4 0 2 0 3 9 5.7%
Notes: 1) Total Permits Issued represents the number of permits eligible for emergen-
cy transfer. It is the sum of limited entry and interim-use permits that were issued in a fishery. If a person held both an interim-use permit and a per-manent permit in the same year for a fishery, only the permanent permit is counted.
2) Some transfers in the interim-use permit (IUP) category were the result of mandatory government service or were part of an estate. See Table 3.
3) The first year in a permit fishery series corresponds to the year when limited entry was implemented and permits were first eligible for emergency trans-fer.
4) The Southeast Alaska Dungeness crab (1992-1996) and the sea cucumber, sea urchin, and geoduck dive fisheries (1996-2000) were subject to morato-ria on new entrants prior to implementation of limited entry. Moratorium in-terim-use permits are eligible for emergency transfer.

33 Emergency Transfers of Alaska’s Commercial Fisheries Limited Entry Permits, 1975 ‐ 2013
Emergency Transfers of One or More Years
Table 5: Consecutive Years of Emergency Transfers, by Permit Type, 1994‐2013
Previous sections of this report discuss the circumstances where an individual might be allowed to emergency transfer a permit repeatedly for more than one year. Briefly, emergency transfers are au‐thorized for up to two years if a person has a medical condition that persists into the second year. New and unexpected medical conditions might also give rise to repeated emergency transfers. Required mili‐tary or other government service, or issues involving the settlement of a permit holder’s estate are oth‐er potential reasons where a permit could be emergency transferred across consecutive years. Individ‐uals who hold interim‐use permits in limited fisheries might transfer their IUPs for more than one con‐secutive year, and Wassillie class members who received permits were granted a status that allowed them to repeatedly transfer their permits.
Emergency transfers that are used to facilitate a permanent transfer (ET‐PT) are often associated with repeat transfers. A common scenario involves individuals who suffer a medical condition(s) that pre‐vents them from fishing for one or two years. Following this, the individual might decide to permanent‐ly transfer away their permit, but to facilitate the transaction they need to request an ET‐PT. This would result in emergency transfers over consecutive years.
Table 5 indicates the scope of consecutive emergency transfers. To assess repeat transfers, the data was examined for each unique person / permit combination. The third column (Year 1) indicates the number of permits that were emergency transferred by persons who did not ET their permit in the im‐mediately preceding year. The fourth column (Year 2) shows the number of unique person/permit com‐binations that were in their second consecutive year of emergency transfer. The fifth column (Year 3) shows person/permits with three years of repeated emergency transfers, etc.
Note that some permits are emergency transferred to more than one individual in a year. In roughly 1 in 30 occasions, a person will emergency transfer their permit, then have to withdraw the transfer and is‐sue a second one to a different individual later in the same year. In Table 5, these instances are not in‐cluded as “repeat transfers” because they occur in the same year. This methodology also accounts for the slight differences in the sum of transfers between Table 5 in this section and Tables 2 and 4 in the previous section.
Also note that Table 5 will slightly over‐estimate repeat transfers for fisheries with seasons that begin late in the year and cross over into the next calendar year. Most commonly, this applies to the salmon hand and power troll fisheries and the Southeast geoduck dive fishery. For example, to emergency transfer a geoduck dive permit for an entire season, an individual might transfer their permit for the portion of the fishery that occurs in December; then, to continue the ET, they would need to request a second transfer for the remaining part of the season in January of the next year. Transfers of this type will slightly inflate the figures for repeat transfers in Table 5.
The time‐series in the table extends back to 1994, when the survey portion of the current emergency form began. If no emergency transfers have occurred in a particular permit fishery, it will not be listed in the table.

34 Emergency Transfers of Alaska’s Commercial Fisheries Limited Entry Permits, 1975 ‐ 2013
On average, 37.9% of the emergency transfers in a year were also transferred in one or more of the pre‐vious years. The number and percentage of ETs that occurred for four or more continuous years was highest in the mid‐1990s and peaked in 1999 at 15.8% of all emergency transfers; this percentage has subsequently dropped, and has ranged from 10.0% to 11.5% over the last three years. The decrease might be related to a drop in the number of Wassillie class members who held permits, as well as a gen‐eral reduction in the number of interim‐use permits in all fisheries. Emergency transfers of interim‐use permits are subject to a less rigorous regulatory standard than emergency transfers of permanent per‐mits, and may lead to repeated transfers.
The highest rates of consecutive emergency transfers have been for permits in the Southeast Alaska sa‐blefish fisheries and king crab fisheries. Again, this may be related to a proportionally high number of interim‐use permits. Economic returns to permit holders might also influence the rates of emergency transfers, as these fisheries are characterized by relatively high ex‐vessel earnings and high permit val‐ues.

Table 5. Consecutive Years of Emergency Transfers of Limited Entry Permits, by Permit Type, 1994‐2013
35 Emergency Transfers of Alaska’s Commercial Fisheries Limited Entry Permits, 1975 ‐ 2013
Table 5. Consecutive Years of Emergency Transfers of Limited Entry Permits, by Permit Type, 1994-2013
Permit / Person Transferors Consecutive Years Transferred
Permit Type Year 1 2 3 4+ All Permit Fisheries 1994 547 164 56 116 1995 520 141 67 127 1996 493 149 63 129 1997 517 160 69 130 1998 527 151 67 131 1999 488 160 66 134 2000 522 145 69 127 2001 471 155 49 106 2002 445 110 49 72 2003 455 129 34 65 2004 454 136 51 67 2005 506 133 54 74 2006 472 155 47 74 2007 448 141 55 76 2008 481 145 50 67 2009 529 166 57 56 2010 556 172 65 58 2011 560 172 71 65 2012 481 182 70 81 2013 452 160 71 86 Total 9,924 3,026 1,180 1,841 Salmon Power Troll 1994 11 7 3 3 1995 19 2 4 2 1996 10 3 0 1 1997 16 4 1 0 1998 18 5 1 0 1999 19 5 2 1 2000 18 5 1 2 2001 19 6 2 0 2002 20 2 2 2 2003 19 6 0 0 2004 22 4 1 0 2005 25 6 1 0 2006 19 5 1 0 2007 19 6 1 0 2008 15 8 1 1 2009 16 3 0 2 2010 24 2 1 1 2011 39 11 0 2 2012 18 12 2 1 2013 18 8 2 2 Total 384 110 26 20 Salmon Hand Troll 1994 10 5 1 0 1995 14 2 1 0 1996 12 0 1 0 1997 8 2 0 0 1998 6 1 1 0 1999 15 2 1 0 2000 12 1 0 0 2001 12 0 0 0 2002 14 0 0 0 2003 22 2 0 0 2004 17 5 1 0 2005 20 1 2 0 2006 27 1 0 0 2007 18 2 0 0 2008 24 2 0 0
Permit / Person Transferors Consecutive Years Transferred
Permit Type Year 1 2 3 4+ Salmon Hand Troll 2009 20 4 0 0 (continued) 2010 15 3 1 0 2011 28 7 0 0 2012 21 3 0 0 2013 20 1 1 0 Total 335 44 10 0 Southeast Salmon 1994 16 6 2 2 Purse Seine 1995 11 5 3 3 1996 13 5 1 3 1997 13 2 3 2 1998 24 4 0 3 1999 8 7 2 2 2000 17 4 3 2 2001 16 8 1 3 2002 7 5 1 1 2003 9 0 1 1 2004 8 1 0 1 2005 12 5 1 1 2006 7 4 1 0 2007 7 3 0 1 2008 14 0 2 0 2009 10 10 0 0 2010 14 2 1 0 2011 17 7 1 1 2012 20 6 0 0 2013 10 9 2 0 Total 253 93 25 26 Southeast Salmon 1994 19 7 1 1 Drift Gillnet 1995 11 4 4 2 1996 12 5 2 5 1997 12 5 2 5 1998 18 3 3 2 1999 24 5 2 2 2000 22 6 2 1 2001 22 6 2 2 2002 12 8 2 2 2003 7 3 3 2 2004 11 2 0 3 2005 17 4 1 2 2006 12 6 1 0 2007 19 2 2 0 2008 13 10 1 2 2009 13 3 5 1 2010 17 4 2 3 2011 23 7 1 4 2012 15 13 3 2 2013 17 2 3 0 Total 316 105 42 41 Southeast Roe Herring 1994 0 1 0 0 Purse Seine 1995 1 0 0 0 1996 0 0 0 0 1997 0 0 0 0 1998 0 0 0 0 1999 1 0 0 0 2000 0 0 0 0 2001 3 0 0 0

Table 5. Consecutive Years of Emergency Transfers of Limited Entry Permits, by Permit Type, 1975‐2013
36 Emergency Transfers of Alaska’s Commercial Fisheries Limited Entry Permits, 1975 ‐ 2013
Permit / Person Transferors Consecutive Years Transferred
Permit Type Year 1 2 3 4+ Southeast Roe Herring 2002 3 2 0 0 Purse Seine (cont.) 2003 4 0 2 0 (continued) 2004 2 3 0 1 2005 4 1 1 1 2006 3 2 1 0 2007 1 0 0 1 2008 1 1 0 1 2009 0 1 0 1 2010 3 0 1 0 2011 2 0 0 1 2012 1 1 0 0 2013 0 0 0 0 Total 29 12 5 6 Southeast Roe Herring 1994 5 2 1 0 Gillnet 1995 7 2 1 1 1996 2 0 1 2 1997 5 1 0 2 1998 2 1 0 0 1999 10 0 1 0 2000 2 1 0 1 2001 4 0 1 1 2002 4 2 0 2 2003 9 2 1 1 2004 9 3 1 2 2005 5 1 0 2 2006 6 1 0 0 2007 6 0 0 0 2008 9 2 0 0 2009 9 5 0 0 2010 4 4 1 0 2011 1 2 0 0 2012 2 0 0 0 2013 5 0 0 0 Total 106 29 8 14 Northern Southeast 1997 6 0 0 0 Herring Spawn-On-Kelp 1998 5 1 0 0 Pound 1999 9 1 0 0 2000 5 4 1 0 2001 7 1 0 0 2002 6 1 0 0 2003 9 1 0 0 2004 4 1 0 0 2005 9 2 0 0 2006 7 4 0 0 2007 10 3 2 0 2008 5 4 2 1 2009 4 1 2 0 2010 5 1 0 0 2011 9 1 1 0 2012 2 3 0 0 2013 0 0 0 0 Total 102 29 8 1 Southern Southeast 1996 3 0 0 0 Herring Spawn-On-Kelp 1997 8 1 0 0 Pound 1998 5 2 1 0 1999 4 0 1 0
Permit / Person Transferors Consecutive Years Transferred
Permit Type Year 1 2 3 4+ Southern Southeast 2000 5 2 0 0 Herring Spawn-On-Kelp 2001 2 1 1 0 Pound (cont.) 2002 10 0 1 0 2003 7 0 0 0 2004 12 1 0 0 2005 6 2 0 0 2006 4 2 1 0 2007 8 1 1 0 2008 11 0 0 1 2009 14 2 0 0 2010 2 5 1 0 2011 5 0 0 0 2012 4 2 0 0 2013 12 1 0 0 Total 122 22 7 1 Northern Southeast 1994 2 2 1 6 Inside Sablefish 1995 2 1 1 7 Longline 1996 6 0 1 8 1997 4 2 0 8 1998 6 0 2 6 1999 10 1 0 8 2000 9 5 1 8 2001 7 6 5 9 2002 3 1 5 13 2003 7 1 1 14 2004 6 4 1 13 2005 7 4 1 13 2006 5 4 3 14 2007 4 3 3 15 2008 9 1 1 10 2009 5 5 0 6 2010 6 3 4 4 2011 2 3 3 5 2012 2 0 1 6 2013 3 1 0 5 Total 105 47 34 178 Southern Southeast 1994 1 2 0 3 Inside Sablefish 1995 0 0 1 3 Longline 1996 1 0 0 4 1997 1 1 0 3 1998 0 0 0 2 1999 3 0 0 2 2000 2 0 0 2 2001 2 1 0 2 2002 2 2 1 2 2003 0 1 2 3 2004 1 0 1 5 2005 5 1 0 6 2006 4 5 1 5 2007 1 2 3 5 2008 3 1 2 6 2009 1 1 1 5 2010 0 0 1 4 2011 3 0 0 2 2012 0 1 0 2 2013 2 0 0 2 Total 32 18 13 68
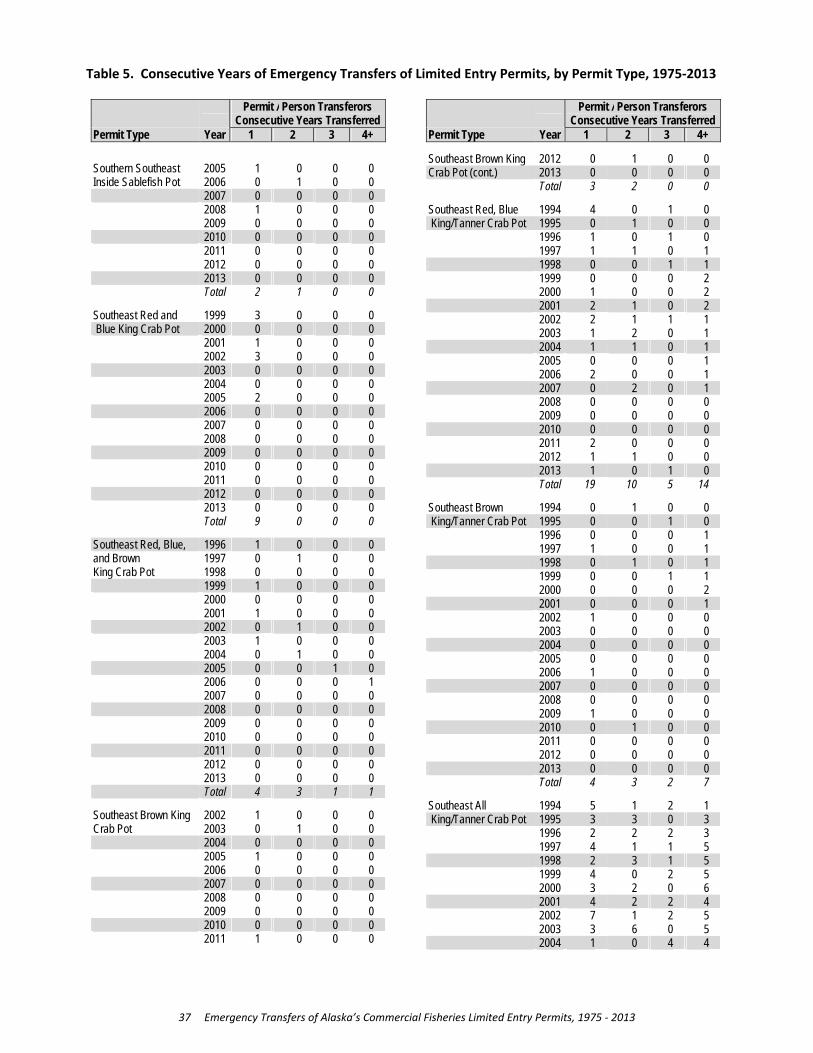
Table 5. Consecutive Years of Emergency Transfers of Limited Entry Permits, by Permit Type, 1975‐2013
37 Emergency Transfers of Alaska’s Commercial Fisheries Limited Entry Permits, 1975 ‐ 2013
Permit / Person Transferors Consecutive Years Transferred
Permit Type Year 1 2 3 4+ Southern Southeast 2005 1 0 0 0 Inside Sablefish Pot 2006 0 1 0 0 2007 0 0 0 0 2008 1 0 0 0 2009 0 0 0 0 2010 0 0 0 0 2011 0 0 0 0 2012 0 0 0 0 2013 0 0 0 0 Total 2 1 0 0 Southeast Red and 1999 3 0 0 0 Blue King Crab Pot 2000 0 0 0 0 2001 1 0 0 0 2002 3 0 0 0 2003 0 0 0 0 2004 0 0 0 0 2005 2 0 0 0 2006 0 0 0 0 2007 0 0 0 0 2008 0 0 0 0 2009 0 0 0 0 2010 0 0 0 0 2011 0 0 0 0 2012 0 0 0 0 2013 0 0 0 0 Total 9 0 0 0 Southeast Red, Blue, 1996 1 0 0 0 and Brown 1997 0 1 0 0 King Crab Pot 1998 0 0 0 0 1999 1 0 0 0 2000 0 0 0 0 2001 1 0 0 0 2002 0 1 0 0 2003 1 0 0 0 2004 0 1 0 0 2005 0 0 1 0 2006 0 0 0 1 2007 0 0 0 0 2008 0 0 0 0 2009 0 0 0 0 2010 0 0 0 0 2011 0 0 0 0 2012 0 0 0 0 2013 0 0 0 0 Total 4 3 1 1 Southeast Brown King 2002 1 0 0 0 Crab Pot 2003 0 1 0 0 2004 0 0 0 0 2005 1 0 0 0 2006 0 0 0 0 2007 0 0 0 0 2008 0 0 0 0 2009 0 0 0 0 2010 0 0 0 0 2011 1 0 0 0
Permit / Person Transferors Consecutive Years Transferred
Permit Type Year 1 2 3 4+ Southeast Brown King 2012 0 1 0 0 Crab Pot (cont.) 2013 0 0 0 0 Total 3 2 0 0 Southeast Red, Blue 1994 4 0 1 0 King/Tanner Crab Pot 1995 0 1 0 0 1996 1 0 1 0 1997 1 1 0 1 1998 0 0 1 1 1999 0 0 0 2 2000 1 0 0 2 2001 2 1 0 2 2002 2 1 1 1 2003 1 2 0 1 2004 1 1 0 1 2005 0 0 0 1 2006 2 0 0 1 2007 0 2 0 1 2008 0 0 0 0 2009 0 0 0 0 2010 0 0 0 0 2011 2 0 0 0 2012 1 1 0 0 2013 1 0 1 0 Total 19 10 5 14 Southeast Brown 1994 0 1 0 0 King/Tanner Crab Pot 1995 0 0 1 0 1996 0 0 0 1 1997 1 0 0 1 1998 0 1 0 1 1999 0 0 1 1 2000 0 0 0 2 2001 0 0 0 1 2002 1 0 0 0 2003 0 0 0 0 2004 0 0 0 0 2005 0 0 0 0 2006 1 0 0 0 2007 0 0 0 0 2008 0 0 0 0 2009 1 0 0 0 2010 0 1 0 0 2011 0 0 0 0 2012 0 0 0 0 2013 0 0 0 0 Total 4 3 2 7 Southeast All 1994 5 1 2 1 King/Tanner Crab Pot 1995 3 3 0 3 1996 2 2 2 3 1997 4 1 1 5 1998 2 3 1 5 1999 4 0 2 5 2000 3 2 0 6 2001 4 2 2 4 2002 7 1 2 5 2003 3 6 0 5 2004 1 0 4 4
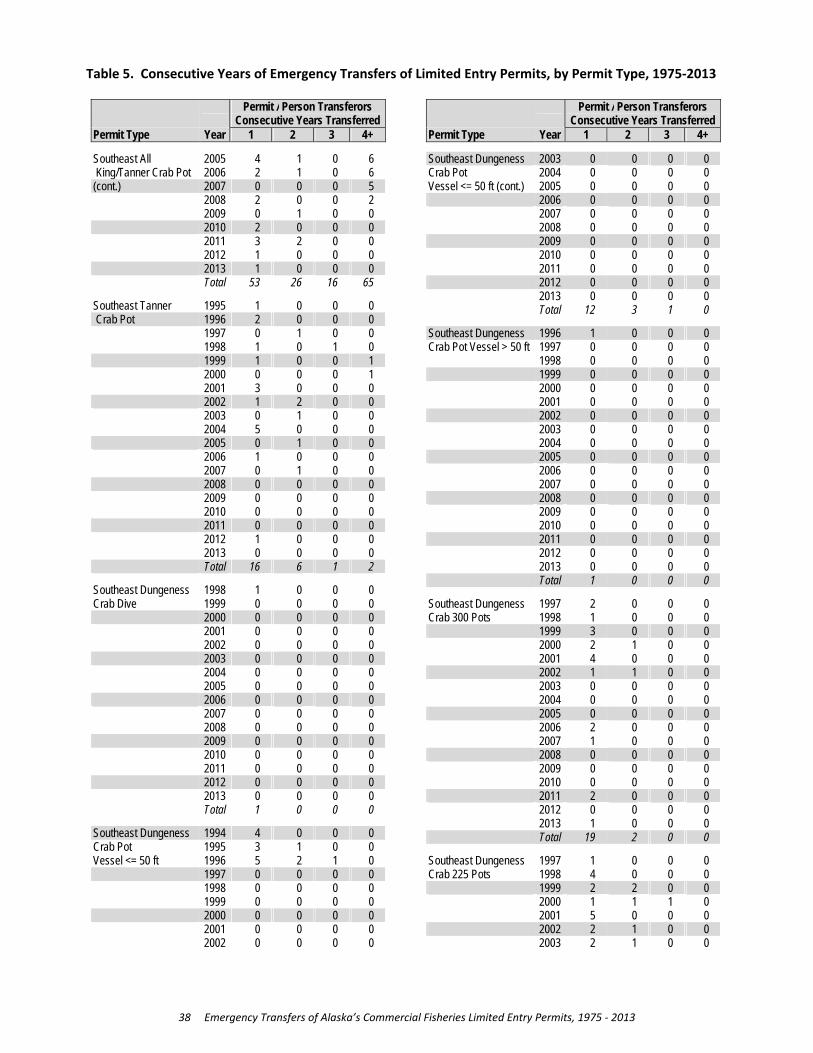
Table 5. Consecutive Years of Emergency Transfers of Limited Entry Permits, by Permit Type, 1975‐2013
38 Emergency Transfers of Alaska’s Commercial Fisheries Limited Entry Permits, 1975 ‐ 2013
Permit / Person Transferors Consecutive Years Transferred
Permit Type Year 1 2 3 4+ Southeast All 2005 4 1 0 6 King/Tanner Crab Pot 2006 2 1 0 6 (cont.) 2007 0 0 0 5 2008 2 0 0 2 2009 0 1 0 0 2010 2 0 0 0 2011 3 2 0 0 2012 1 0 0 0 2013 1 0 0 0 Total 53 26 16 65 Southeast Tanner 1995 1 0 0 0 Crab Pot 1996 2 0 0 0 1997 0 1 0 0 1998 1 0 1 0 1999 1 0 0 1 2000 0 0 0 1 2001 3 0 0 0 2002 1 2 0 0 2003 0 1 0 0 2004 5 0 0 0 2005 0 1 0 0 2006 1 0 0 0 2007 0 1 0 0 2008 0 0 0 0 2009 0 0 0 0 2010 0 0 0 0 2011 0 0 0 0 2012 1 0 0 0 2013 0 0 0 0 Total 16 6 1 2 Southeast Dungeness 1998 1 0 0 0 Crab Dive 1999 0 0 0 0 2000 0 0 0 0 2001 0 0 0 0 2002 0 0 0 0 2003 0 0 0 0 2004 0 0 0 0 2005 0 0 0 0 2006 0 0 0 0 2007 0 0 0 0 2008 0 0 0 0 2009 0 0 0 0 2010 0 0 0 0 2011 0 0 0 0 2012 0 0 0 0 2013 0 0 0 0 Total 1 0 0 0 Southeast Dungeness 1994 4 0 0 0 Crab Pot 1995 3 1 0 0 Vessel <= 50 ft 1996 5 2 1 0 1997 0 0 0 0 1998 0 0 0 0 1999 0 0 0 0 2000 0 0 0 0 2001 0 0 0 0 2002 0 0 0 0
Permit / Person Transferors Consecutive Years Transferred
Permit Type Year 1 2 3 4+ Southeast Dungeness 2003 0 0 0 0 Crab Pot 2004 0 0 0 0 Vessel <= 50 ft (cont.) 2005 0 0 0 0 2006 0 0 0 0 2007 0 0 0 0 2008 0 0 0 0 2009 0 0 0 0 2010 0 0 0 0 2011 0 0 0 0 2012 0 0 0 0 2013 0 0 0 0 Total 12 3 1 0 Southeast Dungeness 1996 1 0 0 0 Crab Pot Vessel > 50 ft 1997 0 0 0 0 1998 0 0 0 0 1999 0 0 0 0 2000 0 0 0 0 2001 0 0 0 0 2002 0 0 0 0 2003 0 0 0 0 2004 0 0 0 0 2005 0 0 0 0 2006 0 0 0 0 2007 0 0 0 0 2008 0 0 0 0 2009 0 0 0 0 2010 0 0 0 0 2011 0 0 0 0 2012 0 0 0 0 2013 0 0 0 0 Total 1 0 0 0 Southeast Dungeness 1997 2 0 0 0 Crab 300 Pots 1998 1 0 0 0 1999 3 0 0 0 2000 2 1 0 0 2001 4 0 0 0 2002 1 1 0 0 2003 0 0 0 0 2004 0 0 0 0 2005 0 0 0 0 2006 2 0 0 0 2007 1 0 0 0 2008 0 0 0 0 2009 0 0 0 0 2010 0 0 0 0 2011 2 0 0 0 2012 0 0 0 0 2013 1 0 0 0 Total 19 2 0 0 Southeast Dungeness 1997 1 0 0 0 Crab 225 Pots 1998 4 0 0 0 1999 2 2 0 0 2000 1 1 1 0 2001 5 0 0 0 2002 2 1 0 0 2003 2 1 0 0

Table 5. Consecutive Years of Emergency Transfers of Limited Entry Permits, by Permit Type, 1975‐2013
39 Emergency Transfers of Alaska’s Commercial Fisheries Limited Entry Permits, 1975 ‐ 2013
Permit / Person Transferors Consecutive Years Transferred
Permit Type Year 1 2 3 4+ Southeast Dungeness 2004 1 0 0 0 Crab 225 Pots (cont.) 2005 0 0 0 0 2006 1 0 0 0 2007 4 0 0 0 2008 0 2 0 0 2009 1 0 1 0 2010 0 0 0 1 2011 0 0 0 0 2012 2 0 0 0 2013 1 0 0 0 Total 27 7 2 1 Southeast Dungeness 1997 6 0 0 0 Crab 150 Pots 1998 2 1 0 0 1999 2 0 0 0 2000 3 0 0 0 2001 2 1 0 0 2002 6 0 0 0 2003 4 0 0 0 2004 2 1 0 0 2005 3 0 0 0 2006 1 2 0 0 2007 3 0 0 0 2008 3 2 0 0 2009 0 1 2 0 2010 0 0 0 1 2011 3 0 0 0 2012 5 1 0 0 2013 3 0 0 0 Total 48 9 2 1 Southeast Dungeness 1997 6 0 0 0 Crab 75 Pots 1998 6 4 0 0 1999 1 1 1 0 2000 2 0 0 0 2001 3 0 0 0 2002 3 0 0 0 2003 1 1 0 0 2004 5 0 0 0 2005 0 1 0 0 2006 1 0 0 0 2007 3 0 0 0 2008 2 1 0 0 2009 2 1 1 0 2010 2 1 0 0 2011 1 0 0 0 2012 2 0 0 0 2013 2 1 0 0 Total 42 11 2 0 Southeast Shrimp 1998 1 0 0 0 Beam Trawl 1999 0 0 0 0 2000 0 0 0 0 2001 1 0 0 0 2002 1 0 0 0 2003 0 0 0 0 2004 0 0 0 0 2005 0 0 0 0 2006 0 0 0 0
Permit / Person Transferors Consecutive Years Transferred
Permit Type Year 1 2 3 4+ Southeast Shrimp 2007 0 0 0 0 Beam Trawl (cont.) 2008 0 0 0 0 2009 0 0 0 0 2010 0 0 0 0 2011 1 0 0 0 2012 1 1 0 0 2013 0 0 1 0 Total 5 1 1 0 Southeast Shrimp 1996 1 0 0 0 Pot Gear 1997 0 0 0 0 1998 4 0 0 0 1999 2 0 0 0 2000 2 0 0 0 2001 3 0 0 0 2002 4 0 0 0 2003 4 1 0 0 2004 5 1 0 0 2005 5 2 0 0 2006 4 0 0 0 2007 3 1 0 0 2008 3 0 0 0 2009 4 1 0 0 2010 4 0 1 0 2011 4 1 0 0 2012 3 0 1 0 2013 5 1 0 1 Total 60 8 2 1 Southeast Sea 1997 10 0 0 0 Urchin Dive 1998 4 2 0 0 1999 1 0 1 0 2000 4 0 0 0 2001 8 0 0 0 2002 5 3 0 0 2003 11 0 0 0 2004 5 1 0 0 2005 3 0 0 0 2006 2 0 0 0 2007 0 0 0 0 2008 0 0 0 0 2009 1 0 0 0 2010 2 0 0 0 2011 0 0 0 0 2012 0 0 0 0 2013 3 0 0 0 Total 59 6 1 0 Southeast Geoduck 1998 5 0 0 0 Clams Dive 1999 0 0 0 0 2000 4 0 0 0 2001 0 0 0 0 2002 2 0 0 0 2003 3 0 0 0 2004 6 0 0 0 2005 7 2 0 0 2006 1 2 0 0 2007 3 1 0 0 2008 2 0 1 0
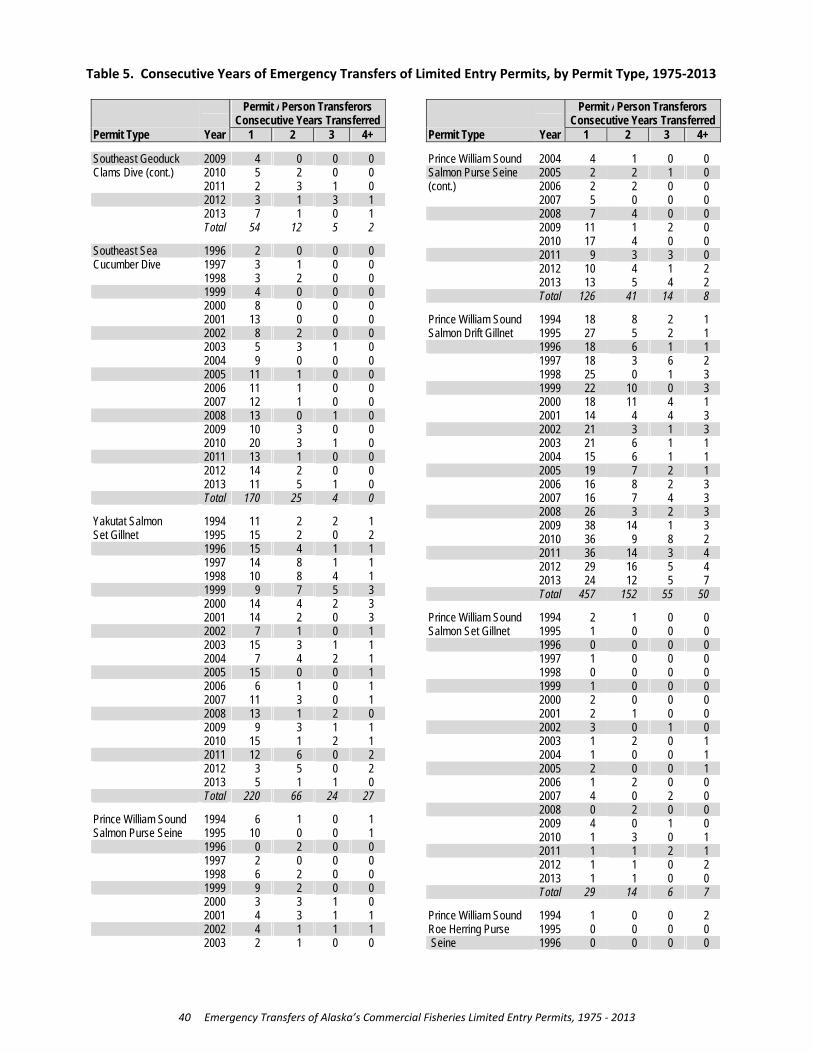
Table 5. Consecutive Years of Emergency Transfers of Limited Entry Permits, by Permit Type, 1975‐2013
40 Emergency Transfers of Alaska’s Commercial Fisheries Limited Entry Permits, 1975 ‐ 2013
Permit / Person Transferors Consecutive Years Transferred
Permit Type Year 1 2 3 4+ Southeast Geoduck 2009 4 0 0 0 Clams Dive (cont.) 2010 5 2 0 0 2011 2 3 1 0 2012 3 1 3 1 2013 7 1 0 1 Total 54 12 5 2 Southeast Sea 1996 2 0 0 0 Cucumber Dive 1997 3 1 0 0 1998 3 2 0 0 1999 4 0 0 0 2000 8 0 0 0 2001 13 0 0 0 2002 8 2 0 0 2003 5 3 1 0 2004 9 0 0 0 2005 11 1 0 0 2006 11 1 0 0 2007 12 1 0 0 2008 13 0 1 0 2009 10 3 0 0 2010 20 3 1 0 2011 13 1 0 0 2012 14 2 0 0 2013 11 5 1 0 Total 170 25 4 0 Yakutat Salmon 1994 11 2 2 1 Set Gillnet 1995 15 2 0 2 1996 15 4 1 1 1997 14 8 1 1 1998 10 8 4 1 1999 9 7 5 3 2000 14 4 2 3 2001 14 2 0 3 2002 7 1 0 1 2003 15 3 1 1 2004 7 4 2 1 2005 15 0 0 1 2006 6 1 0 1 2007 11 3 0 1 2008 13 1 2 0 2009 9 3 1 1 2010 15 1 2 1 2011 12 6 0 2 2012 3 5 0 2 2013 5 1 1 0 Total 220 66 24 27 Prince William Sound 1994 6 1 0 1 Salmon Purse Seine 1995 10 0 0 1 1996 0 2 0 0 1997 2 0 0 0 1998 6 2 0 0 1999 9 2 0 0 2000 3 3 1 0 2001 4 3 1 1 2002 4 1 1 1 2003 2 1 0 0
Permit / Person Transferors Consecutive Years Transferred
Permit Type Year 1 2 3 4+ Prince William Sound 2004 4 1 0 0 Salmon Purse Seine 2005 2 2 1 0 (cont.) 2006 2 2 0 0 2007 5 0 0 0 2008 7 4 0 0 2009 11 1 2 0 2010 17 4 0 0 2011 9 3 3 0 2012 10 4 1 2 2013 13 5 4 2 Total 126 41 14 8 Prince William Sound 1994 18 8 2 1 Salmon Drift Gillnet 1995 27 5 2 1 1996 18 6 1 1 1997 18 3 6 2 1998 25 0 1 3 1999 22 10 0 3 2000 18 11 4 1 2001 14 4 4 3 2002 21 3 1 3 2003 21 6 1 1 2004 15 6 1 1 2005 19 7 2 1 2006 16 8 2 3 2007 16 7 4 3 2008 26 3 2 3 2009 38 14 1 3 2010 36 9 8 2 2011 36 14 3 4 2012 29 16 5 4 2013 24 12 5 7 Total 457 152 55 50 Prince William Sound 1994 2 1 0 0 Salmon Set Gillnet 1995 1 0 0 0 1996 0 0 0 0 1997 1 0 0 0 1998 0 0 0 0 1999 1 0 0 0 2000 2 0 0 0 2001 2 1 0 0 2002 3 0 1 0 2003 1 2 0 1 2004 1 0 0 1 2005 2 0 0 1 2006 1 2 0 0 2007 4 0 2 0 2008 0 2 0 0 2009 4 0 1 0 2010 1 3 0 1 2011 1 1 2 1 2012 1 1 0 2 2013 1 1 0 0 Total 29 14 6 7 Prince William Sound 1994 1 0 0 2 Roe Herring Purse 1995 0 0 0 0 Seine 1996 0 0 0 0

Table 5. Consecutive Years of Emergency Transfers of Limited Entry Permits, by Permit Type, 1975‐2013
41 Emergency Transfers of Alaska’s Commercial Fisheries Limited Entry Permits, 1975 ‐ 2013
Permit / Person Transferors Consecutive Years Transferred
Permit Type Year 1 2 3 4+ Prince William Sound 1997 1 0 0 0 Roe Herring Purse 1998 4 1 0 0 Seine (cont.) 1999 2 1 0 0 2000 0 0 0 0 2001 0 0 0 0 2002 0 0 0 0 2003 0 0 0 0 2004 0 0 0 0 2005 0 0 0 0 2006 0 0 0 0 2007 0 0 0 0 2008 0 0 0 0 2009 0 0 0 0 2010 0 0 0 0 2011 0 0 0 0 2012 0 0 0 0 2013 0 0 0 0 Total 8 2 0 2 Prince William Sound 1994 1 0 0 1 Roe Herring Gillnet 1995 0 0 0 1 1996 0 0 0 0 1997 1 0 0 0 1998 1 1 0 0 1999 0 0 1 0 2000 0 0 0 0 2001 0 0 0 0 2002 0 0 0 0 2003 0 0 0 0 2004 0 0 0 0 2005 0 0 0 0 2006 0 0 0 0 2007 0 0 0 0 2008 0 0 0 0 2009 0 0 0 0 2010 0 0 0 0 2011 0 0 0 0 2012 0 0 0 0 2013 0 0 0 0 Total 3 1 1 2 Prince William Sound 1994 18 2 0 0 Herring Spawn-On-Kelp 1995 0 0 0 0 Pound 1996 0 0 0 0 1997 14 0 0 0 1998 5 0 0 0 1999 0 0 0 0 2000 0 0 0 0 2001 0 0 0 0 2002 0 0 0 0 2003 0 0 0 0 2004 0 0 0 0 2005 0 0 0 0 2006 0 0 0 0 2007 0 0 0 0 2008 0 0 0 0 2009 0 0 0 0 2010 0 0 0 0 2011 0 0 0 0
Permit / Person Transferors Consecutive Years Transferred
Permit Type Year 1 2 3 4+ Prince William Sound 2012 0 0 0 0 Herring Spawn-On-Kelp 2013 0 0 0 0 Pound (cont.) Total 37 2 0 0 Prince William Sound 1996 1 0 0 0 Sablefish Fixed Gear 1997 0 0 0 0 Vessel to 50 ft 1998 4 0 0 0 1999 0 0 0 0 2000 2 0 0 0 2001 1 0 0 0 2002 4 1 0 0 2003 4 3 0 0 2004 0 2 1 0 2005 0 0 1 1 2006 4 0 0 2 2007 1 3 0 2 2008 0 0 2 2 2009 0 0 0 3 2010 1 0 0 3 2011 3 1 0 3 2012 4 0 1 3 2013 1 1 0 2 Total 30 11 5 21 Prince William Sound 2001 1 0 0 0 Sablefish Fixed Gear 2002 0 0 0 0 Vessel to 35 ft 2003 0 0 0 0 2004 1 0 0 0 2005 1 0 0 0 2006 0 0 0 0 2007 0 0 0 0 2008 0 0 0 0 2009 0 0 0 0 2010 0 0 0 0 2011 0 0 0 0 2012 0 0 0 0 2013 0 0 0 0 Total 3 0 0 0 Cook Inlet Salmon 1994 3 0 0 0 Purse Seine 1995 2 0 0 0 1996 1 1 0 0 1997 1 0 0 0 1998 3 0 0 0 1999 2 2 0 0 2000 1 0 1 0 2001 0 0 0 0 2002 5 0 0 0 2003 3 1 0 0 2004 4 1 0 0 2005 2 2 0 0 2006 0 0 0 0 2007 1 0 0 0 2008 3 0 0 0 2009 1 2 0 0 2010 2 0 0 0 2011 4 0 0 0 2012 2 0 0 0 2013 1 1 0 0 Total 41 10 1 0
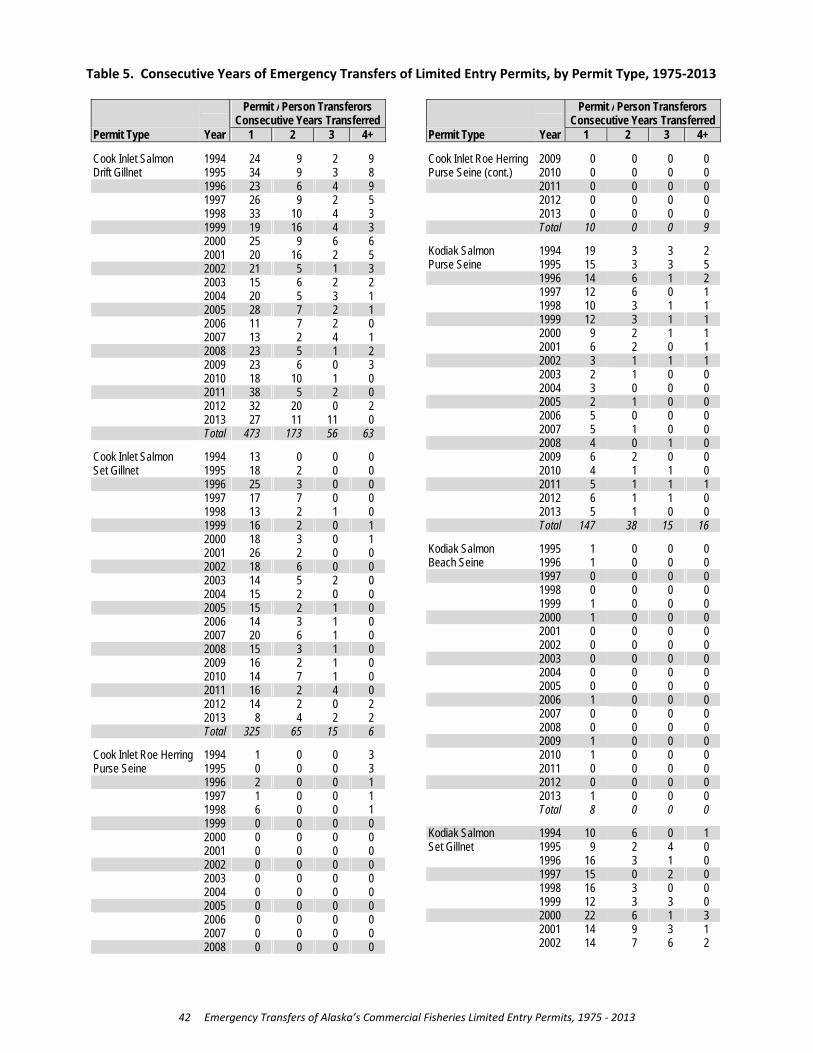
Table 5. Consecutive Years of Emergency Transfers of Limited Entry Permits, by Permit Type, 1975‐2013
42 Emergency Transfers of Alaska’s Commercial Fisheries Limited Entry Permits, 1975 ‐ 2013
Permit / Person Transferors Consecutive Years Transferred
Permit Type Year 1 2 3 4+ Cook Inlet Salmon 1994 24 9 2 9 Drift Gillnet 1995 34 9 3 8 1996 23 6 4 9 1997 26 9 2 5 1998 33 10 4 3 1999 19 16 4 3 2000 25 9 6 6 2001 20 16 2 5 2002 21 5 1 3 2003 15 6 2 2 2004 20 5 3 1 2005 28 7 2 1 2006 11 7 2 0 2007 13 2 4 1 2008 23 5 1 2 2009 23 6 0 3 2010 18 10 1 0 2011 38 5 2 0 2012 32 20 0 2 2013 27 11 11 0 Total 473 173 56 63 Cook Inlet Salmon 1994 13 0 0 0 Set Gillnet 1995 18 2 0 0 1996 25 3 0 0 1997 17 7 0 0 1998 13 2 1 0 1999 16 2 0 1 2000 18 3 0 1 2001 26 2 0 0 2002 18 6 0 0 2003 14 5 2 0 2004 15 2 0 0 2005 15 2 1 0 2006 14 3 1 0 2007 20 6 1 0 2008 15 3 1 0 2009 16 2 1 0 2010 14 7 1 0 2011 16 2 4 0 2012 14 2 0 2 2013 8 4 2 2 Total 325 65 15 6 Cook Inlet Roe Herring 1994 1 0 0 3 Purse Seine 1995 0 0 0 3 1996 2 0 0 1 1997 1 0 0 1 1998 6 0 0 1 1999 0 0 0 0 2000 0 0 0 0 2001 0 0 0 0 2002 0 0 0 0 2003 0 0 0 0 2004 0 0 0 0 2005 0 0 0 0 2006 0 0 0 0 2007 0 0 0 0 2008 0 0 0 0
Permit / Person Transferors Consecutive Years Transferred
Permit Type Year 1 2 3 4+ Cook Inlet Roe Herring 2009 0 0 0 0 Purse Seine (cont.) 2010 0 0 0 0 2011 0 0 0 0 2012 0 0 0 0 2013 0 0 0 0 Total 10 0 0 9 Kodiak Salmon 1994 19 3 3 2 Purse Seine 1995 15 3 3 5 1996 14 6 1 2 1997 12 6 0 1 1998 10 3 1 1 1999 12 3 1 1 2000 9 2 1 1 2001 6 2 0 1 2002 3 1 1 1 2003 2 1 0 0 2004 3 0 0 0 2005 2 1 0 0 2006 5 0 0 0 2007 5 1 0 0 2008 4 0 1 0 2009 6 2 0 0 2010 4 1 1 0 2011 5 1 1 1 2012 6 1 1 0 2013 5 1 0 0 Total 147 38 15 16 Kodiak Salmon 1995 1 0 0 0 Beach Seine 1996 1 0 0 0 1997 0 0 0 0 1998 0 0 0 0 1999 1 0 0 0 2000 1 0 0 0 2001 0 0 0 0 2002 0 0 0 0 2003 0 0 0 0 2004 0 0 0 0 2005 0 0 0 0 2006 1 0 0 0 2007 0 0 0 0 2008 0 0 0 0 2009 1 0 0 0 2010 1 0 0 0 2011 0 0 0 0 2012 0 0 0 0 2013 1 0 0 0 Total 8 0 0 0 Kodiak Salmon 1994 10 6 0 1 Set Gillnet 1995 9 2 4 0 1996 16 3 1 0 1997 15 0 2 0 1998 16 3 0 0 1999 12 3 3 0 2000 22 6 1 3 2001 14 9 3 1 2002 14 7 6 2

Table 5. Consecutive Years of Emergency Transfers of Limited Entry Permits, by Permit Type, 1975‐2013
43 Emergency Transfers of Alaska’s Commercial Fisheries Limited Entry Permits, 1975 ‐ 2013
Permit / Person Transferors Consecutive Years Transferred
Permit Type Year 1 2 3 4+ Kodiak Salmon 2003 16 6 2 4 Set Gillnet (cont.) 2004 14 3 3 6 2005 11 3 2 8 2006 12 2 2 8 2007 9 6 0 7 2008 16 3 0 4 2009 14 4 0 2 2010 10 3 1 1 2011 22 2 1 1 2012 15 12 1 0 2013 5 8 8 1 Total 272 91 40 49 Kodiak Roe Herring 1994 3 0 0 0 Purse Seine 1995 2 0 0 0 1996 3 0 0 0 1997 3 1 0 0 1998 1 0 0 0 1999 1 0 0 0 2000 0 0 0 0 2001 2 0 0 0 2002 1 1 0 0 2003 1 0 0 0 2004 0 0 0 0 2005 2 0 0 0 2006 0 0 0 0 2007 0 0 0 0 2008 1 0 0 0 2009 2 1 0 0 2010 0 0 0 0 2011 0 0 0 0 2012 1 0 0 0 2013 2 0 0 0 Total 25 3 0 0 Kodiak Roe Herring 1994 7 0 1 0 Gillnet 1995 2 4 0 0 1996 3 1 2 0 1997 2 1 0 1 1998 1 0 0 0 1999 0 0 0 0 2000 0 0 0 0 2001 1 0 0 0 2002 1 0 0 0 2003 0 1 0 0 2004 2 0 0 0 2005 0 0 0 0 2006 0 0 0 0 2007 0 0 0 0 2008 1 0 0 0 2009 0 0 0 0 2010 1 0 0 0 2011 0 0 0 0 2012 0 0 0 0 2013 1 0 0 0 Total 22 7 3 1 Kodiak Roe Herring 2010 1 0 0 0 Gillnet & Seine 2011 0 0 0 0
Permit / Person Transferors Consecutive Years Transferred
Permit Type Year 1 2 3 4+ Kodiak Roe Herring 2012 0 0 0 0 Gillnet & Seine (cont.) 2013 0 0 0 0 Total 1 0 0 0 Kodiak Tanner 2006 1 0 0 0 Bairdi Crab Pot 2007 0 0 0 0 Vessel to 120 ft 2008 1 0 0 0 2009 0 0 0 0 2010 1 0 0 0 2011 1 0 0 0 2012 0 0 0 0 2013 1 0 0 0 Total 5 0 0 0 Kodiak Tanner 2003 1 0 0 0 Bairdi Crab Pot 2004 1 0 0 0 Vessel Under 60 ft 2005 7 1 0 0 2006 1 0 0 0 2007 3 0 0 0 2008 0 1 0 0 2009 1 0 0 0 2010 1 0 0 0 2011 6 0 0 0 2012 0 1 0 0 2013 3 0 0 0 Total 24 3 0 0 Chignik Salmon 1994 9 2 0 5 Purse Seine 1995 9 3 2 5 1996 6 3 3 6 1997 2 3 0 7 1998 1 0 1 7 1999 2 1 0 6 2000 5 1 1 5 2001 4 2 0 5 2002 3 2 1 4 2003 2 1 2 4 2004 1 0 1 6 2005 4 0 0 6 2006 4 0 0 2 2007 4 2 0 1 2008 8 3 2 0 2009 6 5 3 2 2010 5 4 3 2 2011 7 2 2 2 2012 4 4 1 3 2013 3 3 2 1 Total 89 41 24 79 Alaska Peninsula 1994 6 0 0 0 Salmon Purse Seine 1995 2 1 0 0 1996 5 1 0 0 1997 4 1 0 0 1998 3 3 1 0 1999 2 3 2 1 2000 4 1 1 1 2001 5 0 1 1 2002 3 2 0 0 2003 1 0 0 0
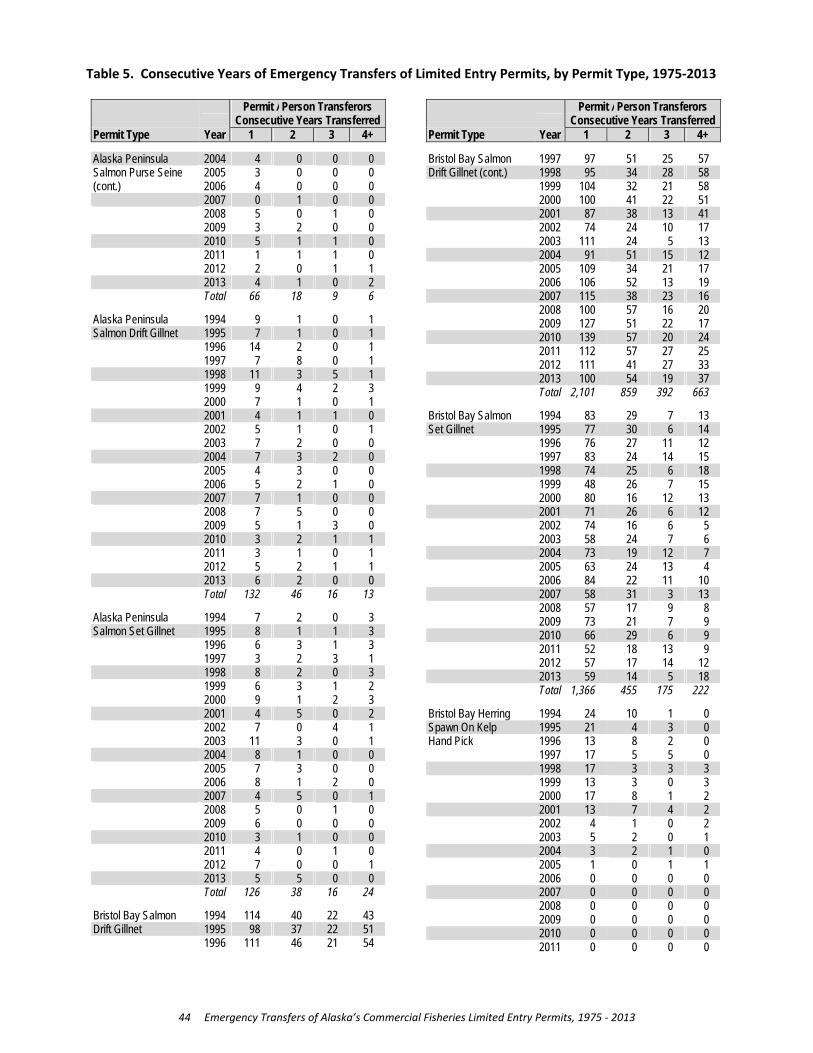
Table 5. Consecutive Years of Emergency Transfers of Limited Entry Permits, by Permit Type, 1975‐2013
44 Emergency Transfers of Alaska’s Commercial Fisheries Limited Entry Permits, 1975 ‐ 2013
Permit / Person Transferors Consecutive Years Transferred
Permit Type Year 1 2 3 4+ Alaska Peninsula 2004 4 0 0 0 Salmon Purse Seine 2005 3 0 0 0 (cont.) 2006 4 0 0 0 2007 0 1 0 0 2008 5 0 1 0 2009 3 2 0 0 2010 5 1 1 0 2011 1 1 1 0 2012 2 0 1 1 2013 4 1 0 2 Total 66 18 9 6 Alaska Peninsula 1994 9 1 0 1 Salmon Drift Gillnet 1995 7 1 0 1 1996 14 2 0 1 1997 7 8 0 1 1998 11 3 5 1 1999 9 4 2 3 2000 7 1 0 1 2001 4 1 1 0 2002 5 1 0 1 2003 7 2 0 0 2004 7 3 2 0 2005 4 3 0 0 2006 5 2 1 0 2007 7 1 0 0 2008 7 5 0 0 2009 5 1 3 0 2010 3 2 1 1 2011 3 1 0 1 2012 5 2 1 1 2013 6 2 0 0 Total 132 46 16 13 Alaska Peninsula 1994 7 2 0 3 Salmon Set Gillnet 1995 8 1 1 3 1996 6 3 1 3 1997 3 2 3 1 1998 8 2 0 3 1999 6 3 1 2 2000 9 1 2 3 2001 4 5 0 2 2002 7 0 4 1 2003 11 3 0 1 2004 8 1 0 0 2005 7 3 0 0 2006 8 1 2 0 2007 4 5 0 1 2008 5 0 1 0 2009 6 0 0 0 2010 3 1 0 0 2011 4 0 1 0 2012 7 0 0 1 2013 5 5 0 0 Total 126 38 16 24 Bristol Bay Salmon 1994 114 40 22 43 Drift Gillnet 1995 98 37 22 51 1996 111 46 21 54
Permit / Person Transferors Consecutive Years Transferred
Permit Type Year 1 2 3 4+ Bristol Bay Salmon 1997 97 51 25 57 Drift Gillnet (cont.) 1998 95 34 28 58 1999 104 32 21 58 2000 100 41 22 51 2001 87 38 13 41 2002 74 24 10 17 2003 111 24 5 13 2004 91 51 15 12 2005 109 34 21 17 2006 106 52 13 19 2007 115 38 23 16 2008 100 57 16 20 2009 127 51 22 17 2010 139 57 20 24 2011 112 57 27 25 2012 111 41 27 33 2013 100 54 19 37 Total 2,101 859 392 663 Bristol Bay Salmon 1994 83 29 7 13 Set Gillnet 1995 77 30 6 14 1996 76 27 11 12 1997 83 24 14 15 1998 74 25 6 18 1999 48 26 7 15 2000 80 16 12 13 2001 71 26 6 12 2002 74 16 6 5 2003 58 24 7 6 2004 73 19 12 7 2005 63 24 13 4 2006 84 22 11 10 2007 58 31 3 13 2008 57 17 9 8 2009 73 21 7 9 2010 66 29 6 9 2011 52 18 13 9 2012 57 17 14 12 2013 59 14 5 18 Total 1,366 455 175 222 Bristol Bay Herring 1994 24 10 1 0 Spawn On Kelp 1995 21 4 3 0 Hand Pick 1996 13 8 2 0 1997 17 5 5 0 1998 17 3 3 3 1999 13 3 0 3 2000 17 8 1 2 2001 13 7 4 2 2002 4 1 0 2 2003 5 2 0 1 2004 3 2 1 0 2005 1 0 1 1 2006 0 0 0 0 2007 0 0 0 0 2008 0 0 0 0 2009 0 0 0 0 2010 0 0 0 0 2011 0 0 0 0

Table 5. Consecutive Years of Emergency Transfers of Limited Entry Permits, by Permit Type, 1975‐2013
45 Emergency Transfers of Alaska’s Commercial Fisheries Limited Entry Permits, 1975 ‐ 2013
Permit / Person Transferors Consecutive Years Transferred
Permit Type Year 1 2 3 4+ Bristol Bay Herring 2012 0 0 0 0 Spawn On Kelp 2013 0 0 0 0 Hand Pick (cont.) Total 148 53 21 14 Goodnews Bay 1999 1 0 0 0 Herring Gillnet 2000 2 0 0 0 2001 4 0 0 0 2002 1 0 0 0 2003 0 0 0 0 2004 0 0 0 0 2005 1 0 0 0 2006 0 0 0 0 2007 0 0 0 0 2008 0 0 0 0 2009 0 0 0 0 2010 1 0 0 0 2011 0 0 0 0 2012 0 0 0 0 2013 1 0 0 0 Total 11 0 0 0 Kuskokwim Salmon 1994 37 6 0 5 Gillnet 1995 28 3 3 3 1996 21 0 1 3 1997 19 1 0 1 1998 20 2 0 1 1999 17 4 0 1 2000 22 3 1 0 2001 15 3 0 1 2002 15 3 2 1 2003 8 0 1 2 2004 19 1 0 1 2005 12 4 1 0 2006 16 1 1 0 2007 11 1 1 0 2008 13 1 1 0 2009 24 3 1 0 2010 30 3 1 0 2011 23 1 1 0 2012 18 3 1 0 2013 23 3 0 0 Total 391 46 16 19 Nelson Island 1994 2 1 0 0 Herring Gillnet 1995 2 2 1 0 1996 2 2 1 0 1997 2 0 2 1 1998 3 0 0 1 1999 3 1 0 1 2000 0 0 1 1 2001 2 0 0 2 2002 2 0 0 0 2003 1 0 0 0 2004 1 0 0 0 2005 1 0 0 0 2006 0 0 0 0 2007 0 0 0 0 2008 0 0 0 0 2009 0 0 0 0
Permit / Person Transferors Consecutive Years Transferred
Permit Type Year 1 2 3 4+ Nelson Island 2010 0 0 0 0 Herring Gillnet (cont.) 2011 0 0 0 0 2012 0 0 0 0 2013 1 0 0 0 Total 22 6 5 6 Nunivak Island 1996 1 0 0 0 Herring Gillnet 1997 0 0 0 0 1998 0 0 0 0 1999 0 0 0 0 2000 1 0 0 0 2001 0 0 0 0 2002 0 0 0 0 2003 1 0 0 0 2004 0 0 0 0 2005 0 0 0 0 2006 0 0 0 0 2007 0 0 0 0 2008 0 0 0 0 2009 0 0 0 0 2010 0 0 0 0 2011 0 0 0 0 2012 0 0 0 0 2013 0 0 0 0 Total 3 0 0 0 Lower Yukon 1994 17 4 2 6 Salmon Gillnet 1995 27 5 1 4 1996 21 3 1 5 1997 27 4 0 5 1998 27 12 1 5 1999 24 10 4 6 2000 20 1 3 5 2001 3 0 0 1 2002 20 0 0 1 2003 23 3 0 1 2004 20 6 1 1 2005 42 3 1 1 2006 37 10 2 2 2007 32 3 5 3 2008 25 4 0 4 2009 26 6 1 1 2010 22 6 4 0 2011 16 4 3 1 2012 22 1 3 1 2013 13 1 1 2 Total 464 86 33 55 Cape Romanzof 1994 3 0 0 0 Herring Gillnet 1995 3 0 0 0 1996 2 0 0 0 1997 4 0 0 0 1998 2 1 0 0 1999 3 1 0 0 2000 4 0 0 0 2001 0 0 0 0 2002 1 0 0 0 2003 1 1 0 0 2004 1 0 0 0

Table 5. Consecutive Years of Emergency Transfers of Limited Entry Permits, by Permit Type, 1975‐2013
46 Emergency Transfers of Alaska’s Commercial Fisheries Limited Entry Permits, 1975 ‐ 2013
Permit / Person Transferors Consecutive Years Transferred
Permit Type Year 1 2 3 4+ Cape Romanzof 2005 1 0 0 0 Herring Gillnet (cont.) 2006 0 0 0 0 2007 0 0 0 0 2008 0 0 0 0 2009 0 0 0 0 2010 1 0 0 0 2011 0 0 0 0 2012 0 0 0 0 2013 2 0 0 0 Total 28 3 0 0 Upper Yukon 1994 2 0 0 0 Salmon Gillnet 1995 4 1 0 0 1996 0 2 0 0 1997 0 0 1 0 1998 1 0 0 0 1999 1 0 0 0 2000 0 0 0 0 2001 0 0 0 0 2002 0 0 0 0 2003 1 0 0 0 2004 1 0 0 0 2005 1 0 0 0 2006 0 0 0 0 2007 0 0 0 0 2008 0 0 0 0 2009 1 0 0 0 2010 1 0 0 0 2011 0 0 0 0 2012 0 0 0 0 2013 0 0 0 0 Total 13 3 1 0 Upper Yukon 1994 0 1 1 0 Salmon Fish Wheel 1995 4 0 0 1 1996 2 1 0 1 1997 1 0 1 1 1998 2 0 0 2 1999 0 0 0 1 2000 2 0 0 1 2001 0 0 0 0 2002 1 0 0 0 2003 0 0 0 0 2004 0 0 0 0 2005 1 0 0 0 2006 3 0 0 0 2007 3 0 0 0 2008 2 0 0 0 2009 0 0 0 0 2010 2 0 0 0 2011 2 0 0 0 2012 4 0 0 0 2013 2 0 0 0 Total 31 2 2 7 Norton Sound 1994 4 2 0 0 Salmon Gillnet 1995 9 2 0 0 1996 2 0 1 0 1997 5 1 0 0
Permit / Person Transferors Consecutive Years Transferred
Permit Type Year 1 2 3 4+ Norton Sound 1998 5 4 0 0 Salmon Gillnet (cont.) 1999 2 2 1 0 2000 5 0 0 1 2001 1 0 0 0 2002 0 0 0 0 2003 0 0 0 0 2004 3 0 0 0 2005 0 1 0 0 2006 3 0 1 0 2007 2 1 0 0 2008 14 2 0 0 2009 10 0 2 0 2010 16 0 0 0 2011 10 4 0 0 2012 10 2 2 0 2013 5 0 2 0 Total 106 21 9 1 Norton Sound Herring 1994 0 0 0 1 Beach Seine 1995 1 0 0 1 1996 0 0 0 1 1997 2 0 0 0 1998 0 2 0 0 1999 2 0 0 0 2000 2 0 0 0 2001 0 1 0 0 2002 0 0 0 0 2003 0 0 0 0 2004 0 0 0 0 2005 0 0 0 0 2006 0 0 0 0 2007 0 0 0 0 2008 0 0 0 0 2009 0 0 0 0 2010 0 0 0 0 2011 0 0 0 0 2012 0 0 0 0 2013 0 0 0 0 Total 7 3 0 3 Norton Sound 1994 12 0 1 2 Herring Gillnet 1995 10 2 0 2 1996 14 2 1 2 1997 8 2 0 3 1998 0 0 0 3 1999 17 0 0 2 2000 2 2 0 1 2001 6 0 0 1 2002 4 0 0 1 2003 2 2 0 1 2004 0 0 0 0 2005 3 0 0 0 2006 2 1 0 0
2007 0 0 0 0 2008 2 0 0 0
2009 1 0 0 0 2010 6 0 0 0
2011 4 2 0 0 2012 0 1 0 0
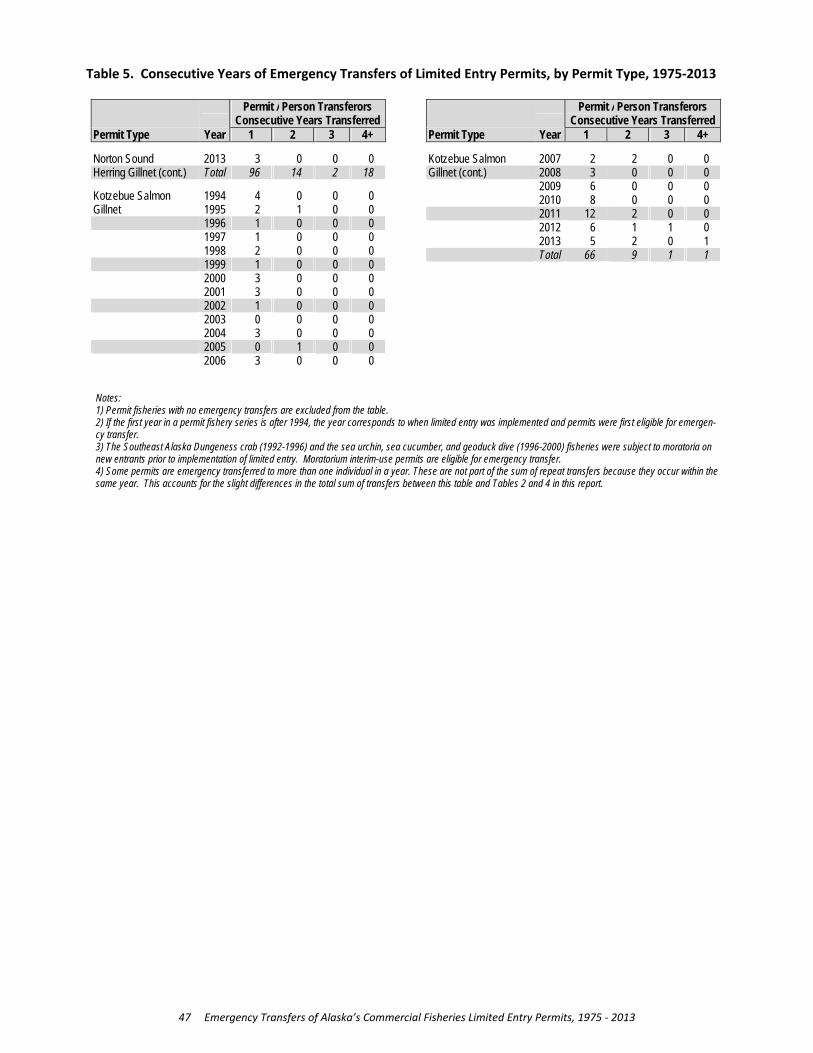
Table 5. Consecutive Years of Emergency Transfers of Limited Entry Permits, by Permit Type, 1975‐2013
47 Emergency Transfers of Alaska’s Commercial Fisheries Limited Entry Permits, 1975 ‐ 2013
Permit / Person Transferors Consecutive Years Transferred
Permit Type Year 1 2 3 4+ Norton Sound 2013 3 0 0 0 Herring Gillnet (cont.) Total 96 14 2 18
Kotzebue Salmon 1994 4 0 0 0 Gillnet 1995 2 1 0 0 1996 1 0 0 0
1997 1 0 0 0 1998 2 0 0 0
1999 1 0 0 0 2000 3 0 0 0 2001 3 0 0 0
2002 1 0 0 0 2003 0 0 0 0 2004 3 0 0 0
2005 0 1 0 0 2006 3 0 0 0
Permit / Person Transferors Consecutive Years Transferred
Permit Type Year 1 2 3 4+ Kotzebue Salmon 2007 2 2 0 0 Gillnet (cont.) 2008 3 0 0 0
2009 6 0 0 0 2010 8 0 0 0
2011 12 2 0 0 2012 6 1 1 0 2013 5 2 0 1
Total 66 9 1 1
Notes: 1) Permit fisheries with no emergency transfers are excluded from the table. 2) If the first year in a permit fishery series is after 1994, the year corresponds to when limited entry was implemented and permits were first eligible for emergen-cy transfer. 3) The Southeast Alaska Dungeness crab (1992-1996) and the sea urchin, sea cucumber, and geoduck dive (1996-2000) fisheries were subject to moratoria on new entrants prior to implementation of limited entry. Moratorium interim-use permits are eligible for emergency transfer. 4) Some permits are emergency transferred to more than one individual in a year. These are not part of the sum of repeat transfers because they occur within the same year. This accounts for the slight differences in the total sum of transfers between this table and Tables 2 and 4 in this report.
48 Emergency Transfers of Alaska’s Commercial Fisheries Limited Entry Permits, 1975 ‐ 2013
Emergency Transfers by Resident Type and/or Relationship
Table 6: Number of Emergency Transfers Between Resident Types, 1994‐2013 Table 7: Rates of Emergency Transfers by Resident Type, 1994‐2013 Table 8: Relationship of Emergency Transferors and Transfer Recipients, by Resident Type, 1994‐2013 Table 9: Relationship of Emergency Transferors and Transfer Recipients, by Permit Type, 1994‐2013
This section provides statistics on emergency transfers of permits based upon where the permit holders reside. Permit holders who live in Alaska are classified into rural or urban communities and local or nonlocal groups.18 Nonresidents of Alaska are classified in a separate category. Each permit then falls into one of five classifications, depending upon the residence of the permit holder:
Alaska resident of a Rural community which is Local to the permitted fishery;
Alaska resident of a Rural community which is Nonlocal to the permitted fishery;
Alaska resident of an Urban community which is Local to the permitted fishery;
Alaska resident of an Urban community which is Nonlocal to the permitted fishery;
Nonresident of Alaska.
Table 6 examines emergency transfers solely by resident type. Intra‐cohort transfers refer to permit exchanges that occur between persons of the same resident type. Cross‐cohort transfers are those that occur between individuals who have separate resident types. Since 1994, approximately two‐thirds (65.0%) of all emergency transfers have been between individuals of the same resident‐type (intra‐cohort). The annual rate has varied very little, ranging from 62.3% to 67.6%.
Permits held by Alaska Rural Locals (ARL) account for the highest number of emergency transfers (ARLs also hold the greatest number of total permits; see Table 7). From 1994 through 2013, 43.8% of all permits emergency transferred were from the ARL resident type. Within the ARL classification, approx‐imately three‐fourths (73.9%, or 5,331) of the transfers were to other ARLs, while the remainder of the ARL transfers (26.1%, or 1,884) were cross‐cohort transactions where the permits went from ARLs to individuals in one of the other four resident types.
Emergency transfers from nonresidents are the next most numerous class of transfer. Since 1994, Non‐residents transferred 4,376 permits: 2,915 (66.6%) went to other Nonresidents, and 1,461 (33.4%) were transferred to persons with an Alaska residency.
Table 7 compares the number and percentage of limited entry permit holdings for each resident type (the sum of permanent and interim‐use permits that are eligible for emergency transfer) with the resi‐dent type’s number and percentage of emergency transfers. The figures again indicate that Alaska Rural Locals hold the highest number of permits. The table also shows that the ARL all‐years average rate of
18 Rural and urban classifications conform to designations determined under the United States Census 2010. Local and nonlocal boundaries closely align with Alaska Department of Fish and Game management areas.

49 Emergency Transfers of Alaska’s Commercial Fisheries Limited Entry Permits, 1975 ‐ 2013
emergency transfers closely corresponds with the ARL percentage of permit holdings; however, the rela‐tive portion of the total emergency transfers by this resident type has declined somewhat since 1994.
Statistics for Alaska Urban Locals (AUL) indicate their percentage of emergency transfers is significantly less than their percentage of total permits, suggesting this resident group tends to emergency transfer their permits at a lesser rate than others. The opposite appears to be true for Nonresidents and for Alaska Urban Nonlocals (AUN): each of these resident types account for a smaller percentage of permit holdings relative to their total emergency transfers.
Tables 8 and 9 present the relationships of the parties involved in emergency transfers. The data indi‐cates that roughly two‐thirds of all emergency transfers have occurred between individuals who know one another. On average over all fisheries, 39.1% of the emergency transfers have been between family members (the sum of Immediate Family and Other Relative), and 29.5% have occurred between Friends/Partners.
Alaska Rural Locals have a significantly higher rate of emergency transfers to family members (49.6%), and a lower rate to the Friend/Partner(s) (22.7%) than the other resident types. Nonresidents record the lowest rates of transfers to family members (23.1%) and the highest rates (36.4%) to persons with whom they have no prior relationship (category ‘None’).
For permit fisheries with a moderately high number of annual emergency transfers (20 or more per year, Table 9), those with comparatively high rates of transfers between persons who have no pre‐existing relationship include Southeast salmon drift gillnet (47.4%), Prince William Sound salmon drift gillnet (43.8%), and Bristol Bay salmon drift gillnet (40.4%). Permit fisheries that show high rates of emergency transfers between family members include Kuskokwim salmon gillnet (87.7%), Lower Yukon salmon gill‐net (84.2%), and Bristol Bay salmon set gillnet (48.7%). Friends/Partners are the predominate receivers of emergency transfer permits in the Northern Southeast Inside sablefish longline fishery (51.2%), and the Kodiak salmon set gillnet fishery (48.7%).
Note that Table 9 shows only the years when emergency transfers occurred for each permit type. If no emergency transfers occurred for a particular permit type and year, it is excluded from the table.

Table 6. Number of Emergency Transfers Between Resident Types, 1994 ‐ 2013
50 Emergency Transfers of Alaska’s Commercial Fisheries Limited Entry Permits, 1975 ‐ 2013
Table 6. Number of Emergency Transfers Between Resident Types, 1994 - 2013
1994 1995 1996 1997 1998 1999 2000 2001 2002 2003 2004 2005 2006 2007 2008 2009 2010 2011 2012 2013
Cross-Cohort From Alaska Rural Local to Alaska Urban Local 8 16 11 8 14 9 11 17 12 6 11 17 11 21 27 21 21 22 11 16
Alaska Urban Non-local 28 31 36 21 20 22 22 18 18 14 15 15 16 18 11 19 21 21 12 17 Alaska Rural Non-local 12 10 16 10 12 13 10 9 10 8 7 4 6 6 4 4 8 8 15 10 Nonresident 73 76 75 77 71 59 53 43 21 25 32 29 26 36 50 59 58 52 58 44
Total 121 133 138 116 117 103 96 87 61 53 65 65 59 81 92 103 108 103 96 87 From Alaska Rural Nonlocal to Alaska Urban Local 0 3 5 1 2 1 0 3 1 2 1 1 1 1 0 0 1 2 1 2
Alaska Rural Local 11 6 10 8 5 7 10 7 8 8 5 2 5 4 5 6 4 7 5 9 Alaska Urban Non-local 11 5 6 4 6 7 2 4 3 3 4 8 8 5 3 3 12 8 9 8 Nonresident 13 10 13 16 13 7 8 5 3 4 7 4 6 5 8 10 23 11 21 23
Total 35 24 34 29 26 22 20 19 15 17 17 15 20 15 16 19 40 28 36 42 From Alaska Urban Local to Alaska Rural Local 12 12 20 24 16 11 20 21 20 15 18 22 21 13 14 18 12 25 22 22
Alaska Urban Non-local 2 1 2 3 3 2 4 0 0 1 1 1 2 2 0 1 1 1 1 0 Alaska Rural Non-local 0 2 2 5 2 0 3 1 2 0 3 2 2 1 1 0 0 2 0 1 Nonresident 6 12 13 14 12 12 12 20 26 24 21 29 25 29 19 14 15 20 26 26
Total 20 27 37 46 33 25 39 42 48 40 43 54 50 45 34 33 28 48 49 49 From Alaska Urban Nonlocal to Alaska Urban Local 7 0 3 2 1 3 2 5 0 2 2 2 1 3 5 1 1 3 2 3
Alaska Rural Local 29 33 25 30 29 31 42 24 23 24 25 35 30 32 19 25 25 18 20 9 Alaska Rural Non-local 13 12 8 13 0 7 2 3 2 3 6 5 6 6 9 3 8 6 4 6 Nonresident 16 19 20 24 22 23 24 19 12 20 20 25 17 21 12 34 30 31 24 24
Total 65 64 56 69 52 64 70 51 37 49 53 67 54 62 45 63 64 58 50 42 From Nonresident to Alaska Urban Local 12 13 5 17 13 18 13 19 23 17 9 23 21 20 15 18 24 29 17 18
Alaska Rural Local 40 31 36 34 40 40 34 31 27 40 34 40 35 35 27 27 33 35 32 25 Alaska Urban Non-local 14 15 9 13 10 13 18 9 5 5 4 8 8 9 17 13 14 12 17 12 Alaska Rural Non-local 17 6 7 11 22 16 18 10 6 9 9 4 9 11 11 7 9 12 11 11
Total 83 65 57 75 85 87 83 69 61 71 56 75 73 75 70 65 80 88 77 66 Intra-Cohort Transfers Between Alaska Rural Local 328 340 272 325 318 305 299 274 222 245 238 266 244 197 222 228 262 251 252 243
Alaska Rural Non-local 32 25 25 30 26 25 32 30 21 18 15 18 22 22 22 25 15 21 18 22 Alaska Urban Local 60 55 71 54 74 76 66 71 71 61 76 68 56 61 59 65 76 84 69 66 Alaska Urban Non-local 41 31 35 20 29 25 29 24 30 28 34 29 43 36 37 45 49 42 32 27 Nonresident 145 138 140 150 138 147 145 137 120 116 126 136 146 143 164 187 165 165 160 147
Total 606 589 543 579 585 578 571 536 464 468 489 517 511 459 504 550 567 563 531 505 GRAND TOTAL 930 902 865 914 898 879 879 804* 686 698 723 793 767 737 761 833 887 888 839 791
* The total excludes one emergency transfer from the Department of Commerce, Community, and Economic Development (DCCED).
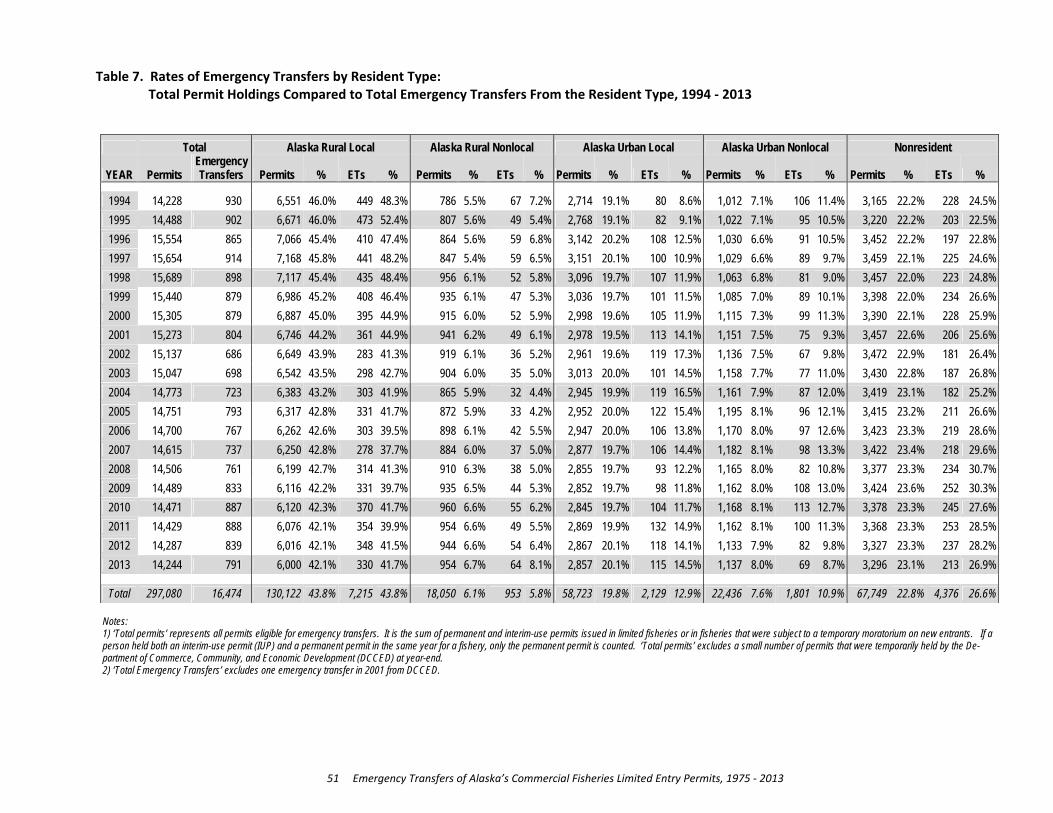
Table 7. Rates of Emergency Transfers by Resident Type: Total Permit Holdings Compared to Total Emergency Transfers From the Resident Type, 1994 ‐ 2013
51 Emergency Transfers of Alaska’s Commercial Fisheries Limited Entry Permits, 1975 ‐ 2013
Table 7. Rates of Emergency Transfers by Resident Type: Total Permit Holdings Compared to Total Emergency Transfers From the Resident Type, 1994 - 2013
Total Alaska Rural Local Alaska Rural Nonlocal Alaska Urban Local Alaska Urban Nonlocal Nonresident
YEAR Permits Emergency Transfers Permits % ETs % Permits % ETs % Permits % ETs % Permits % ETs % Permits % ETs %
1994 14,228 930 6,551 46.0% 449 48.3% 786 5.5% 67 7.2% 2,714 19.1% 80 8.6% 1,012 7.1% 106 11.4% 3,165 22.2% 228 24.5%
1995 14,488 902 6,671 46.0% 473 52.4% 807 5.6% 49 5.4% 2,768 19.1% 82 9.1% 1,022 7.1% 95 10.5% 3,220 22.2% 203 22.5%
1996 15,554 865 7,066 45.4% 410 47.4% 864 5.6% 59 6.8% 3,142 20.2% 108 12.5% 1,030 6.6% 91 10.5% 3,452 22.2% 197 22.8%
1997 15,654 914 7,168 45.8% 441 48.2% 847 5.4% 59 6.5% 3,151 20.1% 100 10.9% 1,029 6.6% 89 9.7% 3,459 22.1% 225 24.6%
1998 15,689 898 7,117 45.4% 435 48.4% 956 6.1% 52 5.8% 3,096 19.7% 107 11.9% 1,063 6.8% 81 9.0% 3,457 22.0% 223 24.8%
1999 15,440 879 6,986 45.2% 408 46.4% 935 6.1% 47 5.3% 3,036 19.7% 101 11.5% 1,085 7.0% 89 10.1% 3,398 22.0% 234 26.6%
2000 15,305 879 6,887 45.0% 395 44.9% 915 6.0% 52 5.9% 2,998 19.6% 105 11.9% 1,115 7.3% 99 11.3% 3,390 22.1% 228 25.9%
2001 15,273 804 6,746 44.2% 361 44.9% 941 6.2% 49 6.1% 2,978 19.5% 113 14.1% 1,151 7.5% 75 9.3% 3,457 22.6% 206 25.6%
2002 15,137 686 6,649 43.9% 283 41.3% 919 6.1% 36 5.2% 2,961 19.6% 119 17.3% 1,136 7.5% 67 9.8% 3,472 22.9% 181 26.4%
2003 15,047 698 6,542 43.5% 298 42.7% 904 6.0% 35 5.0% 3,013 20.0% 101 14.5% 1,158 7.7% 77 11.0% 3,430 22.8% 187 26.8%
2004 14,773 723 6,383 43.2% 303 41.9% 865 5.9% 32 4.4% 2,945 19.9% 119 16.5% 1,161 7.9% 87 12.0% 3,419 23.1% 182 25.2%
2005 14,751 793 6,317 42.8% 331 41.7% 872 5.9% 33 4.2% 2,952 20.0% 122 15.4% 1,195 8.1% 96 12.1% 3,415 23.2% 211 26.6%
2006 14,700 767 6,262 42.6% 303 39.5% 898 6.1% 42 5.5% 2,947 20.0% 106 13.8% 1,170 8.0% 97 12.6% 3,423 23.3% 219 28.6%
2007 14,615 737 6,250 42.8% 278 37.7% 884 6.0% 37 5.0% 2,877 19.7% 106 14.4% 1,182 8.1% 98 13.3% 3,422 23.4% 218 29.6%
2008 14,506 761 6,199 42.7% 314 41.3% 910 6.3% 38 5.0% 2,855 19.7% 93 12.2% 1,165 8.0% 82 10.8% 3,377 23.3% 234 30.7%
2009 14,489 833 6,116 42.2% 331 39.7% 935 6.5% 44 5.3% 2,852 19.7% 98 11.8% 1,162 8.0% 108 13.0% 3,424 23.6% 252 30.3%
2010 14,471 887 6,120 42.3% 370 41.7% 960 6.6% 55 6.2% 2,845 19.7% 104 11.7% 1,168 8.1% 113 12.7% 3,378 23.3% 245 27.6%
2011 14,429 888 6,076 42.1% 354 39.9% 954 6.6% 49 5.5% 2,869 19.9% 132 14.9% 1,162 8.1% 100 11.3% 3,368 23.3% 253 28.5%
2012 14,287 839 6,016 42.1% 348 41.5% 944 6.6% 54 6.4% 2,867 20.1% 118 14.1% 1,133 7.9% 82 9.8% 3,327 23.3% 237 28.2%
2013 14,244 791 6,000 42.1% 330 41.7% 954 6.7% 64 8.1% 2,857 20.1% 115 14.5% 1,137 8.0% 69 8.7% 3,296 23.1% 213 26.9%
Total 297,080 16,474 130,122 43.8% 7,215 43.8% 18,050 6.1% 953 5.8% 58,723 19.8% 2,129 12.9% 22,436 7.6% 1,801 10.9% 67,749 22.8% 4,376 26.6%
Notes: 1) ‘Total permits’ represents all permits eligible for emergency transfers. It is the sum of permanent and interim-use permits issued in limited fisheries or in fisheries that were subject to a temporary moratorium on new entrants. If a person held both an interim-use permit (IUP) and a permanent permit in the same year for a fishery, only the permanent permit is counted. ‘Total permits’ excludes a small number of permits that were temporarily held by the De-partment of Commerce, Community, and Economic Development (DCCED) at year-end. 2) ‘Total Emergency Transfers’ excludes one emergency transfer in 2001 from DCCED.

Table 8. Relationship of Emergency Transferors to Transfer Recipients, by Resident Type
52 Emergency Transfers of Alaska’s Commercial Fisheries Limited Entry Permits, 1975 ‐ 2013
Table 8. Relationship of Emergency Transferors to Transfer Recipients, by Resident Type Permit Type Year Friend/Partner Immediate Family Other Relative None Other Unanswered Total All Resident Types 1994 132 26.4% 160 32.0% 28 5.6% 90 18.0% 87 17.4% 3 0.6% 500 (with emergency 1995 277 30.7% 291 32.3% 46 5.1% 224 24.9% 16 1.8% 47 5.2% 901 transfer surveys) 1996 227 26.2% 287 33.2% 38 4.4% 228 26.4% 15 1.7% 70 8.1% 865 1997 268 29.3% 306 33.5% 63 6.9% 248 27.1% 13 1.4% 16 1.8% 914 1998 286 31.8% 302 33.6% 60 6.7% 226 25.2% 10 1.1% 14 1.6% 898 1999 264 30.0% 295 33.6% 56 6.4% 237 27.0% 18 2.0% 9 1.0% 879 2000 278 31.6% 301 34.2% 53 6.0% 226 25.7% 13 1.5% 8 0.9% 879 2001 267 33.2% 266 33.0% 44 5.5% 206 25.6% 15 1.9% 7 0.9% 805 2002 207 30.2% 252 36.7% 46 6.7% 168 24.5% 8 1.2% 5 0.7% 686 2003 224 32.1% 251 36.0% 44 6.3% 164 23.5% 10 1.4% 5 0.7% 698 2004 212 29.3% 264 36.5% 45 6.2% 180 24.9% 16 2.2% 6 0.8% 723 2005 245 30.9% 276 34.8% 47 5.9% 188 23.7% 15 1.9% 22 2.8% 793 2006 244 31.8% 263 34.3% 36 4.7% 194 25.3% 18 2.3% 12 1.6% 767 2007 214 29.0% 252 34.2% 25 3.4% 221 30.0% 14 1.9% 11 1.5% 737 2008 242 31.8% 244 32.1% 31 4.1% 219 28.8% 17 2.2% 8 1.1% 761 2009 220 26.4% 287 34.5% 29 3.5% 271 32.5% 17 2.0% 9 1.1% 833 2010 217 24.5% 306 34.5% 43 4.8% 289 32.6% 18 2.0% 14 1.6% 887 2011 229 25.8% 301 33.9% 45 5.1% 295 33.2% 8 0.9% 10 1.1% 888 2012 233 27.8% 267 31.8% 47 5.6% 277 33.0% 10 1.2% 5 0.6% 839 2013 248 31.4% 240 30.3% 36 4.6% 252 31.9% 15 1.9% 0 0.0% 791 Total 4,734 29.5% 5,411 33.7% 862 5.4% 4,403 27.4% 353 2.2% 281 1.8% 16,044 Alaska Rural Local 1994 50 20.6% 98 40.3% 18 7.4% 35 14.4% 40 16.5% 2 0.8% 243 1995 112 23.7% 180 38.1% 30 6.4% 110 23.3% 11 2.3% 29 6.1% 472 1996 85 20.7% 154 37.6% 21 5.1% 109 26.6% 8 2.0% 33 8.0% 410 1997 108 24.5% 178 40.4% 37 8.4% 105 23.8% 6 1.4% 7 1.6% 441 1998 106 24.4% 187 43.0% 35 8.0% 97 22.3% 4 0.9% 6 1.4% 435 1999 97 23.8% 173 42.4% 29 7.1% 97 23.8% 9 2.2% 3 0.7% 408 2000 100 25.3% 169 42.8% 30 7.6% 85 21.5% 7 1.8% 4 1.0% 395 2001 106 29.4% 147 40.7% 26 7.2% 70 19.4% 9 2.5% 3 0.8% 361 2002 66 23.3% 134 47.3% 28 9.9% 49 17.3% 3 1.1% 3 1.1% 283 2003 62 20.8% 146 49.0% 28 9.4% 55 18.5% 4 1.3% 3 1.0% 298 2004 65 21.5% 137 45.2% 23 7.6% 67 22.1% 8 2.6% 3 1.0% 303 2005 78 23.6% 156 47.1% 27 8.2% 57 17.2% 5 1.5% 8 2.4% 331 2006 61 20.1% 146 48.2% 21 6.9% 58 19.1% 9 3.0% 8 2.6% 303 2007 58 20.9% 129 46.4% 12 4.3% 69 24.8% 4 1.4% 6 2.2% 278 2008 76 24.2% 127 40.4% 17 5.4% 84 26.8% 9 2.9% 1 0.3% 314 2009 71 21.5% 144 43.5% 14 4.2% 86 26.0% 11 3.3% 5 1.5% 331 2010 76 20.5% 166 44.9% 21 5.7% 94 25.4% 8 2.2% 5 1.4% 370 2011 73 20.6% 146 41.2% 22 6.2% 104 29.4% 5 1.4% 4 1.1% 354 2012 67 19.3% 142 40.8% 24 6.9% 107 30.7% 5 1.4% 3 0.9% 348 2013 73 22.1% 130 39.4% 19 5.8% 102 30.9% 6 1.8% 0 0.0% 330 Total 1,590 22.7% 2,989 42.7% 482 6.9% 1,640 23.4% 171 2.4% 136 1.9% 7,008 Alaska Rural Nonlocal 1994 12 34.3% 9 25.7% 1 2.9% 8 22.9% 4 11.4% 1 2.9% 35 1995 15 30.6% 16 32.7% 2 4.1% 13 26.5% 1 2.0% 2 4.1% 49 1996 15 25.4% 16 27.1% 2 3.4% 19 32.2% 3 5.1% 4 6.8% 59 1997 11 18.6% 24 40.7% 7 11.9% 16 27.1% 1 1.7% 0 0.0% 59 1998 15 28.8% 14 26.9% 1 1.9% 17 32.7% 1 1.9% 4 7.7% 52 1999 12 25.5% 18 38.3% 1 2.1% 11 23.4% 2 4.3% 3 6.4% 47 2000 14 26.9% 23 44.2% 3 5.8% 12 23.1% 0 0.0% 0 0.0% 52 2001 14 28.6% 23 46.9% 2 4.1% 9 18.4% 1 2.0% 0 0.0% 49 2002 12 33.3% 15 41.7% 3 8.3% 6 16.7% 0 0.0% 0 0.0% 36 2003 11 31.4% 14 40.0% 3 8.6% 6 17.1% 1 2.9% 0 0.0% 35 2004 6 18.8% 13 40.6% 3 9.4% 9 28.1% 1 3.1% 0 0.0% 32 2005 10 30.3% 16 48.5% 1 3.0% 4 12.1% 0 0.0% 2 6.1% 33 2006 13 31.0% 14 33.3% 2 4.8% 11 26.2% 1 2.4% 1 2.4% 42 2007 7 18.9% 19 51.4% 1 2.7% 10 27.0% 0 0.0% 0 0.0% 37 2008 9 23.7% 16 42.1% 2 5.3% 9 23.7% 2 5.3% 0 0.0% 38

Table 8. Relationship of Emergency Transferors to Transfer Recipients, by Resident Type
53 Emergency Transfers of Alaska’s Commercial Fisheries Limited Entry Permits, 1975 ‐ 2013
Permit Type Year Friend/Partner Immediate Family Other Relative None Other Unanswered Total Alaska Rural Nonlocal 2009 13 29.5% 17 38.6% 1 2.3% 12 27.3% 0 0.0% 1 2.3% 44 (cont.) 2010 17 30.9% 13 23.6% 1 1.8% 23 41.8% 0 0.0% 1 1.8% 55 2011 10 20.4% 16 32.7% 4 8.2% 18 36.7% 0 0.0% 1 2.0% 49 2012 19 35.2% 16 29.6% 2 3.7% 15 27.8% 2 3.7% 0 0.0% 54 2013 20 31.3% 17 26.6% 5 7.8% 18 28.1% 4 6.3% 0 0.0% 64 Total 255 27.7% 329 35.7% 47 5.1% 246 26.7% 24 2.6% 20 2.2% 921 Alaska Urban Local 1994 11 23.9% 13 28.3% 1 2.2% 14 30.4% 7 15.2% 0 0.0% 46 1995 30 36.6% 32 39.0% 1 1.2% 16 19.5% 0 0.0% 3 3.7% 82 1996 36 33.3% 42 38.9% 1 0.9% 19 17.6% 0 0.0% 10 9.3% 108 1997 39 39.0% 30 30.0% 5 5.0% 25 25.0% 1 1.0% 0 0.0% 100 1998 40 37.4% 36 33.6% 4 3.7% 23 21.5% 4 3.7% 0 0.0% 107 1999 41 40.6% 34 33.7% 4 4.0% 21 20.8% 1 1.0% 0 0.0% 101 2000 45 42.9% 32 30.5% 5 4.8% 21 20.0% 2 1.9% 0 0.0% 105 2001 53 46.9% 29 25.7% 4 3.5% 26 23.0% 0 0.0% 1 0.9% 113 2002 49 41.2% 33 27.7% 4 3.4% 29 24.4% 3 2.5% 1 0.8% 119 2003 47 46.5% 29 28.7% 2 2.0% 23 22.8% 0 0.0% 0 0.0% 101 2004 51 42.9% 38 31.9% 2 1.7% 28 23.5% 0 0.0% 0 0.0% 119 2005 54 44.3% 35 28.7% 7 5.7% 19 15.6% 3 2.5% 4 3.3% 122 2006 60 56.6% 25 23.6% 1 0.9% 20 18.9% 0 0.0% 0 0.0% 106 2007 50 47.2% 31 29.2% 2 1.9% 19 17.9% 2 1.9% 2 1.9% 106 2008 38 40.9% 32 34.4% 0 0.0% 20 21.5% 1 1.1% 2 2.2% 93 2009 32 32.7% 38 38.8% 3 3.1% 24 24.5% 1 1.0% 0 0.0% 98 2010 33 31.7% 34 32.7% 4 3.8% 28 26.9% 4 3.8% 1 1.0% 104 2011 41 31.1% 42 31.8% 7 5.3% 39 29.5% 1 0.8% 2 1.5% 132 2012 40 33.9% 38 32.2% 6 5.1% 32 27.1% 1 0.8% 1 0.8% 118 2013 52 45.2% 33 28.7% 3 2.6% 27 23.5% 0 0.0% 0 0.0% 115 Total 842 40.2% 656 31.3% 66 3.2% 473 22.6% 31 1.5% 27 1.3% 2,095 Alaska Urban 1994 16 25.4% 16 25.4% 4 6.3% 17 27.0% 10 15.9% 0 0.0% 63 Nonlocal 1995 34 35.8% 24 25.3% 8 8.4% 24 25.3% 2 2.1% 3 3.2% 95 1996 23 25.3% 30 33.0% 5 5.5% 22 24.2% 2 2.2% 9 9.9% 91 1997 23 25.8% 26 29.2% 6 6.7% 30 33.7% 1 1.1% 3 3.4% 89 1998 26 32.1% 25 30.9% 8 9.9% 20 24.7% 0 0.0% 2 2.5% 81 1999 24 27.0% 32 36.0% 8 9.0% 24 27.0% 1 1.1% 0 0.0% 89 2000 29 29.3% 37 37.4% 6 6.1% 24 24.2% 2 2.0% 1 1.0% 99 2001 18 24.0% 25 33.3% 4 5.3% 25 33.3% 1 1.3% 2 2.7% 75 2002 20 29.9% 25 37.3% 5 7.5% 17 25.4% 0 0.0% 0 0.0% 67 2003 24 31.2% 27 35.1% 8 10.4% 18 23.4% 0 0.0% 0 0.0% 77 2004 20 23.0% 41 47.1% 6 6.9% 17 19.5% 3 3.4% 0 0.0% 87 2005 29 30.2% 32 33.3% 7 7.3% 21 21.9% 4 4.2% 3 3.1% 96 2006 28 28.9% 37 38.1% 8 8.2% 22 22.7% 2 2.1% 0 0.0% 97 2007 23 23.5% 34 34.7% 6 6.1% 31 31.6% 3 3.1% 1 1.0% 98 2008 28 34.1% 27 32.9% 4 4.9% 19 23.2% 1 1.2% 3 3.7% 82 2009 20 18.5% 41 38.0% 6 5.6% 39 36.1% 2 1.9% 0 0.0% 108 2010 27 23.9% 40 35.4% 6 5.3% 35 31.0% 2 1.8% 3 2.7% 113 2011 25 25.0% 30 30.0% 9 9.0% 36 36.0% 0 0.0% 0 0.0% 100 2012 19 23.2% 31 37.8% 3 3.7% 29 35.4% 0 0.0% 0 0.0% 82 2013 21 30.4% 22 31.9% 2 2.9% 23 33.3% 1 1.4% 0 0.0% 69 Total 477 27.1% 602 34.2% 119 6.8% 493 28.0% 37 2.1% 30 1.7% 1,758 Nonresident 1994 43 38.1% 24 21.2% 4 3.5% 16 14.2% 26 23.0% 0 0.0% 113 1995 86 42.4% 39 19.2% 5 2.5% 61 30.0% 2 1.0% 10 4.9% 203 1996 68 34.5% 45 22.8% 9 4.6% 59 29.9% 2 1.0% 14 7.1% 197 1997 87 38.7% 48 21.3% 8 3.6% 72 32.0% 4 1.8% 6 2.7% 225 1998 99 44.4% 40 17.9% 12 5.4% 69 30.9% 1 0.4% 2 0.9% 223 1999 90 38.5% 38 16.2% 14 6.0% 84 35.9% 5 2.1% 3 1.3% 234 2000 90 39.5% 40 17.5% 9 3.9% 84 36.8% 2 0.9% 3 1.3% 228 2001 76 36.9% 42 20.4% 8 3.9% 76 36.9% 4 1.9% 0 0.0% 206 2002 60 33.1% 45 24.9% 6 3.3% 67 37.0% 2 1.1% 1 0.6% 181

Table 8. Relationship of Emergency Transferors to Transfer Recipients, by Resident Type
54 Emergency Transfers of Alaska’s Commercial Fisheries Limited Entry Permits, 1975 ‐ 2013
Permit Type Year Friend/Partner Immediate Family Other Relative None Other Unanswered Total Nonresident (cont.) 2003 80 42.8% 35 18.7% 3 1.6% 62 33.2% 5 2.7% 2 1.1% 187 2004 70 38.5% 35 19.2% 11 6.0% 59 32.4% 4 2.2% 3 1.6% 182 2005 74 35.1% 37 17.5% 5 2.4% 87 41.2% 3 1.4% 5 2.4% 211 2006 82 37.4% 41 18.7% 4 1.8% 83 37.9% 6 2.7% 3 1.4% 219 2007 76 34.9% 39 17.9% 4 1.8% 92 42.2% 5 2.3% 2 0.9% 218 2008 91 38.9% 42 17.9% 8 3.4% 87 37.2% 4 1.7% 2 0.9% 234 2009 84 33.3% 47 18.7% 5 2.0% 110 43.7% 3 1.2% 3 1.2% 252 2010 64 26.1% 53 21.6% 11 4.5% 109 44.5% 4 1.6% 4 1.6% 245 2011 80 31.6% 67 26.5% 3 1.2% 98 38.7% 2 0.8% 3 1.2% 253 2012 88 37.1% 40 16.9% 12 5.1% 94 39.7% 2 0.8% 1 0.4% 237 2013 82 38.5% 38 17.8% 7 3.3% 82 38.5% 4 1.9% 0 0.0% 213 Total 1,570 36.8% 835 19.6% 148 3.5% 1,551 36.4% 90 2.1% 67 1.6% 4,261 Figures in this table summarize data collected from the survey portion of the CFEC emergency transfer form. The survey was first implemented in 1994. During the transition, 431 emergency transfers were processed without surveys, which accounts for the differences in the totals be-tween this table and other tables in this report that summarize all emergency transfers.

Table 9. Relationship of Emergency Transferors to Transfer Recipients by, Permit Type
55 Emergency Transfers of Alaska’s Commercial Fisheries Limited Entry Permits, 1975 ‐ 2013
Table 9. Relationship of Emergency Transferors to Transfer Recipients, by Permit Type
Permit Type Year Friend/Partner Immediate Family Other Relative None Other Unanswered Total All Permit Fisheries 1994 132 26.4% 160 32.0% 28 5.6% 90 18.0% 87 17.4% 3 0.6% 500 (with emergency 1995 277 30.7% 291 32.3% 46 5.1% 224 24.9% 16 1.8% 47 5.2% 901 transfer surveys) 1996 227 26.2% 287 33.2% 38 4.4% 228 26.4% 15 1.7% 70 8.1% 865 1997 268 29.3% 306 33.5% 63 6.9% 248 27.1% 13 1.4% 16 1.8% 914 1998 286 31.8% 302 33.6% 60 6.7% 226 25.2% 10 1.1% 14 1.6% 898 1999 264 30.0% 295 33.6% 56 6.4% 237 27.0% 18 2.0% 9 1.0% 879 2000 278 31.6% 301 34.2% 53 6.0% 226 25.7% 13 1.5% 8 0.9% 879 2001 267 33.2% 266 33.0% 44 5.5% 206 25.6% 15 1.9% 7 0.9% 805
2002 207 30.2% 252 36.7% 46 6.7% 168 24.5% 8 1.2% 5 0.7% 686 2003 224 32.1% 251 36.0% 44 6.3% 164 23.5% 10 1.4% 5 0.7% 698
2004 212 29.3% 264 36.5% 45 6.2% 180 24.9% 16 2.2% 6 0.8% 723 2005 245 30.9% 276 34.8% 47 5.9% 188 23.7% 15 1.9% 22 2.8% 793
2006 244 31.8% 263 34.3% 36 4.7% 194 25.3% 18 2.3% 12 1.6% 767 2007 214 29.0% 252 34.2% 25 3.4% 221 30.0% 14 1.9% 11 1.5% 737 2008 242 31.8% 244 32.1% 31 4.1% 219 28.8% 17 2.2% 8 1.1% 761
2009 220 26.4% 287 34.5% 29 3.5% 271 32.5% 17 2.0% 9 1.1% 833 2010 217 24.5% 306 34.5% 43 4.8% 289 32.6% 18 2.0% 14 1.6% 887 2011 229 25.8% 301 33.9% 45 5.1% 295 33.2% 8 0.9% 10 1.1% 888
2012 233 27.8% 267 31.8% 47 5.6% 277 33.0% 10 1.2% 5 0.6% 839 2013 248 31.4% 240 30.3% 36 4.6% 252 31.9% 15 1.9% 0 0.0% 791 Total 4,734 29.5% 5,411 33.7% 862 5.4% 4,403 27.4% 353 2.2% 281 1.8% 16,044
Salmon Power Troll 1994 2 16.7% 2 16.7% 0 0.0% 6 50.0% 2 16.7% 0 0.0% 12 1995 12 44.4% 9 33.3% 1 3.7% 5 18.5% 0 0.0% 0 0.0% 27 1996 4 26.7% 4 26.7% 1 6.7% 5 33.3% 0 0.0% 1 6.7% 15
1997 6 28.6% 8 38.1% 0 0.0% 7 33.3% 0 0.0% 0 0.0% 21 1998 11 45.8% 6 25.0% 0 0.0% 7 29.2% 0 0.0% 0 0.0% 24 1999 10 34.5% 5 17.2% 0 0.0% 13 44.8% 1 3.4% 0 0.0% 29
2000 11 42.3% 8 30.8% 0 0.0% 6 23.1% 1 3.8% 0 0.0% 26 2001 12 42.9% 6 21.4% 1 3.6% 9 32.1% 0 0.0% 0 0.0% 28 2002 11 42.3% 6 23.1% 0 0.0% 8 30.8% 1 3.8% 0 0.0% 26
2003 12 48.0% 4 16.0% 0 0.0% 9 36.0% 0 0.0% 0 0.0% 25 2004 11 39.3% 7 25.0% 2 7.1% 8 28.6% 0 0.0% 0 0.0% 28 2005 8 25.0% 7 21.9% 3 9.4% 11 34.4% 0 0.0% 3 9.4% 32
2006 10 40.0% 5 20.0% 1 4.0% 7 28.0% 2 8.0% 0 0.0% 25 2007 10 35.7% 9 32.1% 0 0.0% 8 28.6% 1 3.6% 0 0.0% 28 2008 8 32.0% 8 32.0% 0 0.0% 8 32.0% 1 4.0% 0 0.0% 25
2009 4 18.2% 9 40.9% 0 0.0% 8 36.4% 1 4.5% 0 0.0% 22 2010 10 34.5% 6 20.7% 3 10.3% 9 31.0% 1 3.4% 0 0.0% 29 2011 12 22.2% 14 25.9% 0 0.0% 27 50.0% 1 1.9% 0 0.0% 54
2012 8 23.5% 6 17.6% 0 0.0% 19 55.9% 0 0.0% 1 2.9% 34 2013 14 43.8% 4 12.5% 1 3.1% 13 40.6% 0 0.0% 0 0.0% 32 Total 186 34.3% 133 24.5% 13 2.4% 193 35.6% 12 2.2% 5 0.9% 542
Salmon Hand Troll 1994 3 42.9% 2 28.6% 0 0.0% 1 14.3% 1 14.3% 0 0.0% 7 1995 4 23.5% 4 23.5% 0 0.0% 7 41.2% 0 0.0% 2 11.8% 17 1996 7 53.8% 0 0.0% 2 15.4% 3 23.1% 1 7.7% 0 0.0% 13
1997 4 40.0% 2 20.0% 0 0.0% 2 20.0% 0 0.0% 2 20.0% 10 1998 1 12.5% 4 50.0% 1 12.5% 2 25.0% 0 0.0% 0 0.0% 8 1999 4 22.2% 6 33.3% 3 16.7% 5 27.8% 0 0.0% 0 0.0% 18
2000 3 23.1% 4 30.8% 1 7.7% 5 38.5% 0 0.0% 0 0.0% 13 2001 4 33.3% 3 25.0% 2 16.7% 3 25.0% 0 0.0% 0 0.0% 12 2002 4 28.6% 3 21.4% 1 7.1% 6 42.9% 0 0.0% 0 0.0% 14
2003 8 33.3% 11 45.8% 0 0.0% 5 20.8% 0 0.0% 0 0.0% 24 2004 5 21.7% 7 30.4% 0 0.0% 10 43.5% 1 4.3% 0 0.0% 23 2005 10 43.5% 2 8.7% 2 8.7% 5 21.7% 0 0.0% 4 17.4% 23
2006 9 32.1% 8 28.6% 0 0.0% 9 32.1% 1 3.6% 1 3.6% 28 2007 6 30.0% 7 35.0% 0 0.0% 6 30.0% 0 0.0% 1 5.0% 20 2008 6 23.1% 5 19.2% 1 3.8% 13 50.0% 1 3.8% 0 0.0% 26
2009 6 25.0% 4 16.7% 0 0.0% 13 54.2% 1 4.2% 0 0.0% 24

Table 9. Relationship of Emergency Transferors to Transfer Recipients by, Permit Type
56 Emergency Transfers of Alaska’s Commercial Fisheries Limited Entry Permits, 1975 ‐ 2013
Permit Type Year Friend/Partner Immediate Family Other Relative None Other Unanswered Total Salmon Hand Troll 2010 7 35.0% 8 40.0% 0 0.0% 2 10.0% 2 10.0% 1 5.0% 20 (cont.) 2011 11 31.4% 6 17.1% 0 0.0% 17 48.6% 1 2.9% 0 0.0% 35 2012 7 28.0% 7 28.0% 0 0.0% 11 44.0% 0 0.0% 0 0.0% 25
2013 13 59.1% 3 13.6% 0 0.0% 5 22.7% 1 4.5% 0 0.0% 22 Total 122 31.9% 96 25.1% 13 3.4% 130 34.0% 10 2.6% 11 2.9% 382
Southeast Salmon 1994 3 25.0% 4 33.3% 0 0.0% 2 16.7% 2 16.7% 1 8.3% 12 Purse Seine 1995 9 39.1% 5 21.7% 1 4.3% 7 30.4% 0 0.0% 1 4.3% 23
1996 13 59.1% 3 13.6% 0 0.0% 6 27.3% 0 0.0% 0 0.0% 22 1997 10 50.0% 5 25.0% 0 0.0% 3 15.0% 2 10.0% 0 0.0% 20
1998 12 38.7% 8 25.8% 2 6.5% 9 29.0% 0 0.0% 0 0.0% 31 1999 4 20.0% 5 25.0% 2 10.0% 9 45.0% 0 0.0% 0 0.0% 20
2000 9 34.6% 6 23.1% 0 0.0% 11 42.3% 0 0.0% 0 0.0% 26 2001 10 34.5% 6 20.7% 1 3.4% 12 41.4% 0 0.0% 0 0.0% 29 2002 2 14.3% 6 42.9% 0 0.0% 6 42.9% 0 0.0% 0 0.0% 14
2003 2 18.2% 4 36.4% 1 9.1% 4 36.4% 0 0.0% 0 0.0% 11 2004 2 20.0% 6 60.0% 1 10.0% 1 10.0% 0 0.0% 0 0.0% 10 2005 3 15.8% 10 52.6% 0 0.0% 4 21.1% 2 10.5% 0 0.0% 19
2006 5 41.7% 3 25.0% 0 0.0% 3 25.0% 0 0.0% 1 8.3% 12 2007 8 72.7% 1 9.1% 0 0.0% 1 9.1% 1 9.1% 0 0.0% 11 2008 8 50.0% 3 18.8% 0 0.0% 5 31.3% 0 0.0% 0 0.0% 16
2009 6 30.0% 4 20.0% 0 0.0% 8 40.0% 2 10.0% 0 0.0% 20 2010 5 29.4% 2 11.8% 1 5.9% 9 52.9% 0 0.0% 0 0.0% 17 2011 9 34.6% 8 30.8% 2 7.7% 7 26.9% 0 0.0% 0 0.0% 26
2012 6 23.1% 8 30.8% 2 7.7% 10 38.5% 0 0.0% 0 0.0% 26 2013 9 39.1% 6 26.1% 1 4.3% 7 30.4% 0 0.0% 0 0.0% 23 Total 135 34.8% 103 26.5% 14 3.6% 124 32.0% 9 2.3% 3 0.8% 388
Southeast Salmon 1994 7 33.3% 4 19.0% 0 0.0% 4 19.0% 6 28.6% 0 0.0% 21 Drift Gillnet 1995 7 31.8% 6 27.3% 0 0.0% 9 40.9% 0 0.0% 0 0.0% 22
1996 11 36.7% 2 6.7% 1 3.3% 16 53.3% 0 0.0% 0 0.0% 30 1997 14 51.9% 3 11.1% 2 7.4% 7 25.9% 0 0.0% 1 3.7% 27
1998 7 26.9% 8 30.8% 0 0.0% 11 42.3% 0 0.0% 0 0.0% 26 1999 17 48.6% 4 11.4% 0 0.0% 14 40.0% 0 0.0% 0 0.0% 35
2000 11 34.4% 9 28.1% 0 0.0% 12 37.5% 0 0.0% 0 0.0% 32 2001 9 26.5% 9 26.5% 0 0.0% 16 47.1% 0 0.0% 0 0.0% 34 2002 7 28.0% 7 28.0% 1 4.0% 10 40.0% 0 0.0% 0 0.0% 25
2003 3 18.8% 6 37.5% 1 6.3% 6 37.5% 0 0.0% 0 0.0% 16 2004 2 11.8% 6 35.3% 1 5.9% 7 41.2% 1 5.9% 0 0.0% 17 2005 8 33.3% 6 25.0% 0 0.0% 10 41.7% 0 0.0% 0 0.0% 24
2006 11 55.0% 4 20.0% 1 5.0% 4 20.0% 0 0.0% 0 0.0% 20 2007 7 29.2% 4 16.7% 1 4.2% 11 45.8% 0 0.0% 1 4.2% 24 2008 5 19.2% 6 23.1% 1 3.8% 14 53.8% 0 0.0% 0 0.0% 26
2009 7 31.8% 2 9.1% 0 0.0% 13 59.1% 0 0.0% 0 0.0% 22 2010 4 14.8% 3 11.1% 0 0.0% 19 70.4% 1 3.7% 0 0.0% 27 2011 6 16.7% 3 8.3% 0 0.0% 27 75.0% 0 0.0% 0 0.0% 36
2012 3 8.8% 6 17.6% 0 0.0% 25 73.5% 0 0.0% 0 0.0% 34 2013 9 39.1% 1 4.3% 0 0.0% 12 52.2% 1 4.3% 0 0.0% 23 Total 155 29.8% 99 19.0% 9 1.7% 247 47.4% 9 1.7% 2 0.4% 521
Southeast Roe 1995 1 100.0% 0 0.0% 0 0.0% 0 0.0% 0 0.0% 0 0.0% 1 Herring Purse Seine 1999 0 0.0% 1 100.0% 0 0.0% 0 0.0% 0 0.0% 0 0.0% 1
2001 1 33.3% 2 66.7% 0 0.0% 0 0.0% 0 0.0% 0 0.0% 3 2002 1 20.0% 4 80.0% 0 0.0% 0 0.0% 0 0.0% 0 0.0% 5
2003 2 33.3% 4 66.7% 0 0.0% 0 0.0% 0 0.0% 0 0.0% 6 2004 2 33.3% 3 50.0% 1 16.7% 0 0.0% 0 0.0% 0 0.0% 6
2005 1 14.3% 5 71.4% 0 0.0% 1 14.3% 0 0.0% 0 0.0% 7 2006 2 33.3% 1 16.7% 0 0.0% 2 33.3% 0 0.0% 1 16.7% 6 2007 0 0.0% 3 100.0% 0 0.0% 0 0.0% 0 0.0% 0 0.0% 3
2008 1 33.3% 1 33.3% 0 0.0% 0 0.0% 1 33.3% 0 0.0% 3 2009 0 0.0% 0 0.0% 0 0.0% 1 50.0% 1 50.0% 0 0.0% 2 2010 2 50.0% 1 25.0% 0 0.0% 1 25.0% 0 0.0% 0 0.0% 4
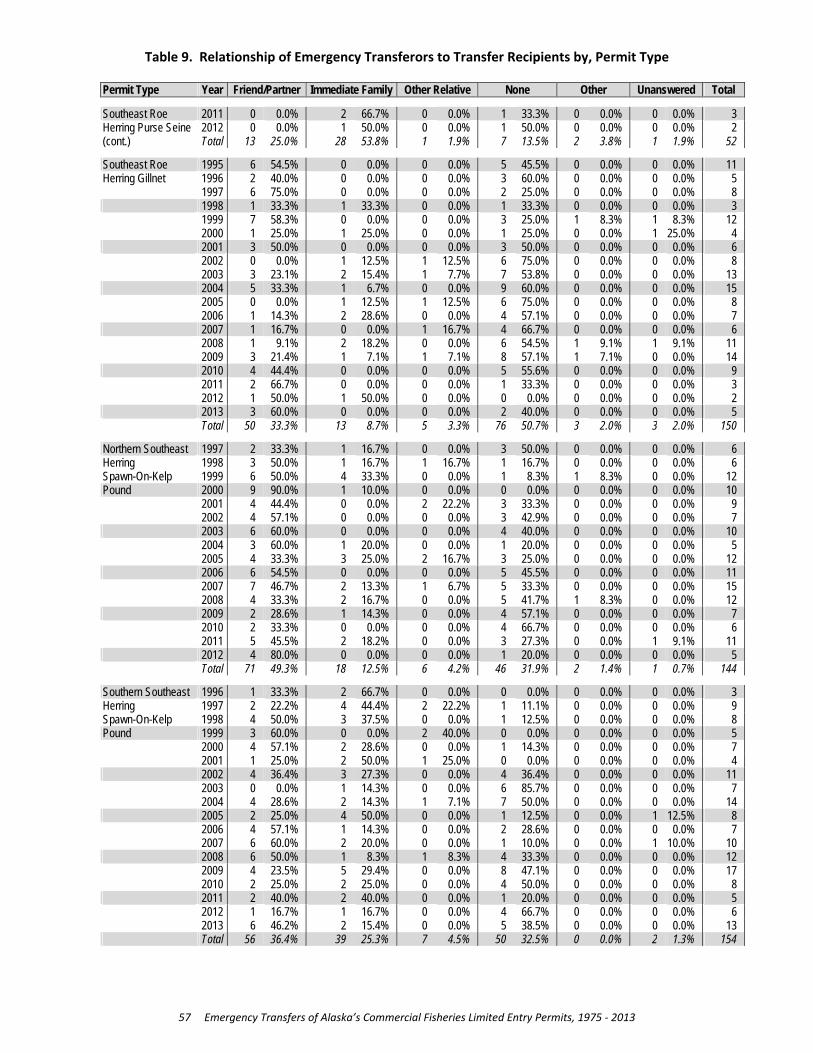
Table 9. Relationship of Emergency Transferors to Transfer Recipients by, Permit Type
57 Emergency Transfers of Alaska’s Commercial Fisheries Limited Entry Permits, 1975 ‐ 2013
Permit Type Year Friend/Partner Immediate Family Other Relative None Other Unanswered Total Southeast Roe 2011 0 0.0% 2 66.7% 0 0.0% 1 33.3% 0 0.0% 0 0.0% 3 Herring Purse Seine 2012 0 0.0% 1 50.0% 0 0.0% 1 50.0% 0 0.0% 0 0.0% 2 (cont.) Total 13 25.0% 28 53.8% 1 1.9% 7 13.5% 2 3.8% 1 1.9% 52
Southeast Roe 1995 6 54.5% 0 0.0% 0 0.0% 5 45.5% 0 0.0% 0 0.0% 11 Herring Gillnet 1996 2 40.0% 0 0.0% 0 0.0% 3 60.0% 0 0.0% 0 0.0% 5
1997 6 75.0% 0 0.0% 0 0.0% 2 25.0% 0 0.0% 0 0.0% 8 1998 1 33.3% 1 33.3% 0 0.0% 1 33.3% 0 0.0% 0 0.0% 3
1999 7 58.3% 0 0.0% 0 0.0% 3 25.0% 1 8.3% 1 8.3% 12 2000 1 25.0% 1 25.0% 0 0.0% 1 25.0% 0 0.0% 1 25.0% 4
2001 3 50.0% 0 0.0% 0 0.0% 3 50.0% 0 0.0% 0 0.0% 6 2002 0 0.0% 1 12.5% 1 12.5% 6 75.0% 0 0.0% 0 0.0% 8 2003 3 23.1% 2 15.4% 1 7.7% 7 53.8% 0 0.0% 0 0.0% 13
2004 5 33.3% 1 6.7% 0 0.0% 9 60.0% 0 0.0% 0 0.0% 15 2005 0 0.0% 1 12.5% 1 12.5% 6 75.0% 0 0.0% 0 0.0% 8 2006 1 14.3% 2 28.6% 0 0.0% 4 57.1% 0 0.0% 0 0.0% 7
2007 1 16.7% 0 0.0% 1 16.7% 4 66.7% 0 0.0% 0 0.0% 6 2008 1 9.1% 2 18.2% 0 0.0% 6 54.5% 1 9.1% 1 9.1% 11 2009 3 21.4% 1 7.1% 1 7.1% 8 57.1% 1 7.1% 0 0.0% 14
2010 4 44.4% 0 0.0% 0 0.0% 5 55.6% 0 0.0% 0 0.0% 9 2011 2 66.7% 0 0.0% 0 0.0% 1 33.3% 0 0.0% 0 0.0% 3 2012 1 50.0% 1 50.0% 0 0.0% 0 0.0% 0 0.0% 0 0.0% 2
2013 3 60.0% 0 0.0% 0 0.0% 2 40.0% 0 0.0% 0 0.0% 5 Total 50 33.3% 13 8.7% 5 3.3% 76 50.7% 3 2.0% 3 2.0% 150
Northern Southeast 1997 2 33.3% 1 16.7% 0 0.0% 3 50.0% 0 0.0% 0 0.0% 6 Herring 1998 3 50.0% 1 16.7% 1 16.7% 1 16.7% 0 0.0% 0 0.0% 6 Spawn-On-Kelp 1999 6 50.0% 4 33.3% 0 0.0% 1 8.3% 1 8.3% 0 0.0% 12 Pound 2000 9 90.0% 1 10.0% 0 0.0% 0 0.0% 0 0.0% 0 0.0% 10
2001 4 44.4% 0 0.0% 2 22.2% 3 33.3% 0 0.0% 0 0.0% 9 2002 4 57.1% 0 0.0% 0 0.0% 3 42.9% 0 0.0% 0 0.0% 7
2003 6 60.0% 0 0.0% 0 0.0% 4 40.0% 0 0.0% 0 0.0% 10 2004 3 60.0% 1 20.0% 0 0.0% 1 20.0% 0 0.0% 0 0.0% 5 2005 4 33.3% 3 25.0% 2 16.7% 3 25.0% 0 0.0% 0 0.0% 12
2006 6 54.5% 0 0.0% 0 0.0% 5 45.5% 0 0.0% 0 0.0% 11 2007 7 46.7% 2 13.3% 1 6.7% 5 33.3% 0 0.0% 0 0.0% 15 2008 4 33.3% 2 16.7% 0 0.0% 5 41.7% 1 8.3% 0 0.0% 12
2009 2 28.6% 1 14.3% 0 0.0% 4 57.1% 0 0.0% 0 0.0% 7 2010 2 33.3% 0 0.0% 0 0.0% 4 66.7% 0 0.0% 0 0.0% 6 2011 5 45.5% 2 18.2% 0 0.0% 3 27.3% 0 0.0% 1 9.1% 11
2012 4 80.0% 0 0.0% 0 0.0% 1 20.0% 0 0.0% 0 0.0% 5 Total 71 49.3% 18 12.5% 6 4.2% 46 31.9% 2 1.4% 1 0.7% 144
Southern Southeast 1996 1 33.3% 2 66.7% 0 0.0% 0 0.0% 0 0.0% 0 0.0% 3 Herring 1997 2 22.2% 4 44.4% 2 22.2% 1 11.1% 0 0.0% 0 0.0% 9 Spawn-On-Kelp 1998 4 50.0% 3 37.5% 0 0.0% 1 12.5% 0 0.0% 0 0.0% 8 Pound 1999 3 60.0% 0 0.0% 2 40.0% 0 0.0% 0 0.0% 0 0.0% 5
2000 4 57.1% 2 28.6% 0 0.0% 1 14.3% 0 0.0% 0 0.0% 7 2001 1 25.0% 2 50.0% 1 25.0% 0 0.0% 0 0.0% 0 0.0% 4
2002 4 36.4% 3 27.3% 0 0.0% 4 36.4% 0 0.0% 0 0.0% 11 2003 0 0.0% 1 14.3% 0 0.0% 6 85.7% 0 0.0% 0 0.0% 7 2004 4 28.6% 2 14.3% 1 7.1% 7 50.0% 0 0.0% 0 0.0% 14
2005 2 25.0% 4 50.0% 0 0.0% 1 12.5% 0 0.0% 1 12.5% 8 2006 4 57.1% 1 14.3% 0 0.0% 2 28.6% 0 0.0% 0 0.0% 7 2007 6 60.0% 2 20.0% 0 0.0% 1 10.0% 0 0.0% 1 10.0% 10
2008 6 50.0% 1 8.3% 1 8.3% 4 33.3% 0 0.0% 0 0.0% 12 2009 4 23.5% 5 29.4% 0 0.0% 8 47.1% 0 0.0% 0 0.0% 17 2010 2 25.0% 2 25.0% 0 0.0% 4 50.0% 0 0.0% 0 0.0% 8
2011 2 40.0% 2 40.0% 0 0.0% 1 20.0% 0 0.0% 0 0.0% 5 2012 1 16.7% 1 16.7% 0 0.0% 4 66.7% 0 0.0% 0 0.0% 6 2013 6 46.2% 2 15.4% 0 0.0% 5 38.5% 0 0.0% 0 0.0% 13
Total 56 36.4% 39 25.3% 7 4.5% 50 32.5% 0 0.0% 2 1.3% 154
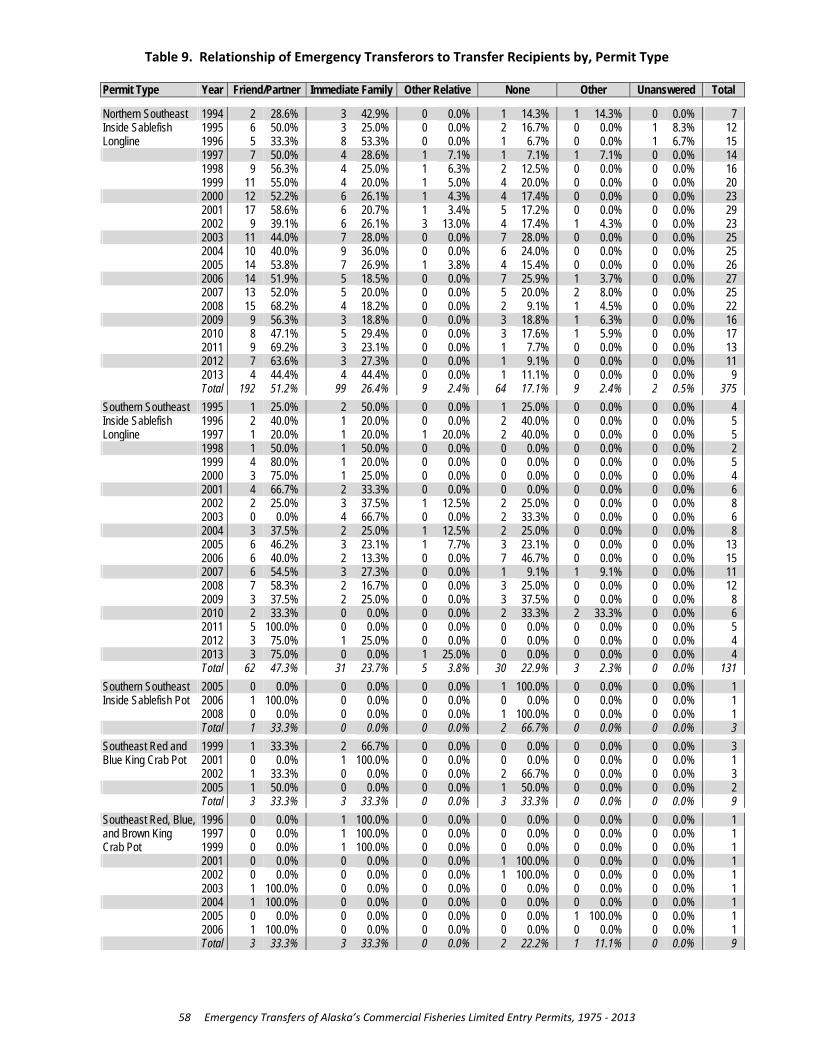
Table 9. Relationship of Emergency Transferors to Transfer Recipients by, Permit Type
58 Emergency Transfers of Alaska’s Commercial Fisheries Limited Entry Permits, 1975 ‐ 2013
Permit Type Year Friend/Partner Immediate Family Other Relative None Other Unanswered Total Northern Southeast 1994 2 28.6% 3 42.9% 0 0.0% 1 14.3% 1 14.3% 0 0.0% 7 Inside Sablefish 1995 6 50.0% 3 25.0% 0 0.0% 2 16.7% 0 0.0% 1 8.3% 12 Longline 1996 5 33.3% 8 53.3% 0 0.0% 1 6.7% 0 0.0% 1 6.7% 15 1997 7 50.0% 4 28.6% 1 7.1% 1 7.1% 1 7.1% 0 0.0% 14
1998 9 56.3% 4 25.0% 1 6.3% 2 12.5% 0 0.0% 0 0.0% 16 1999 11 55.0% 4 20.0% 1 5.0% 4 20.0% 0 0.0% 0 0.0% 20
2000 12 52.2% 6 26.1% 1 4.3% 4 17.4% 0 0.0% 0 0.0% 23 2001 17 58.6% 6 20.7% 1 3.4% 5 17.2% 0 0.0% 0 0.0% 29 2002 9 39.1% 6 26.1% 3 13.0% 4 17.4% 1 4.3% 0 0.0% 23
2003 11 44.0% 7 28.0% 0 0.0% 7 28.0% 0 0.0% 0 0.0% 25 2004 10 40.0% 9 36.0% 0 0.0% 6 24.0% 0 0.0% 0 0.0% 25 2005 14 53.8% 7 26.9% 1 3.8% 4 15.4% 0 0.0% 0 0.0% 26
2006 14 51.9% 5 18.5% 0 0.0% 7 25.9% 1 3.7% 0 0.0% 27 2007 13 52.0% 5 20.0% 0 0.0% 5 20.0% 2 8.0% 0 0.0% 25 2008 15 68.2% 4 18.2% 0 0.0% 2 9.1% 1 4.5% 0 0.0% 22
2009 9 56.3% 3 18.8% 0 0.0% 3 18.8% 1 6.3% 0 0.0% 16 2010 8 47.1% 5 29.4% 0 0.0% 3 17.6% 1 5.9% 0 0.0% 17 2011 9 69.2% 3 23.1% 0 0.0% 1 7.7% 0 0.0% 0 0.0% 13
2012 7 63.6% 3 27.3% 0 0.0% 1 9.1% 0 0.0% 0 0.0% 11 2013 4 44.4% 4 44.4% 0 0.0% 1 11.1% 0 0.0% 0 0.0% 9 Total 192 51.2% 99 26.4% 9 2.4% 64 17.1% 9 2.4% 2 0.5% 375
Southern Southeast 1995 1 25.0% 2 50.0% 0 0.0% 1 25.0% 0 0.0% 0 0.0% 4 Inside Sablefish 1996 2 40.0% 1 20.0% 0 0.0% 2 40.0% 0 0.0% 0 0.0% 5 Longline 1997 1 20.0% 1 20.0% 1 20.0% 2 40.0% 0 0.0% 0 0.0% 5 1998 1 50.0% 1 50.0% 0 0.0% 0 0.0% 0 0.0% 0 0.0% 2
1999 4 80.0% 1 20.0% 0 0.0% 0 0.0% 0 0.0% 0 0.0% 5 2000 3 75.0% 1 25.0% 0 0.0% 0 0.0% 0 0.0% 0 0.0% 4
2001 4 66.7% 2 33.3% 0 0.0% 0 0.0% 0 0.0% 0 0.0% 6 2002 2 25.0% 3 37.5% 1 12.5% 2 25.0% 0 0.0% 0 0.0% 8 2003 0 0.0% 4 66.7% 0 0.0% 2 33.3% 0 0.0% 0 0.0% 6
2004 3 37.5% 2 25.0% 1 12.5% 2 25.0% 0 0.0% 0 0.0% 8 2005 6 46.2% 3 23.1% 1 7.7% 3 23.1% 0 0.0% 0 0.0% 13 2006 6 40.0% 2 13.3% 0 0.0% 7 46.7% 0 0.0% 0 0.0% 15
2007 6 54.5% 3 27.3% 0 0.0% 1 9.1% 1 9.1% 0 0.0% 11 2008 7 58.3% 2 16.7% 0 0.0% 3 25.0% 0 0.0% 0 0.0% 12 2009 3 37.5% 2 25.0% 0 0.0% 3 37.5% 0 0.0% 0 0.0% 8
2010 2 33.3% 0 0.0% 0 0.0% 2 33.3% 2 33.3% 0 0.0% 6 2011 5 100.0% 0 0.0% 0 0.0% 0 0.0% 0 0.0% 0 0.0% 5 2012 3 75.0% 1 25.0% 0 0.0% 0 0.0% 0 0.0% 0 0.0% 4
2013 3 75.0% 0 0.0% 1 25.0% 0 0.0% 0 0.0% 0 0.0% 4 Total 62 47.3% 31 23.7% 5 3.8% 30 22.9% 3 2.3% 0 0.0% 131
Southern Southeast 2005 0 0.0% 0 0.0% 0 0.0% 1 100.0% 0 0.0% 0 0.0% 1 Inside Sablefish Pot 2006 1 100.0% 0 0.0% 0 0.0% 0 0.0% 0 0.0% 0 0.0% 1
2008 0 0.0% 0 0.0% 0 0.0% 1 100.0% 0 0.0% 0 0.0% 1 Total 1 33.3% 0 0.0% 0 0.0% 2 66.7% 0 0.0% 0 0.0% 3
Southeast Red and 1999 1 33.3% 2 66.7% 0 0.0% 0 0.0% 0 0.0% 0 0.0% 3 Blue King Crab Pot 2001 0 0.0% 1 100.0% 0 0.0% 0 0.0% 0 0.0% 0 0.0% 1
2002 1 33.3% 0 0.0% 0 0.0% 2 66.7% 0 0.0% 0 0.0% 3 2005 1 50.0% 0 0.0% 0 0.0% 1 50.0% 0 0.0% 0 0.0% 2
Total 3 33.3% 3 33.3% 0 0.0% 3 33.3% 0 0.0% 0 0.0% 9
Southeast Red, Blue, 1996 0 0.0% 1 100.0% 0 0.0% 0 0.0% 0 0.0% 0 0.0% 1 and Brown King 1997 0 0.0% 1 100.0% 0 0.0% 0 0.0% 0 0.0% 0 0.0% 1 Crab Pot 1999 0 0.0% 1 100.0% 0 0.0% 0 0.0% 0 0.0% 0 0.0% 1 2001 0 0.0% 0 0.0% 0 0.0% 1 100.0% 0 0.0% 0 0.0% 1
2002 0 0.0% 0 0.0% 0 0.0% 1 100.0% 0 0.0% 0 0.0% 1 2003 1 100.0% 0 0.0% 0 0.0% 0 0.0% 0 0.0% 0 0.0% 1
2004 1 100.0% 0 0.0% 0 0.0% 0 0.0% 0 0.0% 0 0.0% 1 2005 0 0.0% 0 0.0% 0 0.0% 0 0.0% 1 100.0% 0 0.0% 1 2006 1 100.0% 0 0.0% 0 0.0% 0 0.0% 0 0.0% 0 0.0% 1
Total 3 33.3% 3 33.3% 0 0.0% 2 22.2% 1 11.1% 0 0.0% 9
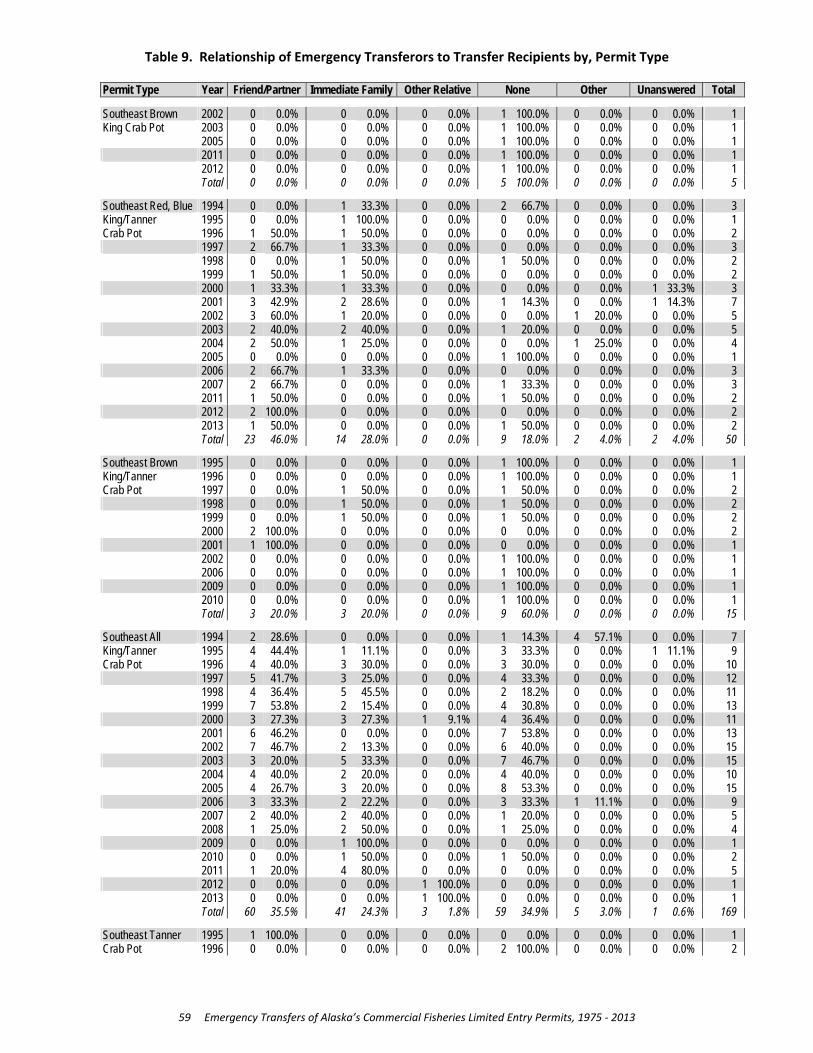
Table 9. Relationship of Emergency Transferors to Transfer Recipients by, Permit Type
59 Emergency Transfers of Alaska’s Commercial Fisheries Limited Entry Permits, 1975 ‐ 2013
Permit Type Year Friend/Partner Immediate Family Other Relative None Other Unanswered Total Southeast Brown 2002 0 0.0% 0 0.0% 0 0.0% 1 100.0% 0 0.0% 0 0.0% 1 King Crab Pot 2003 0 0.0% 0 0.0% 0 0.0% 1 100.0% 0 0.0% 0 0.0% 1
2005 0 0.0% 0 0.0% 0 0.0% 1 100.0% 0 0.0% 0 0.0% 1 2011 0 0.0% 0 0.0% 0 0.0% 1 100.0% 0 0.0% 0 0.0% 1
2012 0 0.0% 0 0.0% 0 0.0% 1 100.0% 0 0.0% 0 0.0% 1 Total 0 0.0% 0 0.0% 0 0.0% 5 100.0% 0 0.0% 0 0.0% 5
Southeast Red, Blue 1994 0 0.0% 1 33.3% 0 0.0% 2 66.7% 0 0.0% 0 0.0% 3 King/Tanner 1995 0 0.0% 1 100.0% 0 0.0% 0 0.0% 0 0.0% 0 0.0% 1 Crab Pot 1996 1 50.0% 1 50.0% 0 0.0% 0 0.0% 0 0.0% 0 0.0% 2 1997 2 66.7% 1 33.3% 0 0.0% 0 0.0% 0 0.0% 0 0.0% 3
1998 0 0.0% 1 50.0% 0 0.0% 1 50.0% 0 0.0% 0 0.0% 2 1999 1 50.0% 1 50.0% 0 0.0% 0 0.0% 0 0.0% 0 0.0% 2
2000 1 33.3% 1 33.3% 0 0.0% 0 0.0% 0 0.0% 1 33.3% 3 2001 3 42.9% 2 28.6% 0 0.0% 1 14.3% 0 0.0% 1 14.3% 7 2002 3 60.0% 1 20.0% 0 0.0% 0 0.0% 1 20.0% 0 0.0% 5
2003 2 40.0% 2 40.0% 0 0.0% 1 20.0% 0 0.0% 0 0.0% 5 2004 2 50.0% 1 25.0% 0 0.0% 0 0.0% 1 25.0% 0 0.0% 4 2005 0 0.0% 0 0.0% 0 0.0% 1 100.0% 0 0.0% 0 0.0% 1
2006 2 66.7% 1 33.3% 0 0.0% 0 0.0% 0 0.0% 0 0.0% 3 2007 2 66.7% 0 0.0% 0 0.0% 1 33.3% 0 0.0% 0 0.0% 3 2011 1 50.0% 0 0.0% 0 0.0% 1 50.0% 0 0.0% 0 0.0% 2
2012 2 100.0% 0 0.0% 0 0.0% 0 0.0% 0 0.0% 0 0.0% 2 2013 1 50.0% 0 0.0% 0 0.0% 1 50.0% 0 0.0% 0 0.0% 2 Total 23 46.0% 14 28.0% 0 0.0% 9 18.0% 2 4.0% 2 4.0% 50
Southeast Brown 1995 0 0.0% 0 0.0% 0 0.0% 1 100.0% 0 0.0% 0 0.0% 1 King/Tanner 1996 0 0.0% 0 0.0% 0 0.0% 1 100.0% 0 0.0% 0 0.0% 1 Crab Pot 1997 0 0.0% 1 50.0% 0 0.0% 1 50.0% 0 0.0% 0 0.0% 2 1998 0 0.0% 1 50.0% 0 0.0% 1 50.0% 0 0.0% 0 0.0% 2
1999 0 0.0% 1 50.0% 0 0.0% 1 50.0% 0 0.0% 0 0.0% 2 2000 2 100.0% 0 0.0% 0 0.0% 0 0.0% 0 0.0% 0 0.0% 2
2001 1 100.0% 0 0.0% 0 0.0% 0 0.0% 0 0.0% 0 0.0% 1 2002 0 0.0% 0 0.0% 0 0.0% 1 100.0% 0 0.0% 0 0.0% 1 2006 0 0.0% 0 0.0% 0 0.0% 1 100.0% 0 0.0% 0 0.0% 1
2009 0 0.0% 0 0.0% 0 0.0% 1 100.0% 0 0.0% 0 0.0% 1 2010 0 0.0% 0 0.0% 0 0.0% 1 100.0% 0 0.0% 0 0.0% 1 Total 3 20.0% 3 20.0% 0 0.0% 9 60.0% 0 0.0% 0 0.0% 15
Southeast All 1994 2 28.6% 0 0.0% 0 0.0% 1 14.3% 4 57.1% 0 0.0% 7 King/Tanner 1995 4 44.4% 1 11.1% 0 0.0% 3 33.3% 0 0.0% 1 11.1% 9 Crab Pot 1996 4 40.0% 3 30.0% 0 0.0% 3 30.0% 0 0.0% 0 0.0% 10 1997 5 41.7% 3 25.0% 0 0.0% 4 33.3% 0 0.0% 0 0.0% 12
1998 4 36.4% 5 45.5% 0 0.0% 2 18.2% 0 0.0% 0 0.0% 11 1999 7 53.8% 2 15.4% 0 0.0% 4 30.8% 0 0.0% 0 0.0% 13
2000 3 27.3% 3 27.3% 1 9.1% 4 36.4% 0 0.0% 0 0.0% 11 2001 6 46.2% 0 0.0% 0 0.0% 7 53.8% 0 0.0% 0 0.0% 13 2002 7 46.7% 2 13.3% 0 0.0% 6 40.0% 0 0.0% 0 0.0% 15
2003 3 20.0% 5 33.3% 0 0.0% 7 46.7% 0 0.0% 0 0.0% 15 2004 4 40.0% 2 20.0% 0 0.0% 4 40.0% 0 0.0% 0 0.0% 10 2005 4 26.7% 3 20.0% 0 0.0% 8 53.3% 0 0.0% 0 0.0% 15
2006 3 33.3% 2 22.2% 0 0.0% 3 33.3% 1 11.1% 0 0.0% 9 2007 2 40.0% 2 40.0% 0 0.0% 1 20.0% 0 0.0% 0 0.0% 5 2008 1 25.0% 2 50.0% 0 0.0% 1 25.0% 0 0.0% 0 0.0% 4
2009 0 0.0% 1 100.0% 0 0.0% 0 0.0% 0 0.0% 0 0.0% 1 2010 0 0.0% 1 50.0% 0 0.0% 1 50.0% 0 0.0% 0 0.0% 2 2011 1 20.0% 4 80.0% 0 0.0% 0 0.0% 0 0.0% 0 0.0% 5
2012 0 0.0% 0 0.0% 1 100.0% 0 0.0% 0 0.0% 0 0.0% 1 2013 0 0.0% 0 0.0% 1 100.0% 0 0.0% 0 0.0% 0 0.0% 1 Total 60 35.5% 41 24.3% 3 1.8% 59 34.9% 5 3.0% 1 0.6% 169
Southeast Tanner 1995 1 100.0% 0 0.0% 0 0.0% 0 0.0% 0 0.0% 0 0.0% 1 Crab Pot 1996 0 0.0% 0 0.0% 0 0.0% 2 100.0% 0 0.0% 0 0.0% 2
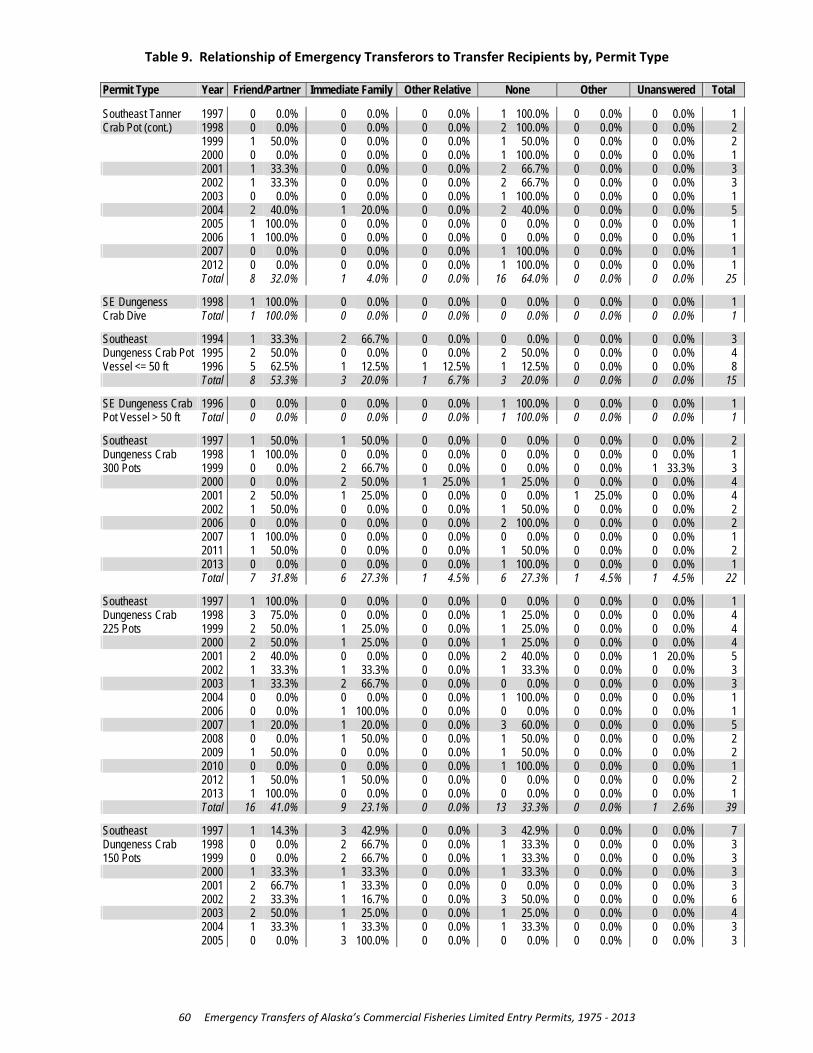
Table 9. Relationship of Emergency Transferors to Transfer Recipients by, Permit Type
60 Emergency Transfers of Alaska’s Commercial Fisheries Limited Entry Permits, 1975 ‐ 2013
Permit Type Year Friend/Partner Immediate Family Other Relative None Other Unanswered Total Southeast Tanner 1997 0 0.0% 0 0.0% 0 0.0% 1 100.0% 0 0.0% 0 0.0% 1 Crab Pot (cont.) 1998 0 0.0% 0 0.0% 0 0.0% 2 100.0% 0 0.0% 0 0.0% 2
1999 1 50.0% 0 0.0% 0 0.0% 1 50.0% 0 0.0% 0 0.0% 2 2000 0 0.0% 0 0.0% 0 0.0% 1 100.0% 0 0.0% 0 0.0% 1
2001 1 33.3% 0 0.0% 0 0.0% 2 66.7% 0 0.0% 0 0.0% 3 2002 1 33.3% 0 0.0% 0 0.0% 2 66.7% 0 0.0% 0 0.0% 3 2003 0 0.0% 0 0.0% 0 0.0% 1 100.0% 0 0.0% 0 0.0% 1
2004 2 40.0% 1 20.0% 0 0.0% 2 40.0% 0 0.0% 0 0.0% 5 2005 1 100.0% 0 0.0% 0 0.0% 0 0.0% 0 0.0% 0 0.0% 1 2006 1 100.0% 0 0.0% 0 0.0% 0 0.0% 0 0.0% 0 0.0% 1
2007 0 0.0% 0 0.0% 0 0.0% 1 100.0% 0 0.0% 0 0.0% 1 2012 0 0.0% 0 0.0% 0 0.0% 1 100.0% 0 0.0% 0 0.0% 1 Total 8 32.0% 1 4.0% 0 0.0% 16 64.0% 0 0.0% 0 0.0% 25
SE Dungeness 1998 1 100.0% 0 0.0% 0 0.0% 0 0.0% 0 0.0% 0 0.0% 1 Crab Dive Total 1 100.0% 0 0.0% 0 0.0% 0 0.0% 0 0.0% 0 0.0% 1
Southeast 1994 1 33.3% 2 66.7% 0 0.0% 0 0.0% 0 0.0% 0 0.0% 3 Dungeness Crab Pot 1995 2 50.0% 0 0.0% 0 0.0% 2 50.0% 0 0.0% 0 0.0% 4 Vessel <= 50 ft 1996 5 62.5% 1 12.5% 1 12.5% 1 12.5% 0 0.0% 0 0.0% 8 Total 8 53.3% 3 20.0% 1 6.7% 3 20.0% 0 0.0% 0 0.0% 15
SE Dungeness Crab 1996 0 0.0% 0 0.0% 0 0.0% 1 100.0% 0 0.0% 0 0.0% 1 Pot Vessel > 50 ft Total 0 0.0% 0 0.0% 0 0.0% 1 100.0% 0 0.0% 0 0.0% 1
Southeast 1997 1 50.0% 1 50.0% 0 0.0% 0 0.0% 0 0.0% 0 0.0% 2 Dungeness Crab 1998 1 100.0% 0 0.0% 0 0.0% 0 0.0% 0 0.0% 0 0.0% 1 300 Pots 1999 0 0.0% 2 66.7% 0 0.0% 0 0.0% 0 0.0% 1 33.3% 3 2000 0 0.0% 2 50.0% 1 25.0% 1 25.0% 0 0.0% 0 0.0% 4
2001 2 50.0% 1 25.0% 0 0.0% 0 0.0% 1 25.0% 0 0.0% 4 2002 1 50.0% 0 0.0% 0 0.0% 1 50.0% 0 0.0% 0 0.0% 2
2006 0 0.0% 0 0.0% 0 0.0% 2 100.0% 0 0.0% 0 0.0% 2 2007 1 100.0% 0 0.0% 0 0.0% 0 0.0% 0 0.0% 0 0.0% 1 2011 1 50.0% 0 0.0% 0 0.0% 1 50.0% 0 0.0% 0 0.0% 2
2013 0 0.0% 0 0.0% 0 0.0% 1 100.0% 0 0.0% 0 0.0% 1 Total 7 31.8% 6 27.3% 1 4.5% 6 27.3% 1 4.5% 1 4.5% 22
Southeast 1997 1 100.0% 0 0.0% 0 0.0% 0 0.0% 0 0.0% 0 0.0% 1 Dungeness Crab 1998 3 75.0% 0 0.0% 0 0.0% 1 25.0% 0 0.0% 0 0.0% 4 225 Pots 1999 2 50.0% 1 25.0% 0 0.0% 1 25.0% 0 0.0% 0 0.0% 4 2000 2 50.0% 1 25.0% 0 0.0% 1 25.0% 0 0.0% 0 0.0% 4
2001 2 40.0% 0 0.0% 0 0.0% 2 40.0% 0 0.0% 1 20.0% 5 2002 1 33.3% 1 33.3% 0 0.0% 1 33.3% 0 0.0% 0 0.0% 3
2003 1 33.3% 2 66.7% 0 0.0% 0 0.0% 0 0.0% 0 0.0% 3 2004 0 0.0% 0 0.0% 0 0.0% 1 100.0% 0 0.0% 0 0.0% 1 2006 0 0.0% 1 100.0% 0 0.0% 0 0.0% 0 0.0% 0 0.0% 1
2007 1 20.0% 1 20.0% 0 0.0% 3 60.0% 0 0.0% 0 0.0% 5 2008 0 0.0% 1 50.0% 0 0.0% 1 50.0% 0 0.0% 0 0.0% 2 2009 1 50.0% 0 0.0% 0 0.0% 1 50.0% 0 0.0% 0 0.0% 2
2010 0 0.0% 0 0.0% 0 0.0% 1 100.0% 0 0.0% 0 0.0% 1 2012 1 50.0% 1 50.0% 0 0.0% 0 0.0% 0 0.0% 0 0.0% 2 2013 1 100.0% 0 0.0% 0 0.0% 0 0.0% 0 0.0% 0 0.0% 1
Total 16 41.0% 9 23.1% 0 0.0% 13 33.3% 0 0.0% 1 2.6% 39
Southeast 1997 1 14.3% 3 42.9% 0 0.0% 3 42.9% 0 0.0% 0 0.0% 7 Dungeness Crab 1998 0 0.0% 2 66.7% 0 0.0% 1 33.3% 0 0.0% 0 0.0% 3 150 Pots 1999 0 0.0% 2 66.7% 0 0.0% 1 33.3% 0 0.0% 0 0.0% 3 2000 1 33.3% 1 33.3% 0 0.0% 1 33.3% 0 0.0% 0 0.0% 3
2001 2 66.7% 1 33.3% 0 0.0% 0 0.0% 0 0.0% 0 0.0% 3 2002 2 33.3% 1 16.7% 0 0.0% 3 50.0% 0 0.0% 0 0.0% 6
2003 2 50.0% 1 25.0% 0 0.0% 1 25.0% 0 0.0% 0 0.0% 4 2004 1 33.3% 1 33.3% 0 0.0% 1 33.3% 0 0.0% 0 0.0% 3 2005 0 0.0% 3 100.0% 0 0.0% 0 0.0% 0 0.0% 0 0.0% 3
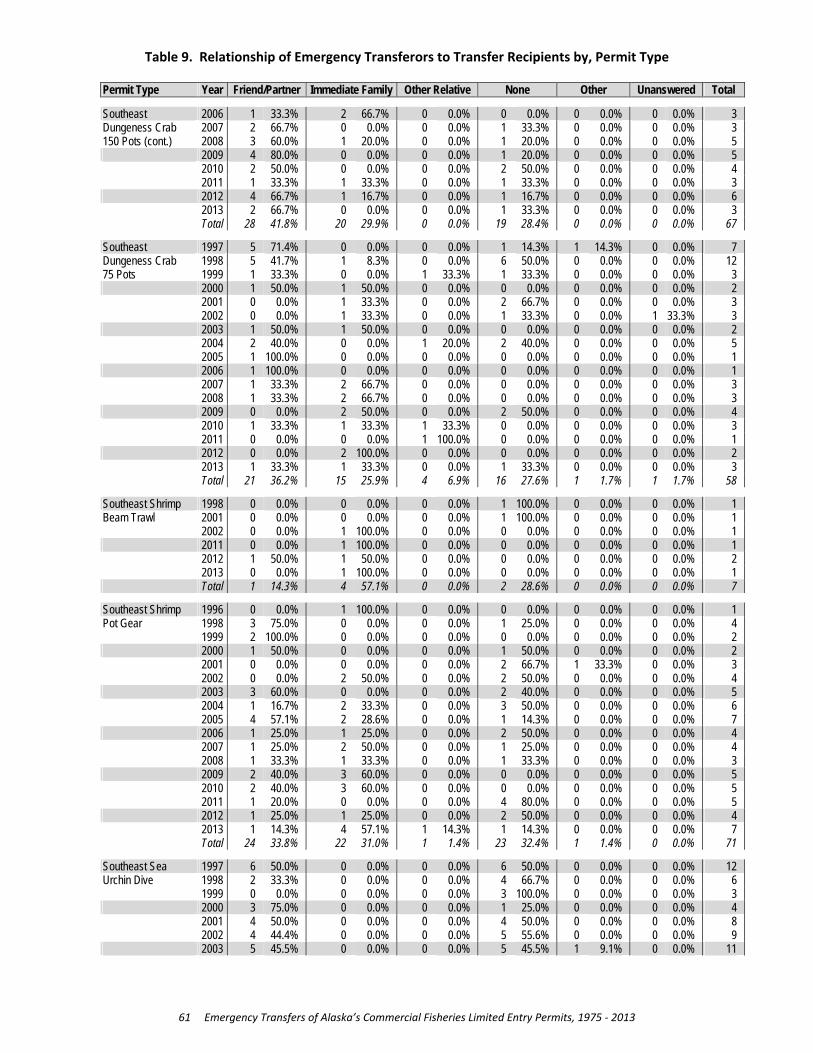
Table 9. Relationship of Emergency Transferors to Transfer Recipients by, Permit Type
61 Emergency Transfers of Alaska’s Commercial Fisheries Limited Entry Permits, 1975 ‐ 2013
Permit Type Year Friend/Partner Immediate Family Other Relative None Other Unanswered Total Southeast 2006 1 33.3% 2 66.7% 0 0.0% 0 0.0% 0 0.0% 0 0.0% 3 Dungeness Crab 2007 2 66.7% 0 0.0% 0 0.0% 1 33.3% 0 0.0% 0 0.0% 3 150 Pots (cont.) 2008 3 60.0% 1 20.0% 0 0.0% 1 20.0% 0 0.0% 0 0.0% 5 2009 4 80.0% 0 0.0% 0 0.0% 1 20.0% 0 0.0% 0 0.0% 5
2010 2 50.0% 0 0.0% 0 0.0% 2 50.0% 0 0.0% 0 0.0% 4 2011 1 33.3% 1 33.3% 0 0.0% 1 33.3% 0 0.0% 0 0.0% 3
2012 4 66.7% 1 16.7% 0 0.0% 1 16.7% 0 0.0% 0 0.0% 6 2013 2 66.7% 0 0.0% 0 0.0% 1 33.3% 0 0.0% 0 0.0% 3 Total 28 41.8% 20 29.9% 0 0.0% 19 28.4% 0 0.0% 0 0.0% 67
Southeast 1997 5 71.4% 0 0.0% 0 0.0% 1 14.3% 1 14.3% 0 0.0% 7 Dungeness Crab 1998 5 41.7% 1 8.3% 0 0.0% 6 50.0% 0 0.0% 0 0.0% 12 75 Pots 1999 1 33.3% 0 0.0% 1 33.3% 1 33.3% 0 0.0% 0 0.0% 3 2000 1 50.0% 1 50.0% 0 0.0% 0 0.0% 0 0.0% 0 0.0% 2
2001 0 0.0% 1 33.3% 0 0.0% 2 66.7% 0 0.0% 0 0.0% 3 2002 0 0.0% 1 33.3% 0 0.0% 1 33.3% 0 0.0% 1 33.3% 3
2003 1 50.0% 1 50.0% 0 0.0% 0 0.0% 0 0.0% 0 0.0% 2 2004 2 40.0% 0 0.0% 1 20.0% 2 40.0% 0 0.0% 0 0.0% 5 2005 1 100.0% 0 0.0% 0 0.0% 0 0.0% 0 0.0% 0 0.0% 1
2006 1 100.0% 0 0.0% 0 0.0% 0 0.0% 0 0.0% 0 0.0% 1 2007 1 33.3% 2 66.7% 0 0.0% 0 0.0% 0 0.0% 0 0.0% 3 2008 1 33.3% 2 66.7% 0 0.0% 0 0.0% 0 0.0% 0 0.0% 3
2009 0 0.0% 2 50.0% 0 0.0% 2 50.0% 0 0.0% 0 0.0% 4 2010 1 33.3% 1 33.3% 1 33.3% 0 0.0% 0 0.0% 0 0.0% 3 2011 0 0.0% 0 0.0% 1 100.0% 0 0.0% 0 0.0% 0 0.0% 1
2012 0 0.0% 2 100.0% 0 0.0% 0 0.0% 0 0.0% 0 0.0% 2 2013 1 33.3% 1 33.3% 0 0.0% 1 33.3% 0 0.0% 0 0.0% 3 Total 21 36.2% 15 25.9% 4 6.9% 16 27.6% 1 1.7% 1 1.7% 58
Southeast Shrimp 1998 0 0.0% 0 0.0% 0 0.0% 1 100.0% 0 0.0% 0 0.0% 1 Beam Trawl 2001 0 0.0% 0 0.0% 0 0.0% 1 100.0% 0 0.0% 0 0.0% 1
2002 0 0.0% 1 100.0% 0 0.0% 0 0.0% 0 0.0% 0 0.0% 1 2011 0 0.0% 1 100.0% 0 0.0% 0 0.0% 0 0.0% 0 0.0% 1
2012 1 50.0% 1 50.0% 0 0.0% 0 0.0% 0 0.0% 0 0.0% 2 2013 0 0.0% 1 100.0% 0 0.0% 0 0.0% 0 0.0% 0 0.0% 1
Total 1 14.3% 4 57.1% 0 0.0% 2 28.6% 0 0.0% 0 0.0% 7
Southeast Shrimp 1996 0 0.0% 1 100.0% 0 0.0% 0 0.0% 0 0.0% 0 0.0% 1 Pot Gear 1998 3 75.0% 0 0.0% 0 0.0% 1 25.0% 0 0.0% 0 0.0% 4
1999 2 100.0% 0 0.0% 0 0.0% 0 0.0% 0 0.0% 0 0.0% 2 2000 1 50.0% 0 0.0% 0 0.0% 1 50.0% 0 0.0% 0 0.0% 2
2001 0 0.0% 0 0.0% 0 0.0% 2 66.7% 1 33.3% 0 0.0% 3 2002 0 0.0% 2 50.0% 0 0.0% 2 50.0% 0 0.0% 0 0.0% 4
2003 3 60.0% 0 0.0% 0 0.0% 2 40.0% 0 0.0% 0 0.0% 5 2004 1 16.7% 2 33.3% 0 0.0% 3 50.0% 0 0.0% 0 0.0% 6 2005 4 57.1% 2 28.6% 0 0.0% 1 14.3% 0 0.0% 0 0.0% 7
2006 1 25.0% 1 25.0% 0 0.0% 2 50.0% 0 0.0% 0 0.0% 4 2007 1 25.0% 2 50.0% 0 0.0% 1 25.0% 0 0.0% 0 0.0% 4 2008 1 33.3% 1 33.3% 0 0.0% 1 33.3% 0 0.0% 0 0.0% 3
2009 2 40.0% 3 60.0% 0 0.0% 0 0.0% 0 0.0% 0 0.0% 5 2010 2 40.0% 3 60.0% 0 0.0% 0 0.0% 0 0.0% 0 0.0% 5 2011 1 20.0% 0 0.0% 0 0.0% 4 80.0% 0 0.0% 0 0.0% 5
2012 1 25.0% 1 25.0% 0 0.0% 2 50.0% 0 0.0% 0 0.0% 4 2013 1 14.3% 4 57.1% 1 14.3% 1 14.3% 0 0.0% 0 0.0% 7 Total 24 33.8% 22 31.0% 1 1.4% 23 32.4% 1 1.4% 0 0.0% 71
Southeast Sea 1997 6 50.0% 0 0.0% 0 0.0% 6 50.0% 0 0.0% 0 0.0% 12 Urchin Dive 1998 2 33.3% 0 0.0% 0 0.0% 4 66.7% 0 0.0% 0 0.0% 6
1999 0 0.0% 0 0.0% 0 0.0% 3 100.0% 0 0.0% 0 0.0% 3 2000 3 75.0% 0 0.0% 0 0.0% 1 25.0% 0 0.0% 0 0.0% 4
2001 4 50.0% 0 0.0% 0 0.0% 4 50.0% 0 0.0% 0 0.0% 8 2002 4 44.4% 0 0.0% 0 0.0% 5 55.6% 0 0.0% 0 0.0% 9
2003 5 45.5% 0 0.0% 0 0.0% 5 45.5% 1 9.1% 0 0.0% 11

Table 9. Relationship of Emergency Transferors to Transfer Recipients by, Permit Type
62 Emergency Transfers of Alaska’s Commercial Fisheries Limited Entry Permits, 1975 ‐ 2013
Permit Type Year Friend/Partner Immediate Family Other Relative None Other Unanswered Total Southeast Sea 2004 3 50.0% 0 0.0% 0 0.0% 3 50.0% 0 0.0% 0 0.0% 6 Urchin Dive (cont.) 2005 2 66.7% 0 0.0% 0 0.0% 1 33.3% 0 0.0% 0 0.0% 3 2006 1 50.0% 0 0.0% 0 0.0% 1 50.0% 0 0.0% 0 0.0% 2
2009 1 100.0% 0 0.0% 0 0.0% 0 0.0% 0 0.0% 0 0.0% 1 2010 2 100.0% 0 0.0% 0 0.0% 0 0.0% 0 0.0% 0 0.0% 2
2013 2 66.7% 0 0.0% 0 0.0% 1 33.3% 0 0.0% 0 0.0% 3 Total 35 50.0% 0 0.0% 0 0.0% 34 48.6% 1 1.4% 0 0.0% 70
Southeast Geoduck 1998 1 16.7% 0 0.0% 0 0.0% 5 83.3% 0 0.0% 0 0.0% 6 Clams Dive 2000 3 75.0% 0 0.0% 0 0.0% 0 0.0% 1 25.0% 0 0.0% 4
2002 1 50.0% 0 0.0% 0 0.0% 1 50.0% 0 0.0% 0 0.0% 2 2003 0 0.0% 0 0.0% 0 0.0% 3 100.0% 0 0.0% 0 0.0% 3
2004 1 16.7% 0 0.0% 0 0.0% 5 83.3% 0 0.0% 0 0.0% 6 2005 3 33.3% 0 0.0% 0 0.0% 6 66.7% 0 0.0% 0 0.0% 9
2006 1 33.3% 0 0.0% 0 0.0% 1 33.3% 1 33.3% 0 0.0% 3 2007 1 25.0% 0 0.0% 0 0.0% 3 75.0% 0 0.0% 0 0.0% 4 2008 1 33.3% 0 0.0% 0 0.0% 2 66.7% 0 0.0% 0 0.0% 3
2009 2 50.0% 0 0.0% 0 0.0% 2 50.0% 0 0.0% 0 0.0% 4 2010 2 28.6% 1 14.3% 0 0.0% 4 57.1% 0 0.0% 0 0.0% 7 2011 2 33.3% 1 16.7% 0 0.0% 3 50.0% 0 0.0% 0 0.0% 6
2012 2 25.0% 2 25.0% 0 0.0% 3 37.5% 1 12.5% 0 0.0% 8 2013 4 40.0% 1 10.0% 0 0.0% 5 50.0% 0 0.0% 0 0.0% 10 Total 24 32.0% 5 6.7% 0 0.0% 43 57.3% 3 4.0% 0 0.0% 75
Southeast Sea 1996 1 50.0% 0 0.0% 0 0.0% 1 50.0% 0 0.0% 0 0.0% 2 Cucumber Dive 1997 1 25.0% 0 0.0% 0 0.0% 3 75.0% 0 0.0% 0 0.0% 4
1998 2 40.0% 0 0.0% 0 0.0% 3 60.0% 0 0.0% 0 0.0% 5 1999 1 25.0% 0 0.0% 0 0.0% 3 75.0% 0 0.0% 0 0.0% 4
2000 4 50.0% 0 0.0% 0 0.0% 4 50.0% 0 0.0% 0 0.0% 8 2001 6 42.9% 1 7.1% 0 0.0% 7 50.0% 0 0.0% 0 0.0% 14
2002 6 60.0% 0 0.0% 0 0.0% 4 40.0% 0 0.0% 0 0.0% 10 2003 3 33.3% 2 22.2% 0 0.0% 4 44.4% 0 0.0% 0 0.0% 9 2004 4 44.4% 1 11.1% 0 0.0% 4 44.4% 0 0.0% 0 0.0% 9
2005 7 58.3% 2 16.7% 0 0.0% 3 25.0% 0 0.0% 0 0.0% 12 2006 5 41.7% 2 16.7% 0 0.0% 5 41.7% 0 0.0% 0 0.0% 12 2007 3 23.1% 2 15.4% 0 0.0% 8 61.5% 0 0.0% 0 0.0% 13
2008 3 21.4% 2 14.3% 0 0.0% 9 64.3% 0 0.0% 0 0.0% 14 2009 6 46.2% 1 7.7% 0 0.0% 6 46.2% 0 0.0% 0 0.0% 13 2010 5 20.8% 5 20.8% 0 0.0% 14 58.3% 0 0.0% 0 0.0% 24
2011 6 42.9% 1 7.1% 0 0.0% 7 50.0% 0 0.0% 0 0.0% 14 2012 8 50.0% 1 6.3% 0 0.0% 7 43.8% 0 0.0% 0 0.0% 16 2013 8 44.4% 0 0.0% 0 0.0% 9 50.0% 1 5.6% 0 0.0% 18
Total 79 39.3% 20 10.0% 0 0.0% 101 50.2% 1 0.5% 0 0.0% 201
Yakutat Salmon 1994 4 30.8% 5 38.5% 2 15.4% 0 0.0% 2 15.4% 0 0.0% 13 Set Gillnet 1995 4 21.1% 9 47.4% 2 10.5% 3 15.8% 0 0.0% 1 5.3% 19
1996 6 27.3% 7 31.8% 1 4.5% 3 13.6% 1 4.5% 4 18.2% 22 1997 11 40.7% 9 33.3% 3 11.1% 3 11.1% 1 3.7% 0 0.0% 27
1998 9 36.0% 10 40.0% 3 12.0% 3 12.0% 0 0.0% 0 0.0% 25 1999 13 52.0% 7 28.0% 4 16.0% 0 0.0% 1 4.0% 0 0.0% 25
2000 11 47.8% 8 34.8% 0 0.0% 3 13.0% 1 4.3% 0 0.0% 23 2001 6 31.6% 9 47.4% 2 10.5% 1 5.3% 0 0.0% 1 5.3% 19 2002 1 11.1% 4 44.4% 2 22.2% 1 11.1% 0 0.0% 1 11.1% 9
2003 7 35.0% 7 35.0% 3 15.0% 3 15.0% 0 0.0% 0 0.0% 20 2004 2 14.3% 6 42.9% 1 7.1% 3 21.4% 2 14.3% 0 0.0% 14 2005 5 31.3% 8 50.0% 0 0.0% 2 12.5% 0 0.0% 1 6.3% 16
2006 3 30.0% 3 30.0% 1 10.0% 3 30.0% 0 0.0% 0 0.0% 10 2007 6 35.3% 8 47.1% 0 0.0% 3 17.6% 0 0.0% 0 0.0% 17 2008 8 47.1% 3 17.6% 0 0.0% 6 35.3% 0 0.0% 0 0.0% 17
2009 8 50.0% 4 25.0% 0 0.0% 4 25.0% 0 0.0% 0 0.0% 16 2010 8 42.1% 7 36.8% 1 5.3% 1 5.3% 2 10.5% 0 0.0% 19 2011 6 26.1% 9 39.1% 3 13.0% 4 17.4% 0 0.0% 1 4.3% 23

Table 9. Relationship of Emergency Transferors to Transfer Recipients by, Permit Type
63 Emergency Transfers of Alaska’s Commercial Fisheries Limited Entry Permits, 1975 ‐ 2013
Permit Type Year Friend/Partner Immediate Family Other Relative None Other Unanswered Total Yakutat Salmon 2012 4 40.0% 5 50.0% 1 10.0% 0 0.0% 0 0.0% 0 0.0% 10 Set Gillnet (cont.) 2013 3 42.9% 3 42.9% 1 14.3% 0 0.0% 0 0.0% 0 0.0% 7
Total 125 35.6% 131 37.3% 30 8.5% 46 13.1% 10 2.8% 9 2.6% 351
Prince William 1994 4 80.0% 0 0.0% 0 0.0% 1 20.0% 0 0.0% 0 0.0% 5 Sound Salmon 1995 3 27.3% 2 18.2% 0 0.0% 3 27.3% 2 18.2% 1 9.1% 11 Purse Seine 1996 1 50.0% 0 0.0% 0 0.0% 0 0.0% 0 0.0% 1 50.0% 2 1997 0 0.0% 0 0.0% 1 50.0% 1 50.0% 0 0.0% 0 0.0% 2
1998 2 25.0% 3 37.5% 0 0.0% 2 25.0% 1 12.5% 0 0.0% 8 1999 4 33.3% 6 50.0% 0 0.0% 2 16.7% 0 0.0% 0 0.0% 12
2000 2 28.6% 2 28.6% 1 14.3% 2 28.6% 0 0.0% 0 0.0% 7 2001 4 44.4% 4 44.4% 0 0.0% 1 11.1% 0 0.0% 0 0.0% 9 2002 6 85.7% 1 14.3% 0 0.0% 0 0.0% 0 0.0% 0 0.0% 7
2003 1 33.3% 2 66.7% 0 0.0% 0 0.0% 0 0.0% 0 0.0% 3 2004 1 20.0% 2 40.0% 0 0.0% 2 40.0% 0 0.0% 0 0.0% 5 2005 3 60.0% 2 40.0% 0 0.0% 0 0.0% 0 0.0% 0 0.0% 5
2006 1 25.0% 1 25.0% 0 0.0% 2 50.0% 0 0.0% 0 0.0% 4 2007 2 40.0% 2 40.0% 0 0.0% 1 20.0% 0 0.0% 0 0.0% 5 2008 7 58.3% 2 16.7% 0 0.0% 2 16.7% 0 0.0% 1 8.3% 12
2009 6 42.9% 3 21.4% 0 0.0% 4 28.6% 0 0.0% 1 7.1% 14 2010 10 45.5% 4 18.2% 0 0.0% 8 36.4% 0 0.0% 0 0.0% 22 2011 6 40.0% 6 40.0% 1 6.7% 2 13.3% 0 0.0% 0 0.0% 15
2012 5 27.8% 3 16.7% 0 0.0% 9 50.0% 1 5.6% 0 0.0% 18 2013 6 24.0% 8 32.0% 0 0.0% 11 44.0% 0 0.0% 0 0.0% 25 Total 74 38.7% 53 27.7% 3 1.6% 53 27.7% 4 2.1% 4 2.1% 191
Prince William 1994 5 26.3% 4 21.1% 0 0.0% 3 15.8% 6 31.6% 1 5.3% 19 Sound Salmon 1995 11 28.9% 6 15.8% 2 5.3% 16 42.1% 2 5.3% 1 2.6% 38 Drift Gillnet 1996 6 20.7% 5 17.2% 2 6.9% 13 44.8% 2 6.9% 1 3.4% 29 1997 8 24.2% 7 21.2% 0 0.0% 18 54.5% 0 0.0% 0 0.0% 33
1998 10 33.3% 5 16.7% 2 6.7% 13 43.3% 0 0.0% 0 0.0% 30 1999 13 35.1% 8 21.6% 0 0.0% 15 40.5% 0 0.0% 1 2.7% 37
2000 14 40.0% 6 17.1% 0 0.0% 15 42.9% 0 0.0% 0 0.0% 35 2001 8 30.8% 9 34.6% 0 0.0% 8 30.8% 1 3.8% 0 0.0% 26 2002 4 14.3% 9 32.1% 2 7.1% 13 46.4% 0 0.0% 0 0.0% 28
2003 12 41.4% 7 24.1% 0 0.0% 10 34.5% 0 0.0% 0 0.0% 29 2004 8 34.8% 6 26.1% 0 0.0% 9 39.1% 0 0.0% 0 0.0% 23 2005 11 35.5% 6 19.4% 2 6.5% 12 38.7% 0 0.0% 0 0.0% 31
2006 8 25.0% 4 12.5% 1 3.1% 17 53.1% 1 3.1% 1 3.1% 32 2007 6 20.0% 3 10.0% 1 3.3% 17 56.7% 3 10.0% 0 0.0% 30 2008 15 44.1% 5 14.7% 1 2.9% 12 35.3% 1 2.9% 0 0.0% 34
2009 18 28.6% 19 30.2% 1 1.6% 23 36.5% 1 1.6% 1 1.6% 63 2010 16 26.7% 13 21.7% 2 3.3% 27 45.0% 1 1.7% 1 1.7% 60 2011 16 26.2% 13 21.3% 1 1.6% 31 50.8% 0 0.0% 0 0.0% 61
2012 16 27.1% 12 20.3% 2 3.4% 28 47.5% 0 0.0% 1 1.7% 59 2013 12 24.5% 9 18.4% 0 0.0% 27 55.1% 1 2.0% 0 0.0% 49 Total 217 29.1% 156 20.9% 19 2.5% 327 43.8% 19 2.5% 8 1.1% 746
Prince William 1994 0 0.0% 0 0.0% 0 0.0% 0 0.0% 1 100.0% 0 0.0% 1 Sound Salmon 1995 1 100.0% 0 0.0% 0 0.0% 0 0.0% 0 0.0% 0 0.0% 1 Set Gillnet 1997 0 0.0% 1 100.0% 0 0.0% 0 0.0% 0 0.0% 0 0.0% 1 1999 1 100.0% 0 0.0% 0 0.0% 0 0.0% 0 0.0% 0 0.0% 1
2000 1 50.0% 1 50.0% 0 0.0% 0 0.0% 0 0.0% 0 0.0% 2 2001 0 0.0% 3 100.0% 0 0.0% 0 0.0% 0 0.0% 0 0.0% 3
2002 2 50.0% 2 50.0% 0 0.0% 0 0.0% 0 0.0% 0 0.0% 4 2003 3 60.0% 1 20.0% 1 20.0% 0 0.0% 0 0.0% 0 0.0% 5 2004 0 0.0% 2 66.7% 0 0.0% 1 33.3% 0 0.0% 0 0.0% 3
2005 0 0.0% 3 100.0% 0 0.0% 0 0.0% 0 0.0% 0 0.0% 3 2006 1 33.3% 2 66.7% 0 0.0% 0 0.0% 0 0.0% 0 0.0% 3 2007 2 33.3% 4 66.7% 0 0.0% 0 0.0% 0 0.0% 0 0.0% 6
2008 2 100.0% 0 0.0% 0 0.0% 0 0.0% 0 0.0% 0 0.0% 2 2009 3 60.0% 2 40.0% 0 0.0% 0 0.0% 0 0.0% 0 0.0% 5

Table 9. Relationship of Emergency Transferors to Transfer Recipients by, Permit Type
64 Emergency Transfers of Alaska’s Commercial Fisheries Limited Entry Permits, 1975 ‐ 2013
Permit Type Year Friend/Partner Immediate Family Other Relative None Other Unanswered Total Prince William 2010 3 60.0% 2 40.0% 0 0.0% 0 0.0% 0 0.0% 0 0.0% 5 Sound Salmon 2011 3 60.0% 2 40.0% 0 0.0% 0 0.0% 0 0.0% 0 0.0% 5 Set Gillnet 2012 1 25.0% 3 75.0% 0 0.0% 0 0.0% 0 0.0% 0 0.0% 4 (cont.) 2013 0 0.0% 2 100.0% 0 0.0% 0 0.0% 0 0.0% 0 0.0% 2 Total 23 41.1% 30 53.6% 1 1.8% 1 1.8% 1 1.8% 0 0.0% 56
Prince William 1997 1 100.0% 0 0.0% 0 0.0% 0 0.0% 0 0.0% 0 0.0% 1 Sound Roe Herring 1998 3 60.0% 1 20.0% 0 0.0% 1 20.0% 0 0.0% 0 0.0% 5 Purse Seine 1999 0 0.0% 0 0.0% 0 0.0% 3 100.0% 0 0.0% 0 0.0% 3 Total 4 44.4% 1 11.1% 0 0.0% 4 44.4% 0 0.0% 0 0.0% 9
Prince William 1995 0 0.0% 0 0.0% 0 0.0% 1 100.0% 0 0.0% 0 0.0% 1 Sound Roe 1997 0 0.0% 0 0.0% 0 0.0% 1 100.0% 0 0.0% 0 0.0% 1 Herring Gillnet 1998 1 50.0% 0 0.0% 0 0.0% 1 50.0% 0 0.0% 0 0.0% 2 1999 0 0.0% 0 0.0% 0 0.0% 1 100.0% 0 0.0% 0 0.0% 1
Total 1 20.0% 0 0.0% 0 0.0% 4 80.0% 0 0.0% 0 0.0% 5
Prince William 1994 0 0.0% 0 0.0% 0 0.0% 0 0.0% 1 100.0% 0 0.0% 1 Sound Herring 1997 7 50.0% 1 7.1% 0 0.0% 5 35.7% 0 0.0% 1 7.1% 14 Spawn-On-Kelp 1998 2 40.0% 1 20.0% 0 0.0% 2 40.0% 0 0.0% 0 0.0% 5 Pound Total 9 45.0% 2 10.0% 0 0.0% 7 35.0% 1 5.0% 1 5.0% 20
Prince William 1996 1 100.0% 0 0.0% 0 0.0% 0 0.0% 0 0.0% 0 0.0% 1 Sound Sablefish 1998 3 75.0% 0 0.0% 0 0.0% 1 25.0% 0 0.0% 0 0.0% 4 Fixed Gear 2000 1 50.0% 1 50.0% 0 0.0% 0 0.0% 0 0.0% 0 0.0% 2 Vessel to 50 ft 2001 0 0.0% 1 100.0% 0 0.0% 0 0.0% 0 0.0% 0 0.0% 1
2002 2 40.0% 1 20.0% 0 0.0% 2 40.0% 0 0.0% 0 0.0% 5 2003 4 57.1% 2 28.6% 0 0.0% 1 14.3% 0 0.0% 0 0.0% 7
2004 1 33.3% 2 66.7% 0 0.0% 0 0.0% 0 0.0% 0 0.0% 3 2005 1 50.0% 1 50.0% 0 0.0% 0 0.0% 0 0.0% 0 0.0% 2 2006 3 42.9% 4 57.1% 0 0.0% 0 0.0% 0 0.0% 0 0.0% 7
2007 2 33.3% 3 50.0% 0 0.0% 1 16.7% 0 0.0% 0 0.0% 6 2008 1 25.0% 3 75.0% 0 0.0% 0 0.0% 0 0.0% 0 0.0% 4 2009 1 33.3% 2 66.7% 0 0.0% 0 0.0% 0 0.0% 0 0.0% 3
2010 2 50.0% 2 50.0% 0 0.0% 0 0.0% 0 0.0% 0 0.0% 4 2011 2 28.6% 5 71.4% 0 0.0% 0 0.0% 0 0.0% 0 0.0% 7 2012 3 37.5% 5 62.5% 0 0.0% 0 0.0% 0 0.0% 0 0.0% 8
2013 0 0.0% 4 100.0% 0 0.0% 0 0.0% 0 0.0% 0 0.0% 4 Total 27 39.7% 36 52.9% 0 0.0% 5 7.4% 0 0.0% 0 0.0% 68
Prince William 2001 0 0.0% 0 0.0% 0 0.0% 1 100.0% 0 0.0% 0 0.0% 1 Sound Sablefish 2004 0 0.0% 0 0.0% 0 0.0% 1 100.0% 0 0.0% 0 0.0% 1 Fixed Gear 2005 0 0.0% 1 100.0% 0 0.0% 0 0.0% 0 0.0% 0 0.0% 1 Vessel to 35 ft Total 0 0.0% 1 33.3% 0 0.0% 2 66.7% 0 0.0% 0 0.0% 3
Cook Inlet Salmon 1994 2 66.7% 1 33.3% 0 0.0% 0 0.0% 0 0.0% 0 0.0% 3 Purse Seine 1995 2 50.0% 0 0.0% 0 0.0% 2 50.0% 0 0.0% 0 0.0% 4
1996 1 50.0% 0 0.0% 0 0.0% 1 50.0% 0 0.0% 0 0.0% 2 1997 0 0.0% 0 0.0% 0 0.0% 1 100.0% 0 0.0% 0 0.0% 1
1998 2 66.7% 0 0.0% 0 0.0% 1 33.3% 0 0.0% 0 0.0% 3 1999 2 50.0% 1 25.0% 0 0.0% 1 25.0% 0 0.0% 0 0.0% 4
2000 1 50.0% 0 0.0% 0 0.0% 1 50.0% 0 0.0% 0 0.0% 2 2002 3 60.0% 0 0.0% 1 20.0% 1 20.0% 0 0.0% 0 0.0% 5 2003 2 50.0% 1 25.0% 0 0.0% 0 0.0% 1 25.0% 0 0.0% 4
2004 1 20.0% 1 20.0% 1 20.0% 2 40.0% 0 0.0% 0 0.0% 5 2005 2 50.0% 2 50.0% 0 0.0% 0 0.0% 0 0.0% 0 0.0% 4 2007 0 0.0% 1 100.0% 0 0.0% 0 0.0% 0 0.0% 0 0.0% 1
2008 1 33.3% 2 66.7% 0 0.0% 0 0.0% 0 0.0% 0 0.0% 3 2009 2 66.7% 1 33.3% 0 0.0% 0 0.0% 0 0.0% 0 0.0% 3 2010 0 0.0% 1 50.0% 0 0.0% 1 50.0% 0 0.0% 0 0.0% 2
2011 2 50.0% 0 0.0% 1 25.0% 1 25.0% 0 0.0% 0 0.0% 4 2012 0 0.0% 1 50.0% 1 50.0% 0 0.0% 0 0.0% 0 0.0% 2 2013 0 0.0% 1 50.0% 0 0.0% 1 50.0% 0 0.0% 0 0.0% 2
Total 23 42.6% 13 24.1% 4 7.4% 13 24.1% 1 1.9% 0 0.0% 54
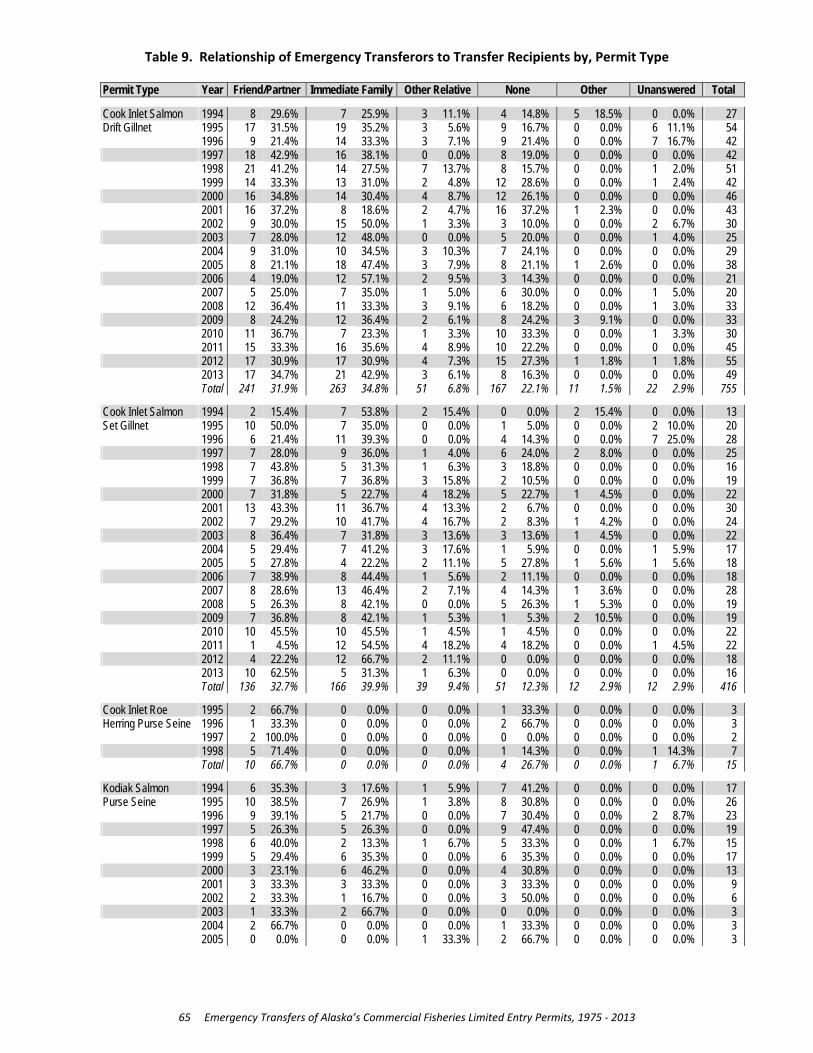
Table 9. Relationship of Emergency Transferors to Transfer Recipients by, Permit Type
65 Emergency Transfers of Alaska’s Commercial Fisheries Limited Entry Permits, 1975 ‐ 2013
Permit Type Year Friend/Partner Immediate Family Other Relative None Other Unanswered Total Cook Inlet Salmon 1994 8 29.6% 7 25.9% 3 11.1% 4 14.8% 5 18.5% 0 0.0% 27 Drift Gillnet 1995 17 31.5% 19 35.2% 3 5.6% 9 16.7% 0 0.0% 6 11.1% 54
1996 9 21.4% 14 33.3% 3 7.1% 9 21.4% 0 0.0% 7 16.7% 42 1997 18 42.9% 16 38.1% 0 0.0% 8 19.0% 0 0.0% 0 0.0% 42
1998 21 41.2% 14 27.5% 7 13.7% 8 15.7% 0 0.0% 1 2.0% 51 1999 14 33.3% 13 31.0% 2 4.8% 12 28.6% 0 0.0% 1 2.4% 42
2000 16 34.8% 14 30.4% 4 8.7% 12 26.1% 0 0.0% 0 0.0% 46 2001 16 37.2% 8 18.6% 2 4.7% 16 37.2% 1 2.3% 0 0.0% 43 2002 9 30.0% 15 50.0% 1 3.3% 3 10.0% 0 0.0% 2 6.7% 30
2003 7 28.0% 12 48.0% 0 0.0% 5 20.0% 0 0.0% 1 4.0% 25 2004 9 31.0% 10 34.5% 3 10.3% 7 24.1% 0 0.0% 0 0.0% 29 2005 8 21.1% 18 47.4% 3 7.9% 8 21.1% 1 2.6% 0 0.0% 38
2006 4 19.0% 12 57.1% 2 9.5% 3 14.3% 0 0.0% 0 0.0% 21 2007 5 25.0% 7 35.0% 1 5.0% 6 30.0% 0 0.0% 1 5.0% 20 2008 12 36.4% 11 33.3% 3 9.1% 6 18.2% 0 0.0% 1 3.0% 33
2009 8 24.2% 12 36.4% 2 6.1% 8 24.2% 3 9.1% 0 0.0% 33 2010 11 36.7% 7 23.3% 1 3.3% 10 33.3% 0 0.0% 1 3.3% 30 2011 15 33.3% 16 35.6% 4 8.9% 10 22.2% 0 0.0% 0 0.0% 45
2012 17 30.9% 17 30.9% 4 7.3% 15 27.3% 1 1.8% 1 1.8% 55 2013 17 34.7% 21 42.9% 3 6.1% 8 16.3% 0 0.0% 0 0.0% 49 Total 241 31.9% 263 34.8% 51 6.8% 167 22.1% 11 1.5% 22 2.9% 755
Cook Inlet Salmon 1994 2 15.4% 7 53.8% 2 15.4% 0 0.0% 2 15.4% 0 0.0% 13 Set Gillnet 1995 10 50.0% 7 35.0% 0 0.0% 1 5.0% 0 0.0% 2 10.0% 20
1996 6 21.4% 11 39.3% 0 0.0% 4 14.3% 0 0.0% 7 25.0% 28 1997 7 28.0% 9 36.0% 1 4.0% 6 24.0% 2 8.0% 0 0.0% 25
1998 7 43.8% 5 31.3% 1 6.3% 3 18.8% 0 0.0% 0 0.0% 16 1999 7 36.8% 7 36.8% 3 15.8% 2 10.5% 0 0.0% 0 0.0% 19
2000 7 31.8% 5 22.7% 4 18.2% 5 22.7% 1 4.5% 0 0.0% 22 2001 13 43.3% 11 36.7% 4 13.3% 2 6.7% 0 0.0% 0 0.0% 30 2002 7 29.2% 10 41.7% 4 16.7% 2 8.3% 1 4.2% 0 0.0% 24
2003 8 36.4% 7 31.8% 3 13.6% 3 13.6% 1 4.5% 0 0.0% 22 2004 5 29.4% 7 41.2% 3 17.6% 1 5.9% 0 0.0% 1 5.9% 17 2005 5 27.8% 4 22.2% 2 11.1% 5 27.8% 1 5.6% 1 5.6% 18
2006 7 38.9% 8 44.4% 1 5.6% 2 11.1% 0 0.0% 0 0.0% 18 2007 8 28.6% 13 46.4% 2 7.1% 4 14.3% 1 3.6% 0 0.0% 28 2008 5 26.3% 8 42.1% 0 0.0% 5 26.3% 1 5.3% 0 0.0% 19
2009 7 36.8% 8 42.1% 1 5.3% 1 5.3% 2 10.5% 0 0.0% 19 2010 10 45.5% 10 45.5% 1 4.5% 1 4.5% 0 0.0% 0 0.0% 22 2011 1 4.5% 12 54.5% 4 18.2% 4 18.2% 0 0.0% 1 4.5% 22
2012 4 22.2% 12 66.7% 2 11.1% 0 0.0% 0 0.0% 0 0.0% 18 2013 10 62.5% 5 31.3% 1 6.3% 0 0.0% 0 0.0% 0 0.0% 16 Total 136 32.7% 166 39.9% 39 9.4% 51 12.3% 12 2.9% 12 2.9% 416
Cook Inlet Roe 1995 2 66.7% 0 0.0% 0 0.0% 1 33.3% 0 0.0% 0 0.0% 3 Herring Purse Seine 1996 1 33.3% 0 0.0% 0 0.0% 2 66.7% 0 0.0% 0 0.0% 3
1997 2 100.0% 0 0.0% 0 0.0% 0 0.0% 0 0.0% 0 0.0% 2 1998 5 71.4% 0 0.0% 0 0.0% 1 14.3% 0 0.0% 1 14.3% 7
Total 10 66.7% 0 0.0% 0 0.0% 4 26.7% 0 0.0% 1 6.7% 15
Kodiak Salmon 1994 6 35.3% 3 17.6% 1 5.9% 7 41.2% 0 0.0% 0 0.0% 17 Purse Seine 1995 10 38.5% 7 26.9% 1 3.8% 8 30.8% 0 0.0% 0 0.0% 26
1996 9 39.1% 5 21.7% 0 0.0% 7 30.4% 0 0.0% 2 8.7% 23 1997 5 26.3% 5 26.3% 0 0.0% 9 47.4% 0 0.0% 0 0.0% 19
1998 6 40.0% 2 13.3% 1 6.7% 5 33.3% 0 0.0% 1 6.7% 15 1999 5 29.4% 6 35.3% 0 0.0% 6 35.3% 0 0.0% 0 0.0% 17
2000 3 23.1% 6 46.2% 0 0.0% 4 30.8% 0 0.0% 0 0.0% 13 2001 3 33.3% 3 33.3% 0 0.0% 3 33.3% 0 0.0% 0 0.0% 9 2002 2 33.3% 1 16.7% 0 0.0% 3 50.0% 0 0.0% 0 0.0% 6
2003 1 33.3% 2 66.7% 0 0.0% 0 0.0% 0 0.0% 0 0.0% 3 2004 2 66.7% 0 0.0% 0 0.0% 1 33.3% 0 0.0% 0 0.0% 3 2005 0 0.0% 0 0.0% 1 33.3% 2 66.7% 0 0.0% 0 0.0% 3

Table 9. Relationship of Emergency Transferors to Transfer Recipients by, Permit Type
66 Emergency Transfers of Alaska’s Commercial Fisheries Limited Entry Permits, 1975 ‐ 2013
Permit Type Year Friend/Partner Immediate Family Other Relative None Other Unanswered Total Kodiak Salmon 2006 2 40.0% 1 20.0% 0 0.0% 2 40.0% 0 0.0% 0 0.0% 5 Purse Seine (cont.) 2007 2 33.3% 0 0.0% 1 16.7% 3 50.0% 0 0.0% 0 0.0% 6
2008 4 80.0% 1 20.0% 0 0.0% 0 0.0% 0 0.0% 0 0.0% 5 2009 4 50.0% 3 37.5% 0 0.0% 1 12.5% 0 0.0% 0 0.0% 8
2010 2 33.3% 1 16.7% 1 16.7% 2 33.3% 0 0.0% 0 0.0% 6 2011 3 37.5% 2 25.0% 0 0.0% 2 25.0% 0 0.0% 1 12.5% 8
2012 2 25.0% 2 25.0% 2 25.0% 2 25.0% 0 0.0% 0 0.0% 8 2013 3 50.0% 2 33.3% 0 0.0% 1 16.7% 0 0.0% 0 0.0% 6 Total 74 35.9% 52 25.2% 8 3.9% 68 33.0% 0 0.0% 4 1.9% 206
Kodiak Salmon 1995 1 100.0% 0 0.0% 0 0.0% 0 0.0% 0 0.0% 0 0.0% 1 Beach Seine 1996 0 0.0% 1 100.0% 0 0.0% 0 0.0% 0 0.0% 0 0.0% 1
1999 1 100.0% 0 0.0% 0 0.0% 0 0.0% 0 0.0% 0 0.0% 1 2000 0 0.0% 1 100.0% 0 0.0% 0 0.0% 0 0.0% 0 0.0% 1
2006 0 0.0% 0 0.0% 0 0.0% 1 100.0% 0 0.0% 0 0.0% 1 2009 0 0.0% 0 0.0% 1 100.0% 0 0.0% 0 0.0% 0 0.0% 1
2010 0 0.0% 1 100.0% 0 0.0% 0 0.0% 0 0.0% 0 0.0% 1 2013 0 0.0% 1 100.0% 0 0.0% 0 0.0% 0 0.0% 0 0.0% 1 Total 2 25.0% 4 50.0% 1 12.5% 1 12.5% 0 0.0% 0 0.0% 8
Kodiak Salmon 1994 0 0.0% 3 50.0% 0 0.0% 0 0.0% 3 50.0% 0 0.0% 6 Set Gillnet 1995 6 37.5% 2 12.5% 2 12.5% 3 18.8% 0 0.0% 3 18.8% 16
1996 5 23.8% 8 38.1% 2 9.5% 3 14.3% 0 0.0% 3 14.3% 21 1997 8 47.1% 5 29.4% 1 5.9% 3 17.6% 0 0.0% 0 0.0% 17
1998 7 35.0% 4 20.0% 3 15.0% 1 5.0% 4 20.0% 1 5.0% 20 1999 10 47.6% 8 38.1% 2 9.5% 1 4.8% 0 0.0% 0 0.0% 21
2000 9 27.3% 11 33.3% 3 9.1% 8 24.2% 1 3.0% 1 3.0% 33 2001 15 51.7% 10 34.5% 0 0.0% 3 10.3% 0 0.0% 1 3.4% 29 2002 18 60.0% 9 30.0% 0 0.0% 3 10.0% 0 0.0% 0 0.0% 30
2003 16 55.2% 10 34.5% 2 6.9% 1 3.4% 0 0.0% 0 0.0% 29 2004 17 63.0% 5 18.5% 1 3.7% 3 11.1% 1 3.7% 0 0.0% 27 2005 19 70.4% 4 14.8% 2 7.4% 1 3.7% 1 3.7% 0 0.0% 27
2006 18 72.0% 4 16.0% 0 0.0% 3 12.0% 0 0.0% 0 0.0% 25 2007 15 65.2% 3 13.0% 0 0.0% 4 17.4% 1 4.3% 0 0.0% 23 2008 14 53.8% 8 30.8% 0 0.0% 3 11.5% 1 3.8% 0 0.0% 26
2009 8 33.3% 16 66.7% 0 0.0% 0 0.0% 0 0.0% 0 0.0% 24 2010 1 5.9% 12 70.6% 1 5.9% 0 0.0% 0 0.0% 3 17.6% 17 2011 14 51.9% 8 29.6% 1 3.7% 4 14.8% 0 0.0% 0 0.0% 27
2012 17 51.5% 7 21.2% 2 6.1% 7 21.2% 0 0.0% 0 0.0% 33 2013 14 60.9% 6 26.1% 1 4.3% 2 8.7% 0 0.0% 0 0.0% 23 Total 231 48.7% 143 30.2% 23 4.9% 53 11.2% 12 2.5% 12 2.5% 474
Kodiak Roe Herring 1994 0 0.0% 0 0.0% 0 0.0% 0 0.0% 1 100.0% 0 0.0% 1 Purse Seine 1995 0 0.0% 1 50.0% 0 0.0% 1 50.0% 0 0.0% 0 0.0% 2
1996 1 33.3% 1 33.3% 1 33.3% 0 0.0% 0 0.0% 0 0.0% 3 1997 2 50.0% 1 25.0% 0 0.0% 1 25.0% 0 0.0% 0 0.0% 4
1998 0 0.0% 0 0.0% 0 0.0% 1 100.0% 0 0.0% 0 0.0% 1 1999 0 0.0% 0 0.0% 0 0.0% 1 100.0% 0 0.0% 0 0.0% 1
2001 0 0.0% 0 0.0% 0 0.0% 2 100.0% 0 0.0% 0 0.0% 2 2002 1 50.0% 0 0.0% 0 0.0% 1 50.0% 0 0.0% 0 0.0% 2 2003 0 0.0% 0 0.0% 0 0.0% 1 100.0% 0 0.0% 0 0.0% 1
2005 2 100.0% 0 0.0% 0 0.0% 0 0.0% 0 0.0% 0 0.0% 2 2008 1 100.0% 0 0.0% 0 0.0% 0 0.0% 0 0.0% 0 0.0% 1 2009 2 66.7% 0 0.0% 0 0.0% 1 33.3% 0 0.0% 0 0.0% 3
2012 0 0.0% 0 0.0% 0 0.0% 1 100.0% 0 0.0% 0 0.0% 1 2013 0 0.0% 2 100.0% 0 0.0% 0 0.0% 0 0.0% 0 0.0% 2 Total 9 34.6% 5 19.2% 1 3.8% 10 38.5% 1 3.8% 0 0.0% 26
Kodiak Roe 1995 4 66.7% 1 16.7% 0 0.0% 1 16.7% 0 0.0% 0 0.0% 6 Herring Gillnet 1996 6 100.0% 0 0.0% 0 0.0% 0 0.0% 0 0.0% 0 0.0% 6
1997 3 75.0% 0 0.0% 0 0.0% 1 25.0% 0 0.0% 0 0.0% 4 1998 1 100.0% 0 0.0% 0 0.0% 0 0.0% 0 0.0% 0 0.0% 1
2001 0 0.0% 1 100.0% 0 0.0% 0 0.0% 0 0.0% 0 0.0% 1

Table 9. Relationship of Emergency Transferors to Transfer Recipients by, Permit Type
67 Emergency Transfers of Alaska’s Commercial Fisheries Limited Entry Permits, 1975 ‐ 2013
Permit Type Year Friend/Partner Immediate Family Other Relative None Other Unanswered Total Kodiak Roe 2002 0 0.0% 0 0.0% 0 0.0% 1 100.0% 0 0.0% 0 0.0% 1 Herring Gillnet 2003 0 0.0% 0 0.0% 0 0.0% 1 100.0% 0 0.0% 0 0.0% 1 (cont.) 2004 0 0.0% 0 0.0% 0 0.0% 2 100.0% 0 0.0% 0 0.0% 2
2008 0 0.0% 1 100.0% 0 0.0% 0 0.0% 0 0.0% 0 0.0% 1 2010 0 0.0% 0 0.0% 0 0.0% 1 100.0% 0 0.0% 0 0.0% 1
2013 1 100.0% 0 0.0% 0 0.0% 0 0.0% 0 0.0% 0 0.0% 1 Total 15 60.0% 3 12.0% 0 0.0% 7 28.0% 0 0.0% 0 0.0% 25
Kodiak Roe Herring 2010 0 0.0% 0 0.0% 0 0.0% 1 100.0% 0 0.0% 0 0.0% 1 Gillnet & Seine Total 0 0.0% 0 0.0% 0 0.0% 1 100.0% 0 0.0% 0 0.0% 1
Kodiak Tanner Bairdi 2006 1 100.0% 0 0.0% 0 0.0% 0 0.0% 0 0.0% 0 0.0% 1 Crab Pot 2008 1 100.0% 0 0.0% 0 0.0% 0 0.0% 0 0.0% 0 0.0% 1 Vessel To 120 ft 2010 0 0.0% 0 0.0% 0 0.0% 1 100.0% 0 0.0% 0 0.0% 1 2011 0 0.0% 1 100.0% 0 0.0% 0 0.0% 0 0.0% 0 0.0% 1
2013 1 100.0% 0 0.0% 0 0.0% 0 0.0% 0 0.0% 0 0.0% 1 Total 3 60.0% 1 20.0% 0 0.0% 1 20.0% 0 0.0% 0 0.0% 5
Kodiak Tanner Bairdi 2003 0 0.0% 1 100.0% 0 0.0% 0 0.0% 0 0.0% 0 0.0% 1 Crab Pot Vessel 2004 1 100.0% 0 0.0% 0 0.0% 0 0.0% 0 0.0% 0 0.0% 1 Under 60 ft 2005 2 25.0% 4 50.0% 0 0.0% 0 0.0% 0 0.0% 2 25.0% 8 2006 0 0.0% 0 0.0% 1 100.0% 0 0.0% 0 0.0% 0 0.0% 1
2007 2 66.7% 1 33.3% 0 0.0% 0 0.0% 0 0.0% 0 0.0% 3 2008 1 100.0% 0 0.0% 0 0.0% 0 0.0% 0 0.0% 0 0.0% 1
2009 0 0.0% 0 0.0% 0 0.0% 1 100.0% 0 0.0% 0 0.0% 1 2010 0 0.0% 0 0.0% 1 100.0% 0 0.0% 0 0.0% 0 0.0% 1 2011 3 50.0% 1 16.7% 0 0.0% 2 33.3% 0 0.0% 0 0.0% 6
2012 1 100.0% 0 0.0% 0 0.0% 0 0.0% 0 0.0% 0 0.0% 1 2013 1 33.3% 0 0.0% 1 33.3% 1 33.3% 0 0.0% 0 0.0% 3 Total 11 40.7% 7 25.9% 3 11.1% 4 14.8% 0 0.0% 2 7.4% 27
Chignik Salmon 1994 2 28.6% 0 0.0% 0 0.0% 0 0.0% 5 71.4% 0 0.0% 7 Purse Seine 1995 9 47.4% 6 31.6% 1 5.3% 2 10.5% 0 0.0% 1 5.3% 19
1996 5 26.3% 8 42.1% 2 10.5% 3 15.8% 0 0.0% 1 5.3% 19 1997 4 33.3% 6 50.0% 0 0.0% 1 8.3% 0 0.0% 1 8.3% 12
1998 6 66.7% 3 33.3% 0 0.0% 0 0.0% 0 0.0% 0 0.0% 9 1999 4 44.4% 2 22.2% 1 11.1% 1 11.1% 1 11.1% 0 0.0% 9
2000 5 38.5% 4 30.8% 1 7.7% 3 23.1% 0 0.0% 0 0.0% 13 2001 5 45.5% 5 45.5% 0 0.0% 1 9.1% 0 0.0% 0 0.0% 11 2002 2 20.0% 8 80.0% 0 0.0% 0 0.0% 0 0.0% 0 0.0% 10
2003 1 10.0% 9 90.0% 0 0.0% 0 0.0% 0 0.0% 0 0.0% 10 2004 0 0.0% 6 75.0% 0 0.0% 1 12.5% 1 12.5% 0 0.0% 8 2005 1 8.3% 8 66.7% 0 0.0% 2 16.7% 1 8.3% 0 0.0% 12
2006 0 0.0% 5 83.3% 0 0.0% 1 16.7% 0 0.0% 0 0.0% 6 2007 1 14.3% 4 57.1% 1 14.3% 1 14.3% 0 0.0% 0 0.0% 7 2008 3 23.1% 7 53.8% 3 23.1% 0 0.0% 0 0.0% 0 0.0% 13
2009 5 31.3% 9 56.3% 1 6.3% 1 6.3% 0 0.0% 0 0.0% 16 2010 5 33.3% 7 46.7% 2 13.3% 1 6.7% 0 0.0% 0 0.0% 15 2011 3 21.4% 7 50.0% 1 7.1% 3 21.4% 0 0.0% 0 0.0% 14
2012 4 33.3% 5 41.7% 1 8.3% 2 16.7% 0 0.0% 0 0.0% 12 2013 5 55.6% 3 33.3% 1 11.1% 0 0.0% 0 0.0% 0 0.0% 9 Total 70 30.3% 112 48.5% 15 6.5% 23 10.0% 8 3.5% 3 1.3% 231
Alaska Peninsula 1994 2 66.7% 1 33.3% 0 0.0% 0 0.0% 0 0.0% 0 0.0% 3 Salmon Purse Seine 1995 1 33.3% 1 33.3% 0 0.0% 1 33.3% 0 0.0% 0 0.0% 3
1996 0 0.0% 4 66.7% 0 0.0% 0 0.0% 0 0.0% 2 33.3% 6 1997 1 20.0% 4 80.0% 0 0.0% 0 0.0% 0 0.0% 0 0.0% 5
1998 1 14.3% 5 71.4% 0 0.0% 1 14.3% 0 0.0% 0 0.0% 7 1999 1 12.5% 3 37.5% 1 12.5% 2 25.0% 0 0.0% 1 12.5% 8
2000 1 14.3% 2 28.6% 1 14.3% 3 42.9% 0 0.0% 0 0.0% 7 2001 2 28.6% 4 57.1% 0 0.0% 1 14.3% 0 0.0% 0 0.0% 7 2002 2 40.0% 2 40.0% 1 20.0% 0 0.0% 0 0.0% 0 0.0% 5
2003 0 0.0% 0 0.0% 1 100.0% 0 0.0% 0 0.0% 0 0.0% 1

Table 9. Relationship of Emergency Transferors to Transfer Recipients by, Permit Type
68 Emergency Transfers of Alaska’s Commercial Fisheries Limited Entry Permits, 1975 ‐ 2013
Permit Type Year Friend/Partner Immediate Family Other Relative None Other Unanswered Total Alaska Peninsula 2004 0 0.0% 4 100.0% 0 0.0% 0 0.0% 0 0.0% 0 0.0% 4 Salmon Purse Seine 2005 1 33.3% 1 33.3% 1 33.3% 0 0.0% 0 0.0% 0 0.0% 3 (cont.) 2006 0 0.0% 3 75.0% 0 0.0% 1 25.0% 0 0.0% 0 0.0% 4
2007 0 0.0% 0 0.0% 0 0.0% 1 100.0% 0 0.0% 0 0.0% 1 2008 3 42.9% 1 14.3% 1 14.3% 2 28.6% 0 0.0% 0 0.0% 7
2009 2 40.0% 1 20.0% 1 20.0% 0 0.0% 0 0.0% 1 20.0% 5 2010 3 42.9% 3 42.9% 0 0.0% 0 0.0% 0 0.0% 1 14.3% 7 2011 1 33.3% 1 33.3% 1 33.3% 0 0.0% 0 0.0% 0 0.0% 3
2012 0 0.0% 2 50.0% 1 25.0% 1 25.0% 0 0.0% 0 0.0% 4 2013 1 12.5% 5 62.5% 0 0.0% 1 12.5% 1 12.5% 0 0.0% 8 Total 22 22.4% 47 48.0% 9 9.2% 14 14.3% 1 1.0% 5 5.1% 98
Alaska Peninsula 1994 4 57.1% 3 42.9% 0 0.0% 0 0.0% 0 0.0% 0 0.0% 7 Salmon Drift Gillnet 1995 4 44.4% 1 11.1% 0 0.0% 1 11.1% 0 0.0% 3 33.3% 9
1996 4 23.5% 5 29.4% 0 0.0% 2 11.8% 0 0.0% 6 35.3% 17 1997 5 31.3% 6 37.5% 3 18.8% 0 0.0% 0 0.0% 2 12.5% 16
1998 8 40.0% 5 25.0% 1 5.0% 5 25.0% 0 0.0% 1 5.0% 20 1999 9 50.0% 4 22.2% 2 11.1% 1 5.6% 1 5.6% 1 5.6% 18
2000 5 55.6% 1 11.1% 0 0.0% 2 22.2% 0 0.0% 1 11.1% 9 2001 3 42.9% 3 42.9% 1 14.3% 0 0.0% 0 0.0% 0 0.0% 7 2002 4 57.1% 3 42.9% 0 0.0% 0 0.0% 0 0.0% 0 0.0% 7
2003 3 33.3% 2 22.2% 0 0.0% 3 33.3% 0 0.0% 1 11.1% 9 2004 5 41.7% 4 33.3% 1 8.3% 1 8.3% 0 0.0% 1 8.3% 12 2005 3 37.5% 3 37.5% 0 0.0% 2 25.0% 0 0.0% 0 0.0% 8
2006 1 12.5% 2 25.0% 0 0.0% 5 62.5% 0 0.0% 0 0.0% 8 2007 3 37.5% 2 25.0% 0 0.0% 2 25.0% 0 0.0% 1 12.5% 8 2008 3 23.1% 6 46.2% 1 7.7% 3 23.1% 0 0.0% 0 0.0% 13
2009 0 0.0% 3 30.0% 1 10.0% 6 60.0% 0 0.0% 0 0.0% 10 2010 3 42.9% 2 28.6% 0 0.0% 2 28.6% 0 0.0% 0 0.0% 7 2011 1 20.0% 2 40.0% 0 0.0% 2 40.0% 0 0.0% 0 0.0% 5
2012 2 22.2% 2 22.2% 0 0.0% 5 55.6% 0 0.0% 0 0.0% 9 2013 2 25.0% 3 37.5% 0 0.0% 2 25.0% 1 12.5% 0 0.0% 8 Total 72 34.8% 62 30.0% 10 4.8% 44 21.3% 2 1.0% 17 8.2% 207
Alaska Peninsula 1994 5 62.5% 3 37.5% 0 0.0% 0 0.0% 0 0.0% 0 0.0% 8 Salmon Set Gillnet 1995 7 53.8% 3 23.1% 0 0.0% 3 23.1% 0 0.0% 0 0.0% 13
1996 6 46.2% 1 7.7% 0 0.0% 2 15.4% 1 7.7% 3 23.1% 13 1997 5 50.0% 4 40.0% 0 0.0% 1 10.0% 0 0.0% 0 0.0% 10
1998 6 40.0% 8 53.3% 0 0.0% 1 6.7% 0 0.0% 0 0.0% 15 1999 5 38.5% 6 46.2% 0 0.0% 2 15.4% 0 0.0% 0 0.0% 13
2000 3 20.0% 8 53.3% 2 13.3% 1 6.7% 1 6.7% 0 0.0% 15 2001 4 33.3% 4 33.3% 0 0.0% 1 8.3% 3 25.0% 0 0.0% 12 2002 5 38.5% 6 46.2% 1 7.7% 1 7.7% 0 0.0% 0 0.0% 13
2003 6 37.5% 6 37.5% 2 12.5% 2 12.5% 0 0.0% 0 0.0% 16 2004 4 44.4% 4 44.4% 0 0.0% 0 0.0% 0 0.0% 1 11.1% 9 2005 5 45.5% 2 18.2% 0 0.0% 2 18.2% 1 9.1% 1 9.1% 11
2006 7 63.6% 3 27.3% 0 0.0% 1 9.1% 0 0.0% 0 0.0% 11 2007 3 30.0% 6 60.0% 1 10.0% 0 0.0% 0 0.0% 0 0.0% 10 2008 2 33.3% 3 50.0% 0 0.0% 1 16.7% 0 0.0% 0 0.0% 6
2009 2 33.3% 3 50.0% 1 16.7% 0 0.0% 0 0.0% 0 0.0% 6 2010 1 25.0% 1 25.0% 1 25.0% 1 25.0% 0 0.0% 0 0.0% 4 2011 1 20.0% 3 60.0% 1 20.0% 0 0.0% 0 0.0% 0 0.0% 5
2012 2 25.0% 4 50.0% 0 0.0% 2 25.0% 0 0.0% 0 0.0% 8 2013 6 60.0% 4 40.0% 0 0.0% 0 0.0% 0 0.0% 0 0.0% 10 Total 85 40.9% 82 39.4% 9 4.3% 21 10.1% 6 2.9% 5 2.4% 208
Bristol Bay Salmon 1994 33 24.1% 31 22.6% 6 4.4% 40 29.2% 26 19.0% 1 0.7% 137 Drift Gillnet 1995 67 28.9% 61 26.3% 6 2.6% 89 38.4% 1 0.4% 8 3.4% 232
1996 55 22.4% 68 27.6% 7 2.8% 102 41.5% 2 0.8% 12 4.9% 246 1997 51 21.1% 70 28.9% 16 6.6% 100 41.3% 3 1.2% 2 0.8% 242
1998 63 28.5% 58 26.2% 10 4.5% 82 37.1% 2 0.9% 6 2.7% 221 1999 56 25.2% 56 25.2% 10 4.5% 92 41.4% 7 3.2% 1 0.5% 222
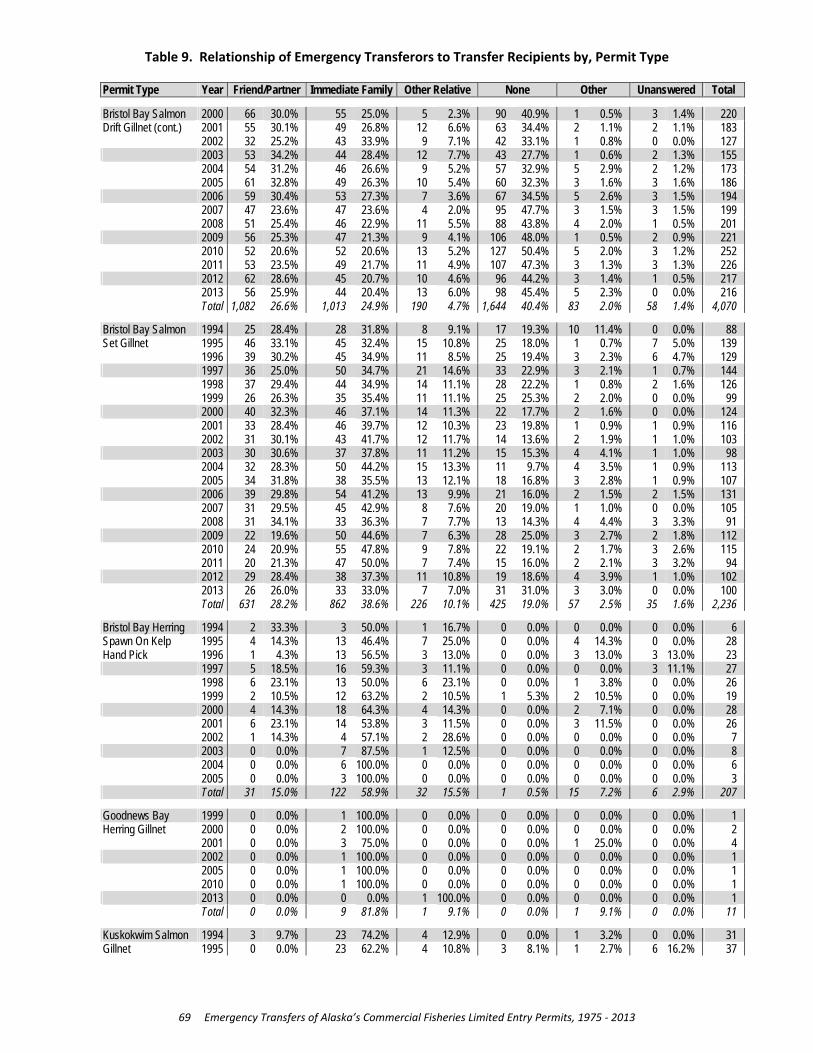
Table 9. Relationship of Emergency Transferors to Transfer Recipients by, Permit Type
69 Emergency Transfers of Alaska’s Commercial Fisheries Limited Entry Permits, 1975 ‐ 2013
Permit Type Year Friend/Partner Immediate Family Other Relative None Other Unanswered Total Bristol Bay Salmon 2000 66 30.0% 55 25.0% 5 2.3% 90 40.9% 1 0.5% 3 1.4% 220 Drift Gillnet (cont.) 2001 55 30.1% 49 26.8% 12 6.6% 63 34.4% 2 1.1% 2 1.1% 183
2002 32 25.2% 43 33.9% 9 7.1% 42 33.1% 1 0.8% 0 0.0% 127 2003 53 34.2% 44 28.4% 12 7.7% 43 27.7% 1 0.6% 2 1.3% 155
2004 54 31.2% 46 26.6% 9 5.2% 57 32.9% 5 2.9% 2 1.2% 173 2005 61 32.8% 49 26.3% 10 5.4% 60 32.3% 3 1.6% 3 1.6% 186
2006 59 30.4% 53 27.3% 7 3.6% 67 34.5% 5 2.6% 3 1.5% 194 2007 47 23.6% 47 23.6% 4 2.0% 95 47.7% 3 1.5% 3 1.5% 199 2008 51 25.4% 46 22.9% 11 5.5% 88 43.8% 4 2.0% 1 0.5% 201
2009 56 25.3% 47 21.3% 9 4.1% 106 48.0% 1 0.5% 2 0.9% 221 2010 52 20.6% 52 20.6% 13 5.2% 127 50.4% 5 2.0% 3 1.2% 252 2011 53 23.5% 49 21.7% 11 4.9% 107 47.3% 3 1.3% 3 1.3% 226
2012 62 28.6% 45 20.7% 10 4.6% 96 44.2% 3 1.4% 1 0.5% 217 2013 56 25.9% 44 20.4% 13 6.0% 98 45.4% 5 2.3% 0 0.0% 216 Total 1,082 26.6% 1,013 24.9% 190 4.7% 1,644 40.4% 83 2.0% 58 1.4% 4,070
Bristol Bay Salmon 1994 25 28.4% 28 31.8% 8 9.1% 17 19.3% 10 11.4% 0 0.0% 88 Set Gillnet 1995 46 33.1% 45 32.4% 15 10.8% 25 18.0% 1 0.7% 7 5.0% 139
1996 39 30.2% 45 34.9% 11 8.5% 25 19.4% 3 2.3% 6 4.7% 129 1997 36 25.0% 50 34.7% 21 14.6% 33 22.9% 3 2.1% 1 0.7% 144
1998 37 29.4% 44 34.9% 14 11.1% 28 22.2% 1 0.8% 2 1.6% 126 1999 26 26.3% 35 35.4% 11 11.1% 25 25.3% 2 2.0% 0 0.0% 99
2000 40 32.3% 46 37.1% 14 11.3% 22 17.7% 2 1.6% 0 0.0% 124 2001 33 28.4% 46 39.7% 12 10.3% 23 19.8% 1 0.9% 1 0.9% 116 2002 31 30.1% 43 41.7% 12 11.7% 14 13.6% 2 1.9% 1 1.0% 103
2003 30 30.6% 37 37.8% 11 11.2% 15 15.3% 4 4.1% 1 1.0% 98 2004 32 28.3% 50 44.2% 15 13.3% 11 9.7% 4 3.5% 1 0.9% 113 2005 34 31.8% 38 35.5% 13 12.1% 18 16.8% 3 2.8% 1 0.9% 107
2006 39 29.8% 54 41.2% 13 9.9% 21 16.0% 2 1.5% 2 1.5% 131 2007 31 29.5% 45 42.9% 8 7.6% 20 19.0% 1 1.0% 0 0.0% 105 2008 31 34.1% 33 36.3% 7 7.7% 13 14.3% 4 4.4% 3 3.3% 91
2009 22 19.6% 50 44.6% 7 6.3% 28 25.0% 3 2.7% 2 1.8% 112 2010 24 20.9% 55 47.8% 9 7.8% 22 19.1% 2 1.7% 3 2.6% 115 2011 20 21.3% 47 50.0% 7 7.4% 15 16.0% 2 2.1% 3 3.2% 94
2012 29 28.4% 38 37.3% 11 10.8% 19 18.6% 4 3.9% 1 1.0% 102 2013 26 26.0% 33 33.0% 7 7.0% 31 31.0% 3 3.0% 0 0.0% 100 Total 631 28.2% 862 38.6% 226 10.1% 425 19.0% 57 2.5% 35 1.6% 2,236
Bristol Bay Herring 1994 2 33.3% 3 50.0% 1 16.7% 0 0.0% 0 0.0% 0 0.0% 6 Spawn On Kelp 1995 4 14.3% 13 46.4% 7 25.0% 0 0.0% 4 14.3% 0 0.0% 28 Hand Pick 1996 1 4.3% 13 56.5% 3 13.0% 0 0.0% 3 13.0% 3 13.0% 23 1997 5 18.5% 16 59.3% 3 11.1% 0 0.0% 0 0.0% 3 11.1% 27
1998 6 23.1% 13 50.0% 6 23.1% 0 0.0% 1 3.8% 0 0.0% 26 1999 2 10.5% 12 63.2% 2 10.5% 1 5.3% 2 10.5% 0 0.0% 19
2000 4 14.3% 18 64.3% 4 14.3% 0 0.0% 2 7.1% 0 0.0% 28 2001 6 23.1% 14 53.8% 3 11.5% 0 0.0% 3 11.5% 0 0.0% 26 2002 1 14.3% 4 57.1% 2 28.6% 0 0.0% 0 0.0% 0 0.0% 7
2003 0 0.0% 7 87.5% 1 12.5% 0 0.0% 0 0.0% 0 0.0% 8 2004 0 0.0% 6 100.0% 0 0.0% 0 0.0% 0 0.0% 0 0.0% 6 2005 0 0.0% 3 100.0% 0 0.0% 0 0.0% 0 0.0% 0 0.0% 3
Total 31 15.0% 122 58.9% 32 15.5% 1 0.5% 15 7.2% 6 2.9% 207
Goodnews Bay 1999 0 0.0% 1 100.0% 0 0.0% 0 0.0% 0 0.0% 0 0.0% 1 Herring Gillnet 2000 0 0.0% 2 100.0% 0 0.0% 0 0.0% 0 0.0% 0 0.0% 2
2001 0 0.0% 3 75.0% 0 0.0% 0 0.0% 1 25.0% 0 0.0% 4 2002 0 0.0% 1 100.0% 0 0.0% 0 0.0% 0 0.0% 0 0.0% 1
2005 0 0.0% 1 100.0% 0 0.0% 0 0.0% 0 0.0% 0 0.0% 1 2010 0 0.0% 1 100.0% 0 0.0% 0 0.0% 0 0.0% 0 0.0% 1
2013 0 0.0% 0 0.0% 1 100.0% 0 0.0% 0 0.0% 0 0.0% 1 Total 0 0.0% 9 81.8% 1 9.1% 0 0.0% 1 9.1% 0 0.0% 11
Kuskokwim Salmon 1994 3 9.7% 23 74.2% 4 12.9% 0 0.0% 1 3.2% 0 0.0% 31 Gillnet 1995 0 0.0% 23 62.2% 4 10.8% 3 8.1% 1 2.7% 6 16.2% 37

Table 9. Relationship of Emergency Transferors to Transfer Recipients by, Permit Type
70 Emergency Transfers of Alaska’s Commercial Fisheries Limited Entry Permits, 1975 ‐ 2013
Permit Type Year Friend/Partner Immediate Family Other Relative None Other Unanswered Total Kuskokwim Salmon 1996 3 12.0% 17 68.0% 0 0.0% 0 0.0% 0 0.0% 5 20.0% 25 Gillnet (cont.) 1997 1 4.8% 15 71.4% 3 14.3% 1 4.8% 0 0.0% 1 4.8% 21
1998 1 4.3% 20 87.0% 1 4.3% 0 0.0% 1 4.3% 0 0.0% 23 1999 0 0.0% 20 90.9% 1 4.5% 0 0.0% 1 4.5% 0 0.0% 22
2000 0 0.0% 20 76.9% 6 23.1% 0 0.0% 0 0.0% 0 0.0% 26 2001 1 5.3% 17 89.5% 0 0.0% 0 0.0% 1 5.3% 0 0.0% 19 2002 1 4.8% 17 81.0% 2 9.5% 0 0.0% 1 4.8% 0 0.0% 21
2003 1 9.1% 7 63.6% 2 18.2% 0 0.0% 1 9.1% 0 0.0% 11 2004 1 4.8% 18 85.7% 0 0.0% 2 9.5% 0 0.0% 0 0.0% 21 2005 1 5.6% 14 77.8% 0 0.0% 1 5.6% 0 0.0% 2 11.1% 18
2006 1 5.6% 12 66.7% 3 16.7% 0 0.0% 1 5.6% 1 5.6% 18 2007 0 0.0% 13 100.0% 0 0.0% 0 0.0% 0 0.0% 0 0.0% 13 2008 1 6.7% 14 93.3% 0 0.0% 0 0.0% 0 0.0% 0 0.0% 15
2009 2 7.1% 23 82.1% 1 3.6% 1 3.6% 0 0.0% 1 3.6% 28 2010 1 2.9% 30 88.2% 2 5.9% 0 0.0% 1 2.9% 0 0.0% 34 2011 0 0.0% 20 80.0% 2 8.0% 2 8.0% 1 4.0% 0 0.0% 25
2012 0 0.0% 17 77.3% 4 18.2% 1 4.5% 0 0.0% 0 0.0% 22 2013 1 3.8% 24 92.3% 1 3.8% 0 0.0% 0 0.0% 0 0.0% 26 Total 19 4.2% 364 79.8% 36 7.9% 11 2.4% 10 2.2% 16 3.5% 456
Nelson Island 1995 0 0.0% 5 100.0% 0 0.0% 0 0.0% 0 0.0% 0 0.0% 5 Herring Gillnet 1996 0 0.0% 5 100.0% 0 0.0% 0 0.0% 0 0.0% 0 0.0% 5
1997 1 20.0% 4 80.0% 0 0.0% 0 0.0% 0 0.0% 0 0.0% 5 1998 0 0.0% 4 100.0% 0 0.0% 0 0.0% 0 0.0% 0 0.0% 4
1999 1 20.0% 4 80.0% 0 0.0% 0 0.0% 0 0.0% 0 0.0% 5 2000 0 0.0% 1 50.0% 0 0.0% 0 0.0% 1 50.0% 0 0.0% 2
2001 0 0.0% 4 100.0% 0 0.0% 0 0.0% 0 0.0% 0 0.0% 4 2002 1 50.0% 0 0.0% 1 50.0% 0 0.0% 0 0.0% 0 0.0% 2 2003 0 0.0% 1 100.0% 0 0.0% 0 0.0% 0 0.0% 0 0.0% 1
2004 0 0.0% 1 100.0% 0 0.0% 0 0.0% 0 0.0% 0 0.0% 1 2005 0 0.0% 0 0.0% 1 100.0% 0 0.0% 0 0.0% 0 0.0% 1 2013 0 0.0% 0 0.0% 1 100.0% 0 0.0% 0 0.0% 0 0.0% 1
Total 3 8.3% 29 80.6% 3 8.3% 0 0.0% 1 2.8% 0 0.0% 36
Nunivak Island 1996 0 0.0% 1 100.0% 0 0.0% 0 0.0% 0 0.0% 0 0.0% 1 Herring Gillnet 2000 0 0.0% 1 100.0% 0 0.0% 0 0.0% 0 0.0% 0 0.0% 1
2003 0 0.0% 1 100.0% 0 0.0% 0 0.0% 0 0.0% 0 0.0% 1 Total 0 0.0% 3 100.0% 0 0.0% 0 0.0% 0 0.0% 0 0.0% 3
Lower Yukon 1994 3 18.8% 9 56.3% 0 0.0% 0 0.0% 4 25.0% 0 0.0% 16 Salmon Gillnet 1995 7 18.4% 24 63.2% 0 0.0% 4 10.5% 1 2.6% 2 5.3% 38
1996 1 3.3% 25 83.3% 1 3.3% 0 0.0% 0 0.0% 3 10.0% 30 1997 7 19.4% 21 58.3% 3 8.3% 3 8.3% 0 0.0% 2 5.6% 36
1998 5 11.1% 34 75.6% 3 6.7% 3 6.7% 0 0.0% 0 0.0% 45 1999 3 6.8% 33 75.0% 6 13.6% 1 2.3% 0 0.0% 1 2.3% 44
2000 2 6.7% 25 83.3% 1 3.3% 1 3.3% 1 3.3% 0 0.0% 30 2001 1 25.0% 3 75.0% 0 0.0% 0 0.0% 0 0.0% 0 0.0% 4 2002 1 4.8% 18 85.7% 1 4.8% 1 4.8% 0 0.0% 0 0.0% 21
2003 1 3.7% 22 81.5% 3 11.1% 1 3.7% 0 0.0% 0 0.0% 27 2004 1 3.6% 25 89.3% 2 7.1% 0 0.0% 0 0.0% 0 0.0% 28 2005 2 4.2% 39 81.3% 1 2.1% 2 4.2% 1 2.1% 3 6.3% 48
2006 2 3.8% 41 78.8% 4 7.7% 0 0.0% 3 5.8% 2 3.8% 52 2007 1 2.3% 36 81.8% 2 4.5% 2 4.5% 0 0.0% 3 6.8% 44 2008 3 9.1% 28 84.8% 1 3.0% 1 3.0% 0 0.0% 0 0.0% 33
2009 2 5.9% 31 91.2% 0 0.0% 0 0.0% 0 0.0% 1 2.9% 34 2010 2 6.1% 30 90.9% 1 3.0% 0 0.0% 0 0.0% 0 0.0% 33 2011 2 8.3% 21 87.5% 1 4.2% 0 0.0% 0 0.0% 0 0.0% 24
2012 2 7.4% 21 77.8% 2 7.4% 2 7.4% 0 0.0% 0 0.0% 27 2013 0 0.0% 13 76.5% 0 0.0% 3 17.6% 1 5.9% 0 0.0% 17 Total 48 7.6% 499 79.1% 32 5.1% 24 3.8% 11 1.7% 17 2.7% 631
Cape Romanzof 1994 0 0.0% 1 100.0% 0 0.0% 0 0.0% 0 0.0% 0 0.0% 1 Herring Gillnet 1995 0 0.0% 2 66.7% 0 0.0% 0 0.0% 1 33.3% 0 0.0% 3
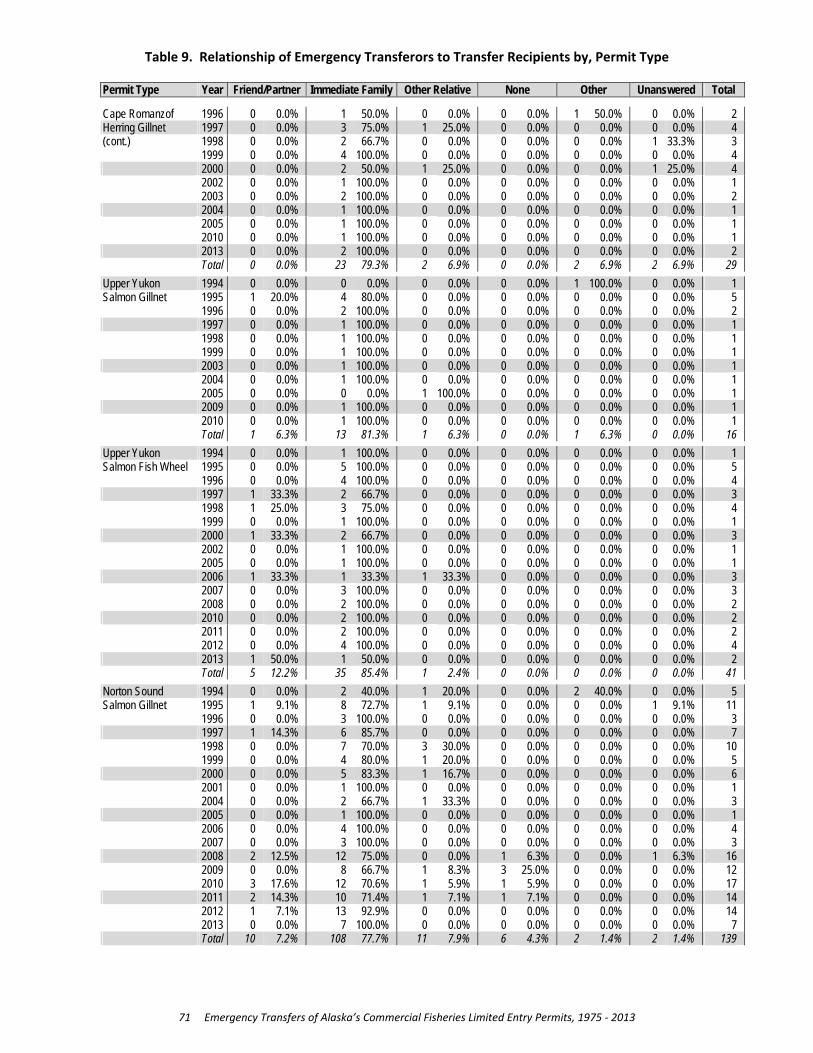
Table 9. Relationship of Emergency Transferors to Transfer Recipients by, Permit Type
71 Emergency Transfers of Alaska’s Commercial Fisheries Limited Entry Permits, 1975 ‐ 2013
Permit Type Year Friend/Partner Immediate Family Other Relative None Other Unanswered Total Cape Romanzof 1996 0 0.0% 1 50.0% 0 0.0% 0 0.0% 1 50.0% 0 0.0% 2 Herring Gillnet 1997 0 0.0% 3 75.0% 1 25.0% 0 0.0% 0 0.0% 0 0.0% 4 (cont.) 1998 0 0.0% 2 66.7% 0 0.0% 0 0.0% 0 0.0% 1 33.3% 3
1999 0 0.0% 4 100.0% 0 0.0% 0 0.0% 0 0.0% 0 0.0% 4 2000 0 0.0% 2 50.0% 1 25.0% 0 0.0% 0 0.0% 1 25.0% 4
2002 0 0.0% 1 100.0% 0 0.0% 0 0.0% 0 0.0% 0 0.0% 1 2003 0 0.0% 2 100.0% 0 0.0% 0 0.0% 0 0.0% 0 0.0% 2
2004 0 0.0% 1 100.0% 0 0.0% 0 0.0% 0 0.0% 0 0.0% 1 2005 0 0.0% 1 100.0% 0 0.0% 0 0.0% 0 0.0% 0 0.0% 1 2010 0 0.0% 1 100.0% 0 0.0% 0 0.0% 0 0.0% 0 0.0% 1
2013 0 0.0% 2 100.0% 0 0.0% 0 0.0% 0 0.0% 0 0.0% 2 Total 0 0.0% 23 79.3% 2 6.9% 0 0.0% 2 6.9% 2 6.9% 29
Upper Yukon 1994 0 0.0% 0 0.0% 0 0.0% 0 0.0% 1 100.0% 0 0.0% 1 Salmon Gillnet 1995 1 20.0% 4 80.0% 0 0.0% 0 0.0% 0 0.0% 0 0.0% 5
1996 0 0.0% 2 100.0% 0 0.0% 0 0.0% 0 0.0% 0 0.0% 2 1997 0 0.0% 1 100.0% 0 0.0% 0 0.0% 0 0.0% 0 0.0% 1
1998 0 0.0% 1 100.0% 0 0.0% 0 0.0% 0 0.0% 0 0.0% 1 1999 0 0.0% 1 100.0% 0 0.0% 0 0.0% 0 0.0% 0 0.0% 1
2003 0 0.0% 1 100.0% 0 0.0% 0 0.0% 0 0.0% 0 0.0% 1 2004 0 0.0% 1 100.0% 0 0.0% 0 0.0% 0 0.0% 0 0.0% 1 2005 0 0.0% 0 0.0% 1 100.0% 0 0.0% 0 0.0% 0 0.0% 1
2009 0 0.0% 1 100.0% 0 0.0% 0 0.0% 0 0.0% 0 0.0% 1 2010 0 0.0% 1 100.0% 0 0.0% 0 0.0% 0 0.0% 0 0.0% 1 Total 1 6.3% 13 81.3% 1 6.3% 0 0.0% 1 6.3% 0 0.0% 16
Upper Yukon 1994 0 0.0% 1 100.0% 0 0.0% 0 0.0% 0 0.0% 0 0.0% 1 Salmon Fish Wheel 1995 0 0.0% 5 100.0% 0 0.0% 0 0.0% 0 0.0% 0 0.0% 5
1996 0 0.0% 4 100.0% 0 0.0% 0 0.0% 0 0.0% 0 0.0% 4 1997 1 33.3% 2 66.7% 0 0.0% 0 0.0% 0 0.0% 0 0.0% 3
1998 1 25.0% 3 75.0% 0 0.0% 0 0.0% 0 0.0% 0 0.0% 4 1999 0 0.0% 1 100.0% 0 0.0% 0 0.0% 0 0.0% 0 0.0% 1
2000 1 33.3% 2 66.7% 0 0.0% 0 0.0% 0 0.0% 0 0.0% 3 2002 0 0.0% 1 100.0% 0 0.0% 0 0.0% 0 0.0% 0 0.0% 1 2005 0 0.0% 1 100.0% 0 0.0% 0 0.0% 0 0.0% 0 0.0% 1
2006 1 33.3% 1 33.3% 1 33.3% 0 0.0% 0 0.0% 0 0.0% 3 2007 0 0.0% 3 100.0% 0 0.0% 0 0.0% 0 0.0% 0 0.0% 3 2008 0 0.0% 2 100.0% 0 0.0% 0 0.0% 0 0.0% 0 0.0% 2
2010 0 0.0% 2 100.0% 0 0.0% 0 0.0% 0 0.0% 0 0.0% 2 2011 0 0.0% 2 100.0% 0 0.0% 0 0.0% 0 0.0% 0 0.0% 2 2012 0 0.0% 4 100.0% 0 0.0% 0 0.0% 0 0.0% 0 0.0% 4
2013 1 50.0% 1 50.0% 0 0.0% 0 0.0% 0 0.0% 0 0.0% 2 Total 5 12.2% 35 85.4% 1 2.4% 0 0.0% 0 0.0% 0 0.0% 41
Norton Sound 1994 0 0.0% 2 40.0% 1 20.0% 0 0.0% 2 40.0% 0 0.0% 5 Salmon Gillnet 1995 1 9.1% 8 72.7% 1 9.1% 0 0.0% 0 0.0% 1 9.1% 11
1996 0 0.0% 3 100.0% 0 0.0% 0 0.0% 0 0.0% 0 0.0% 3 1997 1 14.3% 6 85.7% 0 0.0% 0 0.0% 0 0.0% 0 0.0% 7
1998 0 0.0% 7 70.0% 3 30.0% 0 0.0% 0 0.0% 0 0.0% 10 1999 0 0.0% 4 80.0% 1 20.0% 0 0.0% 0 0.0% 0 0.0% 5
2000 0 0.0% 5 83.3% 1 16.7% 0 0.0% 0 0.0% 0 0.0% 6 2001 0 0.0% 1 100.0% 0 0.0% 0 0.0% 0 0.0% 0 0.0% 1 2004 0 0.0% 2 66.7% 1 33.3% 0 0.0% 0 0.0% 0 0.0% 3
2005 0 0.0% 1 100.0% 0 0.0% 0 0.0% 0 0.0% 0 0.0% 1 2006 0 0.0% 4 100.0% 0 0.0% 0 0.0% 0 0.0% 0 0.0% 4 2007 0 0.0% 3 100.0% 0 0.0% 0 0.0% 0 0.0% 0 0.0% 3
2008 2 12.5% 12 75.0% 0 0.0% 1 6.3% 0 0.0% 1 6.3% 16 2009 0 0.0% 8 66.7% 1 8.3% 3 25.0% 0 0.0% 0 0.0% 12 2010 3 17.6% 12 70.6% 1 5.9% 1 5.9% 0 0.0% 0 0.0% 17
2011 2 14.3% 10 71.4% 1 7.1% 1 7.1% 0 0.0% 0 0.0% 14 2012 1 7.1% 13 92.9% 0 0.0% 0 0.0% 0 0.0% 0 0.0% 14 2013 0 0.0% 7 100.0% 0 0.0% 0 0.0% 0 0.0% 0 0.0% 7
Total 10 7.2% 108 77.7% 11 7.9% 6 4.3% 2 1.4% 2 1.4% 139

Table 9. Relationship of Emergency Transferors to Transfer Recipients by, Permit Type
72 Emergency Transfers of Alaska’s Commercial Fisheries Limited Entry Permits, 1975 ‐ 2013
Permit Type Year Friend/Partner Immediate Family Other Relative None Other Unanswered Total Norton Sound 1995 2 100.0% 0 0.0% 0 0.0% 0 0.0% 0 0.0% 0 0.0% 2 Herring Beach Seine 1996 1 100.0% 0 0.0% 0 0.0% 0 0.0% 0 0.0% 0 0.0% 1
1997 0 0.0% 1 50.0% 0 0.0% 1 50.0% 0 0.0% 0 0.0% 2 1998 0 0.0% 1 50.0% 0 0.0% 1 50.0% 0 0.0% 0 0.0% 2
1999 1 50.0% 1 50.0% 0 0.0% 0 0.0% 0 0.0% 0 0.0% 2 2000 1 50.0% 1 50.0% 0 0.0% 0 0.0% 0 0.0% 0 0.0% 2
2001 0 0.0% 1 100.0% 0 0.0% 0 0.0% 0 0.0% 0 0.0% 1 Total 5 41.7% 5 41.7% 0 0.0% 2 16.7% 0 0.0% 0 0.0% 12
Norton Sound 1994 2 25.0% 4 50.0% 0 0.0% 1 12.5% 1 12.5% 0 0.0% 8 Herring Gillnet 1995 4 28.6% 4 28.6% 0 0.0% 4 28.6% 2 14.3% 0 0.0% 14
1996 4 21.1% 5 26.3% 0 0.0% 7 36.8% 1 5.3% 2 10.5% 19 1997 4 30.8% 4 30.8% 1 7.7% 4 30.8% 0 0.0% 0 0.0% 13
1998 2 66.7% 1 33.3% 0 0.0% 0 0.0% 0 0.0% 0 0.0% 3 1999 4 21.1% 9 47.4% 1 5.3% 4 21.1% 0 0.0% 1 5.3% 19
2000 1 20.0% 3 60.0% 1 20.0% 0 0.0% 0 0.0% 0 0.0% 5 2001 0 0.0% 7 100.0% 0 0.0% 0 0.0% 0 0.0% 0 0.0% 7 2002 1 20.0% 4 80.0% 0 0.0% 0 0.0% 0 0.0% 0 0.0% 5
2003 0 0.0% 4 80.0% 0 0.0% 0 0.0% 1 20.0% 0 0.0% 5 2005 0 0.0% 3 100.0% 0 0.0% 0 0.0% 0 0.0% 0 0.0% 3 2006 0 0.0% 3 100.0% 0 0.0% 0 0.0% 0 0.0% 0 0.0% 3
2008 0 0.0% 2 100.0% 0 0.0% 0 0.0% 0 0.0% 0 0.0% 2 2009 0 0.0% 1 100.0% 0 0.0% 0 0.0% 0 0.0% 0 0.0% 1 2010 0 0.0% 5 83.3% 0 0.0% 0 0.0% 0 0.0% 1 16.7% 6
2011 0 0.0% 6 100.0% 0 0.0% 0 0.0% 0 0.0% 0 0.0% 6 2012 0 0.0% 1 100.0% 0 0.0% 0 0.0% 0 0.0% 0 0.0% 1 2013 1 33.3% 2 66.7% 0 0.0% 0 0.0% 0 0.0% 0 0.0% 3
Total 23 18.7% 68 55.3% 3 2.4% 20 16.3% 5 4.1% 4 3.3% 123
Kotzebue Salmon 1994 0 0.0% 3 100.0% 0 0.0% 0 0.0% 0 0.0% 0 0.0% 3 Gillnet 1995 0 0.0% 1 33.3% 0 0.0% 1 33.3% 1 33.3% 0 0.0% 3
1996 0 0.0% 1 100.0% 0 0.0% 0 0.0% 0 0.0% 0 0.0% 1 1997 0 0.0% 1 100.0% 0 0.0% 0 0.0% 0 0.0% 0 0.0% 1
1998 0 0.0% 2 100.0% 0 0.0% 0 0.0% 0 0.0% 0 0.0% 2 1999 0 0.0% 1 100.0% 0 0.0% 0 0.0% 0 0.0% 0 0.0% 1
2000 0 0.0% 3 100.0% 0 0.0% 0 0.0% 0 0.0% 0 0.0% 3 2001 0 0.0% 3 100.0% 0 0.0% 0 0.0% 0 0.0% 0 0.0% 3 2002 0 0.0% 1 100.0% 0 0.0% 0 0.0% 0 0.0% 0 0.0% 1
2004 0 0.0% 3 100.0% 0 0.0% 0 0.0% 0 0.0% 0 0.0% 3 2005 0 0.0% 1 100.0% 0 0.0% 0 0.0% 0 0.0% 0 0.0% 1 2006 0 0.0% 3 100.0% 0 0.0% 0 0.0% 0 0.0% 0 0.0% 3
2007 0 0.0% 3 75.0% 1 25.0% 0 0.0% 0 0.0% 0 0.0% 4 2008 0 0.0% 3 100.0% 0 0.0% 0 0.0% 0 0.0% 0 0.0% 3 2009 2 33.3% 2 33.3% 1 16.7% 1 16.7% 0 0.0% 0 0.0% 6
2010 0 0.0% 6 75.0% 1 12.5% 1 12.5% 0 0.0% 0 0.0% 8 2011 1 6.7% 10 66.7% 2 13.3% 2 13.3% 0 0.0% 0 0.0% 15 2012 2 25.0% 5 62.5% 1 12.5% 0 0.0% 0 0.0% 0 0.0% 8
2013 0 0.0% 8 88.9% 0 0.0% 1 11.1% 0 0.0% 0 0.0% 9 Total 5 6.4% 60 76.9% 6 7.7% 6 7.7% 1 1.3% 0 0.0% 78
Notes: 1) Permit fisheries and years with no emergency transfers are excluded from the table. 2) Figures in this table reflect data collected from the survey portion of the CFEC emergency transfer form. The survey was first implemented in 1994. During the transition, 431 emergency transfers were processed without surveys, which accounts for differences in the totals between this table and other tables in this report. 3) If the first year in a permit fishery series is after 1994, the year corresponds to when limited entry was implemented and permits were first eligible for emer- gency transfer. 4) The Southeast Alaska Dungeness crab (1992-1996) and the sea urchin, sea cucumber, and geoduck dive fisheries (1996-2000) were subject to moratoria on new entrants prior to implementation of limited entry. Moratorium interim-use permits are eligible for emergency transfer.

73 Emergency Transfers of Alaska’s Commercial Fisheries Limited Entry Permits, 1975 ‐ 2013
30.0
35.0
40.0
45.0
50.0
55.0 Transferor Recipient
54.5
36.7
Ages of Permit Holders in Emergency Transfers
Table 10: Ages of Emergency Transferors and Transfer Recipients by Permit Type
Table 10 uses data from CFEC permit files to examine the ages of persons involved in emergency trans‐fers. Statistics are shown for both the transferor (permanent permit holder or IUP holder) and for the transfer recipient (temporary holder of the permit in an emergency transfer).
The data indicates that persons who receive permits via emergency transfer tend to be considerably younger than the persons who transfer the permits. Averaged over all years and all fisheries, the differ‐ence is 16.4 years (Table 10; All Permit Fisheries). The average age of emergency transferors has gradu‐ally increased over time, as indicated in Figure 1, and currently stands at 54.5 years. This increase in age follows a general pattern observed throughout the state: the average age for all limited entry permit holders has steadily increased since 1980, and now stands at 49.7 years.19
Permit types that show a significant variance from the overall average (and which also have a moderate‐ly high number of emergency transfers) include permits for the Southeast Alaska sablefish and salmon purse seine fisheries, and the combination king crab pot fisheries. For each of these permit types, the average age of persons who emergency transferred their permits is relatively high (over 60 years in age). This contrasts with fisheries where the permit transferors tend to be younger, such as the Southeast sea cucumber dive fishery, the Kodiak salmon set gillnet, and Kuskokwim salmon gillnet fisheries (under 46 years of age). Note that individual permit holders’ birthdates are confidential. If fewer than four emergency transfers occurred in a fishery, the average age is redacted and marked with an asterisk in Table 10.
19 CFEC Report 14‐2N‐Exec; Changes in the Distribution of Alaska’s Limited Entry Permits, 1975 ‐ 2013
Figure 1. Average Age of Emergency Transferors and Transfer Recipients

Table 10. Ages of Emergency Transferors (from) and Transfer Recipients (to) by Permit Type
74 Emergency Transfers of Alaska’s Commercial Fisheries Limited Entry Permits, 1975 ‐ 2013
Table 10. Ages of Emergency Transferors (From) and Transfer Recipients (To) by Permit Type
Number of: Mean Emerg. Ages Differ- Permit Type Year Permits Transfers From To ence All Permit Fisheries 1994 14,230 930 49.5 34.8 14.8 With Emergency 1995 14,489 902 50.6 34.8 15.8 Transfers 1996 15,512 865 50.1 35.4 14.7 1997 15,561 914 50.8 34.9 15.9 1998 15,610 898 51.3 35.9 15.4 1999 15,373 879 52.4 36.0 16.4 2000 15,238 879 51.6 36.8 14.7 2001 15,215 804 51.2 36.2 15.0
2002 15,100 686 53.1 36.4 16.7 2003 15,031 698 52.3 36.6 15.8
2004 14,766 723 53.1 36.8 16.2 2005 14,727 793 53.2 36.6 16.7
2006 14,660 767 52.5 36.1 16.4 2007 14,548 737 53.3 36.2 17.1 2008 14,430 761 54.2 35.4 18.8
2009 14,414 833 54.1 36.0 18.2 2010 14,391 887 54.1 36.3 17.8 2011 14,346 888 53.9 37.4 16.6
2012 14,204 839 54.2 36.8 17.3 2013 14,162 791 54.5 36.7 17.8 Total 16,474 52.4 36.1 16.4
Salmon Power Troll 1994 954 25 60.9 39.2 21.8 1995 954 27 59.1 41.9 17.2 1996 965 15 56.7 39.0 17.7
1997 967 21 55.1 36.1 19.0 1998 967 24 55.4 36.7 18.8 1999 965 29 56.9 36.9 20.0
2000 963 26 54.9 42.7 12.1 2001 965 28 55.5 43.6 11.9 2002 965 26 60.6 40.7 19.9
2003 965 25 55.3 40.6 14.7 2004 961 28 57.0 42.1 14.9 2005 961 32 55.1 41.2 13.9
2006 961 25 57.6 41.4 16.3 2007 961 28 57.5 38.4 19.2 2008 961 25 56.8 41.5 15.4
2009 961 22 56.0 39.9 16.1 2010 962 29 57.0 39.1 17.9 2011 962 54 60.5 44.0 16.6
2012 961 34 61.3 43.2 18.1 2013 961 32 56.2 43.9 12.3 Total 555 57.5 40.9 16.6
Salmon Hand Troll 1994 1,579 16 53.1 39.4 13.7 1995 1,540 17 52.6 39.8 12.8 1996 1,501 13 42.9 39.1 3.9
1997 1,459 10 54.8 39.8 14.9 1998 1,409 8 58.3 43.0 15.3 1999 1,370 18 54.9 35.3 19.6
2000 1,329 13 49.2 43.2 6.0 2001 1,295 12 47.7 31.8 15.9 2002 1,247 14 50.6 46.7 4.0
2003 1,189 24 49.7 43.7 6.0 2004 1,139 23 59.2 41.1 18.1 2005 1,108 23 51.3 43.5 7.7
2006 1,104 28 52.2 44.1 8.2 2007 1,083 20 53.3 40.7 12.5 2008 1,065 26 53.6 38.9 14.7 2009 1,055 24 55.4 41.3 14.1 2010 1,044 20 58.0 38.1 19.8 2011 1,037 35 51.9 39.4 12.5 2012 1,019 25 53.7 38.3 15.3
2013 1,002 22 56.4 42.1 14.3 Total 391 53.1 40.6 12.5
Number of: Mean Emerg. Ages Differ- Permit Type Year Permits Transfers From To ence Southeast Salmon 1994 418 26 57.6 36.3 21.3 Purse Seine 1995 418 23 60.1 39.6 20.6
1996 417 22 53.3 38.0 15.3 1997 416 20 56.2 39.6 16.7
1998 416 31 58.6 38.7 19.9 1999 416 20 63.4 38.9 24.5
2000 416 26 56.4 42.0 14.4 2001 415 29 54.8 41.5 13.3 2002 415 14 64.8 41.8 23.0
2003 416 11 58.3 39.1 19.2 2004 414 10 61.6 40.0 21.6 2005 415 19 62.1 40.6 21.5
2006 414 12 64.6 50.8 13.8 2007 415 11 56.4 39.8 16.6 2008 380 16 58.0 38.5 19.5
2009 379 20 62.9 40.7 22.2 2010 379 17 60.8 39.2 21.6 2011 379 26 59.2 40.4 18.7
2012 315 26 59.1 39.7 19.3 2013 315 23 64.3 45.7 18.5 Total 402 59.3 40.3 18.9
Southeast Salmon 1994 482 33 54.3 38.0 16.2 Drift Gillnet 1995 483 22 57.5 34.5 23.0
1996 483 30 55.8 33.8 22.0 1997 482 27 59.4 32.3 27.1
1998 479 26 57.6 38.2 19.4 1999 481 35 53.5 37.4 16.0
2000 480 32 50.6 37.5 13.1 2001 482 34 61.9 37.2 24.7 2002 482 25 64.3 41.6 22.7
2003 477 16 63.3 35.2 28.1 2004 478 17 59.0 39.8 19.2 2005 478 24 59.2 40.9 18.3
2006 477 20 57.0 42.9 14.1 2007 476 24 57.6 38.4 19.2 2008 475 26 59.5 36.3 23.2
2009 474 22 62.8 37.4 25.3 2010 474 27 65.3 42.8 22.5 2011 474 36 59.7 43.9 15.8
2012 474 34 58.6 42.1 16.6 2013 473 23 56.3 38.9 17.4 Total 533 58.4 38.5 19.9
Southeast Roe 1994 51 1 * * * Herring Purse Seine 1995 51 1 * * *
1996 51 0 - - - 1997 51 0 - - -
1998 51 0 - - - 1999 51 1 * * *
2000 51 0 - - - 2001 51 3 * * * 2002 51 5 66.5 47.1 19.4 2003 51 6 69.5 42.6 26.9 2004 51 6 73.1 47.3 25.8
2005 51 7 74.6 46.7 27.9 2006 51 6 68.5 44.2 24.3
2007 51 3 * * * 2008 50 3 * * *
2009 50 2 * * * 2010 49 4 67.2 51.9 15.3 2011 48 3 * * *
2012 48 2 * * * 2013 48 0 - - - Total 53 69.2 46.1 23.1
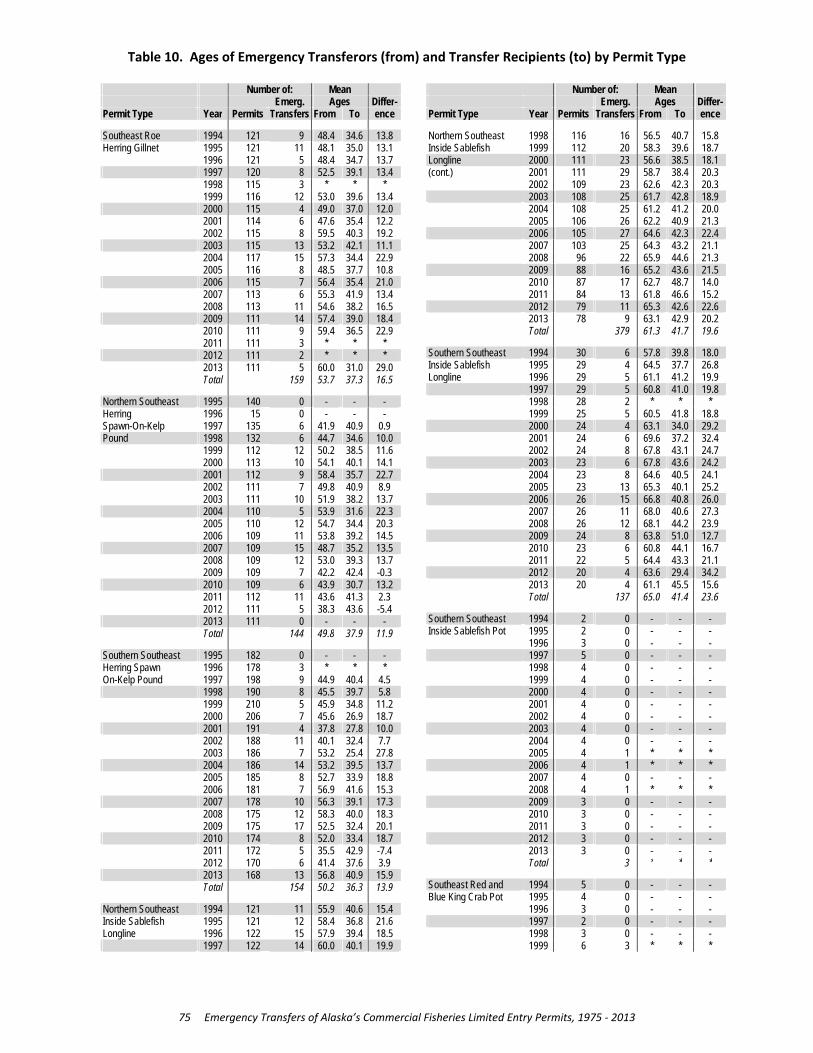
Table 10. Ages of Emergency Transferors (from) and Transfer Recipients (to) by Permit Type
75 Emergency Transfers of Alaska’s Commercial Fisheries Limited Entry Permits, 1975 ‐ 2013
Number of: Mean Emerg. Ages Differ- Permit Type Year Permits Transfers From To ence Southeast Roe 1994 121 9 48.4 34.6 13.8 Herring Gillnet 1995 121 11 48.1 35.0 13.1
1996 121 5 48.4 34.7 13.7 1997 120 8 52.5 39.1 13.4
1998 115 3 * * * 1999 116 12 53.0 39.6 13.4
2000 115 4 49.0 37.0 12.0 2001 114 6 47.6 35.4 12.2 2002 115 8 59.5 40.3 19.2
2003 115 13 53.2 42.1 11.1 2004 117 15 57.3 34.4 22.9 2005 116 8 48.5 37.7 10.8
2006 115 7 56.4 35.4 21.0 2007 113 6 55.3 41.9 13.4 2008 113 11 54.6 38.2 16.5
2009 111 14 57.4 39.0 18.4 2010 111 9 59.4 36.5 22.9 2011 111 3 * * *
2012 111 2 * * * 2013 111 5 60.0 31.0 29.0 Total 159 53.7 37.3 16.5
Northern Southeast 1995 140 0 - - - Herring 1996 15 0 - - - Spawn-On-Kelp 1997 135 6 41.9 40.9 0.9 Pound 1998 132 6 44.7 34.6 10.0
1999 112 12 50.2 38.5 11.6 2000 113 10 54.1 40.1 14.1
2001 112 9 58.4 35.7 22.7 2002 111 7 49.8 40.9 8.9 2003 111 10 51.9 38.2 13.7
2004 110 5 53.9 31.6 22.3 2005 110 12 54.7 34.4 20.3 2006 109 11 53.8 39.2 14.5
2007 109 15 48.7 35.2 13.5 2008 109 12 53.0 39.3 13.7 2009 109 7 42.2 42.4 -0.3
2010 109 6 43.9 30.7 13.2 2011 112 11 43.6 41.3 2.3 2012 111 5 38.3 43.6 -5.4
2013 111 0 - - - Total 144 49.8 37.9 11.9
Southern Southeast 1995 182 0 - - - Herring Spawn 1996 178 3 * * * On-Kelp Pound 1997 198 9 44.9 40.4 4.5 1998 190 8 45.5 39.7 5.8 1999 210 5 45.9 34.8 11.2 2000 206 7 45.6 26.9 18.7 2001 191 4 37.8 27.8 10.0
2002 188 11 40.1 32.4 7.7 2003 186 7 53.2 25.4 27.8
2004 186 14 53.2 39.5 13.7 2005 185 8 52.7 33.9 18.8 2006 181 7 56.9 41.6 15.3
2007 178 10 56.3 39.1 17.3 2008 175 12 58.3 40.0 18.3 2009 175 17 52.5 32.4 20.1
2010 174 8 52.0 33.4 18.7 2011 172 5 35.5 42.9 -7.4 2012 170 6 41.4 37.6 3.9
2013 168 13 56.8 40.9 15.9 Total 154 50.2 36.3 13.9
Northern Southeast 1994 121 11 55.9 40.6 15.4 Inside Sablefish 1995 121 12 58.4 36.8 21.6 Longline 1996 122 15 57.9 39.4 18.5 1997 122 14 60.0 40.1 19.9
Number of: Mean Emerg. Ages Differ- Permit Type Year Permits Transfers From To ence Northern Southeast 1998 116 16 56.5 40.7 15.8 Inside Sablefish 1999 112 20 58.3 39.6 18.7 Longline 2000 111 23 56.6 38.5 18.1 (cont.) 2001 111 29 58.7 38.4 20.3
2002 109 23 62.6 42.3 20.3 2003 108 25 61.7 42.8 18.9
2004 108 25 61.2 41.2 20.0 2005 106 26 62.2 40.9 21.3
2006 105 27 64.6 42.3 22.4 2007 103 25 64.3 43.2 21.1 2008 96 22 65.9 44.6 21.3
2009 88 16 65.2 43.6 21.5 2010 87 17 62.7 48.7 14.0 2011 84 13 61.8 46.6 15.2
2012 79 11 65.3 42.6 22.6 2013 78 9 63.1 42.9 20.2 Total 379 61.3 41.7 19.6
Southern Southeast 1994 30 6 57.8 39.8 18.0 Inside Sablefish 1995 29 4 64.5 37.7 26.8 Longline 1996 29 5 61.1 41.2 19.9 1997 29 5 60.8 41.0 19.8
1998 28 2 * * * 1999 25 5 60.5 41.8 18.8
2000 24 4 63.1 34.0 29.2 2001 24 6 69.6 37.2 32.4 2002 24 8 67.8 43.1 24.7
2003 23 6 67.8 43.6 24.2 2004 23 8 64.6 40.5 24.1 2005 23 13 65.3 40.1 25.2
2006 26 15 66.8 40.8 26.0 2007 26 11 68.0 40.6 27.3 2008 26 12 68.1 44.2 23.9
2009 24 8 63.8 51.0 12.7 2010 23 6 60.8 44.1 16.7 2011 22 5 64.4 43.3 21.1
2012 20 4 63.6 29.4 34.2 2013 20 4 61.1 45.5 15.6 Total 137 65.0 41.4 23.6
Southern Southeast 1994 2 0 - - - Inside Sablefish Pot 1995 2 0 - - -
1996 3 0 - - - 1997 5 0 - - -
1998 4 0 - - - 1999 4 0 - - -
2000 4 0 - - - 2001 4 0 - - - 2002 4 0 - - -
2003 4 0 - - - 2004 4 0 - - - 2005 4 1 * * *
2006 4 1 * * * 2007 4 0 - - - 2008 4 1 * * *
2009 3 0 - - - 2010 3 0 - - - 2011 3 0 - - -
2012 3 0 - - - 2013 3 0 - - - Total 3 * * *
Southeast Red and 1994 5 0 - - - Blue King Crab Pot 1995 4 0 - - -
1996 3 0 - - - 1997 2 0 - - -
1998 3 0 - - - 1999 6 3 * * *
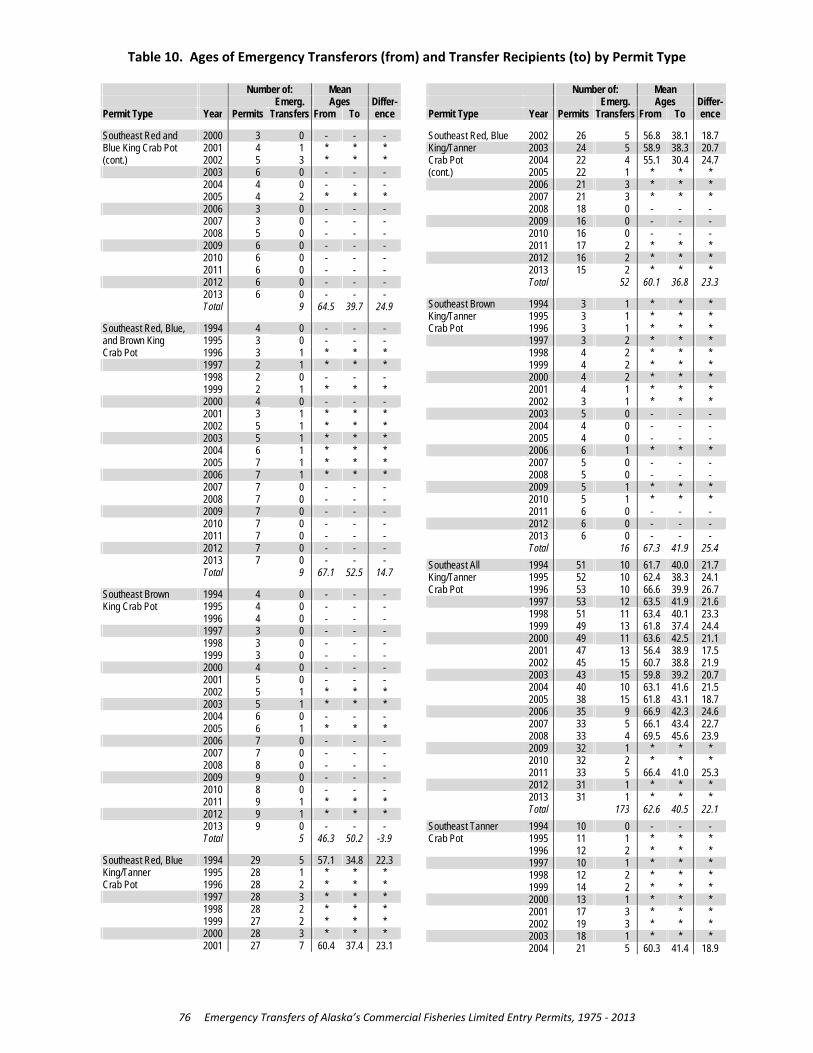
Table 10. Ages of Emergency Transferors (from) and Transfer Recipients (to) by Permit Type
76 Emergency Transfers of Alaska’s Commercial Fisheries Limited Entry Permits, 1975 ‐ 2013
Number of: Mean Emerg. Ages Differ- Permit Type Year Permits Transfers From To ence Southeast Red and 2000 3 0 - - - Blue King Crab Pot 2001 4 1 * * * (cont.) 2002 5 3 * * * 2003 6 0 - - -
2004 4 0 - - - 2005 4 2 * * *
2006 3 0 - - - 2007 3 0 - - - 2008 5 0 - - -
2009 6 0 - - - 2010 6 0 - - - 2011 6 0 - - -
2012 6 0 - - - 2013 6 0 - - - Total 9 64.5 39.7 24.9
Southeast Red, Blue, 1994 4 0 - - - and Brown King 1995 3 0 - - - Crab Pot 1996 3 1 * * * 1997 2 1 * * *
1998 2 0 - - - 1999 2 1 * * *
2000 4 0 - - - 2001 3 1 * * * 2002 5 1 * * *
2003 5 1 * * * 2004 6 1 * * * 2005 7 1 * * *
2006 7 1 * * * 2007 7 0 - - - 2008 7 0 - - - 2009 7 0 - - -
2010 7 0 - - - 2011 7 0 - - -
2012 7 0 - - - 2013 7 0 - - - Total 9 67.1 52.5 14.7
Southeast Brown 1994 4 0 - - - King Crab Pot 1995 4 0 - - -
1996 4 0 - - - 1997 3 0 - - -
1998 3 0 - - - 1999 3 0 - - -
2000 4 0 - - - 2001 5 0 - - - 2002 5 1 * * *
2003 5 1 * * * 2004 6 0 - - - 2005 6 1 * * *
2006 7 0 - - - 2007 7 0 - - - 2008 8 0 - - -
2009 9 0 - - - 2010 8 0 - - - 2011 9 1 * * *
2012 9 1 * * * 2013 9 0 - - - Total 5 46.3 50.2 -3.9
Southeast Red, Blue 1994 29 5 57.1 34.8 22.3 King/Tanner 1995 28 1 * * * Crab Pot 1996 28 2 * * * 1997 28 3 * * *
1998 28 2 * * * 1999 27 2 * * *
2000 28 3 * * * 2001 27 7 60.4 37.4 23.1
Number of: Mean Emerg. Ages Differ- Permit Type Year Permits Transfers From To ence Southeast Red, Blue 2002 26 5 56.8 38.1 18.7 King/Tanner 2003 24 5 58.9 38.3 20.7 Crab Pot 2004 22 4 55.1 30.4 24.7 (cont.) 2005 22 1 * * * 2006 21 3 * * *
2007 21 3 * * * 2008 18 0 - - -
2009 16 0 - - - 2010 16 0 - - - 2011 17 2 * * *
2012 16 2 * * * 2013 15 2 * * * Total 52 60.1 36.8 23.3
Southeast Brown 1994 3 1 * * * King/Tanner 1995 3 1 * * * Crab Pot 1996 3 1 * * * 1997 3 2 * * *
1998 4 2 * * * 1999 4 2 * * *
2000 4 2 * * * 2001 4 1 * * * 2002 3 1 * * * 2003 5 0 - - -
2004 4 0 - - - 2005 4 0 - - -
2006 6 1 * * * 2007 5 0 - - - 2008 5 0 - - -
2009 5 1 * * * 2010 5 1 * * * 2011 6 0 - - -
2012 6 0 - - - 2013 6 0 - - - Total 16 67.3 41.9 25.4
Southeast All 1994 51 10 61.7 40.0 21.7 King/Tanner 1995 52 10 62.4 38.3 24.1 Crab Pot 1996 53 10 66.6 39.9 26.7 1997 53 12 63.5 41.9 21.6
1998 51 11 63.4 40.1 23.3 1999 49 13 61.8 37.4 24.4
2000 49 11 63.6 42.5 21.1 2001 47 13 56.4 38.9 17.5 2002 45 15 60.7 38.8 21.9
2003 43 15 59.8 39.2 20.7 2004 40 10 63.1 41.6 21.5 2005 38 15 61.8 43.1 18.7
2006 35 9 66.9 42.3 24.6 2007 33 5 66.1 43.4 22.7 2008 33 4 69.5 45.6 23.9
2009 32 1 * * * 2010 32 2 * * * 2011 33 5 66.4 41.0 25.3
2012 31 1 * * * 2013 31 1 * * * Total 173 62.6 40.5 22.1
Southeast Tanner 1994 10 0 - - - Crab Pot 1995 11 1 * * *
1996 12 2 * * * 1997 10 1 * * *
1998 12 2 * * * 1999 14 2 * * *
2000 13 1 * * * 2001 17 3 * * * 2002 19 3 * * *
2003 18 1 * * * 2004 21 5 60.3 41.4 18.9
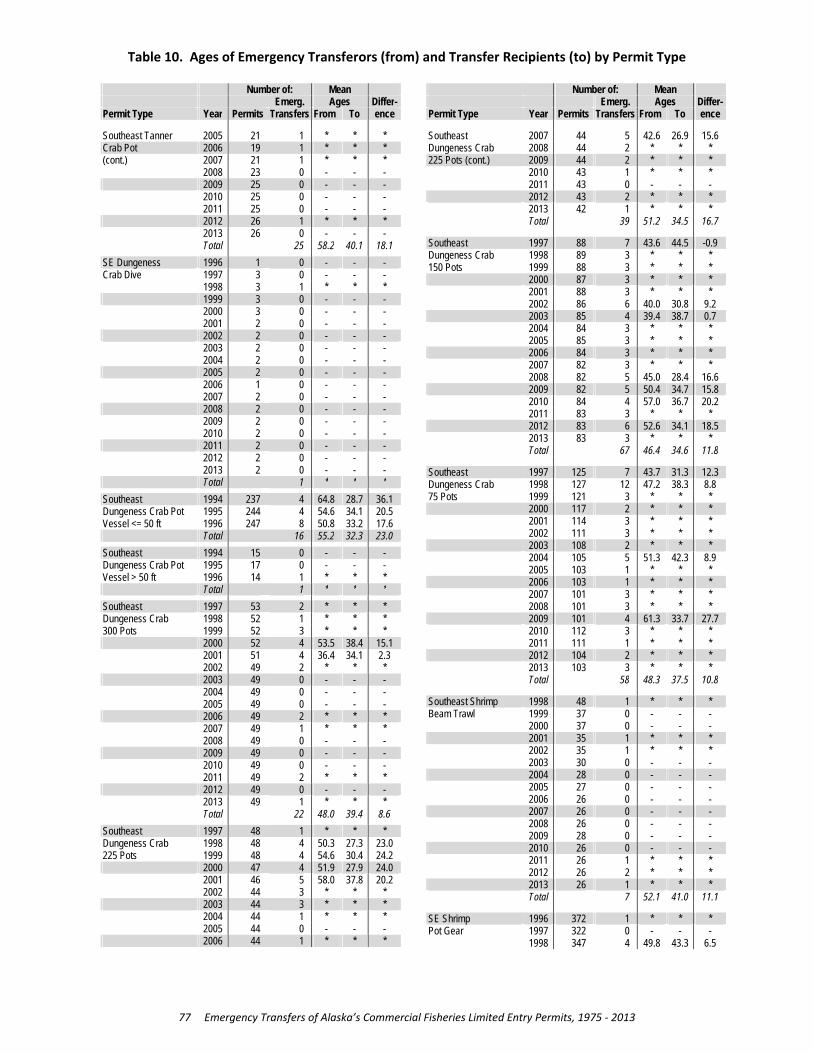
Table 10. Ages of Emergency Transferors (from) and Transfer Recipients (to) by Permit Type
77 Emergency Transfers of Alaska’s Commercial Fisheries Limited Entry Permits, 1975 ‐ 2013
Number of: Mean Emerg. Ages Differ- Permit Type Year Permits Transfers From To ence Southeast Tanner 2005 21 1 * * * Crab Pot 2006 19 1 * * * (cont.) 2007 21 1 * * *
2008 23 0 - - - 2009 25 0 - - -
2010 25 0 - - - 2011 25 0 - - -
2012 26 1 * * * 2013 26 0 - - - Total 25 58.2 40.1 18.1
SE Dungeness 1996 1 0 - - - Crab Dive 1997 3 0 - - - 1998 3 1 * * * 1999 3 0 - - - 2000 3 0 - - -
2001 2 0 - - - 2002 2 0 - - -
2003 2 0 - - - 2004 2 0 - - -
2005 2 0 - - - 2006 1 0 - - - 2007 2 0 - - -
2008 2 0 - - - 2009 2 0 - - - 2010 2 0 - - -
2011 2 0 - - - 2012 2 0 - - - 2013 2 0 - - -
Total 1 * * *
Southeast 1994 237 4 64.8 28.7 36.1 Dungeness Crab Pot 1995 244 4 54.6 34.1 20.5 Vessel <= 50 ft 1996 247 8 50.8 33.2 17.6 Total 16 55.2 32.3 23.0
Southeast 1994 15 0 - - - Dungeness Crab Pot 1995 17 0 - - - Vessel > 50 ft 1996 14 1 * * * Total 1 * * *
Southeast 1997 53 2 * * * Dungeness Crab 1998 52 1 * * * 300 Pots 1999 52 3 * * * 2000 52 4 53.5 38.4 15.1
2001 51 4 36.4 34.1 2.3 2002 49 2 * * *
2003 49 0 - - - 2004 49 0 - - - 2005 49 0 - - -
2006 49 2 * * * 2007 49 1 * * * 2008 49 0 - - -
2009 49 0 - - - 2010 49 0 - - - 2011 49 2 * * *
2012 49 0 - - - 2013 49 1 * * * Total 22 48.0 39.4 8.6
Southeast 1997 48 1 * * * Dungeness Crab 1998 48 4 50.3 27.3 23.0 225 Pots 1999 48 4 54.6 30.4 24.2 2000 47 4 51.9 27.9 24.0
2001 46 5 58.0 37.8 20.2 2002 44 3 * * *
2003 44 3 * * * 2004 44 1 * * * 2005 44 0 - - -
2006 44 1 * * *
Number of: Mean Emerg. Ages Differ- Permit Type Year Permits Transfers From To ence Southeast 2007 44 5 42.6 26.9 15.6 Dungeness Crab 2008 44 2 * * * 225 Pots (cont.) 2009 44 2 * * * 2010 43 1 * * *
2011 43 0 - - - 2012 43 2 * * * 2013 42 1 * * * Total 39 51.2 34.5 16.7
Southeast 1997 88 7 43.6 44.5 -0.9 Dungeness Crab 1998 89 3 * * * 150 Pots 1999 88 3 * * * 2000 87 3 * * *
2001 88 3 * * * 2002 86 6 40.0 30.8 9.2
2003 85 4 39.4 38.7 0.7 2004 84 3 * * * 2005 85 3 * * *
2006 84 3 * * * 2007 82 3 * * * 2008 82 5 45.0 28.4 16.6
2009 82 5 50.4 34.7 15.8 2010 84 4 57.0 36.7 20.2 2011 83 3 * * *
2012 83 6 52.6 34.1 18.5 2013 83 3 * * * Total 67 46.4 34.6 11.8
Southeast 1997 125 7 43.7 31.3 12.3 Dungeness Crab 1998 127 12 47.2 38.3 8.8 75 Pots 1999 121 3 * * * 2000 117 2 * * *
2001 114 3 * * * 2002 111 3 * * *
2003 108 2 * * * 2004 105 5 51.3 42.3 8.9 2005 103 1 * * *
2006 103 1 * * * 2007 101 3 * * * 2008 101 3 * * *
2009 101 4 61.3 33.7 27.7 2010 112 3 * * * 2011 111 1 * * *
2012 104 2 * * * 2013 103 3 * * * Total 58 48.3 37.5 10.8
Southeast Shrimp 1998 48 1 * * * Beam Trawl 1999 37 0 - - -
2000 37 0 - - - 2001 35 1 * * *
2002 35 1 * * * 2003 30 0 - - -
2004 28 0 - - - 2005 27 0 - - - 2006 26 0 - - -
2007 26 0 - - - 2008 26 0 - - - 2009 28 0 - - -
2010 26 0 - - - 2011 26 1 * * * 2012 26 2 * * *
2013 26 1 * * * Total 7 52.1 41.0 11.1
SE Shrimp 1996 372 1 * * * Pot Gear 1997 322 0 - - -
1998 347 4 49.8 43.3 6.5
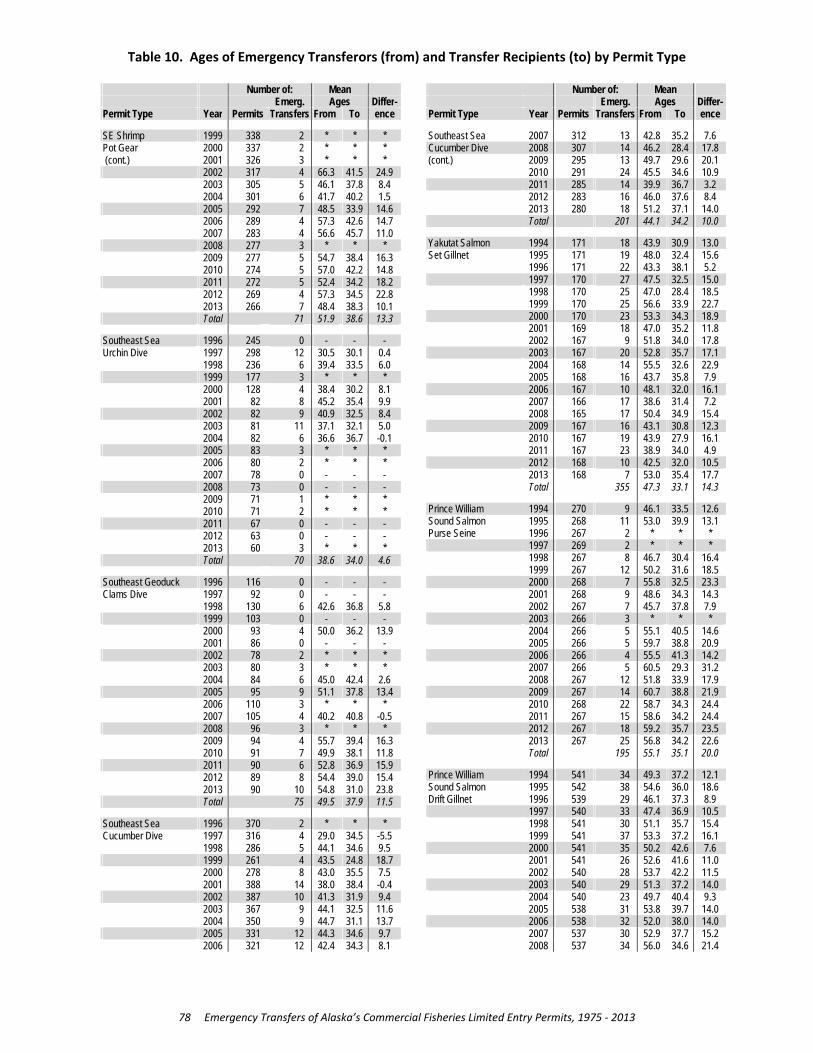
Table 10. Ages of Emergency Transferors (from) and Transfer Recipients (to) by Permit Type
78 Emergency Transfers of Alaska’s Commercial Fisheries Limited Entry Permits, 1975 ‐ 2013
Number of: Mean Emerg. Ages Differ- Permit Type Year Permits Transfers From To ence SE Shrimp 1999 338 2 * * * Pot Gear 2000 337 2 * * * (cont.) 2001 326 3 * * * 2002 317 4 66.3 41.5 24.9
2003 305 5 46.1 37.8 8.4 2004 301 6 41.7 40.2 1.5
2005 292 7 48.5 33.9 14.6 2006 289 4 57.3 42.6 14.7 2007 283 4 56.6 45.7 11.0
2008 277 3 * * * 2009 277 5 54.7 38.4 16.3 2010 274 5 57.0 42.2 14.8
2011 272 5 52.4 34.2 18.2 2012 269 4 57.3 34.5 22.8 2013 266 7 48.4 38.3 10.1
Total 71 51.9 38.6 13.3
Southeast Sea 1996 245 0 - - - Urchin Dive 1997 298 12 30.5 30.1 0.4
1998 236 6 39.4 33.5 6.0 1999 177 3 * * *
2000 128 4 38.4 30.2 8.1 2001 82 8 45.2 35.4 9.9
2002 82 9 40.9 32.5 8.4 2003 81 11 37.1 32.1 5.0 2004 82 6 36.6 36.7 -0.1
2005 83 3 * * * 2006 80 2 * * * 2007 78 0 - - -
2008 73 0 - - - 2009 71 1 * * * 2010 71 2 * * *
2011 67 0 - - - 2012 63 0 - - - 2013 60 3 * * *
Total 70 38.6 34.0 4.6
Southeast Geoduck 1996 116 0 - - - Clams Dive 1997 92 0 - - -
1998 130 6 42.6 36.8 5.8 1999 103 0 - - -
2000 93 4 50.0 36.2 13.9 2001 86 0 - - -
2002 78 2 * * * 2003 80 3 * * * 2004 84 6 45.0 42.4 2.6
2005 95 9 51.1 37.8 13.4 2006 110 3 * * * 2007 105 4 40.2 40.8 -0.5
2008 96 3 * * * 2009 94 4 55.7 39.4 16.3 2010 91 7 49.9 38.1 11.8
2011 90 6 52.8 36.9 15.9 2012 89 8 54.4 39.0 15.4 2013 90 10 54.8 31.0 23.8
Total 75 49.5 37.9 11.5
Southeast Sea 1996 370 2 * * * Cucumber Dive 1997 316 4 29.0 34.5 -5.5 1998 286 5 44.1 34.6 9.5 1999 261 4 43.5 24.8 18.7
2000 278 8 43.0 35.5 7.5 2001 388 14 38.0 38.4 -0.4
2002 387 10 41.3 31.9 9.4 2003 367 9 44.1 32.5 11.6 2004 350 9 44.7 31.1 13.7
2005 331 12 44.3 34.6 9.7 2006 321 12 42.4 34.3 8.1
Number of: Mean Emerg. Ages Differ- Permit Type Year Permits Transfers From To ence Southeast Sea 2007 312 13 42.8 35.2 7.6 Cucumber Dive 2008 307 14 46.2 28.4 17.8 (cont.) 2009 295 13 49.7 29.6 20.1 2010 291 24 45.5 34.6 10.9 2011 285 14 39.9 36.7 3.2
2012 283 16 46.0 37.6 8.4 2013 280 18 51.2 37.1 14.0
Total 201 44.1 34.2 10.0
Yakutat Salmon 1994 171 18 43.9 30.9 13.0 Set Gillnet 1995 171 19 48.0 32.4 15.6
1996 171 22 43.3 38.1 5.2 1997 170 27 47.5 32.5 15.0
1998 170 25 47.0 28.4 18.5 1999 170 25 56.6 33.9 22.7
2000 170 23 53.3 34.3 18.9 2001 169 18 47.0 35.2 11.8 2002 167 9 51.8 34.0 17.8
2003 167 20 52.8 35.7 17.1 2004 168 14 55.5 32.6 22.9 2005 168 16 43.7 35.8 7.9
2006 167 10 48.1 32.0 16.1 2007 166 17 38.6 31.4 7.2 2008 165 17 50.4 34.9 15.4
2009 167 16 43.1 30.8 12.3 2010 167 19 43.9 27.9 16.1 2011 167 23 38.9 34.0 4.9
2012 168 10 42.5 32.0 10.5 2013 168 7 53.0 35.4 17.7 Total 355 47.3 33.1 14.3
Prince William 1994 270 9 46.1 33.5 12.6 Sound Salmon 1995 268 11 53.0 39.9 13.1 Purse Seine 1996 267 2 * * * 1997 269 2 * * *
1998 267 8 46.7 30.4 16.4 1999 267 12 50.2 31.6 18.5
2000 268 7 55.8 32.5 23.3 2001 268 9 48.6 34.3 14.3 2002 267 7 45.7 37.8 7.9
2003 266 3 * * * 2004 266 5 55.1 40.5 14.6 2005 266 5 59.7 38.8 20.9
2006 266 4 55.5 41.3 14.2 2007 266 5 60.5 29.3 31.2 2008 267 12 51.8 33.9 17.9
2009 267 14 60.7 38.8 21.9 2010 268 22 58.7 34.3 24.4 2011 267 15 58.6 34.2 24.4
2012 267 18 59.2 35.7 23.5 2013 267 25 56.8 34.2 22.6 Total 195 55.1 35.1 20.0
Prince William 1994 541 34 49.3 37.2 12.1 Sound Salmon 1995 542 38 54.6 36.0 18.6 Drift Gillnet 1996 539 29 46.1 37.3 8.9 1997 540 33 47.4 36.9 10.5
1998 541 30 51.1 35.7 15.4 1999 541 37 53.3 37.2 16.1
2000 541 35 50.2 42.6 7.6 2001 541 26 52.6 41.6 11.0 2002 540 28 53.7 42.2 11.5
2003 540 29 51.3 37.2 14.0 2004 540 23 49.7 40.4 9.3 2005 538 31 53.8 39.7 14.0
2006 538 32 52.0 38.0 14.0 2007 537 30 52.9 37.7 15.2 2008 537 34 56.0 34.6 21.4
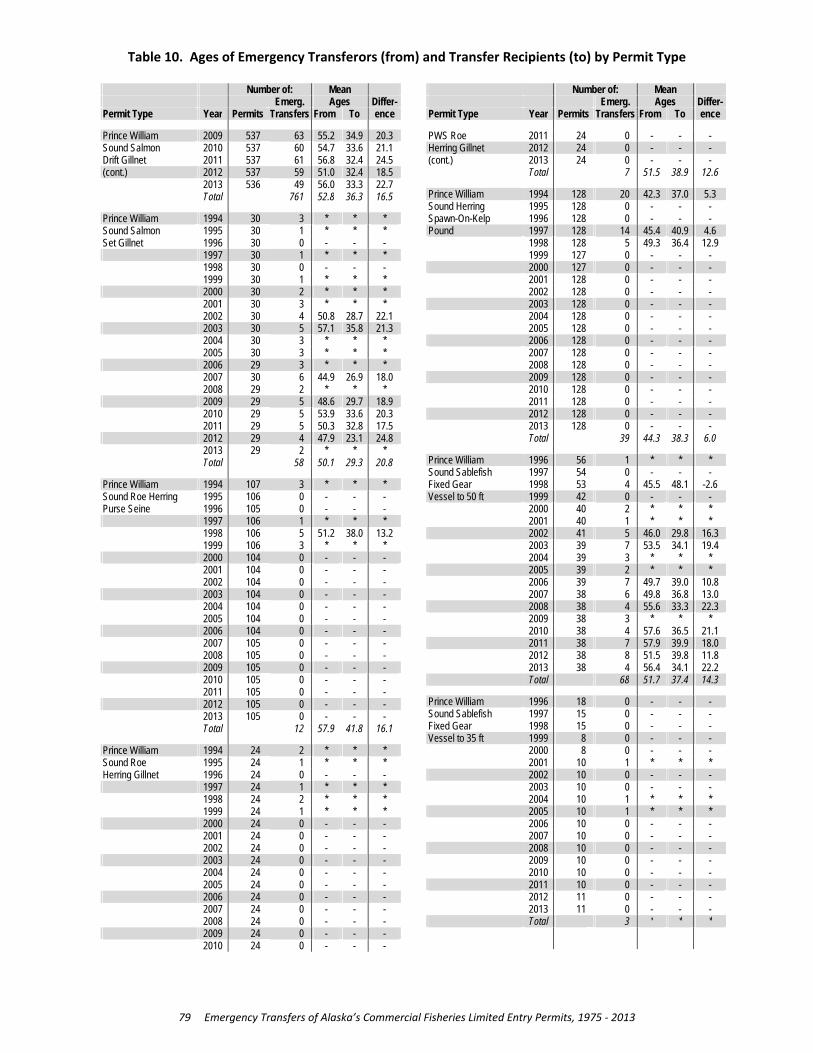
Table 10. Ages of Emergency Transferors (from) and Transfer Recipients (to) by Permit Type
79 Emergency Transfers of Alaska’s Commercial Fisheries Limited Entry Permits, 1975 ‐ 2013
Number of: Mean Emerg. Ages Differ- Permit Type Year Permits Transfers From To ence Prince William 2009 537 63 55.2 34.9 20.3 Sound Salmon 2010 537 60 54.7 33.6 21.1 Drift Gillnet 2011 537 61 56.8 32.4 24.5 (cont.) 2012 537 59 51.0 32.4 18.5 2013 536 49 56.0 33.3 22.7
Total 761 52.8 36.3 16.5
Prince William 1994 30 3 * * * Sound Salmon 1995 30 1 * * * Set Gillnet 1996 30 0 - - - 1997 30 1 * * *
1998 30 0 - - - 1999 30 1 * * *
2000 30 2 * * * 2001 30 3 * * * 2002 30 4 50.8 28.7 22.1
2003 30 5 57.1 35.8 21.3 2004 30 3 * * * 2005 30 3 * * *
2006 29 3 * * * 2007 30 6 44.9 26.9 18.0 2008 29 2 * * *
2009 29 5 48.6 29.7 18.9 2010 29 5 53.9 33.6 20.3 2011 29 5 50.3 32.8 17.5
2012 29 4 47.9 23.1 24.8 2013 29 2 * * * Total 58 50.1 29.3 20.8
Prince William 1994 107 3 * * * Sound Roe Herring 1995 106 0 - - - Purse Seine 1996 105 0 - - - 1997 106 1 * * *
1998 106 5 51.2 38.0 13.2 1999 106 3 * * *
2000 104 0 - - - 2001 104 0 - - - 2002 104 0 - - -
2003 104 0 - - - 2004 104 0 - - - 2005 104 0 - - -
2006 104 0 - - - 2007 105 0 - - - 2008 105 0 - - - 2009 105 0 - - -
2010 105 0 - - - 2011 105 0 - - -
2012 105 0 - - - 2013 105 0 - - - Total 12 57.9 41.8 16.1
Prince William 1994 24 2 * * * Sound Roe 1995 24 1 * * * Herring Gillnet 1996 24 0 - - - 1997 24 1 * * *
1998 24 2 * * * 1999 24 1 * * *
2000 24 0 - - - 2001 24 0 - - - 2002 24 0 - - -
2003 24 0 - - - 2004 24 0 - - - 2005 24 0 - - -
2006 24 0 - - - 2007 24 0 - - - 2008 24 0 - - -
2009 24 0 - - - 2010 24 0 - - -
Number of: Mean Emerg. Ages Differ- Permit Type Year Permits Transfers From To ence PWS Roe 2011 24 0 - - - Herring Gillnet 2012 24 0 - - - (cont.) 2013 24 0 - - - Total 7 51.5 38.9 12.6
Prince William 1994 128 20 42.3 37.0 5.3 Sound Herring 1995 128 0 - - - Spawn-On-Kelp 1996 128 0 - - - Pound 1997 128 14 45.4 40.9 4.6
1998 128 5 49.3 36.4 12.9 1999 127 0 - - -
2000 127 0 - - - 2001 128 0 - - - 2002 128 0 - - -
2003 128 0 - - - 2004 128 0 - - - 2005 128 0 - - -
2006 128 0 - - - 2007 128 0 - - - 2008 128 0 - - -
2009 128 0 - - - 2010 128 0 - - - 2011 128 0 - - -
2012 128 0 - - - 2013 128 0 - - - Total 39 44.3 38.3 6.0
Prince William 1996 56 1 * * * Sound Sablefish 1997 54 0 - - - Fixed Gear 1998 53 4 45.5 48.1 -2.6 Vessel to 50 ft 1999 42 0 - - -
2000 40 2 * * * 2001 40 1 * * *
2002 41 5 46.0 29.8 16.3 2003 39 7 53.5 34.1 19.4 2004 39 3 * * * 2005 39 2 * * * 2006 39 7 49.7 39.0 10.8 2007 38 6 49.8 36.8 13.0 2008 38 4 55.6 33.3 22.3
2009 38 3 * * * 2010 38 4 57.6 36.5 21.1
2011 38 7 57.9 39.9 18.0 2012 38 8 51.5 39.8 11.8 2013 38 4 56.4 34.1 22.2
Total 68 51.7 37.4 14.3
Prince William 1996 18 0 - - - Sound Sablefish 1997 15 0 - - - Fixed Gear 1998 15 0 - - - Vessel to 35 ft 1999 8 0 - - -
2000 8 0 - - - 2001 10 1 * * *
2002 10 0 - - - 2003 10 0 - - - 2004 10 1 * * *
2005 10 1 * * * 2006 10 0 - - - 2007 10 0 - - -
2008 10 0 - - - 2009 10 0 - - - 2010 10 0 - - -
2011 10 0 - - - 2012 11 0 - - - 2013 11 0 - - -
Total 3 * * *
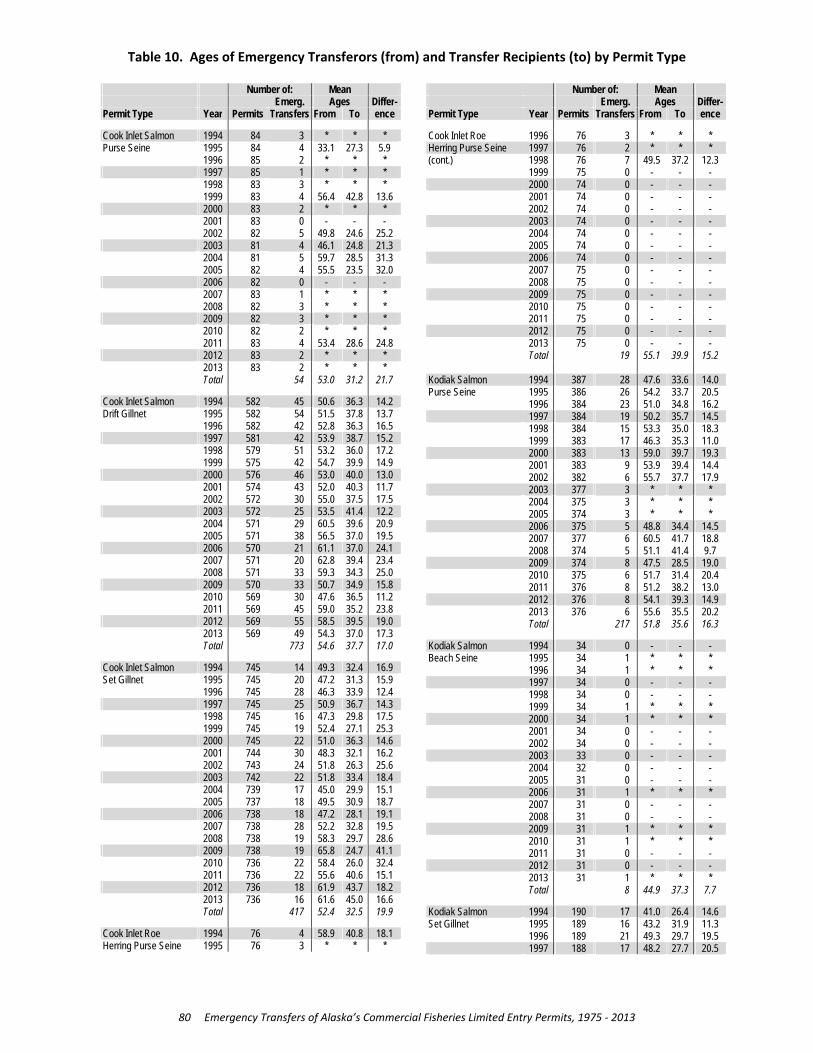
Table 10. Ages of Emergency Transferors (from) and Transfer Recipients (to) by Permit Type
80 Emergency Transfers of Alaska’s Commercial Fisheries Limited Entry Permits, 1975 ‐ 2013
Number of: Mean Emerg. Ages Differ- Permit Type Year Permits Transfers From To ence Cook Inlet Salmon 1994 84 3 * * * Purse Seine 1995 84 4 33.1 27.3 5.9 1996 85 2 * * * 1997 85 1 * * * 1998 83 3 * * *
1999 83 4 56.4 42.8 13.6 2000 83 2 * * *
2001 83 0 - - - 2002 82 5 49.8 24.6 25.2
2003 81 4 46.1 24.8 21.3 2004 81 5 59.7 28.5 31.3 2005 82 4 55.5 23.5 32.0
2006 82 0 - - - 2007 83 1 * * * 2008 82 3 * * *
2009 82 3 * * * 2010 82 2 * * * 2011 83 4 53.4 28.6 24.8
2012 83 2 * * * 2013 83 2 * * * Total 54 53.0 31.2 21.7
Cook Inlet Salmon 1994 582 45 50.6 36.3 14.2 Drift Gillnet 1995 582 54 51.5 37.8 13.7
1996 582 42 52.8 36.3 16.5 1997 581 42 53.9 38.7 15.2 1998 579 51 53.2 36.0 17.2 1999 575 42 54.7 39.9 14.9 2000 576 46 53.0 40.0 13.0
2001 574 43 52.0 40.3 11.7 2002 572 30 55.0 37.5 17.5
2003 572 25 53.5 41.4 12.2 2004 571 29 60.5 39.6 20.9 2005 571 38 56.5 37.0 19.5
2006 570 21 61.1 37.0 24.1 2007 571 20 62.8 39.4 23.4 2008 571 33 59.3 34.3 25.0
2009 570 33 50.7 34.9 15.8 2010 569 30 47.6 36.5 11.2 2011 569 45 59.0 35.2 23.8
2012 569 55 58.5 39.5 19.0 2013 569 49 54.3 37.0 17.3 Total 773 54.6 37.7 17.0
Cook Inlet Salmon 1994 745 14 49.3 32.4 16.9 Set Gillnet 1995 745 20 47.2 31.3 15.9
1996 745 28 46.3 33.9 12.4 1997 745 25 50.9 36.7 14.3
1998 745 16 47.3 29.8 17.5 1999 745 19 52.4 27.1 25.3
2000 745 22 51.0 36.3 14.6 2001 744 30 48.3 32.1 16.2 2002 743 24 51.8 26.3 25.6
2003 742 22 51.8 33.4 18.4 2004 739 17 45.0 29.9 15.1 2005 737 18 49.5 30.9 18.7
2006 738 18 47.2 28.1 19.1 2007 738 28 52.2 32.8 19.5 2008 738 19 58.3 29.7 28.6
2009 738 19 65.8 24.7 41.1 2010 736 22 58.4 26.0 32.4 2011 736 22 55.6 40.6 15.1
2012 736 18 61.9 43.7 18.2 2013 736 16 61.6 45.0 16.6 Total 417 52.4 32.5 19.9
Cook Inlet Roe 1994 76 4 58.9 40.8 18.1 Herring Purse Seine 1995 76 3 * * *
Number of: Mean Emerg. Ages Differ- Permit Type Year Permits Transfers From To ence Cook Inlet Roe 1996 76 3 * * * Herring Purse Seine 1997 76 2 * * * (cont.) 1998 76 7 49.5 37.2 12.3 1999 75 0 - - - 2000 74 0 - - - 2001 74 0 - - -
2002 74 0 - - - 2003 74 0 - - -
2004 74 0 - - - 2005 74 0 - - -
2006 74 0 - - - 2007 75 0 - - - 2008 75 0 - - -
2009 75 0 - - - 2010 75 0 - - - 2011 75 0 - - -
2012 75 0 - - - 2013 75 0 - - - Total 19 55.1 39.9 15.2
Kodiak Salmon 1994 387 28 47.6 33.6 14.0 Purse Seine 1995 386 26 54.2 33.7 20.5
1996 384 23 51.0 34.8 16.2 1997 384 19 50.2 35.7 14.5
1998 384 15 53.3 35.0 18.3 1999 383 17 46.3 35.3 11.0
2000 383 13 59.0 39.7 19.3 2001 383 9 53.9 39.4 14.4 2002 382 6 55.7 37.7 17.9
2003 377 3 * * * 2004 375 3 * * * 2005 374 3 * * *
2006 375 5 48.8 34.4 14.5 2007 377 6 60.5 41.7 18.8 2008 374 5 51.1 41.4 9.7
2009 374 8 47.5 28.5 19.0 2010 375 6 51.7 31.4 20.4 2011 376 8 51.2 38.2 13.0
2012 376 8 54.1 39.3 14.9 2013 376 6 55.6 35.5 20.2 Total 217 51.8 35.6 16.3
Kodiak Salmon 1994 34 0 - - - Beach Seine 1995 34 1 * * *
1996 34 1 * * * 1997 34 0 - - -
1998 34 0 - - - 1999 34 1 * * *
2000 34 1 * * * 2001 34 0 - - - 2002 34 0 - - -
2003 33 0 - - - 2004 32 0 - - - 2005 31 0 - - -
2006 31 1 * * * 2007 31 0 - - - 2008 31 0 - - -
2009 31 1 * * * 2010 31 1 * * * 2011 31 0 - - -
2012 31 0 - - - 2013 31 1 * * * Total 8 44.9 37.3 7.7
Kodiak Salmon 1994 190 17 41.0 26.4 14.6 Set Gillnet 1995 189 16 43.2 31.9 11.3
1996 189 21 49.3 29.7 19.5 1997 188 17 48.2 27.7 20.5

Table 10. Ages of Emergency Transferors (from) and Transfer Recipients (to) by Permit Type
81 Emergency Transfers of Alaska’s Commercial Fisheries Limited Entry Permits, 1975 ‐ 2013
Number of: Mean Emerg. Ages Differ- Permit Type Year Permits Transfers From To ence Kodiak Salmon 1998 188 20 50.8 29.3 21.6 Set Gillnet 1999 188 21 43.5 28.9 14.6 (cont.) 2000 188 33 40.1 28.9 11.1 2001 188 29 38.4 29.7 8.7 2002 188 30 43.9 28.2 15.6 2003 188 29 40.7 30.7 10.0
2004 188 27 43.3 30.0 13.3 2005 188 27 42.4 27.9 14.5
2006 188 25 39.6 29.0 10.6 2007 188 23 46.8 33.8 13.0 2008 188 26 42.3 31.2 11.0
2009 188 24 49.3 36.7 12.6 2010 188 17 48.7 35.3 13.4 2011 188 27 46.5 27.7 18.8 2012 188 33 51.6 32.4 19.3
2013 188 23 52.2 31.1 21.1 Total 485 44.9 30.3 14.6
Kodiak Roe Herring 1994 83 3 * * * Purse Seine 1995 80 2 * * *
1996 82 3 * * * 1997 81 4 48.3 39.5 8.8
1998 74 1 * * * 1999 75 1 * * *
2000 75 0 - - - 2001 73 2 * * * 2002 71 2 * * *
2003 70 1 * * * 2004 68 0 - - - 2005 69 2 * * *
2006 69 0 - - - 2007 68 0 - - - 2008 69 1 * * *
2009 69 3 * * * 2010 68 0 - - - 2011 68 0 - - -
2012 72 1 * * * 2013 72 2 * * * Total 28 52.6 39.6 13.0
Kodiak Roe 1994 110 8 46.8 39.7 7.2 Herring Gillnet 1995 105 6 48.4 44.9 3.5
1996 106 6 47.6 41.2 6.4 1997 103 4 43.5 46.6 -3.2
1998 99 1 * * * 1999 97 0 - - -
2000 95 0 - - - 2001 96 1 * * * 2002 96 1 * * *
2003 95 1 * * * 2004 94 2 * * * 2005 96 0 - - -
2006 92 0 - - - 2007 91 0 - - - 2008 89 1 * * *
2009 97 0 - - - 2010 96 1 * * * 2011 91 0 - - -
2012 90 0 - - - 2013 90 1 * * * Total 33 48.1 41.3 6.7
Kodiak Roe Herring 1994 2 0 - - - Gillnet & Seine 1995 2 0 - - -
1996 2 0 - - - 1997 2 0 - - -
1998 2 0 - - - 1999 2 0 - - -
Number of: Mean Emerg. Ages Differ- Permit Type Year Permits Transfers From To ence Kodiak Roe Herring 2000 2 0 - - - Gillnet & Seine 2001 2 0 - - - (cont.) 2002 2 0 - - - 2003 2 0 - - - 2004 2 0 - - - 2005 2 0 - - - 2006 2 0 - - -
2007 2 0 - - - 2008 2 0 - - -
2009 2 0 - - - 2010 2 1 * * * 2011 2 0 - - -
2012 2 0 - - - 2013 2 0 - - - Total 1 * * *
Kodiak Tanner Bairdi 2003 20 0 - - - Crab Pot Gear 2004 16 0 - - - Vessel To 120 ft 2005 37 0 - - - 2006 35 1 * * *
2007 35 0 - - - 2008 35 1 * * *
2009 37 0 - - - 2010 37 1 * * * 2011 43 1 * * *
2012 43 0 - - - 2013 41 1 * * * Total 5 71.4 39.8 31.6
Kodiak Tanner Bairdi 2003 113 1 * * * Crab Pot Gear 2004 90 1 * * * Vessel Under 60 ft 2005 135 8 55.6 30.0 25.6 2006 135 1 * * *
2007 135 3 * * * 2008 134 1 * * *
2009 137 1 * * * 2010 137 1 * * * 2011 139 6 55.3 42.7 12.7
2012 138 1 * * * 2013 138 3 * * * Total 27 52.2 35.7 16.5
Chignik Salmon 1994 100 17 60.2 35.5 24.7 Purse Seine 1995 100 19 57.2 35.3 21.8
1996 101 19 62.5 36.2 26.3 1997 100 12 61.9 34.2 27.8
1998 100 9 72.2 35.9 36.3 1999 99 9 69.8 40.1 29.7
2000 99 13 62.0 39.8 22.1 2001 98 11 63.8 39.3 24.5 2002 100 10 64.5 40.4 24.1
2003 101 10 64.6 46.9 17.7 2004 100 8 69.6 51.0 18.6 2005 99 12 74.8 45.3 29.6
2006 95 6 70.3 44.0 26.3 2007 92 7 63.2 40.5 22.7 2008 92 13 64.0 38.3 25.7
2009 91 16 62.6 38.4 24.2 2010 91 15 62.9 39.3 23.6 2011 91 14 61.4 40.7 20.6
2012 91 12 61.6 37.3 24.3 2013 91 9 66.7 43.9 22.8 Total 241 63.9 39.4 24.6
Alaska Peninsula 1994 124 6 58.6 33.3 25.3 Salmon Purse Seine 1995 124 3 * * *
1996 124 6 48.9 34.0 14.9 1997 122 5 58.5 29.2 29.3

Table 10. Ages of Emergency Transferors (from) and Transfer Recipients (to) by Permit Type
82 Emergency Transfers of Alaska’s Commercial Fisheries Limited Entry Permits, 1975 ‐ 2013
Number of: Mean Emerg. Ages Differ- Permit Type Year Permits Transfers From To ence Alaska Peninsula 1998 122 7 56.8 29.6 27.1 Salmon Purse Seine 1999 121 8 55.4 35.3 20.1 (cont.) 2000 121 7 62.8 39.4 23.5 2001 121 7 56.8 41.6 15.2 2002 121 5 64.8 44.1 20.7 2003 118 1 * * *
2004 121 4 67.2 45.2 22.0 2005 119 3 * * *
2006 119 4 53.6 40.9 12.6 2007 118 1 * * * 2008 118 7 69.2 43.9 25.3
2009 119 5 62.0 38.2 23.8 2010 119 7 64.4 44.9 19.5 2011 119 3 * * *
2012 119 4 57.4 34.4 22.9 2013 119 8 64.0 31.6 32.4 Total 101 59.9 37.4 22.5
Alaska Peninsula 1994 164 11 47.6 32.7 14.9 Salmon Drift Gillnet 1995 164 9 45.2 37.0 8.2
1996 164 17 48.7 36.8 11.9 1997 164 16 49.2 33.8 15.4
1998 164 20 49.0 35.9 13.1 1999 164 18 44.0 34.3 9.7
2000 161 9 48.6 29.9 18.7 2001 160 7 47.1 27.4 19.7 2002 160 7 49.4 37.1 12.2
2003 160 9 54.9 38.1 16.8 2004 161 12 55.5 40.3 15.2 2005 162 8 47.8 36.8 11.0
2006 162 8 51.4 35.8 15.6 2007 162 8 40.9 33.9 7.0 2008 162 13 46.6 36.0 10.6
2009 162 10 53.5 35.1 18.4 2010 162 7 52.0 36.8 15.3 2011 162 5 60.8 45.8 15.0
2012 162 9 57.1 39.7 17.4 2013 162 8 45.6 36.2 9.3 Total 211 49.3 35.8 13.5
Alaska Peninsula 1994 114 12 52.6 31.7 20.9 Salmon Set Gillnet 1995 114 13 54.9 32.6 22.3
1996 114 13 49.2 33.5 15.7 1997 114 10 54.1 31.1 23.0
1998 113 15 52.4 36.4 16.0 1999 113 13 47.7 41.8 5.9
2000 113 15 52.5 35.2 17.3 2001 113 12 57.4 38.5 18.9 2002 113 13 55.9 40.3 15.6
2003 113 16 53.4 34.0 19.4 2004 113 9 48.0 39.1 8.9 2005 113 11 56.9 38.4 18.5
2006 114 11 51.2 36.2 15.1 2007 114 10 45.3 30.8 14.5 2008 113 6 40.9 34.4 6.5
2009 113 6 68.6 37.7 30.9 2010 113 4 57.4 43.2 14.2 2011 113 5 46.9 46.0 0.9 2012 113 8 56.8 33.6 23.2
2013 113 10 52.0 34.1 17.9 Total 212 52.6 36.0 16.7
Bristol Bay Salmon 1994 1,887 239 51.4 37.0 14.4 Drift Gillnet 1995 1,888 232 52.6 37.0 15.6
1996 1,891 246 52.6 36.8 15.8 1997 1,899 242 54.8 36.4 18.3
1998 1,899 221 53.3 38.2 15.1 1999 1,898 222 54.3 38.3 16.0
Number of: Mean Emerg. Ages Differ- Permit Type Year Permits Transfers From To ence Bristol Bay Salmon 2000 1,890 220 53.5 38.8 14.7 Drift Gillnet 2001 1,883 183 51.9 37.7 14.2 (cont.) 2002 1,878 127 53.2 39.6 13.6 2003 1,867 155 53.8 40.7 13.1 2004 1,860 173 52.6 38.7 13.9 2005 1,862 186 53.2 37.6 15.6 2006 1,860 194 53.0 37.9 15.1
2007 1,862 199 55.3 38.0 17.3 2008 1,863 201 54.5 37.1 17.4
2009 1,863 221 53.5 38.6 14.9 2010 1,863 252 55.0 37.9 17.1 2011 1,862 226 53.1 37.7 15.4
2012 1,862 217 54.2 37.3 16.8 2013 1,862 216 53.4 38.1 15.3 Total 4,172 53.5 37.9 15.6
Bristol Bay Salmon 1994 1,019 137 45.0 31.6 13.5 Set Gillnet 1995 1,019 139 44.7 30.1 14.6
1996 1,017 129 43.5 32.5 11.0 1997 1,019 144 45.8 30.9 14.9
1998 1,015 126 46.3 32.5 13.7 1999 1,014 99 47.8 31.7 16.1
2000 1,012 124 48.9 33.2 15.7 2001 1,010 116 46.2 32.2 14.0 2002 1,006 103 46.9 29.7 17.2
2003 1,000 98 47.5 29.6 17.9 2004 989 113 48.9 32.6 16.3 2005 988 107 49.3 33.0 16.3
2006 985 131 48.4 29.2 19.1 2007 983 105 49.8 32.7 17.1 2008 979 91 50.1 29.9 20.2
2009 982 112 51.5 32.6 18.9 2010 982 115 51.3 34.2 17.1 2011 981 94 51.9 34.8 17.1
2012 979 102 50.6 34.5 16.1 2013 978 100 49.9 31.5 18.4 Total 2,285 48.0 31.9 16.1
Bristol Bay Herring 1994 306 36 38.4 30.7 7.7 Spawn On Kelp 1995 301 28 41.2 31.8 9.5 Hand Pick 1996 298 23 46.0 28.8 17.1 1997 296 27 43.4 32.0 11.4
1998 292 26 47.3 34.7 12.6 1999 290 19 47.6 33.4 14.2
2000 290 28 46.3 34.5 11.8 2001 289 26 46.4 28.1 18.4
2002 287 7 51.2 35.3 15.9 2003 286 8 52.9 25.6 27.3 2004 265 6 58.9 27.9 31.0 2005 267 3 * * * 2006 268 0 - - -
2007 266 0 - - - 2008 266 0 - - -
2009 265 0 - - - 2010 266 0 - - - 2011 266 0 - - -
2012 266 0 - - - 2013 266 0 - - - Total 237 45.3 31.5 13.8
Goodnews Bay 1998 155 0 - - - Herring Gillnet 1999 148 1 * * *
2000 151 2 * * * 2001 176 4 53.9 41.8 12.1
2002 172 1 * * * 2003 175 0 - - -
2004 163 0 - - - 2005 152 1 * * *
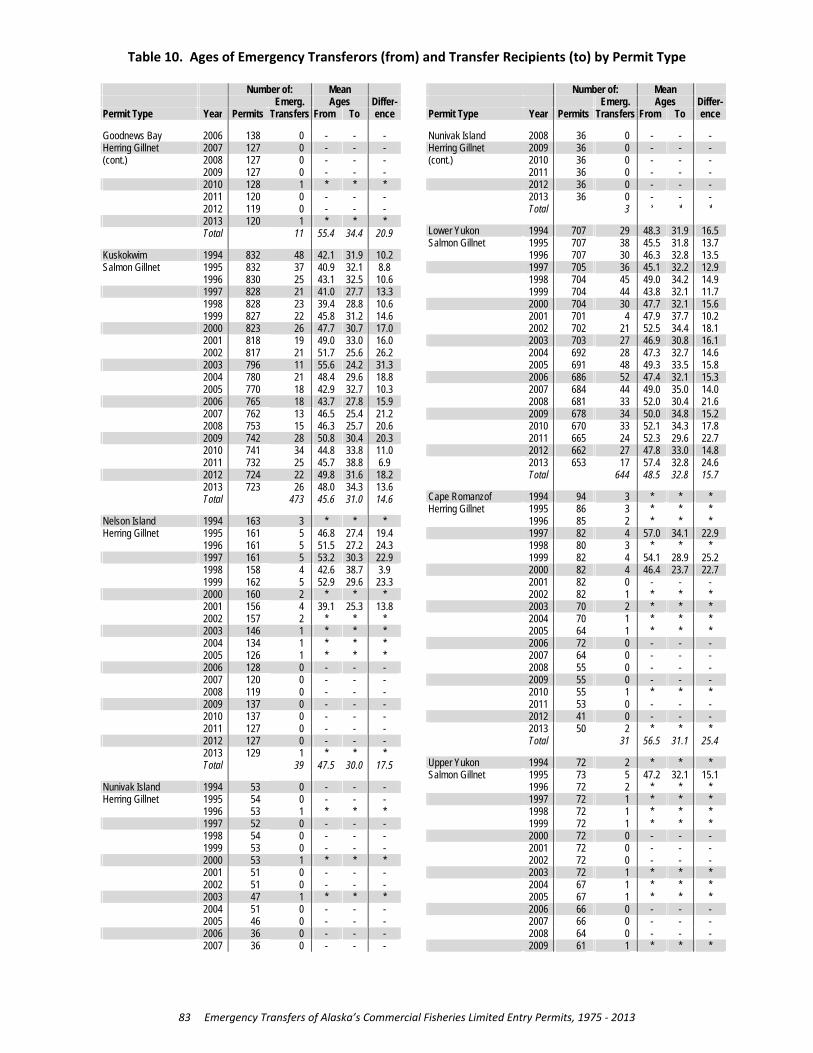
Table 10. Ages of Emergency Transferors (from) and Transfer Recipients (to) by Permit Type
83 Emergency Transfers of Alaska’s Commercial Fisheries Limited Entry Permits, 1975 ‐ 2013
Number of: Mean Emerg. Ages Differ- Permit Type Year Permits Transfers From To ence Goodnews Bay 2006 138 0 - - - Herring Gillnet 2007 127 0 - - - (cont.) 2008 127 0 - - - 2009 127 0 - - - 2010 128 1 * * *
2011 120 0 - - - 2012 119 0 - - -
2013 120 1 * * * Total 11 55.4 34.4 20.9
Kuskokwim 1994 832 48 42.1 31.9 10.2 Salmon Gillnet 1995 832 37 40.9 32.1 8.8
1996 830 25 43.1 32.5 10.6 1997 828 21 41.0 27.7 13.3
1998 828 23 39.4 28.8 10.6 1999 827 22 45.8 31.2 14.6
2000 823 26 47.7 30.7 17.0 2001 818 19 49.0 33.0 16.0 2002 817 21 51.7 25.6 26.2
2003 796 11 55.6 24.2 31.3 2004 780 21 48.4 29.6 18.8 2005 770 18 42.9 32.7 10.3
2006 765 18 43.7 27.8 15.9 2007 762 13 46.5 25.4 21.2 2008 753 15 46.3 25.7 20.6
2009 742 28 50.8 30.4 20.3 2010 741 34 44.8 33.8 11.0 2011 732 25 45.7 38.8 6.9
2012 724 22 49.8 31.6 18.2 2013 723 26 48.0 34.3 13.6 Total 473 45.6 31.0 14.6
Nelson Island 1994 163 3 * * * Herring Gillnet 1995 161 5 46.8 27.4 19.4
1996 161 5 51.5 27.2 24.3 1997 161 5 53.2 30.3 22.9
1998 158 4 42.6 38.7 3.9 1999 162 5 52.9 29.6 23.3
2000 160 2 * * * 2001 156 4 39.1 25.3 13.8 2002 157 2 * * * 2003 146 1 * * * 2004 134 1 * * *
2005 126 1 * * * 2006 128 0 - - -
2007 120 0 - - - 2008 119 0 - - -
2009 137 0 - - - 2010 137 0 - - - 2011 127 0 - - -
2012 127 0 - - - 2013 129 1 * * * Total 39 47.5 30.0 17.5
Nunivak Island 1994 53 0 - - - Herring Gillnet 1995 54 0 - - -
1996 53 1 * * * 1997 52 0 - - -
1998 54 0 - - - 1999 53 0 - - -
2000 53 1 * * * 2001 51 0 - - - 2002 51 0 - - -
2003 47 1 * * * 2004 51 0 - - - 2005 46 0 - - -
2006 36 0 - - - 2007 36 0 - - -
Number of: Mean Emerg. Ages Differ- Permit Type Year Permits Transfers From To ence Nunivak Island 2008 36 0 - - - Herring Gillnet 2009 36 0 - - - (cont.) 2010 36 0 - - - 2011 36 0 - - - 2012 36 0 - - -
2013 36 0 - - - Total 3 * * *
Lower Yukon 1994 707 29 48.3 31.9 16.5 Salmon Gillnet 1995 707 38 45.5 31.8 13.7
1996 707 30 46.3 32.8 13.5 1997 705 36 45.1 32.2 12.9
1998 704 45 49.0 34.2 14.9 1999 704 44 43.8 32.1 11.7
2000 704 30 47.7 32.1 15.6 2001 701 4 47.9 37.7 10.2 2002 702 21 52.5 34.4 18.1
2003 703 27 46.9 30.8 16.1 2004 692 28 47.3 32.7 14.6 2005 691 48 49.3 33.5 15.8
2006 686 52 47.4 32.1 15.3 2007 684 44 49.0 35.0 14.0 2008 681 33 52.0 30.4 21.6
2009 678 34 50.0 34.8 15.2 2010 670 33 52.1 34.3 17.8 2011 665 24 52.3 29.6 22.7
2012 662 27 47.8 33.0 14.8 2013 653 17 57.4 32.8 24.6 Total 644 48.5 32.8 15.7
Cape Romanzof 1994 94 3 * * * Herring Gillnet 1995 86 3 * * * 1996 85 2 * * * 1997 82 4 57.0 34.1 22.9 1998 80 3 * * *
1999 82 4 54.1 28.9 25.2 2000 82 4 46.4 23.7 22.7
2001 82 0 - - - 2002 82 1 * * *
2003 70 2 * * * 2004 70 1 * * * 2005 64 1 * * *
2006 72 0 - - - 2007 64 0 - - - 2008 55 0 - - -
2009 55 0 - - - 2010 55 1 * * * 2011 53 0 - - -
2012 41 0 - - - 2013 50 2 * * * Total 31 56.5 31.1 25.4
Upper Yukon 1994 72 2 * * * Salmon Gillnet 1995 73 5 47.2 32.1 15.1
1996 72 2 * * * 1997 72 1 * * *
1998 72 1 * * * 1999 72 1 * * *
2000 72 0 - - - 2001 72 0 - - - 2002 72 0 - - -
2003 72 1 * * * 2004 67 1 * * * 2005 67 1 * * *
2006 66 0 - - - 2007 66 0 - - - 2008 64 0 - - -
2009 61 1 * * *

Table 10. Ages of Emergency Transferors (from) and Transfer Recipients (to) by Permit Type
84 Emergency Transfers of Alaska’s Commercial Fisheries Limited Entry Permits, 1975 ‐ 2013
Number of: Mean Emerg. Ages Differ- Permit Type Year Permits Transfers From To ence Upper Yukon 2010 58 1 * * * Salmoin Gillnet (cont.) 2011 55 0 - - - 2012 52 0 - - - 2013 51 0 - - - Total 17 49.6 33.9 15.6
Upper Yukon 1994 165 2 * * * Salmon Fish Wheel 1995 166 5 60.4 37.3 23.1
1996 165 4 68.5 33.6 34.9 1997 163 3 * * *
1998 162 4 62.9 42.0 20.8 1999 162 1 * * *
2000 161 3 * * * 2001 157 0 - - - 2002 156 1 * * *
2003 157 0 - - - 2004 137 0 - - - 2005 135 1 * * *
2006 128 3 * * * 2007 124 3 * * * 2008 124 2 * * *
2009 122 0 - - - 2010 115 2 * * *
2011 115 2 * * * 2012 106 4 66.3 41.8 24.5 2013 103 2 * * * Total 42 63.6 40.2 23.4
Norton Sound 1994 201 6 50.4 32.0 18.4 Salmon Gillnet 1995 199 11 52.2 32.1 20.1
1996 199 3 * * * 1997 198 7 52.1 38.4 13.7
1998 197 10 45.1 42.5 2.6 1999 194 5 62.4 43.6 18.8
2000 193 6 48.6 34.6 14.1 2001 190 1 * * * 2002 185 0 - - -
2003 180 0 - - - 2004 162 3 * * * 2005 154 1 * * *
2006 154 4 47.4 26.1 21.3 2007 155 3 * * * 2008 167 16 47.6 31.4 16.2
2009 168 12 48.3 25.0 23.3 2010 173 17 49.8 36.6 13.2 2011 178 14 51.9 36.9 15.0
2012 182 14 51.2 32.3 18.9 2013 181 7 59.5 27.8 31.7 Total 140 50.8 33.2 17.5
Norton Sound 1994 9 2 * * * Herring Beach Seine 1995 9 2 * * *
1996 11 1 * * * 1997 10 2 * * *
1998 10 2 * * * 1999 8 2 * * *
2000 8 2 * * * 2001 8 1 * * * 2002 7 0 - - -
2003 6 0 - - - 2004 4 0 - - - 2005 4 0 - - -
2006 4 0 - - - 2007 4 0 - - - 2008 3 0 - - -
2009 5 0 - - -
Number of: Mean Emerg. Ages Differ- Permit Type Year Permits Transfers From To ence Norton Sound 2010 6 0 - - - Herring Beach Seine 2011 6 0 - - - (cont.) 2012 8 0 - - -
2013 8 0 - - - Total 14 50.1 37.1 13.0
Norton Sound 1994 325 15 47.7 34.8 12.9 Herring Gillnet 1995 318 14 49.4 32.1 17.4
1996 327 19 53.4 38.7 14.7 1997 320 13 48.0 27.5 20.5
1998 308 3 * * * 1999 298 19 49.4 36.3 13.2
2000 291 5 53.1 44.2 8.9 2001 286 7 58.8 27.7 31.2 2002 283 5 56.7 37.2 19.5
2003 273 5 58.9 30.1 28.8 2004 259 0 - - - 2005 262 3 * * *
2006 268 3 * * * 2007 255 0 - - - 2008 249 2 * * * 2009 251 1 * * *
2010 257 6 55.4 26.2 29.2 2011 263 6 56.2 26.3 30.0
2012 264 1 * * * 2013 262 3 * * * Total 130 52.1 32.8 19.3
Kotzebue Salmon 1994 215 4 53.6 25.6 28.0 Gillnet 1995 215 3 * * *
1996 214 1 * * * 1997 211 1 * * *
1998 203 2 * * * 1999 197 1 * * *
2000 191 3 * * * 2001 190 3 * * * 2002 186 1 * * *
2003 184 0 - - - 2004 176 3 * * * 2005 173 1 * * *
2006 164 3 * * * 2007 158 4 53.6 26.5 27.1 2008 158 3 * * *
2009 160 6 39.8 31.7 8.1 2010 160 8 49.8 28.3 21.5 2011 161 15 63.8 37.5 26.3
2012 158 8 55.0 37.0 17.9 2013 157 9 65.4 33.6 31.8 Total 79 56.4 33.2 23.2
Notes: 1) Age and birthdate information is confidential. Data is redacted with an asterisk if there are fewer than 4 emergency transfers. 2) Permit fisheries with no emergency transfers are excluded from the table. 3) If the first year in a permit fishery series is after 1994, the year corre-sponds to when limited entry was implemented and permits were first eligible for emergency transfer. 4) ‘Number of permits’ is the sum of permanent and interim-use permits that were eligible for emergency transfer in limited fisheries or in fisheries that were subject to a moratorium on new entrants. If a person held both an interim-use permit and a permanent permit in the same year for a fishery, only the permanent permit is counted. One emergency transfer in 2001 from DCCED is excluded from the totals.

85 Emergency Transfers of Alaska’s Commercial Fisheries Limited Entry Permits, 1975 ‐ 2013
Reasons for Emergency Transfers and Terms of Transfer
Table 11: Emergency Transfer Survey: Reasons Given for Transfers, by Year Table 12: Emergency Transfer Survey: Terms of Remuneration to the Transferor, by Year As detailed in previous sections, emergency transfers allow an entry permit to be temporarily fished by someone other than the permanent permit holder if illness, death, disability, required military or gov‐ernment service, or other unavoidable hardship occurs unexpectedly and temporarily.
Restricting the scope of how permits may be used by someone other than the permanent permit holder is necessary to align provisions for emergency transfers with other statutes that specify that an entry permit should be held only by persons who presently have the ability to participate in the fishery.20 Emergency transfers are intended to provide relief to persons who are actively engaged in a fishery but who are faced with a temporary and unplanned difficulty that prevents them from fishing.
One requirement for the emergency transfer of a permit is for the parties to complete the CFEC form Request for Emergency Transfer of Entry Permit. In completing the transfer form, the applicant must supply detailed and corroborating information that indicates the nature of the emergency. If the reason relates to a medical condition, the applicant must also include a statement from a doctor. Along with the detailed information, one section of the emergency transfer form asks permit holders to select one of eleven categories of “Reason for Transfer”. Table 11 summarizes that information.
An analysis of the survey questions on the emergency transfer form should take into account that each transfer is not only reviewed to ensure that it conforms to the regulations, but is also considered for its situational merits. Specific and unique facts define each transfer, beyond what is summarized by the survey questions. It is not uncommon that in upholding the regulations, licensing staff ask for more in‐formation. It is also common practice for CFEC staff to deny a transfer, but at the same time encourage the permit holder to ask for a review by a hearing officer, where the nuances of the transfer can be more properly considered.
The following are notes that help explain the ”Reasons for Transfer” selections on the emergency trans‐fer form, as summarized in Table 11:
Medical Necessity: Injury or Accident / Illness or Other Health Problem / Pregnancy The combined sum of these causes makes up slightly more than two‐thirds (68%) of the reasons given for emergency transfers. Approximately one‐half (49.7%) of all emergency transfers have been for ill‐nesses or other health problems (including those involving immediate family members). If an immedi‐ate family member requires the care or attention of a permit holder due to an unexpected illness or medical condition, this might constitute grounds for an emergency transfer. Note that “Immediate fami‐ly member” is defined in regulation.21 Accidents or injuries account for another 13.8%, and pregnancy is listed for 3.8% of the emergency transfers.
20 AS 16.43.170. 21 5 AAC 05.1770 (a)(10)

86 Emergency Transfers of Alaska’s Commercial Fisheries Limited Entry Permits, 1975 ‐ 2013
To establish grounds for an emergency transfer due to medical reasons, the transferor must provide a sworn statement from an examining physician indicating the onset of the condition, the diagnosis, and the treatment. This information helps the commission’s review of the transfer request to ensure that the medical condition prevents the permit holder from fishing.
Death of the Permit Holder or of an Immediate Family Member of the Permit Holder The sudden death of a permit holder is grounds for the family or permit holder’s estate to emergency transfer the permit. Permits that are part of an estate may be emergency transferred beyond two years, pending the final disposition of the permit. To authorize continuing transfers in this category, CFEC staff currently requests documentation of the settlement status of the estate. A death of a permit holder’s immediate family member can also be a valid reason for an emergency transfer.
Required Government or Military Service As discussed in previous sections, emergency transfers of this type are authorized by statute. Military and government service are defined in the regulations. Depending upon the specific circumstances, ei‐ther of these reasons might provide the basis for emergency transferring a permit for more than two consecutive years.
Incarceration When a commercial fisherman is convicted of a crime and is sentenced to incarceration, the commission may consider an emergency transfer to prevent economic hardship to the permit holder’s immediate family. Transfers are approved only with the stipulation that all monetary proceeds resulting from the transfer go directly to the needs of the family, and only if the family was supported by fishing income prior to the incarceration. Many transfers in this class involve temporarily passing an entry permit to an adult member of the family ‐ someone who is capable of fishing the permit and using the proceeds to help support dependent family members. Other common examples include using the fishing proceeds to help make child support payments, or to prevent a family permit from falling into foreclosure, or to satisfy a household tax debt. In other cases, the commission may consider granting an emergency transfer to an incarcerated person who has not yet been convicted of a crime.
Financial or Economic Hardship The Economic Hardship category refers to relatively rare cases where an entry permit has been pledged as collateral for a loan through DCCED/CFAB. DCCED and CFAB are the only lending agencies allowed to use entry permits as collateral. If an individual has offered a permit as collateral and falls behind on their loan payments, the lender can initiate foreclosure on the permit. Under these circumstances the commission will consider granting an emergency transfer of the permit, provided that all the monetary proceeds from the transfer are used to help prevent foreclosure on the loan. Before issuing an emer‐gency transfer in this fashion, the commission requires complete documentation of the foreclosure and how the loan payments will be made.
87 Emergency Transfers of Alaska’s Commercial Fisheries Limited Entry Permits, 1975 ‐ 2013
School or Training Mandatory school or training might force a permit holder to temporarily leave a fishery. This situation most commonly applies to minor children who hold permits in family set gillnet operations. The catego‐ry does not apply to elective educational pursuits like college or vocational training for high school grad‐uates.
Other This category is selected by applicants when the reason for their transfer does not have an apparent fit into any of the other listed categories. The most common instance in the ‘Other’ category is when an emergency transfer is used to facilitate the permanent transfer of a permit (ET‐PT). ET‐PTs are discussed in greater detail in the previous section. The ‘Other’ category also includes cases where an individual obtains a permit through a right of survivorship, but they are not prepared to immediately fish the per‐mit or to sell it. Another common scenario that fits this category is when a legal guardian seeks to dis‐pense of a permit on behalf of a permit holder who has become incapacitated.
Working at Alternate Employment and Retirement Although ‘Retirement’ was listed on past emergency transfer forms and ‘Working at Alternate Employ‐ment’ is still on the forms, neither of these reasons, standing alone, would result in an emergency trans‐fer. In fact, ‘Retirement’ is explicitly mentioned in CFEC regulations as a reason that does not justify an emergency transfer.22 Instead, these two reasons were placed on the form to add clarification for the ultimate dispensation of a permit after it is emergency transferred for a valid reason. Either of the selections must be combined with other permissible reasons, such as a temporary medical condition. In Table 11, only the category ‘Working at Alternate Employment’ is listed; it was marked by applicants in very rare instances (17 out of 16,044 emergency transfers). Although ‘Retirement’ was also listed as a selection on the emergency transfer forms for a period of time, it was never actually used ‐ a tally indicates zeros for all years for that particular selection, therefore it is omitted from Table 11.
Terms for Use of the Permit
Table 12 provides statistics on another section of the emergency transfer form, where permit holders select one of seven choices that help document the terms under which the transfer will take place. Generally, leasing the fishing rights associated with a state limited entry permit is prohibited; however, regulations grant an exception for permits that have been emergency transferred.23 The law allows permit holders to receive some form of remuneration if they are forced to temporarily forgo fishing. Regulations protect the permanent permit holder by automatically transferring the permit back into the permanent permit holder’s name at the end of the year or at the end of the fishing season.
22 20 AAC 05.1740 (i)(2)(C). 23 20 AAC.05.1705.
88 Emergency Transfers of Alaska’s Commercial Fisheries Limited Entry Permits, 1975 ‐ 2013
The data indicates the most common form of compensation to the permanent permit holder is a per‐centage of the earnings garnered by the person who temporarily fishes the permit. Flat fees to the permit holder are also common, and the proportion of this type of transaction appears to be increasing. In roughly 1 out of 4 emergency transfers, the permanent holder indicates they do not receive direct monetary compensation from the transfer. It is likely that many of the transactions in that category are tied to emergency transfers among family members.
“No answer given”, as indicated in Table 12 is merely a literal accounting of the check‐boxes on the emergency transfer survey form. In practice, all permit holders must relate the terms of compensation for the transfer. On occasion, the boxes on the form are inadvertently left unchecked (this was especial‐ly prevalent for five years in the 1990’s), but no transfers are actually processed without this infor‐mation, and the terms of the transfer are detailed in ancillary documents in the CFEC files.

89 Emergency Transfers of Alaska’s Commercial Fisheries Limited Entry Permits, 1975 ‐ 2013
Table 11. Emergency Transfer Survey: Reasons Given for Transfers, by Year, 1994 ‐ 2013
Reason for ET of Permit 1994 1995 1996 1997 1998 1999 2000 2001 2002 2003 2004 2005 2006 2007 2008 2009 2010 2011 2012 2013 Total Illness or Other Health Problem 263 463 482 511 502 492 442 404 318 342 339 372 349 356 341 389 430 423 411 338 7,967
52.6% 51.4% 55.7% 55.9% 55.9% 56.0% 50.3% 50.2% 46.4% 49.0% 46.9% 46.9% 45.5% 48.3% 44.8% 46.7% 48.5% 47.6% 49.0% 42.7% 49.7% Injury or Accident 111 118 88 104 80 87 119 107 90 96 87 109 121 93 121 131 137 138 131 151 2,219
22.2% 13.1% 10.2% 11.4% 8.9% 9.9% 13.5% 13.3% 13.1% 13.8% 12.0% 13.7% 15.8% 12.6% 15.9% 15.7% 15.4% 15.5% 15.6% 19.1% 13.8% Pregnancy 22 55 46 38 48 32 33 33 20 14 27 20 25 28 32 27 24 29 32 31 616
4.4% 6.1% 5.3% 4.2% 5.3% 3.6% 3.8% 4.1% 2.9% 2.0% 3.7% 2.5% 3.3% 3.8% 4.2% 3.2% 2.7% 3.3% 3.8% 3.9% 3.8% Death of Permit Holder or 58 134 111 124 119 107 130 91 81 74 78 87 62 72 80 70 90 80 85 74 1,807 Immediate Family Member 11.6% 14.9% 12.8% 13.6% 13.3% 12.2% 14.8% 11.3% 11.8% 10.6% 10.8% 11.0% 8.1% 9.8% 10.5% 8.4% 10.1% 9.0% 10.1% 9.4% 11.3% Government / Military Service 0 2 5 4 5 5 1 1 3 5 8 8 17 10 5 7 4 7 10 13 120
0.0% 0.2% 0.6% 0.4% 0.6% 0.6% 0.1% 0.1% 0.4% 0.7% 1.1% 1.0% 2.2% 1.4% 0.7% 0.8% 0.5% 0.8% 1.2% 1.6% 0.7% Incarceration 17 36 28 28 25 26 21 10 9 11 8 11 17 16 13 23 14 20 11 20 364
3.4% 4.0% 3.2% 3.1% 2.8% 3.0% 2.4% 1.2% 1.3% 1.6% 1.1% 1.4% 2.2% 2.2% 1.7% 2.8% 1.6% 2.3% 1.3% 2.5% 2.3% Financial or Economic Hardship 10 31 28 24 25 28 27 25 14 12 13 7 10 8 7 9 9 4 4 10 305
2.0% 3.4% 3.2% 2.6% 2.8% 3.2% 3.1% 3.1% 2.0% 1.7% 1.8% 0.9% 1.3% 1.1% 0.9% 1.1% 1.0% 0.5% 0.5% 1.3% 1.9% School or Training 1 7 6 5 9 9 11 13 10 10 12 16 13 10 10 8 9 11 12 9 191
0.2% 0.8% 0.7% 0.5% 1.0% 1.0% 1.3% 1.6% 1.5% 1.4% 1.7% 2.0% 1.7% 1.4% 1.3% 1.0% 1.0% 1.2% 1.4% 1.1% 1.2% Other 17 55 71 73 82 88 94 121 139 132 151 163 153 144 152 169 170 176 143 145 2,438
3.4% 6.1% 8.2% 8.0% 9.1% 10.0% 10.7% 15.0% 20.3% 18.9% 20.9% 20.6% 19.9% 19.5% 20.0% 20.3% 19.2% 19.8% 17.0% 18.3% 15.2% Working at Alternate Employment 1 0 0 3 3 5 1 0 2 2 0 0 0 0 0 0 0 0 0 0 17
0.2% 0.0% 0.0% 0.3% 0.3% 0.6% 0.1% 0.0% 0.3% 0.3% 0.0% 0.0% 0.0% 0.0% 0.0% 0.0% 0.0% 0.0% 0.0% 0.0% 0.1%
Total Emergency Transfers 500 901 865 914 898 879 879 805 686 698 723 793 767 737 761 833 887 888 839 791 16,044
Figures in this table summarize data collected from the survey portion of the CFEC emergency transfer form. The survey was first implemented in 1994. During the transition, 431 emergency transfers were processed without surveys, which accounts for the differences in the totals between this table and other tables in this report that summarize all emergency transfers.

90 Emergency Transfers of Alaska’s Commercial Fisheries Limited Entry Permits, 1975 ‐ 2013
Table 12. Emergency Transfer Survey: Terms of Remuneration to the Transferor, by Year, 1994 ‐ 2013
Terms of Transfer 1994 1995 1996 1997 1998 1999 2000 2001 2002 2003 2004 2005 2006 2007 2008 2009 2010 2011 2012 2013 Total Combination of Fee and 19 36 44 37 59 58 42 23 11 11 11 15 19 19 15 14 16 22 20 17 508 Percent 3.8% 4.0% 5.1% 4.0% 6.6% 6.6% 4.8% 2.9% 1.6% 1.6% 1.5% 1.9% 2.5% 2.6% 2.0% 1.7% 1.8% 2.5% 2.4% 2.1% 3.2% Flat Fee 40 103 109 109 71 68 99 86 70 72 91 116 111 150 168 227 256 236 224 258 2,664
8.0% 11.4% 12.6% 11.9% 7.9% 7.7% 11.3% 10.7% 10.2% 10.3% 12.6% 14.6% 14.5% 20.4% 22.1% 27.3% 28.9% 26.6% 26.7% 32.6% 16.6% No Payment to Permit Holder 86 194 139 164 187 195 180 206 219 199 213 174 203 172 202 232 254 256 247 261 3,983
17.2% 21.5% 16.1% 17.9% 20.8% 22.2% 20.5% 25.6% 31.9% 28.5% 29.5% 21.9% 26.5% 23.3% 26.5% 27.9% 28.6% 28.8% 29.4% 33.0% 24.8% Other 126 53 54 59 60 50 93 82 68 88 110 145 126 122 89 75 102 113 105 63 1,783
25.2% 5.9% 6.2% 6.5% 6.7% 5.7% 10.6% 10.2% 9.9% 12.6% 15.2% 18.3% 16.4% 16.6% 11.7% 9.0% 11.5% 12.7% 12.5% 8.0% 11.1% Percentage of Gross Earnings 224 378 302 399 379 372 428 388 312 317 284 310 285 252 247 268 232 239 234 189 6,039
44.8% 42.0% 34.9% 43.7% 42.2% 42.3% 48.7% 48.2% 45.5% 45.4% 39.3% 39.1% 37.2% 34.2% 32.5% 32.2% 26.2% 26.9% 27.9% 23.9% 37.6% Trade 0 0 0 1 1 1 1 0 0 0 0 1 0 0 3 1 1 1 1 0 12
0.0% 0.0% 0.0% 0.1% 0.1% 0.1% 0.1% 0.0% 0.0% 0.0% 0.0% 0.1% 0.0% 0.0% 0.4% 0.1% 0.1% 0.1% 0.1% 0.0% 0.1% No Answer Given 5 137 217 145 141 135 36 20 6 11 14 32 23 22 37 16 26 21 8 3 1,055
1.0% 15.2% 25.1% 15.9% 15.7% 15.4% 4.1% 2.5% 0.9% 1.6% 1.9% 4.0% 3.0% 3.0% 4.9% 1.9% 2.9% 2.4% 1.0% 0.4% 6.6%
Total Emergency Transfers 500 901 865 914 898 879 879 805 686 698 723 793 767 737 761 833 887 888 839 791 16,044 Figures in this table summarize data collected from the survey portion of the CFEC emergency transfer form. The survey was first implemented in 1994. During the transition, 431 emergency transfers were processed without surveys, which accounts for the differences in the totals between this table and other tables in this report that summarize all emergency transfers.
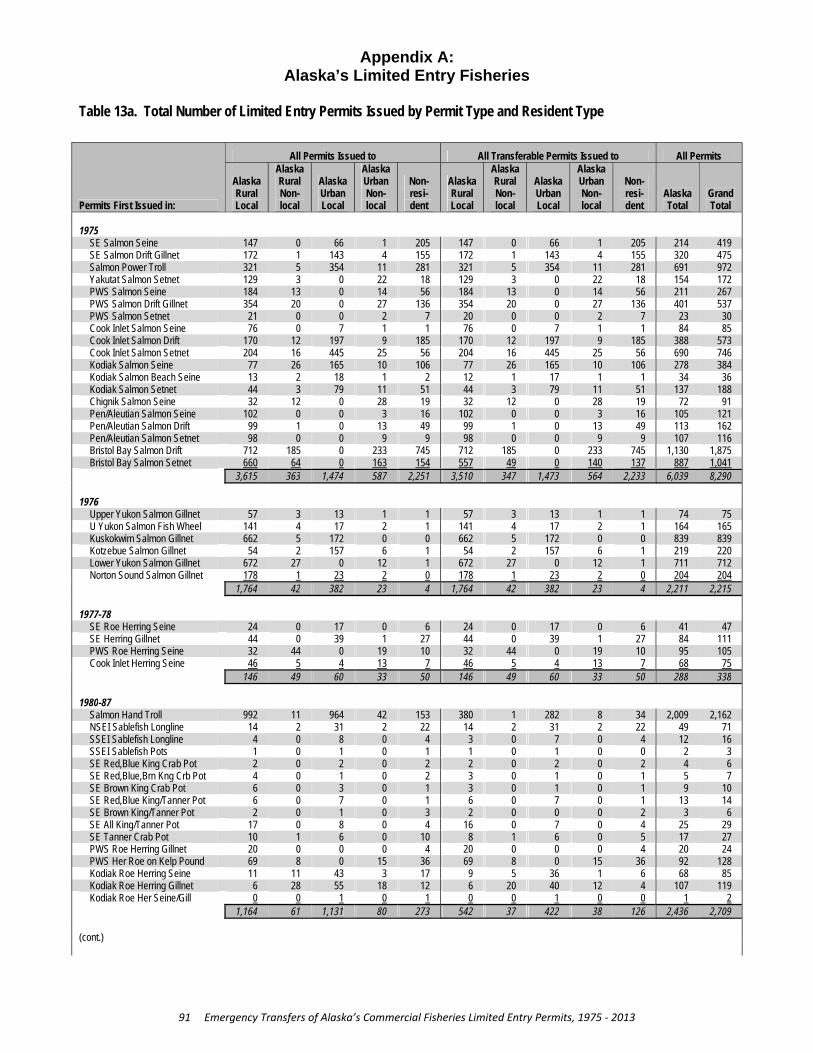
Appendix A: Alaska’s Limited Entry Fisheries
91 Emergency Transfers of Alaska’s Commercial Fisheries Limited Entry Permits, 1975 ‐ 2013
Table 13a. Total Number of Limited Entry Permits Issued by Permit Type and Resident Type
Appendix A Table 13a. Total Number of Limited Entry Permits Issued by Permit Type and Resident Type: Alaska’s Limited Entry Fisheries
Permits First Issued in:
All Permits Issued to All Transferable Permits Issued to All Permits
Alaska Rural Local
Alaska Rural Non-local
Alaska Urban Local
Alaska Urban Non-local
Non- resi-dent
Alaska Rural Local
Alaska Rural Non-local
Alaska Urban Local
Alaska Urban Non-local
Non- resi-dent
Alaska Total
Grand Total
1975
SE Salmon Seine 147 0 66 1 205 147 0 66 1 205 214 419 SE Salmon Drift Gillnet 172 1 143 4 155 172 1 143 4 155 320 475 Salmon Power Troll 321 5 354 11 281 321 5 354 11 281 691 972 Yakutat Salmon Setnet 129 3 0 22 18 129 3 0 22 18 154 172 PWS Salmon Seine 184 13 0 14 56 184 13 0 14 56 211 267 PWS Salmon Drift Gillnet 354 20 0 27 136 354 20 0 27 136 401 537 PWS Salmon Setnet 21 0 0 2 7 20 0 0 2 7 23 30 Cook Inlet Salmon Seine 76 0 7 1 1 76 0 7 1 1 84 85 Cook Inlet Salmon Drift 170 12 197 9 185 170 12 197 9 185 388 573 Cook Inlet Salmon Setnet 204 16 445 25 56 204 16 445 25 56 690 746 Kodiak Salmon Seine 77 26 165 10 106 77 26 165 10 106 278 384 Kodiak Salmon Beach Seine 13 2 18 1 2 12 1 17 1 1 34 36 Kodiak Salmon Setnet 44 3 79 11 51 44 3 79 11 51 137 188 Chignik Salmon Seine 32 12 0 28 19 32 12 0 28 19 72 91 Pen/Aleutian Salmon Seine 102 0 0 3 16 102 0 0 3 16 105 121 Pen/Aleutian Salmon Drift 99 1 0 13 49 99 1 0 13 49 113 162 Pen/Aleutian Salmon Setnet 98 0 0 9 9 98 0 0 9 9 107 116 Bristol Bay Salmon Drift 712 185 0 233 745 712 185 0 233 745 1,130 1,875 Bristol Bay Salmon Setnet 660 64 0 163 154 557 49 0 140 137 887 1,041
3,615 363 1,474 587 2,251 3,510 347 1,473 564 2,233 6,039 8,290 1976
Upper Yukon Salmon Gillnet 57 3 13 1 1 57 3 13 1 1 74 75 U Yukon Salmon Fish Wheel 141 4 17 2 1 141 4 17 2 1 164 165 Kuskokwim Salmon Gillnet 662 5 172 0 0 662 5 172 0 0 839 839 Kotzebue Salmon Gillnet 54 2 157 6 1 54 2 157 6 1 219 220 Lower Yukon Salmon Gillnet 672 27 0 12 1 672 27 0 12 1 711 712 Norton Sound Salmon Gillnet 178 1 23 2 0 178 1 23 2 0 204 204
1,764 42 382 23 4 1,764 42 382 23 4 2,211 2,215 1977-78
SE Roe Herring Seine 24 0 17 0 6 24 0 17 0 6 41 47 SE Herring Gillnet 44 0 39 1 27 44 0 39 1 27 84 111 PWS Roe Herring Seine 32 44 0 19 10 32 44 0 19 10 95 105 Cook Inlet Herring Seine 46 5 4 13 7 46 5 4 13 7 68 75
146 49 60 33 50 146 49 60 33 50 288 338 1980-87
Salmon Hand Troll 992 11 964 42 153 380 1 282 8 34 2,009 2,162 NSEI Sablefish Longline 14 2 31 2 22 14 2 31 2 22 49 71 SSEI Sablefish Longline 4 0 8 0 4 3 0 7 0 4 12 16 SSEI Sablefish Pots 1 0 1 0 1 1 0 1 0 0 2 3 SE Red,Blue King Crab Pot 2 0 2 0 2 2 0 2 0 2 4 6 SE Red,Blue,Brn Kng Crb Pot 4 0 1 0 2 3 0 1 0 1 5 7 SE Brown King Crab Pot 6 0 3 0 1 3 0 1 0 1 9 10 SE Red,Blue King/Tanner Pot 6 0 7 0 1 6 0 7 0 1 13 14 SE Brown King/Tanner Pot 2 0 1 0 3 2 0 0 0 2 3 6 SE All King/Tanner Pot 17 0 8 0 4 16 0 7 0 4 25 29 SE Tanner Crab Pot 10 1 6 0 10 8 1 6 0 5 17 27 PWS Roe Herring Gillnet 20 0 0 0 4 20 0 0 0 4 20 24 PWS Her Roe on Kelp Pound 69 8 0 15 36 69 8 0 15 36 92 128 Kodiak Roe Herring Seine 11 11 43 3 17 9 5 36 1 6 68 85 Kodiak Roe Herring Gillnet 6 28 55 18 12 6 20 40 12 4 107 119 Kodiak Roe Her Seine/Gill 0 0 1 0 1 0 0 1 0 0 1 2
1,164 61 1,131 80 273 542 37 422 38 126 2,436 2,709 (cont.)
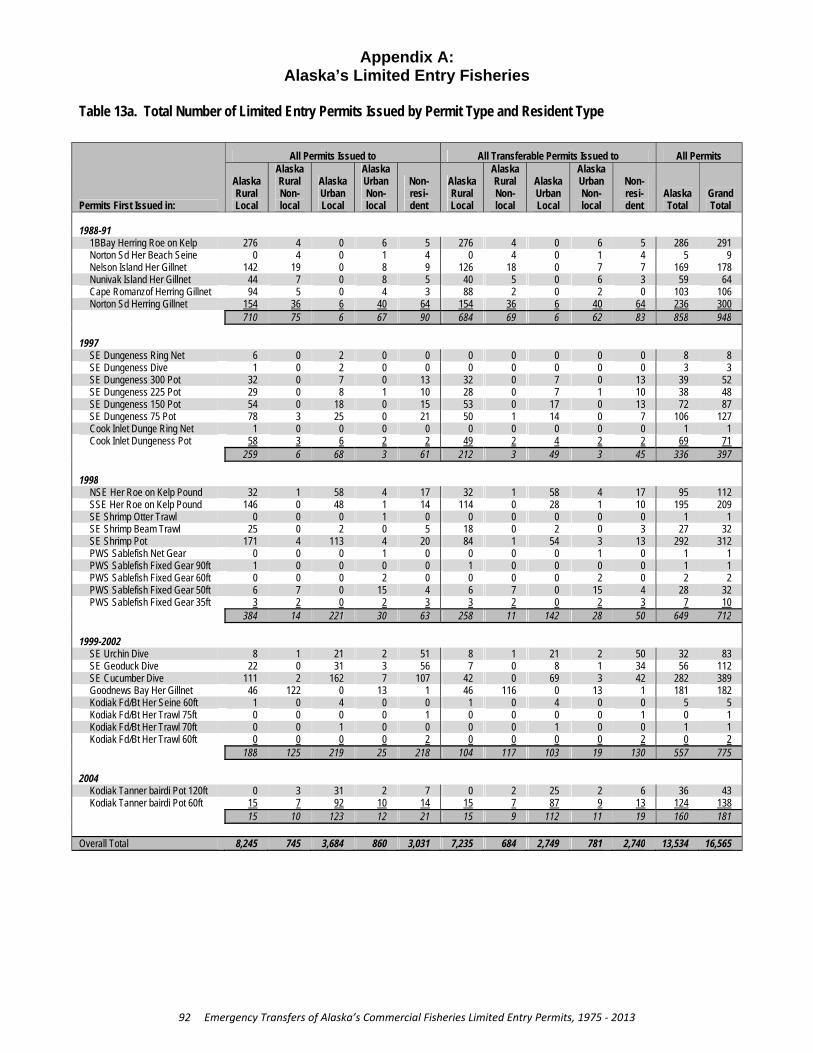
Appendix A: Alaska’s Limited Entry Fisheries
92 Emergency Transfers of Alaska’s Commercial Fisheries Limited Entry Permits, 1975 ‐ 2013
Table 13a. Total Number of Limited Entry Permits Issued by Permit Type and Resident Type
Appendix A Table 13a. Total Number of Limited Entry Permits Issued by Permit Type and Resident Type: Alaska’s Limited Entry Fisheries
Permits First Issued in:
All Permits Issued to All Transferable Permits Issued to All Permits
Alaska Rural Local
Alaska Rural Non-local
Alaska Urban Local
Alaska Urban Non-local
Non- resi-dent
Alaska Rural Local
Alaska Rural Non-local
Alaska Urban Local
Alaska Urban Non-local
Non- resi-dent
Alaska Total
Grand Total
1988-91
1BBay Herring Roe on Kelp 276 4 0 6 5 276 4 0 6 5 286 291 Norton Sd Her Beach Seine 0 4 0 1 4 0 4 0 1 4 5 9 Nelson Island Her Gillnet 142 19 0 8 9 126 18 0 7 7 169 178 Nunivak Island Her Gillnet 44 7 0 8 5 40 5 0 6 3 59 64 Cape Romanzof Herring Gillnet 94 5 0 4 3 88 2 0 2 0 103 106 Norton Sd Herring Gillnet 154 36 6 40 64 154 36 6 40 64 236 300
710 75 6 67 90 684 69 6 62 83 858 948 1997
SE Dungeness Ring Net 6 0 2 0 0 0 0 0 0 0 8 8 SE Dungeness Dive 1 0 2 0 0 0 0 0 0 0 3 3 SE Dungeness 300 Pot 32 0 7 0 13 32 0 7 0 13 39 52 SE Dungeness 225 Pot 29 0 8 1 10 28 0 7 1 10 38 48 SE Dungeness 150 Pot 54 0 18 0 15 53 0 17 0 13 72 87 SE Dungeness 75 Pot 78 3 25 0 21 50 1 14 0 7 106 127 Cook Inlet Dunge Ring Net 1 0 0 0 0 0 0 0 0 0 1 1 Cook Inlet Dungeness Pot 58 3 6 2 2 49 2 4 2 2 69 71
259 6 68 3 61 212 3 49 3 45 336 397 1998
NSE Her Roe on Kelp Pound 32 1 58 4 17 32 1 58 4 17 95 112 SSE Her Roe on Kelp Pound 146 0 48 1 14 114 0 28 1 10 195 209 SE Shrimp Otter Trawl 0 0 0 1 0 0 0 0 0 0 1 1 SE Shrimp Beam Trawl 25 0 2 0 5 18 0 2 0 3 27 32 SE Shrimp Pot 171 4 113 4 20 84 1 54 3 13 292 312 PWS Sablefish Net Gear 0 0 0 1 0 0 0 0 1 0 1 1 PWS Sablefish Fixed Gear 90ft 1 0 0 0 0 1 0 0 0 0 1 1 PWS Sablefish Fixed Gear 60ft 0 0 0 2 0 0 0 0 2 0 2 2 PWS Sablefish Fixed Gear 50ft 6 7 0 15 4 6 7 0 15 4 28 32 PWS Sablefish Fixed Gear 35ft 3 2 0 2 3 3 2 0 2 3 7 10
384 14 221 30 63 258 11 142 28 50 649 712 1999-2002
SE Urchin Dive 8 1 21 2 51 8 1 21 2 50 32 83 SE Geoduck Dive 22 0 31 3 56 7 0 8 1 34 56 112 SE Cucumber Dive 111 2 162 7 107 42 0 69 3 42 282 389 Goodnews Bay Her Gillnet 46 122 0 13 1 46 116 0 13 1 181 182 Kodiak Fd/Bt Her Seine 60ft 1 0 4 0 0 1 0 4 0 0 5 5 Kodiak Fd/Bt Her Trawl 75ft 0 0 0 0 1 0 0 0 0 1 0 1 Kodiak Fd/Bt Her Trawl 70ft 0 0 1 0 0 0 0 1 0 0 1 1 Kodiak Fd/Bt Her Trawl 60ft 0 0 0 0 2 0 0 0 0 2 0 2
188 125 219 25 218 104 117 103 19 130 557 775 2004
Kodiak Tanner bairdi Pot 120ft 0 3 31 2 7 0 2 25 2 6 36 43 Kodiak Tanner bairdi Pot 60ft 15 7 92 10 14 15 7 87 9 13 124 138
15 10 123 12 21 15 9 112 11 19 160 181 Overall Total 8,245 745 3,684 860 3,031 7,235 684 2,749 781 2,740 13,534 16,565

Appendix B: CFEC Emergency Transfer Regulations
93 Emergency Transfers of Alaska’s Commercial Fisheries Limited Entry Permits, 1975 ‐ 2013
Appendix B: CFEC Emergency Transfer Regulations
20 AAC 05.1740. Emergency transfers. Appendix B: CFEC Emergency Transfer Regulations (a) A holder of an entry permit or interim-use permit in a limited fishery or a fishery subject to a moratorium
may apply for an emergency transfer of the entry or interim-use permit to another person by making application to the commission on a form provided by the commission.
(b) The commission will grant an emergency transfer of an entry permit if the proposed transferee is not a
permit holder in the fishery and is presently able to participate actively in the fishery, and if it is established that illness, disability, death, required military or government service, or other unavoidable hardship of a temporary, unexpected, and unforeseen nature prevents the transferor from participating in the fishery. If the entry permit is not transferable under AS 16.43.170(e), the emergency transfer will be granted only to allow the continued opera-tion of the transferor's vessel or setnet site and fishing gear. Temporary emergency transfer of an interim-use per-mit issued under AS 16.43.210(b), 16.43.225, or 16.43.227 or of a permit held by an estate will be granted by the commission to alleviate hardship. Temporary emergency transfer of an interim-use permit in an unlimited fishery issued under AS 16.43.210(a), will be granted by the commission if reasonably necessary in order for the fishing operation to continue until another permit may be obtained.
(c) Where illness, disability, or death precludes communication by the transferor, the commission will, in its
discretion, authorize the emergency transfer of an entry permit or interim-use permit upon application by a per-son other than the transferor.
(d) Unless otherwise limited by the commission, an emergency transfer is effective until the emergency is
over, or until the end of the season, or until the transferor submits a request that the permit be returned, whichev-er occurs first.
(e) The proposed transferor and transferee of an emergency transfer under this section shall provide infor-
mation and executed releases for information the commission determines is reasonably necessary to establish the basis upon which the emergency transfer is requested. Sufficient proof to verify the basis of the transfer must be submitted when the transfer request is made.
(f) Repealed 1/29/82.
(g) Where illness, disability or other unavoidable hardship, as described in (c) of this section, began or death
occurred within 14 days immediately preceding the mailing date of a properly completed Request for Emergency Transfer of Permit form, the commission or an agent of the commission may certify the application as complete by dating and signing the form. The commission agent will not certify the form as complete unless the form is accompanied by an envelope addressed to the commission with adequate postage. The proposed emergency transferee may fish with the carbon copy of the form for no more than 14 days following the date the form was certified as complete, unless extended by the commission. Upon approval of the request for emergency transfer, the commission will issue a temporary permit card to the emergency transferee. Upon denial of the request, the commission will notify the permit holder and proposed transferee of its decision and of the fact that fishing with the carbon copy of the application form is no longer authorized.
(h) A proposed emergency transferee of a permit may not fish with a carbon copy of a Request for
Emergency Transfer of Permit form if the
(1) form has not been signed and dated by an agent of the commission;
(2) request is based on a circumstance, described in (b) of this section, that arose more than 14 days be-fore the form is received by the commission;
(3) annual permit renewal form and fee have not been received and processed by the commission.

Appendix B: CFEC Emergency Transfer Regulations
94 Emergency Transfers of Alaska’s Commercial Fisheries Limited Entry Permits, 1975 ‐ 2013
(i) If the commission grants an emergency transfer and the basis for the emergency transfer continues at the time the transferor applies for an emergency transfer for the following season, the commission will grant an emer-gency transfer for that following season. For subsequent seasons, the commission will grant an emergency transfer only upon a showing by the permit holder of
(1) a new unavoidable hardship of an unexpected and unforeseen nature that prevents the permit hold-er from fishing; or
(2) a continuation of the basis for the first emergency transfer in addition to extraordinary circumstances; for purposes of this paragraph, "extraordinary circumstances" are circumstances beyond the control of the permit holder that can be addressed by granting an emergency transfer, such as
(A) the failure of a good faith attempt to participate in the fishery;
(B) a realistic intent to return to the fishery within a reasonable period of time after the first emergency transfer based upon a high probability of removal of the disability or unavoidable hardship that gave rise to the first emergency transfer; or
(C) an intent to permanently transfer the permit that cannot presently be fulfilled in spite of substantial, good faith efforts to do so; "extraordinary circumstances" do not include the effects of economic, biological, or regulatory variable that are normally part of the risk of doing business as a fisherman, such as an economic choice, retirement from the fishery, permanent illness or disability, or lack of a market for the sale of a permit.
(j) The transferor may revoke an emergency transfer at any time by submitting to the commission or an agent of the commission
(1) a completed Request for Return of Original Permit Card form provided by the commission; and
(2) the permit card.
(k) A permittee may not fish with a copy of the Request for Return of Original Permit Card form unless the form has been submitted to the commission through an agent of the commission, and that agent has certified the application as complete by dating and signing the form. A permittee may submit to the commission an otherwise properly completed Request for Return of Original Permit Card form that is not signed and dated by an agent; however a copy of the form may not be retained for fishing.
(l) For the purposes of receiving and certifying as complete a Request for Emergency Transfer of Permit form and a Request for Return of Original Permit Card form, an employee of the Department of Fish and Game or of the Department of Public Safety, division of fish and wildlife protection, is an agent of the commission. (Eff. 12/18/74, Register 52; am 12/27/79, Register 72; am 5/15/81, Register 77; am 1/29/82, Register 81; am 10/30/82, Register 84; am 6/5/83, Register 86; am 2/29/84, Register 89; am 5/20/90, Register 114; am 1/2/92, Register 121; am 7/3/94, Register 130; am 12/29/2000, Register 156, am 11/20/2009, Register 192; am 12/31/2010, Register 196)
Authority: AS 16.43.100 AS 16.43.180 AS 16.43.227 AS 16.43.110 AS 16.43.225