EMERGENCY MEDICAL SERVICES SYSTEM QUALITY … · PSAP(s) EMS Dispatch Center(s) Constituent Groups...
47
Page 1 EMSA #166 Rev. 3/04 EMERGENCY MEDICAL SERVICES SYSTEM QUALITY IMPROVEMENT PROGRAM MODEL GUIDELINES
Transcript of EMERGENCY MEDICAL SERVICES SYSTEM QUALITY … · PSAP(s) EMS Dispatch Center(s) Constituent Groups...

Page 1
EMSA #166 Rev. 3/04
EMERGENCY MEDICAL SERVICES SYSTEM QUALITY IMPROVEMENT
PROGRAM MODEL GUIDELINES
Page 2
TABLE OF CONTENTS SECTION I STRUCTURE.........................................................................................................5 A. State Emergency Medical Services Authority ....................................................................5 B. Local Emergency Medical Services Agency ......................................................................7 C. Base Hospital/Alternate Base Station Providers................................................................8 D. Emergency Medical Service Provider ..............................................................................10 SECTION II DATA COLLECTION & REPORTING ................................................................13 A. Data Collection.................................................................................................................13 B. Approach to Data System Development ..........................................................................13 C. Organizational Reporting .................................................................................................14 SECTION III EVALUATION OF EMS SYSTEM INDICATORS ..............................................15 Organization Structure .........................................................................................................15 Indicators Defined ................................................................................................................15 Analysis................................................................................................................................16 Presentation .........................................................................................................................16 Decision-Making Process.....................................................................................................16 SECTION IV ACTION TO IMPROVE.....................................................................................17 Approach to Performance Improvement...............................................................................17 Technical Advisory Group ....................................................................................................17 Quality Task Force ...............................................................................................................17 Performance Improvement Action........................................................................................17 SECTION V TRAINING AND EDUCATION ...........................................................................18 Annual Update Guidelines......................................................................................................19 APPENDIX A Self-Assessment and Action Planning ......................................................... A - 1 APPENDIX B 2001 Health Care Criteria for Performance Excellence, Baldridge National Quality Program Core Values and Concepts ....................................... B - 1 APPENDIX C Organizational Structure .............................................................................. C - 1 APPENDIX D Flow of Information and Activity................................................................... D - 1 APPENDIX E Indicator Categories..................................................................................... E - 1 APPENDIX F Development of Standardized EMS Quality Indicators ................................ F - 1 APPENDIX G Indicator Detail Sheet ..................................................................................G - 1 APPENDIX H Models .........................................................................................................H - 1 APPENDIX I Plan-Do-Study Act...........................................................................................I - 1 APPENDIX J Rapid Cycle Improvement .............................................................................J - 1 APPENDIX K Definitions of Common Data Measurements ............................................... K - 1

Page 3
APPENDIX L Presentation of EMS System Indicators ........................................................L - 1 APPENDIX M Quality Improvement Sample Indicators..………………………………………M - 1 Glossary of Terms................................................................................................................245

Page 4
EMERGENCY MEDICAL SERVICES SYSTEM QUALITY IMPROVEMENT PROGRAM MODEL GUIDELINES
“The ability of EMS to optimally meet communities and individual patients’ needs in the future is dependent on evaluation processes that assess and improve the quality of EMS. Continuous evaluation is essential and should pervade all aspects of every EMS system.”
Theodore R. Delbridge MD, MPH PURPOSE The purpose of these guidelines is to provide a model for the development and implementation of a Quality Improvement Program for the delivery of EMS for EMS service providers, the local EMS agencies (LEMSA), Base Hospitals/Alternate Base Stations, the EMS Authority (EMSA), and their respective personnel. This is a model program, which will develop over time with individual variances based on available resources. BACKGROUND Governmental decision makers, sponsors, and consumers need objective evidence that they are receiving value and quality for the cost of EMS. The statewide EMS system and its participants require objective feedback about performance that can be used internally to support quality improvement efforts and externally to demonstrate accountability to the public governing boards and other stakeholders. The primary goal of each EMS QI Program shall be to ensure continued high quality of patient care. GUIDELINES The EMS QI Program guidelines were developed to assist EMS professionals in the development and implementation of a program addressing the following components:
Organizational structure Data collection and reporting Evaluation of EMS system indicators Methods for improvement Training and education
Before implementing the guidelines, any participant in the EMS system can benefit from creating an organization profile and conducting a self-assessment using the Baldrige Criteria for Performance Excellence (Appendix A). The 2001 Health Care Criteria for Performance Excellence of the Baldrige National Quality Program should also be reviewed as they provide core values and concepts for an EMS QI Program (Appendix B).

Page 5
SECTION I STRUCTURE
Organizational Structure The EMS organizational structure is defined by statute and regulation. There are four distinct levels identified (Appendix C):
The State Emergency Medical Services Authority (EMSA) Local Emergency Medical Services Agencies (LEMSAs) Base Hospitals/Alternate Base Stations EMS Service Providers
Organizations at these four levels have demonstrated an effective network capable of providing patient care in the prehospital setting through the implementation and management of existing programs. Levels should be mutually dependent on each other for an EMS QI Program to be successful. While each level has defined roles and responsibilities in achieving its program goals, there is also a shared responsibility with all other levels in achieving EMS system goals. The four organizational levels are described as follows: A. State Emergency Medical Services Authority Responsible Agency Emergency Medical Services Authority The Health and Safety Code Division 2.5 states: 1797.103. The EMSA shall develop planning and implementation guidelines for emergency medical services systems which address the following components: (a) Manpower and training (b) Communications (c) Transportation (d) Assessment of hospitals and critical care centers (e) System organization and management (f) Data collection and evaluation (g) Public information and education (h) Disaster response 1797.174. In consultation with the commission, the Emergency Medical Directors Association of California, and other affected constituencies, the EMSA shall develop statewide guidelines for continuing education courses and approval for continuing education courses for EMT-Ps and for quality improvement systems which monitor and promote improvement in the quality of care provided by EMT-Ps throughout the state. Structure The State EMS QI Program should consist of a team within the EMSA. The team’s organizational chart should reflect the integration of the EMS QI Program into the EMSA. There should be: 1. An EMS QI Team, under the direction of the EMSA Director. Members of the State EMS QI
Team should have expertise in administration and management of state/local EMS systems and local EMS QI Programs, especially in the following areas: EMS Evaluation and Quality Improvement Data Systems
Page 6
Biostatistics Clinical Aspects of EMS
2. A Technical Advisory Group with statewide representation to include but not be limited to:
LEMSA Administrator(s) or designee LEMSA Medical Director(s) EMS Service Provider Medical Director(s) EMS Educator(s) EMS Receiving Facilities EMS Personnel EMS Service Provider EMS QI Program Representative(s) Public Representative(s)
3. The Technical Advisory Group will seek and maintain relationships with all EMS participants including but not limited to: Local EMS Agencies EMS Service Provider(s) EMS Receiving Facilities Base Hospital(s) EMS Dispatch Center(s) Labor and Management Local Department of Health Law Enforcement Primary System Answering Point(s) (PSAP(s)) Constituent Group(s) Specialty Center(s) Poison Control Public Organization(s)
Responsibilities The State EMS QI Team will be the central repository of statewide EMS system information as it relates to EMS QI Program activities. Under the direction of the EMSA Director and advice from the State EMS QI Program Technical Advisory Group, the State EMS QI Team will perform the following functions (Appendix D):
Carry out the responsibilities of the statewide EMS QI Program Coordinate the development, approval, and implementation of state required EMS
system indicators Coordinate the development, approval, and implementation of state optional EMS
system indicators Monitor, collect data on and evaluate data on state required and optional EMS system
indicators Provide a recommended format for reporting required and optional EMS system
indicators Organize, analyze, and report feedback to participating agencies using state EMS
system indicators Re-evaluate, expand upon and improve state EMS system indicators annually or as
needed Facilitate meetings and presentations on state EMS system indicators with designated
advisory groups and other stakeholders for the purpose of system and patient care improvement

Page 7
Establish a mechanism to incorporate input from the local EMS agencies, providers and other EMS system participants for the development of performance improvement plans
Assure reasonable availability of EMS QI Program training and in-service education for EMS personnel under the statewide EMS QI Program
Prepare plans for improving the State EMS QI Program Provide technical assistance for facilitating the LEMSAs’ EMS QI Program Protect confidentiality/integrity of data (patient and personnel) Regularly review and revise the EMS QI Program Model Guidelines as needed with EMS
constituent input
Annual Reports The State EMS QI Team will annually publish summary reports of activity and plan implementation with national and local distribution. B. Local Emergency Medical Services Agency Responsible Agency Local Emergency Medical Services Agency The Health and Safety Code Division 2.5 states: 1797.204 The local EMS agency shall plan, implement, and evaluate an emergency medical services system, in accordance with the provisions of this part, consisting of an organized pattern of readiness and response services based on public and private agreements and operational procedures. Structure The LEMSA EMS QI Team should be reflected on the LEMSA organization chart. There should be: 1. An EMS QI team under the direction of the LEMSA administration. The team should have education and experience in evaluation of EMS data system, and EMS QI Program management. Note: Availability of resources can vary greatly between urban and rural agencies. It is understood that there are variances in staffing and staff responsibilities. 2. The Technical Advisory Group should be multidisciplinary and may include, but not be
limited to: LEMSA Medical Director LEMSA Representative EMS Service Provider Medical Director(s) EMS Provider EMS QI Program Coordinator(s) EMS Educator(s) Base Hospital Representative(s) Representative(s) from local receiving facilities emergency department physicians Representatives from Basic Life Support (BLS) and Advanced Life Support (ALS)
certified/licensed personnel accredited within the LEMSA Public representative(s)
3) The Technical Advisory Group will seek and maintain relationships with all EMS participants including but not limited to: State EMSA Other LEMSAs

Page 8
EMS Service Provider(s) Local Department of Health Specialty Care Center(s) Law Enforcement PSAP(s) EMS Dispatch Center(s) Constituent Groups
Responsibilities The LEMSA EMS QI Team should be the central repository of local or regional EMS system information as it relates to EMS QI Program activities. The team should perform the following functions:
Cooperate with the EMSA in carrying out the responsibilities of statewide EMS QI Program and participate in the EMSA Technical Advisory Group
Cooperate with the EMSA in the development, approval, and implementation of state required EMS system indicators
Cooperate with the EMSA in the development, approval, and implementation of state optional EMS system indicators
Maintain responsibility for monitoring, collecting data on, reporting on, and evaluating state required and optional EMS System indicators from the EMS providers and hospitals within the jurisdiction of the LEMSA
Identify and develop LEMSA specific indicators for system evaluation, based on components listed in Appendix E
Maintain responsibility for monitoring, collecting data on, and evaluating locally identified indicators
Re-evaluate, expand upon, and improve state EMS system indicators and locally developed indicators annually or as needed
Facilitate meetings and presentations on LEMSA indicators and the development of performance improvement plans for review by designated EMS providers
Establish a mechanism to incorporate input from EMS provider advisory groups for the development of performance improvement plans
Assure reasonable availability of EMS QI Program training and in-service education for EMS personnel under the statewide EMS QI Program
Prepare plans for improving the LEMSAs’ EMS QI Program Provide technical assistance for facilitating the EMS QI Programs of all organizations
participating in the LEMSA EMS QI Program Annual Reports The LEMSA EMS QI Team will annually publish a summary of activity and plan implementation for distribution. C. Base Hospital/Alternate Base Station Responsible Agency Base Hospital/Alternate Base Station Authority: Health and Safety Code Division 2.5 states: 1798.100. In administering the EMS system, the local EMS agency, with the approval of its medical director, may designate and contract with hospitals or other entities approved by the medical director of the local EMS agency pursuant to Section 1798.105 to provide medical

Page 9
direction of prehospital emergency medical care personnel, within its area of jurisdiction, as either base hospitals or alternative base stations, respectively. Hospitals or other entities so designated and contracted with as base hospitals or alternative base stations shall provide medical direction of prehospital emergency medical care provided for the area defined by the local EMS agency in accordance with policies and procedures established by the local EMS agency and approved by the medical director of the local EMS agency pursuant to Sections 1797.220 and 1798. 1798.101. (a) In rural areas, as determined by the EMSA, where the use of a base hospital having a basic emergency medical services special permit pursuant to subdivision (c) of Section 1277 is precluded because of geographic or other extenuating circumstances, a local EMS agency, in order to assure medical direction to prehospital emergency medical care personnel, may utilize other hospitals which do not have a basic emergency medical service permit but which have been approved by the medical director of the local EMS agency for utilization as a base hospital, if both of the following apply: (1) Medical control is maintained in accordance with policies and procedures established by the local EMS agency, with the approval of the medical director of the local EMS agency. (2) Approval is secured from the EMSA. The Base Hospital’s EMS QI Program should involve all EMS system participants including but not limited to dispatch agencies, ALS and BLS EMS service providers, receiving hospitals, and specialty care centers. Structure The Base Hospital/Alternate Base Station EMS QI Program should be a program reviewed by the LEMSA for compatibility with the EMS QI Program guidelines. The organizational chart should reflect the integration of the EMS QI Program in the organization. There should be: 1. An EMS QI Team under the direction of the Base Hospital/Alternate Base Station medical director. Lead staff should have expertise in management of the base hospital’s EMS QI Program. The following staffing positions are identified (note: organizations with limited resources may combine positions):
Base Hospital/Alternate Base Station Medical Director (or designee) EMS QI Program Coordinator Data Specialist
Note: Availability of resources can vary greatly between urban and rural facilities. It is understood that there are variances in staffing and staff responsibilities. 2. An internal EMS QI Program Technical Advisory Group with members, which include but are not limited to:
Base Hospital Medical Director Prehospital Liaison or Equivalent Base Hospital and EMS Service Provider Personnel (Physicians, RNs, Paramedics,
EMTs) Cooperation and interaction with all EMS system participants should include but not be limited to:
State EMSA LEMSA Other Base Hospital(s) Receiving Facilities Local Department of Health Law Enforcement

Page 10
PSAP(s) Community Group(s) Non-EMS Public Representative(s) EMS Provider(s)
Responsibilities The Base Hospital EMS QI Team should be a primary source of EMS activity reporting for statewide and local EMS system indicators. The Base Hospital EMS QI Program will perform the following functions:
Cooperate with the LEMSA in carrying out the responsibilities of the LEMSA EMS QI Program and participate in the LEMSA Technical Advisory Group
Cooperate with the LEMSA in the implementation of state required EMS system indicators
Cooperate with the LEMSA in the implementation of state optional EMS system indicators
Cooperate with the LEMSA in monitoring, collecting data on, and evaluating state required and optional EMS system indicators
Cooperate with the LEMSA in monitoring, collecting data on, and evaluating local/regional EMS system indicators
Cooperate with the EMSA and LEMSAs in the re-evaluation and improvement of state and local EMS system indicators
Identify and develop base hospital indicators for system evaluation based on components listed in Appendix E
Participate in meetings for internal review of base hospital indicators and development of performance improvement plans related to the findings
Establish a mechanism to incorporate input from the LEMSA, service providers, and other hospitals for the development of performance improvement plans
Assure reasonable availability of EMS QI Program training and in-service education for base hospital personnel
Prepare plans for expanding or improving the Base Hospital EMS QI Program Facilitate meetings and presentations of state and local EMS system indicators for peer
review to local designated advisory groups and other authorized constituents Provide technical assistance to all EMS QI Programs in the base hospital’s jurisdiction
Annual Updates The Base Hospital EMS QI Team will annually publish summary reports of EMS QI Program activity with distribution. D. Emergency Medical Service Provider Level Responsible Agency EMS Service Providers The EMS Provider’s EMS QI Program should involve EMS system participants including but not limited to dispatch agencies, the LEMSA, EMS personnel training programs, hospitals, specialty care centers, and other EMS service providers. A regional approach, with collaboration between EMS service providers serving neighboring communities, is highly recommended.

Page 11
Structure The EMS Provider EMS QI Program should be reviewed by the LEMSA for compatibility with the EMSA EMS QI Program guidelines. The organizational chart should reflect the integration of the EMS QI Program in the organization. There should be: 1. An EMS QI Team under the direction of the EMS Provider medical director or EMS administrator. Lead staff should have expertise in management of the EMS provider’s EMS QI Program. The following staffing positions are identified (organizations with limited resources may combine positions):
Provider Medical Director or Designee EMS QI Program Coordinator Data Specialist
Note: Availability of resources can vary greatly between urban and rural agencies. It is understood that there are variances in staffing and staff responsibilities. 2. An internal EMS QI Program Technical Advisory Group with members which include but are not limited to:
Medical Director (Provider Medical Director or alternatively the LEMSA Medical Director) Chief/Administrator or designee EMS QI Program Coordinator Service Personnel (Physicians, RNs, Paramedics, EMTs) Other system participants
3. Cooperation with all EMS participants should include but not limited to: State EMSA LEMSA Other EMS Provider(s) Base and Receiving Facilities Local Department of Health Law Enforcement PSAP(s) Community Group(s) Non-EMS Public representative(s) EMS Dispatch Center(s)
Responsibilities The EMS Provider’s EMS QI Program Technical Advisory Group should be the primary source of EMS QI Program activity reporting for statewide and local EMS System information. The EMS Provider’s EMS QI Program Technical Advisory Group will perform the following functions:
Cooperate with the LEMSA in carrying out the responsibilities of the LEMSA’s EMS QI Program and participate in the LEMSA Technical Advisory Group
Cooperate with the LEMSA in the implementation of state required EMS system indicators
Cooperate with the LEMSA in the implementation of state optional EMS system indicators
Cooperate with the local EMS agency in monitoring, collecting data on, and evaluating state required and optional EMS system indicators
Cooperate with the local EMS agency in monitoring, collecting data on, and evaluating local/regional EMS system indicators

Page 12
Cooperate in the re-evaluation and improvement of state and local EMS system indicators
Develop, monitor, collect data on, and evaluate indicators specific to the EMS provider as needed (See Appendix E)
Conduct meetings for internal review of EMS provider information and development of performance improvement plans related to the findings
Establish a mechanism to receive input from the local EMS agency, other service providers and other EMS system participants for the development of performance improvement plans
Assure reasonable availability of EMS QI Program training and in-service education for EMS provider personnel
Prepare plans for expanding or improving the EMS Provider EMS QI Program Participate in meetings and presentations of state and local EMS system information for
peer review to local designated advisory groups and other authorized constituents Annual Updates The EMS Provider EMS QI Team will annually publish summary reports of EMS QI Program activity for distribution.

Page 13
SECTION II DATA COLLECTION & REPORTING
Purpose To improve the EMS system, information must first be collected, reported, and evaluated. The following are guidelines for data collection and reporting of EMS information. A. Data Collection Aspects of care which are identified as important should be monitored despite the possible complexity of necessary data or challenges associated with the data collection. All reliable sources of information should be utilized in the evaluation of system performance. EMS organizations should also consider the use of hard copy review, collection check-sheets, customer surveys, direct observation, and skills simulation. B. Approach to Data System Development Information systems should be designed to answer EMS system performance questions. It is strongly recommended that EMS organizations establish a practical consensus and clear understanding with all users regarding the purpose for collecting and processing the data. This step is vital to assure validity and reliability. The following activities are recommended prior to data systems development:
1. Identify the specific mission and purpose of the organization 2. Identify the most important services that support the mission and purpose 3. Identify the resources, activities, and results that comprise the services 4. Identify what information must be reported to others, such as LEMSAs or the state
EMSA 5. Identify specific questions (regarding the structures, activities, and outcomes within your
organization), which need to be answered in order to better understand the success of the mission and purpose
6. Define how each question will be answered 7. Use the answers as the basis for developing indicators 8. Develop a quality indicator 9. Use the indicators as the basis for identifying what data is needed 10. Develop your technical plan for data collection based upon the elements identified 11. Test the process prior to investing in a data system 12. Recognize that an effective EMS QI Program is dynamic and therefore constantly
changing, and incorporate this need for change into your data vendor contract (if applicable) and/or your data management plan
The California State EMS data set (with associated definitions) should be incorporated to allow for statewide data collection. Statewide EMS system indicators provide for comparative analysis between similar EMS providers/LEMSAs as well as statewide system evaluation. Additional data elements and code sets should be collected at a local level to focus on regional issues and concerns. The National EMS Information System (NEMSIS) data set (with associated definitions) may provide consistent data collection with these additional data elements.
Page 14
Validity and Reliability Validity - The data have validity if there is sufficient evidence to warrant the collection and use of the information for the purpose of measuring the performance of the EMS system. The information is valid if it is: • Representative of important aspects of service performance • Determined to be important for successful service performance • Predictive of or significantly correlated with important elements of performance Reliability – The data have reliability if the collection and interpretation methods can be trusted to be consistent and predictable. If the data collection is always performed in the same way, using the same data collection tools and interpreted with the same definitions, the information is likely to be reliable. Standardized definitions or agreement by the users regarding what the data will indicate and how they will be collected is critical to the success of the overall program. C. Organizational Reporting Data collection, reporting, and analysis shall occur at each of the four organizational levels. Each level shall submit information to their respective advisory group. Data collection and reporting should be done in the form of summary reports and may be based upon core EMS system indicators as adopted by the State EMSA, LEMSA, hospital, or individual EMS provider. Data collected specific to personnel shall only be exchanged between the personnel and provider levels. EMS information should be consistent in how it is organized, analyzed, presented and evaluated. See Appendix D for specific diagram showing the flow and exchange of information at all levels.

Page 15
SECTION III EVALUATION OF EMS SYSTEM INDICATORS
Organizational Structure In order to provide a continuous evaluation of EMS services, it is recommended that the organizations establish technical advisory groups at each level (state, local, hospital, and provider). Each technical advisory group should be responsible for decision-making regarding evaluation and improvement and should be composed of stakeholders within the system under evaluation. Organization of Information EMS organizations shall develop indicators which address but are not limited to the following (Appendix E): (1) Personnel (2) Equipment and Supplies (3) Documentation (4) Clinical Care and Patient Outcome (5) Skills Maintenance/Competency (6) Transportation/Facilities (7) Public Education and Prevention (8) Risk Management The recommended approach to organizing data and other sources of information is through the development and use of standardized indicators. Indicators Defined According to the Joint Commission on Accreditation of Healthcare Organizations, an indicator is "a quantitative performance measure…a tool that can be used to monitor performance and direct attention to potential performance issues that may require more intensive review within an organization.” In other words, an EMS indicator measures the degree of conformance to a reasonable expectation as defined by the community served. Indicators may be related to structures (people, places, things), processes (activities occurring in a system), and outcomes (the results of the structures and activities within a system). In fact, the three types of indicators (structure, process, and outcome) are all related and dependent upon one another. Hence the following equation:
STRUCTURE + PROCESS = OUTCOME Changes in structure may affect the process and the outcome. Likewise, changes in the process may affect the structure and outcome. Indicators, in short, are a way to simplify information so that data can be digested more efficiently and in a meaningful way. Required EMS System Indicators Statewide EMS system indicators as developed and adopted by the EMSA should be incorporated to allow comparison within the state at all levels. These indicators are developed through a statewide consensus process and supported by the statewide data system. An example of a required EMS system indicator detail sheet is found in Appendix G. Optional EMS System Indicators Recommended indicators are developed and designed on an as-needed basis and may be used for the long or short term or on an ad hoc basis depending on the goals of the group developing the indicators. While the state may develop some indicators, most development will occur at the local level. All EMS organizations are encouraged to develop their own indicators

Page 16
based upon their specific needs. Ad hoc indicators are not reported outside of the specific user group and level of organization. In order to assist EMS organizations with developing indicators, instructions on standardized indicator development can be found in Appendix F. Analysis Prior to presenting or distributing indicators, it is recommended that the results be analyzed to include measurements appropriate for rapid interpretation by evaluators. Measurements may include the following: • Statistical
Measures of Central Tendency Measures of Dispersion
• Process Analysis Trending Causation Benchmarking Best Practices Published References
These measurements are defined and further illustrated in Appendix K. Presentation The results and measurements of indicators should be presented to the users of the information in a formal process and on a regularly scheduled basis. Each presentation should include the purpose, objectives, references, benchmarks, measurements, and indicator detail sheet for clarification of data. The indicator information should be displayed to evaluators in a format that is most appropriate for the speed and ease of interpretation. The following are typical ways to display an indicator result:
Flow Chart Fishbone – Cause and Effect Diagram Pareto Chart Histogram Scatter Diagram Run Chart Control Chart
Examples, definitions, and application of these display methods are illustrated in Appendix L. Decision-Making Process Each organizational level should have a structured process for making decisions. The following is a general outline of the steps in a structured process for evaluation and decision-making by the Technical Advisory Group:
1. Identify the objectives of evaluation 2. Present indicators and related EMS information 3. Compare performance with goals or benchmarks 4. Discuss performance with peers/colleagues 5. Determine whether improvement or further evaluation is required 6. Establish plan based upon decision 7. Assign responsibility for post-decision action plan

Page 17
SECTION IV ACTION TO IMPROVE
Approach to Performance Improvement Once valid information has been presented and reliability evaluated, the decision to take action or to solve a problem requires a structured approach that is adaptable and applied to each situation as it is identified. There are many standardized and well-developed quality/performance improvement programs, which may be used during this phase. In all cases, each EMS QI Program Technical Advisory Group should choose an improvement method that is systematic and based upon evidence. The approach to improvement should also be team oriented and be done in a way that does not overwhelm the process due to size and complexity. Small wins are sometimes the basis for the larger wins. It is recommended that initial improvement projects be simple and based upon a strong consensus within the Technical Advisory Group that improvement will benefit all. Technical Advisory Group The EMS QI Program at each organizational level should have an oversight body that is responsible for implementing the quality/performance improvement plan. This group may be the same group that collects data from and evaluates the local system. The group should be responsible for delegating action to smaller groups (e.g., the Quality Task Force) and for monitoring the process as it unfolds within the system. Quality Task Force It is recommended that the Technical Advisory Group utilize smaller groups within the organizational level to carryout improvement action plans. Quality Task Forces are smaller sub-groups of the larger quality oversight body. Task forces are established to develop and implement action plans. Each task force has one project and is responsible for reporting all activities to the larger oversight group. Once the project is completed, the task force is disbanded. There may be more than one task force working concurrently, with each task force working on a specific action plan. Note: Availability of resources can vary greatly between urban and rural agencies. It is understood that one task force may handle multiple projects or the Technical Advisory Group may handle the projects without forming any task forces. Performance Improvement Plan While there are many approaches to a Performance Improvement Plan within an organization, it is recommended that each Quality Task Force choose a standardized approach and use the same process each time a project is undertaken. The following are traditional components of a standardized improvement process:
• Establish criteria for measurement and evaluation • Evaluate information • Make a decision to take action to improve • Establish criteria for improvement • Establish an improvement plan • Measure the results of the improvement plan • Standardize or integrate change (plan) into the system • Establish a plan for monitoring future activities
Attached in Appendix H, I, and J are examples of quality improvement models.

Page 18
SECTION V TRAINING AND EDUCATION
Introduction Effectiveness of the EMS QI Program and related training is directly proportional to the energy and resources committed. Administrative oversight should be available and directly involved in the process. When clinical issues are addressed, medical oversight is recommended. Action to improve process is intertwined with training and education Once the decision to take action or to solve a problem has occurred, training, and education are critical components that need to be addressed. As a Performance Improvement Plan is developed, the Technical Advisory Group will establish criteria for measurement and evaluation. Based on these criteria, delivery methods and content of training will be developed. This integrated process will avoid any misdirection that may occur when training is isolated from the EMS QI Program. Success of the performance improvement plan is dependent upon changing the behavior and knowledge of the staff who deliver care to patients or services to other participants (e.g., EMSA to LEMSA, LEMSA to EMS provider) in the EMS system. To implement change, you must deliver verifiable, ongoing training that is appropriate to the skill level and service goals of the organization. Medical direction To successfully implement a Performance Improvement Plan, the organization’s EMS QI Program team shall have input into the content and delivery methods of related training and education. This involvement will provide consistency between the current and subsequent Performance Improvement Plans. The structure of the organization shall place the oversight for directing clinical training and education at the highest level of medical knowledge. Measure the results of the Performance Improvement Plan Once the Performance Improvement Plan has been implemented, the measurement of a successful outcome will be dependent upon the validity of the plan and the effectiveness of the training and education. If the outcome is not satisfactory, it is necessary to examine both the content of the Plan and delivery method of related training and education. Integrate change Once the Performance Improvement Plan has been successfully implemented, the organization needs to standardize the changes within appropriate policies and procedures. When appropriate, assure that staff have successfully completed the training and educational components of the plan. The final steps in integrating change into the system will be to schedule continuing education at appropriate reoccurring intervals and re-evaluate the original EMS system indicators.

Page 19
Annual Update Guidelines
The Annual Update is a written account of the progress of an organization’s activities as stated in the EMS QI Program. In compiling the Annual Update, refer to the previous year’s update and work plan. Description of agency The description should include an organizational chart showing how the EMS QI Program is integrated into the organization. Statement of EMS QI Program goals and objectives Describe processes used in conducting quality improvement activities. Were goals and objectives met? List and define indicators utilized during the reporting year • Define state and local indicators • Define provider specific indicators • Define methods to retrieve data from receiving hospitals regarding patient diagnoses
and disposition • Audit critical skills • Identify issues for further system consideration • Identify trending issues • Create improvement action plans (what was done and what needs to be done) • Describe issues that were resolved • List opportunities for improvement and plans for next review cycle • Describe continuing education and skill training provided as a result of Performance
Improvement Plans • Describe any revision of in-house policies • Report to constituent groups • Describe next year’s work plan based on the results of the reporting year’s indicator
review Sample Work Plan Template Indicators Monitored Key Findings/Priority
Issues Identified Improvement Action Plan Plans for Further Action
Were Goals Met? Is Follow-Up Needed?

Page 20
Appendices

APPENDIX A
Self-Assessment and Action Planning The Organizational Profile: A Starting Point for Self-Assessment The Organizations Profile is a snapshot of your organization, the key influences on how you operate, and the key challenges you face. The first section, Organization Description, addresses your organization’s health care environment and your key relationships with patients, customers, suppliers, and other partners. The second section, Organizational Challenges, calls for a description of your organization’s competitive environment, your key strategic challenges, and your system for performance improvement. If possible, each answer should have a summary response. For each component, the following questions should be asked: Where am I now? Where do I want to be? How do I get there? Organizational Description Organizational Environment
1. Organization’s main health care services 2. Delivery of services to patients 3. Organizational context/culture, including purpose, vision, mission, and values, as
appropriate 4. Staff profile, including educational levels, workforce and job diversity, bargaining units, use
of contract and privileged staff, and special safety requirements, as appropriate 5. Major technologies, equipment, and facilities 6. Legal/regulatory environment under which your organization operates, including
occupational health and safety regulations, accreditation requirements, and environmental and financial regulations relevant to health care service delivery
Organizational Relationships
1. Key patient/customer groups and/or market segments 2. Key requirements for your health care services, including how these requirements differ
among patients and other customer groups and/or market segments, as appropriate 3. Important types of suppliers and partners 4. Important supply chain requirements 5. Key supplier and partnering relationships and communication mechanisms
Organizational Challenges Competitive Environment
1. Competitive position 2. Relative size and growth in the health care industry 3. Type of competitors and key collaborators 4. Principal factors that determine your success relative to your competitors and other
organizations delivering similar services
Page A-1

5. Changes taking place that affect your competitive situation and/or opportunities for collaborating
Strategic Challenges
1. Key strategic challenges, including operational, human resource, and business challenges, as appropriate
Performance Improvement System
1. Organizational focus on performance improvement 2. Approaches used to systematically evaluate and improve key processes and to foster
organizational learning and knowledge sharing
Page A-2

APPENDIX B
2001 Health Care Criteria for Performance Excellence Baldrige National Quality Program Core Values and Concepts
Leadership
Leadership is responsible for the creation of strategies, systems, and methods for achieving excellence in health care, stimulating innovation, and building knowledge and capabilities.
Patient Focused Quality and performance are the key components in determining patient satisfaction. A patient’s relationship with the provider of care, ancillary staff, cost, responsiveness, continuing care and attention factor into a patient’s satisfaction. The delivery of patient care must be system focused and by its nature will then become patient oriented. In the context of EMS system performance, this would include the patient’s perception of the continuum of care from the prehospital to the hospital. A smooth transition of care will instill confidence in the patient and their family members.
Organizational and Personal Learning Organizational learning refers to continuous improvement of existing approaches and processes and adaptation to change, leading to new goals and/or approaches. Personal learning through education, training, and opportunities of continuing growth allows individuals to adjust to a changing health care environment and enhance knowledge of measurement systems that influence the outcomes of assessments and patient care and operational guidelines. Learning is directed not only toward better EMS delivery, but also toward being more responsive, adaptive and efficient.
Staff and Partners An organization should be committed to their staff’s satisfaction, development and well-being. Partners should include stakeholders – patients, prehospital and hospital providers, and regulatory agencies.
Flexibility Faster and more flexible response to patients and other EMS partners is necessary in today’s fast moving health care environment.
Planning for the Future An organization should anticipate changes in EMS health care delivery, resource availability, patient expectations, technological developments, and evolving regulatory requirements.
Managing for Innovation Organizations should be structured in such a way that innovation becomes part of the culture and daily work.
Management by Evidence An effective EMS system depends upon the measurement and analysis of performance. Critical data and information about key processes, outputs and results are a key component. Performance measurement areas may include patient outcomes, patient care and operational guidelines, staff, cost, and customer satisfaction and others. Analysis of data along with knowledge and input from experts supports decision-making and operational improvement. Data and its analysis support the review of overall field performance, improving outcomes, improving operations and comparing process with similar organizations, with performance “best practice” benchmarks or comparison of the agency performance with itself and its own past practice. A major consideration in performance improvement involves the selection and use of performance measures or indicators.
Page B-1

Public Responsibility and Community Health EMS system participants should not only meet all federal, state, local laws and regulations and local requirements, they should treat all of these and related requirements as opportunities for continuous improvement beyond mere compliance. The EMS system has a responsibility to the public it serves to foster improved community health. Basic expectations of an organization include ethical practice and protection of public health, safety, and the environment. EMS system participants should share in efforts in community wellness and injury prevention.
Focus on Results Performance measurements need to focus on key results that create the value of EMS to the community served.
Systems Perspective Focus on what is important to the whole system, as well as its components to achieve performance improvement. Monitor, respond to, and build on performance results. Plans should seek to prevent problems, provide a forthright response if problems occur, and make available information and support needed to maintain public awareness, safety and confidence.
There must be a continued investment to produce a high quality product. It is not enough to develop new programs and techniques of measurement and control. The stakeholders must commit to a course of constant evaluation and improvement that is non-punitive, valued, and continuous.
Page B-2

APPENDIX C Organizational Structure
Other EMS system participants include, but are not limited to: Training Agencies, Dispatch Agencies, Receiving Facilities and Specialty Care Centers
State of California EMS Authority
EMS Authority Data and QI
National/State EMS Data Banks
Local EMS Agencies
System EMS Data and QI
EMS Service Providers
Base Hospitals
System Data and QI
Hospital Data and QI
Page C-1
Page A-1

APPENDIX D
Flow of Information and Activity This diagram illustrates the organizational structure for analysis, evaluation, and improvement and demonstrates the fundamental interconnectedness of these critical components. Comprehensive evaluation lays the foundation upon which improvement will occur.
Organizational StructureFlow of Information & Activity
Local EMS QIQuality Task Force
Local ServiceProviderEMS QI
Quality Task Force
ANALYSIS EVALUATION IMPROVEMENT
REPORTING LOOP FEEDBACK LOOP
EMSSYSTEM
ACTIVITY
STATE EMS AUTHORITY
EMS QIDivision
LOCAL EMS AGENCYEMS QIDivision
LOCAL EMS SERVICE PROVIDER
EMS QIProgram
STATE EMS QITechnical Advisory Group
LOCAL EMS QITechnical Advisory Group
LOCAL SERVICE PROVIDER QI
Technical Advisory Group
Statewide EMS QI Quality Task
Force
ImprovementNeeded
ImprovementNeeded
ImprovementNeeded
Data Collected
Local LeadIndicatorDataReports
State LeadIndicatorSummaryReports
State IndicatorAnalysis Reports
Local IndicatorAnalysis Reports
Page D-1
APPENDIX E
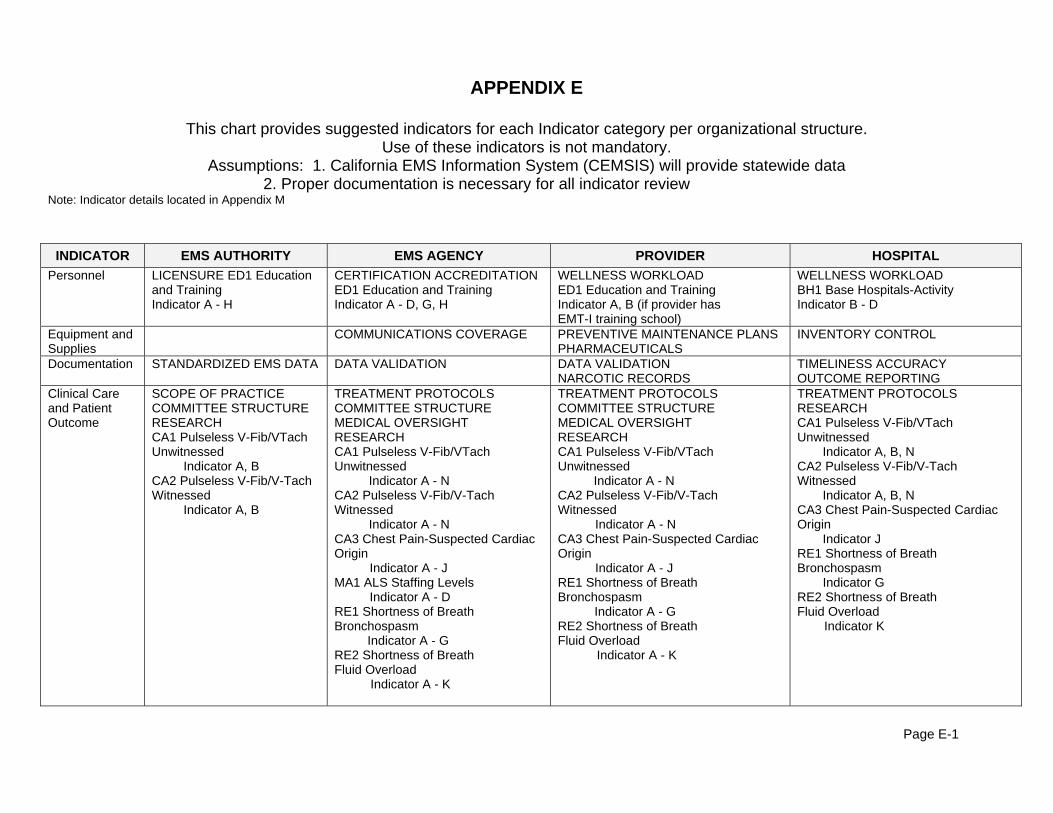
This chart provides suggested indicators for each Indicator category per organizational structure. Use of these indicators is not mandatory.
Assumptions: 1. California EMS Information System (CEMSIS) will provide statewide data 2. Proper documentation is necessary for all indicator review Note: Indicator details located in Appendix M
INDICATOR EMS AUTHORITY EMS AGENCY PROVIDER HOSPITAL Personnel
LICENSURE ED1 Education and Training Indicator A - H
CERTIFICATION ACCREDITATION ED1 Education and Training Indicator A - D, G, H
WELLNESS WORKLOAD ED1 Education and Training Indicator A, B (if provider has EMT-I training school)
WELLNESS WORKLOAD BH1 Base Hospitals-Activity Indicator B - D
Equipment and Supplies
COMMUNICATIONS COVERAGE PREVENTIVE MAINTENANCE PLANS PHARMACEUTICALS
INVENTORY CONTROL
Documentation
STANDARDIZED EMS DATA DATA VALIDATION
DATA VALIDATION NARCOTIC RECORDS
TIMELINESS ACCURACY OUTCOME REPORTING
Clinical Care and Patient Outcome
SCOPE OF PRACTICE COMMITTEE STRUCTURE RESEARCH CA1 Pulseless V-Fib/VTach Unwitnessed Indicator A, B CA2 Pulseless V-Fib/V-Tach Witnessed Indicator A, B
TREATMENT PROTOCOLS COMMITTEE STRUCTURE MEDICAL OVERSIGHT RESEARCH CA1 Pulseless V-Fib/VTach Unwitnessed Indicator A - N CA2 Pulseless V-Fib/V-Tach Witnessed Indicator A - N CA3 Chest Pain-Suspected Cardiac Origin Indicator A - J MA1 ALS Staffing Levels Indicator A - D RE1 Shortness of Breath Bronchospasm Indicator A - G RE2 Shortness of Breath Fluid Overload Indicator A - K
TREATMENT PROTOCOLS COMMITTEE STRUCTURE MEDICAL OVERSIGHT RESEARCH CA1 Pulseless V-Fib/VTach Unwitnessed Indicator A - N CA2 Pulseless V-Fib/V-Tach Witnessed Indicator A - N CA3 Chest Pain-Suspected Cardiac Origin Indicator A - J RE1 Shortness of Breath Bronchospasm Indicator A - G RE2 Shortness of Breath Fluid Overload Indicator A - K
TREATMENT PROTOCOLS RESEARCH CA1 Pulseless V-Fib/VTach Unwitnessed Indicator A, B, N CA2 Pulseless V-Fib/V-Tach Witnessed Indicator A, B, N CA3 Chest Pain-Suspected Cardiac Origin Indicator J RE1 Shortness of Breath Bronchospasm Indicator G RE2 Shortness of Breath Fluid Overload Indicator K
Page E-1

INDICATOR EMS AUTHORITY EMS AGENCY PROVIDER HOSPITAL
Skills Maintenance/Competency
SCOPE OF PRACTICE SCOPE OF PRACTICE SKILLS UTILIZATION BENCHMARKING SK1 Skills-Advanced Provider
Indicator A - J
SCOPE OF PRACTICE SKILLS UTILIZATION INFREQUENT SKILLS REVIEW SUCCESS RATES (BENCHMARKING) SK1 Skills-Advanced Provider
Indicator A - J
SCOPE OF PRACTICE SKILLS UTILIZATION INFREQUENT SKILLS REVIEW SUCCESS RATES
Transportation/ Facilities
RF1 Receiving Facilities Utilization Indicator A, B, C, E TH1 Trauma Hospitals Indicator A, B TRI Critical Trauma Indicator A – G, K, N, O
HOSPITAL DIVERSION SPECIALTY CARE CENTERS-DESTINATION BH1 Base Hospital Activity Indicator A RF1 Receiving Facilities Utilization Indicator A, B, C, E RS1 Response Indicator A - C TH1 Trauma Hospitals Indicator A, B TR1 Critical Trauma Indicator A - G, H, J, K, L, N, O
RESPONSE TIMES WAIT TIMES SPECIALTY CARE CENTERS-DESTINATION AC2 Access & Utilization PSAP (if able to collaborate w/PSAP) Indicator A - D AC3 Access & Utilization EMS Dispatch Center (if able to collaborate w/PSAP) Indicator A - D RF1 Receiving Facilities Utilization Indicator A, B, C, E RS1 Response Indicator A - C TR1 Critical Trauma Indicator A – G, I – O
BH1 Base Hospital Activity Indicator B, C, D RF1 Receiving Facilities Utilization Indicator A - E TH1 Trauma Hospitals Indicator A, B (if Trauma Center) TR1 Critical Trauma Indicator A – G, L - O
Page E-2

INDICATOR EMS AUTHORITY EMS AGENCY PROVIDER HOSPITAL
Public Education and Prevention
COMMUNITY INVOLVEMENT PREVENTION PROGRAMS PATIENT EDUCATION CUSTOMER SATISFACTION CA1 Pulseless V-Fib/VTach Unwitnessed Indicator A, B CA2 Pulseless V-Fib/V-Tach Witnessed Indicator A, B PP1 Public Education and Prevention Indicator A, B
COMMUNITY INVOLVEMENT REWARD AND RECOGNITION PREVENTION PROGRAMS PATIENT EDUCATION CUSTOMER SATISFACTION CA1 Pulseless V-Fib/VTach Unwitnessed Indicator A, B CA2 Pulseless V-Fib/V-Tach Witnessed Indicator A, B PP1 Public Education and Prevention Indicator A, B
COMMUNITY INVOLVEMENT REWARD AND RECOGNITION PREVENTION PROGRAMS PATIENT EDUCATION CUSTOMER SATISFACTION CA1A Pulseless V-Fib/VTach Unwitnessed Indicator A, B CA2 Pulseless V-Fib/V-Tach Witnessed Indicator A, B PP1 Public Education and Prevention Indicator A, B
PREVENTION PROGRAMS PATIENT EDUCATION CUSTOMER SATISFACTION CA1 Pulseless V-Fib/VTach Unwitnessed Indicator A, B CA2 Pulseless V-Fib/V-Tach Witnessed Indicator A, B PP1 Public Education and Prevention Indicator A, B
Risk Management
ISSUE RESOLUTION PROCESS SYSTEM MONITORING
ISSUE RESOLUTION PROCESS SYSTEM MONITORING CA1 Pulseless V-Fib/VTach Unwitnessed Indicator A, B MA1 ALS Staffing Levels Indicator A - D
ISSUE RESOLUTION PROCESS OSHA COMPLIANCE POST-INCIDENT PEER REVIEW PERSONNEL SAFETY SYSTEM MONITORING MA1 ALS Staffing Levels Indicator A - D RS1 Response Indicator A - C SK1 Skills – Advanced Provider Indicator A - J
OSHA COMPLIANCE POST-INCIDENT PEER REVIEW PERSONAL SAFETY SYSTEM MONITORING
Page E-3
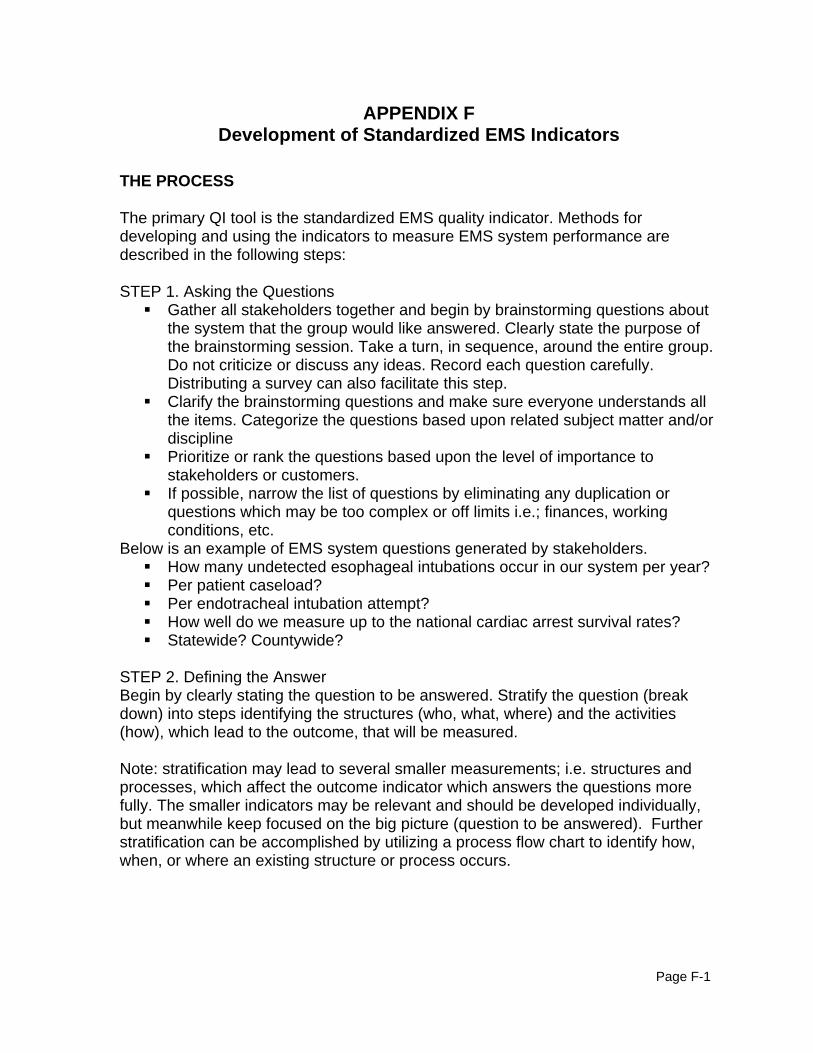
APPENDIX F Development of Standardized EMS Indicators
THE PROCESS
The primary QI tool is the standardized EMS quality indicator. Methods for developing and using the indicators to measure EMS system performance are described in the following steps:
STEP 1. Asking the Questions Gather all stakeholders together and begin by brainstorming questions about
the system that the group would like answered. Clearly state the purpose of the brainstorming session. Take a turn, in sequence, around the entire group. Do not criticize or discuss any ideas. Record each question carefully. Distributing a survey can also facilitate this step.
Clarify the brainstorming questions and make sure everyone understands all the items. Categorize the questions based upon related subject matter and/or discipline
Prioritize or rank the questions based upon the level of importance to stakeholders or customers.
If possible, narrow the list of questions by eliminating any duplication or questions which may be too complex or off limits i.e.; finances, working conditions, etc.
Below is an example of EMS system questions generated by stakeholders. How many undetected esophageal intubations occur in our system per year? Per patient caseload? Per endotracheal intubation attempt? How well do we measure up to the national cardiac arrest survival rates? Statewide? Countywide?
STEP 2. Defining the Answer Begin by clearly stating the question to be answered. Stratify the question (break down) into steps identifying the structures (who, what, where) and the activities (how), which lead to the outcome, that will be measured. Note: stratification may lead to several smaller measurements; i.e. structures and processes, which affect the outcome indicator which answers the questions more fully. The smaller indicators may be relevant and should be developed individually, but meanwhile keep focused on the big picture (question to be answered). Further stratification can be accomplished by utilizing a process flow chart to identify how, when, or where an existing structure or process occurs.
Page F-1

STEP 3. Develop the Quality Indicator Standardize how the information will be gathered, and define the following:
• Population (inclusion criteria) • Data numerator • Data denominator • Reporting formula • Reported item
Example Inclusion Criteria - patients 15 years or older defibrillated by prehospital
personnel Numerator - total patients discharged alive from the hospital after
prehospital defibrillation Denominator - total number of prehospital patients defibrillated Formula - total patients discharged/total patients defibrillated x 100 = %
survival STEP 4: Collecting the Indicator Information
Work with technical personnel to design systems which can capture the data
Develop the easiest and most efficient technology design Educate all personnel who will be collecting data on the technology and
the indicator Issue the “step by step - how to memo” information in writing and explain
the indicator process Provide resource & contact point for FAQ’s and troubleshooting
STEP 5: Organizing the Data into Indicator Format
Assure all data submissions have been received and checked Identify and segregate data by indicator or sub-indicators Reference the indicator to identify details such as denominators and
numerators Perform tests as defined previously by the indicator Summarize and organize all results Prepare data for presentation Perform appropriate tests and measurements of central tendencies If appropriate-aggregate and blind the data Select and prepare appropriate presentation format (Charts, graphs,
checksheet, diagram) Select appropriate presentation medium (slide, overhead, document)
STEP 6: Present and Evaluate the Answer This step also gives participants the opportunity to evaluate the credibility of the data and the meaning of the results. It is very important that all participants do their homework by reviewing the preliminary results prior to the presentation. Participants should receive preliminary reports well ahead of the scheduled evaluation meeting
Page F-2

date. It is at this step in the process where participants will have to make a collective decision; the decision whether to act or not to act on the answer.
• Present data 1. Select appropriate setting for presentation (face-to-face meeting,
teleconference, Web conference) 2. Schedule presentation date and time 3. Assure all participants can attend presentation 4. Issue report, date, time and location of report presentation 5. Present report to consortium with project Question-Answer statement
from Steps 1&2 6. Present report to consortium with project indicators/measurements 7. Present relevant list of benchmarks from past projects & published
studies 8. Identify any data collection or analysis problems 9. Provide consultation regarding data indicators during meeting 10. Assure that all participants have had an opportunity to review the results prior to presentation. 11. Assure that all pertinent information has been presented
• Evaluate Data 1. Assure that all participants understand the presented information 2. Does the data suffice to answer the proposed questions? 3. Is the data presented in a format that is understood? 4. Is the data and results reasonably believable? 5. Is the answer (data) within an acceptable performance range? 6. Does the answer (data) demonstrate that action to improve performance is warranted?
STEP 7: Acting to Improve the Answer
Assure all participants have opportunity for input Review results and evaluation process Identify reasons for improvement Identify and verify root causes or need for improvement Brainstorm potential performance improvement-action plans Reduce & select performance improvement-action plan Decide whether performance improvement-action plan is short term (60 days-rapid cycle model) or longer (over 60 days-traditional model) Create a performance improvement - action plan with specific steps
identifying who, what, how and when they will occur. Elect a performance improvement project leader Schedule performance improvement plan Implement performance improvement plan with appropriate schedule
STEP 8: Checking for Improvement
Set a target date for re-evaluation
Page F-3

Repeat steps 1-8 Obtain consensus from participants for sharing results Identify Authors and associated participants Draft final publication document Resubmit to group for final approval Publish document for peer review if desired
Page F-4

APPENDIX G Indicator Detail Sheet
INDEX #CA1 CORE INDICATOR
CARDIAC - ADULT TREATMENT PROTOCOL UTILIZATION
Index CA1M Sub Indicator
% SURVIVAL TO HOSPITAL DISCHARGE PULSELESS V-FIB V-TACH WITNESSED
Objective of Indicator to measure % of patients who survive to hospital discharge after suffering a pulseless ventricular fibrillation (VF) or ventricular tachycardia (VT) event which is witnessed and treated by EMS personnel
Type of Measure Outcome Min Data Values n= 30 values per measure
Numerator Description
number of adult patients discharged alive from hospital over a specified time period
Numerator Inclusion Criteria
patient has reached age 15 patient has suffered a VF or VT event patient was pulseless patient VF & VT event was witnessed by EMS personnel patient has survived to hospital discharge
Numerator Exclusion Criteria
non-cardiac etiologies, cardiac etiologies where resuscitation was not attempted by EMS personnel event not witnessed by EMS personnel patients not admitted to hospital patients not discharged from hospital alive
Numerator Data Source
hospital discharge records
Numerator Data Elements
discharge status
Linkage Criteria name, DOB, age, gender, admit date, prehospital procedures; i.e. defibrillation,
Denominator Description
number of patients who have prehospital resuscitation attempted
Denominator Inclusion Criteria
patients who have reached age 15 and suffer pulseless VF or VT witnessed by EMS personnel
Denominator Exclusion Criteria
non-cardiac etiologies, cardiac etiologies where prehospital resuscitation was not attempted
Denominator Data Source
EMS Medical Records
Denominator Data Elements
Provider Impression EKG Procedures – CPR Procedures – Defibrillation
Linkage Criteria PCR number, Last name, DOB Description of
Indicator Formula numerator value (N) divided by denominator value (D) multiplied by 100 equals percentage (%)
Numeric Expression Indicator Formula
N/D = %
Indicator Unit % Percentage Reporting Format:
Numeric %
Suggested Presentation Format
Bar Chart Line Graph
Suggested Frequency Display of Measure
Monthly x 16 Months
Page G-1
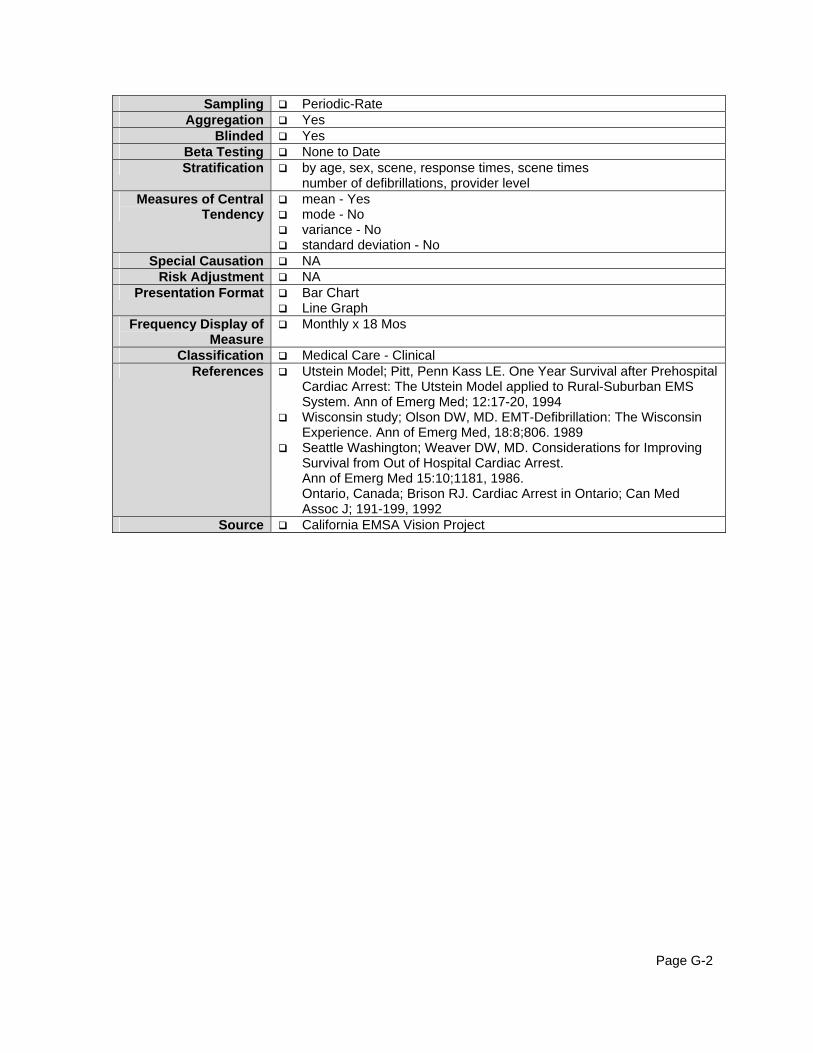
Sampling Periodic-Rate Aggregation Yes
Blinded Yes Beta Testing None to Date Stratification by age, sex, scene, response times, scene times
number of defibrillations, provider level Measures of Central
Tendency mean - Yes mode - No variance - No standard deviation - No
Special Causation NA Risk Adjustment NA
Presentation Format Bar Chart Line Graph
Frequency Display of Measure
Monthly x 18 Mos
Classification Medical Care - Clinical References Utstein Model; Pitt, Penn Kass LE. One Year Survival after Prehospital
Cardiac Arrest: The Utstein Model applied to Rural-Suburban EMS System. Ann of Emerg Med; 12:17-20, 1994
Wisconsin study; Olson DW, MD. EMT-Defibrillation: The Wisconsin Experience. Ann of Emerg Med, 18:8;806. 1989
Seattle Washington; Weaver DW, MD. Considerations for Improving Survival from Out of Hospital Cardiac Arrest. Ann of Emerg Med 15:10;1181, 1986. Ontario, Canada; Brison RJ. Cardiac Arrest in Ontario; Can Med Assoc J; 191-199, 1992
Source California EMSA Vision Project
Page G-2

APPENDIX H Models
System evaluation and improvement models have been developed to guide systems in developing programs. The following table summarizes some of the classic, time-tested methods:
FOCUS-PDSA PRIDE FADE JOINER F- Find a process to improve
P – Process – Choose one to improve
F – Focus on a problem
Understand the process
O – Organize a team that knows the process
Describe the process; Identify the customer needs and concerns
C – Clarify current knowledge of the process (collect data and other information)
R – Relevant dimensions of performance measurements (collect data)
A – Analyze the problem
Develop a standard process; Eliminate errors; Remove the slack; Reduce variation; Plan for continuous improvement
U – Understand causes of process variation
I – Interpret data and evaluate variance
S – Select process improvement
D – Design or redesign the process
D – Develop a plan Plan-Do-Study-Act
P – Plan D – Do S – Study A – Act
E – Execute the improvement plan and validate any improvement by remeasuring
E – Execute the plan
Table Source: Keill, P., Johnson, T., “Optimizing Performance Through Process Improvement”, Journal of Nursing Care Quality, 1994;9(1);1-9 Aspen Publishers, Inc.
Page H-1
Page H-1

APPENDIX I PDSA
The Plan-Do-Study-Act Cycle (PDSA)
PlanAct
DoStudy
•State objective of the test•Make predictions•Develop plan to carry out • the test (who, what, where, • when)
•Carry out the test•Document problems and• unexpected observations•Begin analysis of the data
•What changes are to• be made?•What will be the • objective of the next• cycle?
•Complete the analysis of• the data•Compare test data to• predictions•Summarize what was • learned
In The Improvement Guide: A PracticalApproach to Enhancing OrganizationalPerformance. Langley, Nolan, Nolan,Norman, & Provost. 1996.
Page I-1
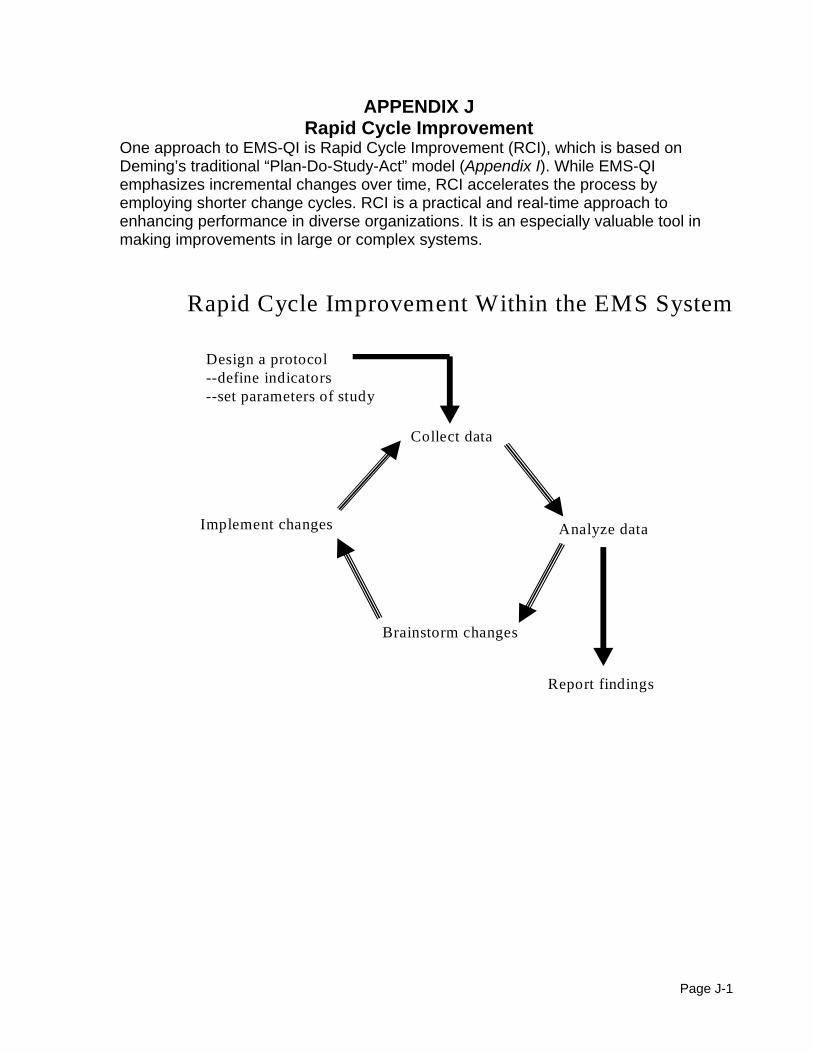
APPENDIX J Rapid Cycle Improvement
One approach to EMS-QI is Rapid Cycle Improvement (RCI), which is based on Deming’s traditional “Plan-Do-Study-Act” model (Appendix I). While EMS-QI emphasizes incremental changes over time, RCI accelerates the process by employing shorter change cycles. RCI is a practical and real-time approach to enhancing performance in diverse organizations. It is an especially valuable tool in making improvements in large or complex systems.
Rapid Cycle Improvement Within the EMS System
Design a protocol--define indicators--set parameters of study
Collect data
Brainstorm changes
Implement changes Analyze data
Report findings
Page J-1

Appendix K Definitions of Common Data Measurements
I. Statistical A. Measures of Central Tendency: These are data measurements which show how the data is the same or; where most of the people, places or things tend to score or behave. These measurements are in the middle of what has often been called the “bell shaped curve”.
1. Mean (average) – The sum of all measured, or counted, data divided by the total number of data points; for example in the below data, if all the data values added together equal = 223 is divided by the total number of data points which are 15, then the product would be 14.8. Thus, the mean value of the data is 14.8.
2. Mode – the value repeated most often in raw data. For example in the data below the value 12 is repeated the most. Thus the mode value is 12
3. Median – the middle of all the measured or counted data points. For example, in the data below, all values are placed in numerical order and then the middle value is found by dividing by 2 and counting the ordered values until the middle value is identified. Thus, 12 is the middle of the ranked data points.
sample data: 8, 8, 9, 10, 10, 12, 12, 12, 14, 16, 16, 18, 20, 28, 30
B. Measures of Dispersion: These are data measurements which show how the data is different or; where most of the people, places or things are different. These measurements are on the outside of what has often been called the “bell shaped curve”. 1. Range – the maximum value minus the minimum data value.
2. Standard Deviation – A measurement which shows how widely spread (dispersed) any set of data is from the mean (average) of an entire data distribution. The standard deviation takes into account all the data points.
Page K-1

II. Process Analysis A. Process Analysis: evaluation of data by using graphic representations of activities which show trends and variations over time. The following are common activities used to help evaluate an activity:
1. Trending - the process of showing by plot or process control chart, the upward, downward or level movement of an activity over a specified period of time. 2. Causation - the results of tests which are applied to a set of data points plotted on a process control chart. The tests determine whether or not a “special cause” exists within the data set and can explain unusual character or nature of undesirable results.
3. Benchmarking - using known results of similar data measurements or tests as an impetus for achieving or surpassing a desired goal for improvement. 4. Best Practices - using the best known results of similar data measurements of similar tests for similar systems or operations as an impetus for achieving or surpassing a desired goal for improvement. 5. Published Referencing - using published results of similar data measurements or tests as beginning or starting reference point for achieving or surpassing a desired goal for improvement.
Page K-2

APPENDIX L PRESENTATION OF EMS SYSTEM INDICATORS
Basic Graphic Tools
FLOW CHART – Flow charts graphically show the order of events in a process. They can be used to understand current processes or develop new ones. Flow charts help to visualize:
Operations Process steps in order of occurrence Space, time and people requirements Delays, clogs, and “black holes” Decision locations Feedback loops Redundancy or rework People and work relationships Obscure details of a procedure Complexity of a process
START
PROCESS
STEP
DECIDE
END
Page L-1

FISHBONE – A Cause and Effect (Fishbone) Diagram is used to brainstorm possible causes. It can reveal hidden process elements which are sometimes overlooked and can help to identify critical elements, problem areas, sources contributing to a defect, etc. PARETO CHART – A Pareto Chart can be used to measure process improvement by showing the data, ranking categories, and identifying areas to be worked first. It provides a way of organizing data to show what major factors make up the indicator being analyzed. It is useful in showing the many parts of a whole such as all the sub-indicators of a core indicator.
05
10152025303540
Frequency
Communication Staffing Equipment
Sources of Problems-First Quarter
Station 1 Station 2 Station 3
Cause Cause
Effect
Cause Cause
Cause
Cause
Page L-2

HISTOGRAM – A histogram provides a graphic representation of data distribution. Data is represented by bars of equal width or category and the height of these bars indicate the relative number of data points in each category.
EMS Time to Scene
0
9
18
0 - 5 6 - 10 11 - 15 16 - 20 Over 20
Time in Minutes
Num
ber of
Cas
es
SCATTER DIAGRAM - A scatter diagram is a visual display showing the relationship between two variables. It is useful in showing the relationship of a process to an outcome (time & survival).
EMS Scene Time by Patient GCS
15
3
GCS
0 30EMS Scene Time
Page L-3

RUN CHART – A run chart can show the trend of a process or characteristic over a given period of time. Shows mean or average line when sufficient data is available.
Diagnosis Errors
0
50
100
Jan Feb March April May June
Month
Num
ber
of E
rror
s
CONTROL CHART – A control chart provides graphic presentation of a line graph specifically used to track the trend or performance of a process over time. It is useful in the demonstration process variability.
Anatomy of a Control Chart
0 2.5 5 7.5 10 12.5 15 17.5 20 22.5 25-100
-50
0
50
100
150
200
250
300
Upper Control Limit
Average
Lower Control Limit
± three Standard Deviation
Page L-4

GLOSSARY OF TERMS Bar Chart - A graphic presentation which represents quantities through the use of
bars of uniform width but heights proportional to number being represented. Beta Testing - To perform an exercise in obtaining, analyzing, and presenting a
specific indicator. CEMSIS - California Emergency Medical Services Information System. CEMSIS Denominator Data Elements - The specific data points/elements as
identified in the CEMSIS data required to perform the data query as related to the specific indicator.
CEMSIS Linkage Data Elements - The CEMSIS data elements that may be used to link data.
CEMSIS Numerator Data Elements - The specific data points/elements as identified in the CEMSIS data required to perform the data query as related to the specific indicator.
CEMSIS Stratification Elements - The specific data points/elements as identified in the CEMSIS data, which may be used to stratify a specific indicator.
Classification - Titles given to indicator based upon the organization and catalog of all indicators.
Control chart - Graphic presentation of a line graph specifically used to track the trend or performance of a process over time. Useful in demonstration process variability.
Core Indicator - The lead indicator being analyzed. Core indicators are composed of several sub-indicators (smaller indicators), which are major contributing factors to the final core indicator result.
Core Indicator Index # - Index number as classified by state EMS vision project. Core Indicator name - Name given to the core indicator. (D) Symbol - Represents denominator. Data Aggregation - To blend all data together. Data Blinded - Withholding identification of data sources or subjects. Data Sampling - Obtaining information from a data source. Data Linkage - Relating to two separate data sources or data banks to the same
subject. Data Stratification - Breaking down of the whole into smaller related sub-groups. Denominator (D) Inclusion Criteria - Specific data element/points needed to
perform the data query as related to the specific indicator. Denominator (D) Data Source - The instrument used to capture the data. Description of Indicator Formula - Narrative of how indicator result is
mathematically derived. Display Format - The medium or style in which the final indicator results are
displayed Domain of Performance - The category of performance being evaluated.
Page 245

EMS Service Provider - An organization employing EMT-I, EMT-II, or EMT-P certified or licensed personnel for the delivery of emergency medical care to the sick and injured at the scene of an emergency and/or transport to a general acute care hospital. EMS System Quality Improvement (EMS-QI) - An organized and formal effort to
continually achieve superior outcomes through ongoing evaluation of performance indicators by system users and providers within an organized EMS Health Delivery System.
Effectiveness - How well a system is meeting an expressed objective or established benchmark.
Frequency - How often a system is meeting an expressed objective or established benchmark.
Frequency of Display - How often a specific indicator unit should be displayed over time.
Histogram - A visual representation of the spread or distribution of the data categories. Data are represented by bars of equal width or category and the height of these bars indicate the relative number of data points in each category.
Indicator Formula Numeric Expression - Mathematical expression of how indicator result is derived.
Indicator Reporting Value - The numeric value of the indicator result. Line graph - A visual display of data for comparison. Specific data points are
entered by numbers are connected by a line. Useful in demonstrating a data pattern.
Linkage Options - The different elements that may be used to link two separate data sources or banks.
Measures of central tendency - Values that describe the middle or majority of the data.
Measures of dispersion - Values that describe how the data is spread out from the average.
Mean - (Average) Sum of all data divided by the number of data points. Median - The middle of all ranked and counted data points. Minimum Data Values - The smallest number of data values which must be
available to perform a measure and analysis. Mode - The value repeated most often in the raw data. (N) Symbol - Represents the numerator. Numerator (N) Data Source - The instrument used to capture the data. Numerator (N) Inclusion Criteria - Specific data element/points needed to perform
the data query as related to the specific indicator. Objective - An expression or description of the information that indicator is seeking
to measure. Outcome - The result of activities (processes) performed by attributes (structures)
within a system; measures of intended system performance.
Page 246

Page 247
Pareto chart - A way of organizing data to show what major factors make up the indicator being analyzed. Useful in showing the many parts of a whole such as all the sub-indicators of a core indicator.
Performance Indicator - A point of comparison used to answer the question “how are we doing?”
Performance Measurement - The process of measuring accomplishments, as well as measuring in process parameters.
Periodic - Sampling specific data at random periods with random amounts. Pie chart - A graphic presentation that compares relative magnitude of frequencies
or parts of a whole. Useful in presenting outcome and process information. Population Exclusion Criteria - Specific data element/points which may be used to
exclude related data from a specified data query. Population Denominator (D) - The overall subject that the indicator measures. Population Subset Numerator (N) - The subset measurement of the denominator
population. Process - The repeatable sequence of actions used throughout interrelated
components of a prehospital EMS system to produce something of value. Process variation - Evaluations to determine if variations within a process are
statistically out of control. Range - Maximum single data value minus the minimum single data value. Rate - Sampling specific data at a specific time for a specific amount. References - Information related to the indicator which may contain helpful
comparisons on indicator performance, best practices or benchmarks. Scatter diagram - A visual display showing the relationship between two variables.
Useful in showing the relationship of a process to an outcome (e.g., time & survival).
Sentinel - Sampling all specific data at all times. Source - Origin of indicator development. Special cause - The result of a statistical trending measurement which shows a
cause in variation is statistically significant and warrants further evaluation. Standard deviation - A measurement that shows how widely spread (dispersed)
any set of data is from the average. Stratification Options - The common data elements that may be used to stratify a
specific indicator. Structure - The interrelated components forming a prehospital system. Success Rate - How often a specific activity (process) is actually performed
successfully. Sub Indicator - Smaller indicators that are major contributing factors to a core
indicator. Sub Indicator index # - Index number as classified by state EMS vision project. Sub Indicator name - Name given to subject sub-indicator. Trending Analysis - To perform a series of statistical tests to determine significant
variation in a process Type of Measure - Identifies weather an indicator is structural, process, or outcome
information.