Emergency Communications Deficiency Locator
20
Undergraduate Journal of Mathematical Undergraduate Journal of Mathematical Modeling: One + Two Modeling: One + Two Volume 11 | 2021 Spring 2021 Article 5 2021 Emergency Communications Deficiency Locator Emergency Communications Deficiency Locator Austin Collins University of South Florida Advisors: Arcadii Grinshpan, Mathematics and Statistics Arsalan Akram Malik, Mathematics and Statistics Sean Collins, Fort Knox Fire and Communications Problem Suggested By: Austin Collins Follow this and additional works at: https://digitalcommons.usf.edu/ujmm Part of the Mathematics Commons, and the Other Applied Mathematics Commons UJMM is an open access journal, free to authors and readers, and relies on your support: Donate Now Recommended Citation Recommended Citation Collins, Austin (2021) "Emergency Communications Deficiency Locator," Undergraduate Journal of Mathematical Modeling: One + Two: Vol. 11: Iss. 2, Article 5. DOI: https://doi.org/10.5038/2326-3652.11.2.4933 Available at: https://digitalcommons.usf.edu/ujmm/vol11/iss2/5
Transcript of Emergency Communications Deficiency Locator

Undergraduate Journal of Mathematical Undergraduate Journal of Mathematical
Modeling: One + Two Modeling: One + Two
Volume 11 | 2021 Spring 2021 Article 5
2021
Emergency Communications Deficiency Locator Emergency Communications Deficiency Locator
Austin Collins University of South Florida
Advisors:
Arcadii Grinshpan, Mathematics and Statistics
Arsalan Akram Malik, Mathematics and Statistics
Sean Collins, Fort Knox Fire and Communications
Problem Suggested By: Austin Collins
Follow this and additional works at: https://digitalcommons.usf.edu/ujmm
Part of the Mathematics Commons, and the Other Applied Mathematics Commons
UJMM is an open access journal, free to authors and readers, and relies on your support:
Donate Now
Recommended Citation Recommended Citation Collins, Austin (2021) "Emergency Communications Deficiency Locator," Undergraduate Journal of Mathematical Modeling: One + Two: Vol. 11: Iss. 2, Article 5. DOI: https://doi.org/10.5038/2326-3652.11.2.4933 Available at: https://digitalcommons.usf.edu/ujmm/vol11/iss2/5

Emergency Communications Deficiency Locator Emergency Communications Deficiency Locator
Abstract Abstract The Bi-Directional Amplifier (BDA) is the newest edition to Life Safety in the state of Florida. The Florida Fire Prevention Code (NFPA 1) section 11.10.1 states that “In all new and existing buildings, minimum radio signal strength for fire department communications shall be maintained at a level determined by the authority having jurisdiction (Committee NFPA 1: Fire Code 2018). That authority having jurisdiction for our local Tampa Bay area is the Hillsborough County Fire Rescue department and they have posted their own requirements along with the Florida Senate for emergency communication standards. All existing
“Hi-rise” buildings, 75 feet tall or more, must comply by Jan. 1st 2022, all existing apartment complexes must comply by 2025, and all existing buildings that do not comply with the Hillsborough County Fire Rescue department standards were supposed to have applied for permit by December of 2019 (Senate Florida Legislature) . Several building owners are unaware of the aforementioned changes and it is extremely important to efficiently identify the buildings that do not comply with the latest regulations.
To begin determining the best fix for soft spots in public safety radio transmissions I considered three separate FCC callsigns that cover the emergency radio channels around Hillsborough County. Next, I recorded the amount of Watts each tower is using to then convert to decibel gain (dB) that each tower produces. I determined that greater the power (Watts) that you push through a tower has a decreasing rate of decibels produced per watt and therefore not an option to solve the problem at hand. Then I derived an expression for “Free Space Path Loss (FSPL) in dB” that shows the dissipation of radio signal over a given distance. Using this formula, I realized I may not be able to provide an overall solution for the lack of radio signal, but I would be able to locate areas that will require the installation of a radio amplification system. Therefore, using derivative and integration techniques, I have designed a precise method for mapping areas of radio propagation around Hillsborough County, which in turn, show areas that do not receive the minimal -95dB radio strength and must have a BDA installed.
Keywords Keywords fire prevention control, fire rescue department standards, radio wave propagation, bi-directional amplification system(BDA)
Creative Commons License Creative Commons License
This work is licensed under a Creative Commons Attribution-Noncommercial-Share Alike 3.0 United States License.
This article is available in Undergraduate Journal of Mathematical Modeling: One + Two: https://digitalcommons.usf.edu/ujmm/vol11/iss2/5

1
PROBLEM STATEMENT
Bi-directional Amplification systems are now mandated in the state of Florida, per the Florida
Fire Prevention Code, and Fort Knox Fire and Communications needs a solution to provide
public safety radio coverage at a more efficient rate.
MOTIVATION
The evolving Life Safety code is one of the most important progressions in society today.
Fire alarm systems, suppression systems, radio communication systems, etc. play a critical role
in ensuring public safety under extreme circumstances. These new “two-way radio
communications” systems allow firefighters, police, and EMT’s to have immediate access to
communication to one another during an emergency within a building. And that is why the Bi-
Directional Amplification systems, BDA, were introduced in the last updated Florida Fire
Prevention Code. From an engineering aspect, when a new project is being drawn up, engineers
must list out a set of specifications required to be implemented in the building design by hired
contractors. Now the new radio communications code can be tricky to decipher when it comes to
new construction. In an existing building, the building owner can hire a company to take radio
strength readings to determine if the building has sufficient emergency communication signal.
But for new construction, there is no building to do these readings in! And sure, you may take
readings from the ground level where construction will take place, but that leaves out too many
uncalculated variables like radio wave diffraction, decibel dissipation, and the effect of decibel
gain from initial transmission. On the other side of that coin, the general contractor will not want
to make the site owner pay for unnecessary building additions, like a BDA system, if they will
fall within the acceptable decibel levels for clear two way radio communication. So, how do we
predetermine radio strength for a given location without ever stepping foot on site? Through
deriving a formula that gets down to the core understanding of radio wave propagation,
accounting for as many variables as possible, and pinpointing where the edge of the curve that
lies between areas within code and which are not.
MATHEMATICAL DESCRIPTION & SOLUTION APPROACH
Since it was important to investigate how exactly FCC Callsigns transmit public safety
frequencies, through RadioReference.com, I retrieved data from three specific tower sites that
transmit into the same general area. Figure 1 shows a map of FCC callsign (Uniquely designated
Collins: Emergency Communications Deficiency Locator
Produced by The Berkeley Electronic Press, 2021

2
government agency frequencies) locations that cover the same intermediate area within the
Hillsborough County limits. I will be using these same tower locations throughout the project.
Figure 1
(Hillsborough County (EDACS) - Site Map)
Figure 2 states the FCC Callsign addresses along with miscellaneous tower information.
Figure 2 (FCC Callsign WPDV262 (Hillsborough Co. Sheriff's Office))
# Tower ID Type Ant Height Struc Height Elevation Address
1 1054317 TOWER 121.9 126.5 6.0 3212 S 78TH STREET
2 TOWER 54.9 58.8 26.0 1120 7TH STREET
3 TOWER 54.9 57.3 32.0 6766 LITHIA PINECREST ROAD
These three FCC Callsign locations operate under the Hillsborough County Sheriff’s
Office FCC license “WPDV262”. All locations use an analog system voice and can be
transmitted and received by Fire, EMT, and Police officers. Figure 3 shows the frequencies in
which these officers communicate over for emergencies.
Figure 3 Site Frequencies
(Hillsborough County (EDACS))
851.125 851.375 851.5625 851.700 851.825 852.3125 852.550 852.650 852.800 852.9125
853.250 853.275 853.575 853.600 853.825
Undergraduate Journal of Mathematical Modeling: One + Two, Vol. 11, Iss. 2 [2021], Art. 5
https://digitalcommons.usf.edu/ujmm/vol11/iss2/5DOI: https://doi.org/10.5038/2326-3652.11.2.4933

3
*for my project I will be using frequency 851.125 mHz
Power in Watts to Decibels conversion
1. Through the following link you will see that each tower in Hillsborough County operates
at an output power of 100 watts. (ULS License FCC)
2. The watts to decibel conversion formula: 𝑔(𝑥) = 10 ∙ log10(1000 ∙ 𝑥)
3. Input “x” will be in watts and “𝑔(𝑥)” will be in decibels or dB’s.
4. The goal of this calculation and the following graph (Figure 4) is to see the number of
decibels that 100 watts puts off as well as how subtracting or adding more power will
affect the number of decibels produced.
Figure 4 𝑔(𝑥) = 10 ∙ 𝑙𝑜𝑔10(1000 ∙ 𝑥)
To further investigate the watts to decibel conversion I decided to take the derivative of the
formula 𝑔(𝑥) = 10 ∙ log10(1000 ∙ 𝑥) which gave me 𝑔′(𝑥) = 10/(𝑥 ln 10). Based on the
derivative of the watts to decibel conversion formula we can determine if adding wattage to the
tower transmitter locations is a viable solution for public safety radio coverage in the
intermediate areas.
Derivative of Power in Watts to Decibel conversion
1. Derivation formula: 𝑔′(𝑥) =10
𝑥 ln 10
Input “x” will be in watts and “𝑔′(𝑥)” will be in dB/watt.
43.98
46.99
48.75
5050.97
51.7652.43
53.01
40
42
44
46
48
50
52
54
0 50 100 150 200 250
DEC
IBEL
S (D
B)
POWER (WATTS)
Watts to Decibel Conversion
Collins: Emergency Communications Deficiency Locator
Produced by The Berkeley Electronic Press, 2021

4
2. The goal of this calculation and the following graph (Figure 5) is to determine if 𝑔(𝑥) is
increasing or decreasing as you apply more wattage to the transmitter tower.
Figure 5 𝑔′(𝑥) = 10/(𝑥 ln 10)
The 𝑔′(𝑥) =10
𝑥ln 10 graph has produced y-values that are above the x-axis and this tells us
that 𝑔(𝑥) = 10 ∙ log10(1000 ∙ 𝑥) is still increasing as you add more power to the tower. But, is
this enough evidence to prove that adding more power will be a viable solution to public safety
radio transmission? Let us take the second derivative to determine the overall trend of 𝑔(𝑥).
The second derivative of Power in Watts to Decibel conversion
1. Second Derivation Formula: 𝑔′′(𝑥) = −10
𝑥 2 ln 10
2. The input “x” will be in watts and 𝑔′′(𝑥) will be dB’s/(watt)2.
3. The goal of this calculation and the following graph (Figure 6) is to test the
concavity of 𝑔(𝑥) in order to determine if increasing power produces an increased
or decreased rate of dB’s/watt.
0.17
0.09
0.06
0.0430.035
0.029 0.025 0.022
0
0.02
0.04
0.06
0.08
0.1
0.12
0.14
0.16
0.18
0 50 100 150 200 250
DEC
IBEL
S/W
ATT
POWER IN WATTS
dy/dx of Watts to Decibel Conversion
Undergraduate Journal of Mathematical Modeling: One + Two, Vol. 11, Iss. 2 [2021], Art. 5
https://digitalcommons.usf.edu/ujmm/vol11/iss2/5DOI: https://doi.org/10.5038/2326-3652.11.2.4933

5
Figure 6 𝑔′′(𝑥) = −10
𝑥 2 ln 10
*Ignore the trend line eclipsing the x-axis, the y-values become infinitesimally
small with the lim𝑥→∞
𝑔′′(𝑥) = 0.
The 𝑔′′(𝑥) graph has produced all values below the x-axis which tells us that
𝑔(𝑥) = 10 ∙ log10(1000 ∙ 𝑥) is concave downward. Ultimately, these derivations of our initial
power to decibel conversion formula prove that as you add more power you get less decibel gain
per watt added. Therefore, increasing transmitter tower power provides insignificant decibel gain
and is not a viable solution for public safety radio coverage.
Now I will focus to devising an efficient process for locating “soft spots” in public safety
radio coverage within my selected FCC callsigns intermediate area. This will allow my company
to either locate existing buildings that will need a BDA system to be brought up to code, or to
inform engineers on whether or not their new construction projects will need a BDA system
transcribed into their specifications. Free Space Path Loss, or “FSPL”, is a term used to define
the dissipation of radio wave propagation over a given distance in space. I will first show how
FSPL is derived, then, using a constant of 851.125 megahertz (mHz) and an input of distance in
kilometers (km) as a variable, I will determine various decibel loss over a given distance.
Deriving the Free Space Path Loss formula for dB’s
• Radio wave propagation path loss model: (Chemguide.co.uk Wavelength and frequency)
-0.00695
-0.00174
-0.00077-0.00043 -0.00028 -0.00019 -0.00014 -0.00011
-0.008
-0.007
-0.006
-0.005
-0.004
-0.003
-0.002
-0.001
0
0.001
0.002
0 50 100 150 200 250
DEC
IBEL
S/W
ATT
^2
POWER IN WATTS
d^2 y/dx^2 of Watts to Decibel Conversion
Collins: Emergency Communications Deficiency Locator
Produced by The Berkeley Electronic Press, 2021

6
𝐿(𝑥) = (4𝜋𝑥
𝜆)
2
*where 𝜆 = 𝑐/𝜈
𝐿(𝑥) = (4𝜋𝑥𝜈
𝑐)
2
*where “𝑐” is the constant of the speed of light; “𝜈” stands for frequency
𝐿(𝑥) = (4𝜋𝑥𝜈 ∙1 ∙ 106
3 ∙ 105)
2
*for distance (𝑥) in kilometers; for (𝜈) in megahertz
• Now to get the dB version of the path loss model we must take the log of both sides of
the equation multiplied by -10:
𝑓(𝑥) = −10 log (4𝜋𝑥𝜈 ∙1 ∙ 106
3 ∙ 105)
2
• Finally, we get the final equation for the dB version of the radio wave propagation path
loss model as follows:
𝑓(𝑥) = −(32.44 + 20 log10(𝜈) + 20 log10(𝑥))
(Kuo, Derivation the dB version of the Path Loss Equation for Free Space)
The FSPL Formula for dB’s
1. FSPL formula: 𝑓(𝑥) = −(32.44 + 20 log10(𝜈) + 20 log10(𝑥))
2. The input “𝑥” will be distance in kilometers and “𝑓(𝑥)” will be in decibels. “ν” will be a
constant of 851.125 megahertz.
3. The goal of this calculation and the following graph (Figure 7) is to determine free space
path loss in decibels at various distances from the transmitter tower.
Undergraduate Journal of Mathematical Modeling: One + Two, Vol. 11, Iss. 2 [2021], Art. 5
https://digitalcommons.usf.edu/ujmm/vol11/iss2/5DOI: https://doi.org/10.5038/2326-3652.11.2.4933

7
Figure 7 𝑓(𝑥) = −(32.44 + 20 log10(𝜈) + 20 log10(𝑥))
T
h
e
g
r
a
p
h
o
f
“
𝑓(𝑥)” produces all negative values for decibels because this shows the “loss” of radio signal
over a given distance. To further investigate the rate at which decibels are lost per
kilometer we can take derivative of 𝑦 = 𝑓(𝑥).
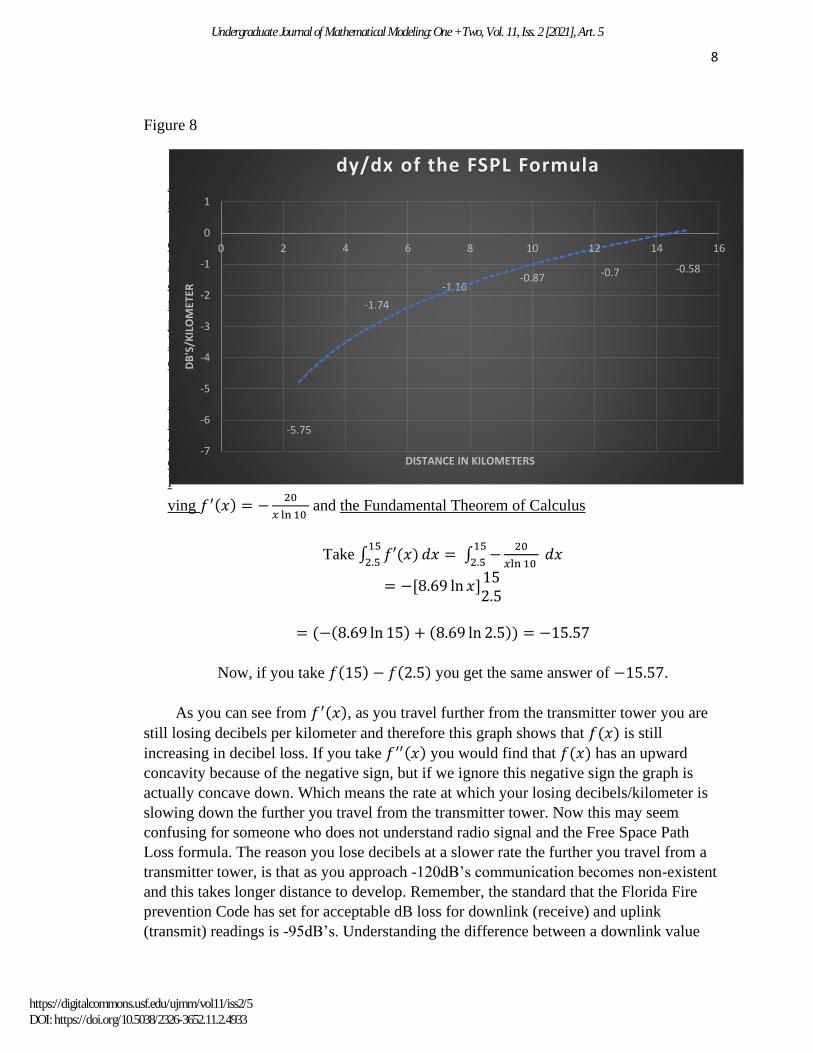
𝑑𝑦/𝑑𝑥 of the FSPL Formula
1. Derivation Formula: 𝑓′(𝑥) = −20
𝑥ln 10
2. The input “𝑥” will be distance in kilometers and “𝑓′(𝑥)” will be in dB’s/km. Notice
that your constant “ν” is not longer apart of the formula. This tells us the impact of
frequency is insignificant to the overall decibel loss per kilometer.
3. The goal of this calculation and graph (Figure 8) is to determine decibel loss per
kilometer as you travel further away from the transmitter tower and whether or not
“𝑓(𝑥)” is increasing or decreasing in lost decibels.
-99
-105
-109
-111
-113
-115
-116
-114
-112
-110
-108
-106
-104
-102
-100
-98
0 2 4 6 8 10 12 14 16
DEC
IBEL
S
DISTANCE IN KILOMETERS
FSPL in dB's
Collins: Emergency Communications Deficiency Locator
Produced by The Berkeley Electronic Press, 2021
8
Figure 8
A
n
e
x
a
m
p
l
e
i
n
v
o
l
ving 𝑓′(𝑥) = −20
𝑥 ln 10 and the Fundamental Theorem of Calculus
Take ∫ 𝑓′(𝑥)15
2.5𝑑𝑥 = ∫ −
20
𝑥ln 10 𝑑𝑥
15
2.5
= −[8.69 ln 𝑥]152.5
= (−(8.69 ln 15) + (8.69 ln 2.5)) = −15.57
Now, if you take 𝑓(15) − 𝑓(2.5) you get the same answer of −15.57.
As you can see from 𝑓′(𝑥), as you travel further from the transmitter tower you are
still losing decibels per kilometer and therefore this graph shows that 𝑓(𝑥) is still
increasing in decibel loss. If you take 𝑓′′(𝑥) you would find that 𝑓(𝑥) has an upward
concavity because of the negative sign, but if we ignore this negative sign the graph is
actually concave down. Which means the rate at which your losing decibels/kilometer is
slowing down the further you travel from the transmitter tower. Now this may seem
confusing for someone who does not understand radio signal and the Free Space Path
Loss formula. The reason you lose decibels at a slower rate the further you travel from a
transmitter tower, is that as you approach -120dB’s communication becomes non-existent
and this takes longer distance to develop. Remember, the standard that the Florida Fire
prevention Code has set for acceptable dB loss for downlink (receive) and uplink
(transmit) readings is -95dB’s. Understanding the difference between a downlink value
-5.75
-1.74
-1.16-0.87 -0.7 -0.58
-7
-6
-5
-4
-3
-2
-1
0
1
0 2 4 6 8 10 12 14 16
DB
'S/K
ILO
MET
ER
DISTANCE IN KILOMETERS
dy/dx of the FSPL Formula
Undergraduate Journal of Mathematical Modeling: One + Two, Vol. 11, Iss. 2 [2021], Art. 5
https://digitalcommons.usf.edu/ujmm/vol11/iss2/5DOI: https://doi.org/10.5038/2326-3652.11.2.4933

9
and an uplink value is very important to this project and the public safety radio standards.
Figure 9 will help put this into perspective.
Figure 9
(B. Technical & Sales Resources for RSI Distributors)
A downlink is a value of dBm, or “decibel milliwatts”, coming from the transmitter
tower to the location in which you may be taking radio strength readings at to determine
if the site is within code. Typically, this dBm value is being powered by 50-200 watts
depending on the transmitter tower. Keep in mind, Figure 9 is using a 50-watt transmitter
tower versus we are using 100-watt towers. Now, the uplink value is produced by a
public safety portable radio that is only powered on average by 3-watts. Which has much
less dBm output than the 100 watt towers we are using for this project. Therefore, for the
uplink value ≥ (-95dB’s) you must have a downlink value ≥ (-79dB’s).
Difference in downlink vs. uplink value = (50dB’s – 34dB’s) = 16dB’s
Building Material Decibel Loss Constants
So far, we have calculated the number of decibels a 100-watt tower produces and various
free space path loss decibel values for a range of distance. The last variable I would like to
account for before putting together the final formula is how different types of building material
affect decibel loss. I have chosen to use three most common types of building material to create
my “Emergency Communication Deficiency Locator” maps.
• Concrete Building Constant: (𝐶) ≈ −25𝑑𝐵′𝑠
• Brick Building Constant: (𝐵) ≈ −20𝑑𝐵′𝑠
• Wood Building Constant: (𝑊) ≈ −15𝑑𝐵′𝑠
Collins: Emergency Communications Deficiency Locator
Produced by The Berkeley Electronic Press, 2021

10
*All constants have been determined based on emergency communication site surveys
carried out by myself for Fort Knox Fire and Communications, examples can be found in the
Appendices. Readings taken outside the walls of the site versus readings taken on the insides
of those walls gave me an approximation for these constants.
Emergency Communications Deficiency Locator Formulas
Base Formula
(𝑇𝑜𝑤𝑒𝑟 𝑑𝐵 𝐺𝑎𝑖𝑛) + (𝐹𝑆𝑃𝐿 + 𝐵𝑢𝑖𝑙𝑑𝑖𝑛𝑔 𝑀𝑎𝑡𝑒𝑟𝑖𝑎𝑙 𝐶𝑜𝑛𝑠𝑡𝑎𝑛𝑡) ≥ −79𝑑𝐵′𝑠
Extended Formulas
((10 ∙ log10(1000(100))) + (−(32.44 + 20 log10(851.125) + 20 log10(𝑑𝑖𝑠𝑡𝑎𝑛𝑐𝑒)) − (𝐶)) ≥ −79𝑑𝐵′𝑠
((10 ∙ log10(1000(100))) + (−(32.44 + 20 log10(851.125) + 20 log10(𝑑𝑖𝑠𝑡𝑎𝑛𝑐𝑒)) − (𝐵)) ≥ −79𝑑𝐵′𝑠
((10 ∙ log10(1000(100))) + (−(32.44 + 20 log10(851.125) + 20 log10(𝑑𝑖𝑠𝑡𝑎𝑛𝑐𝑒)) − (𝑊)) ≥ −79𝑑𝐵′𝑠
Acceptable Distances per Building Material Types and their Coverages
*Area of a circle: 𝜋𝑟2
1. Building type: Concrete Buildings
a. Acceptable Distances per dB readings ≥-79dB’s: 5.0 km
i. 𝜋(5.0𝑘𝑚)2 = 78.5𝑘𝑚2
2. Building type: Brick Buildings
a. Acceptable Distances per dB readings ≥-79dB’s: 7.5 km
i. 𝜋(7.5𝑘𝑚)2 = 176.7𝑘𝑚2
3. Building type: Wood Buildings
a. Acceptable Distances per dB readings ≥-79dB’s: 15 km
i. 𝜋(15𝑘𝑚)2 = 706.9𝑘𝑚2
*All calculations can be found in the Appendices.
DISCUSSION
My work has produced coverage maps in which represent three local FCC Callsigns in the
Hillsborough County area and their intermediate areas. My project name, “Emergency
Communication Deficiency Locator”, is represented by the space in between each propagation
coverage shown in these maps. Propagation of radio waves spreads from a central location into
the area of a circle, hence the reason I used the area of a circle formula to gather my coverages in
the previous section.
Undergraduate Journal of Mathematical Modeling: One + Two, Vol. 11, Iss. 2 [2021], Art. 5
https://digitalcommons.usf.edu/ujmm/vol11/iss2/5DOI: https://doi.org/10.5038/2326-3652.11.2.4933

11
Emergency Communication Deficiency Locator Maps
1. Concrete Buildings: https://www.mapdevelopers.com/draw-circle-
tool.php?circles=%5B%5B5000%2C27.918688%2C-
82.368623%2C%22%23AAAAAA%22%2C%22%23000000%22%2C0.4%5D%2C%5B
5000%2C27.850123%2C-
82.173469%2C%22%23AAAAAA%22%2C%22%23000000%22%2C0.4%5D%2C%5B
5000%2C27.7080057%2C-
82.3041788%2C%22%23AAAAAA%22%2C%22%23000000%22%2C0.4%5D%5D
(Collins Map Developers Concrete buildings)
Collins: Emergency Communications Deficiency Locator
Produced by The Berkeley Electronic Press, 2021

12
2. Brick Buildings: https://www.mapdevelopers.com/draw-circle-
tool.php?circles=%5B%5B7500%2C27.7080057%2C-
82.3041788%2C%22%23AAAAAA%22%2C%22%23000000%22%2C0.4%5D%2C%5
B7500%2C27.850123%2C-
82.173469%2C%22%23AAAAAA%22%2C%22%23000000%22%2C0.4%5D%2C%5B
7500%2C27.918688%2C-
82.368623%2C%22%23AAAAAA%22%2C%22%23000000%22%2C0.4%5D%5D
(Collins Map Developers Brick Buildings)
3. Wood Buildings: https://www.mapdevelopers.com/draw-circle-
tool.php?circles=%5B%5B15000%2C27.7080057%2C-
82.3041788%2C%22%23AAAAAA%22%2C%22%23000000%22%2C0.4%5D%2C%5
Undergraduate Journal of Mathematical Modeling: One + Two, Vol. 11, Iss. 2 [2021], Art. 5
https://digitalcommons.usf.edu/ujmm/vol11/iss2/5DOI: https://doi.org/10.5038/2326-3652.11.2.4933

13
B15000%2C27.850123%2C-
82.173469%2C%22%23AAAAAA%22%2C%22%23000000%22%2C0.4%5D%2C%5B
15000%2C27.918688%2C-
82.368623%2C%22%23AAAAAA%22%2C%22%23000000%22%2C0.4%5D%5D
(Collins Map developers Wood Buildings)
Radio waves have obvious distinction in their capability to travel through different
building materials. Each map illustrates this distinction with wood structures having the greatest
radio wave transparency, whereas, brick and concrete buildings are more stifling. This project
has allowed me to explore emergency communication coverages in our local area. My project
has several implications for engineering, with respect to radio communications and life safety.
Accurately predicting emergency communication coverages at a location could revolutionize the
Bi-Directional Amplifier industry as it significantly reduces time and resources spent on site
surveys. Moreover, it is helpful for engineers in dealing with BDA systems when listing
specifications for their new construction projects.
Conclusions & Recommendations
The Bi-Directional Amplifier (BDA) is the newest edition to Life Safety in the state of
Florida. The Florida Fire Prevention Code (NFPA 1) section 11.10.1 states that “In all new and
existing buildings, minimum radio signal strength for fire department communications shall be
maintained at a level determined by the authority having jurisdiction. Unfortunately, several
building owners are unaware of the updated fire prevention codes and therefore, risk closure of
their businesses. The largest issue for the Life Safety Industry today, is being able to decisively
determine which buildings are not within code at an efficient rate. The goal of this project was to
investigate different strategies to enhance emergency radio communications. The first formula I
analyzed was the power in watts to decibel conversion. I chose this formula to start my project
because if we could boost the decibel coverage from its origin of transmission then we would
arrive at an overall solution with more ease. Unfortunately, through deriving the first and second
derivatives of the power to decibel conversion, I came to the conclusion that as you add more
power to the formula you receive less decibel gain per watt and therefore an impractical strategy
for my problem statement. The next strategy I decided to investigate was finding a way to
produce radio frequency coverage maps that are adequate per the Florida Fire Prevention Code.
This led me to derive a formula for Free Space Path Loss in decibels using megahertz and
kilometer units. With the FSPL formula I was able to graph a set of distances and their produced
decibel losses. Next, I analyzed the FSPL graph by taking its derivative to see how distance
affected decibel loss per kilometer. Lastly, I added building material loss constants to hone in on
accurate results and to provide a variety of coverage maps. Using the formula of the area of a
circle I was able to produce emergency radio communication coverage maps in kilometers
squared. If someone would like to approach the same project, I would suggest looking in to
providing coverage maps of different areas across the United States. It is only a matter of time
before other states adopt these Life Safety regulations and with new locations will come new sets
of variables for the formulas. For example, transmitter power levels, building materials, and
emergency frequencies could all be different and these need to be taken account for. For new
Collins: Emergency Communications Deficiency Locator
Produced by The Berkeley Electronic Press, 2021

14
project ideas, I would suggest deriving a formula for variables that account for inside wall
building materials as well as surrounding obstructions that cause radio wave diffraction. These
may prove to be difficult, but with the right calculus tools employed, solutions are inevitable.
Nomenclature
𝑔(𝑥) Watts to dB conversion
𝑔′(𝑥) dB/watts
𝑔′′(𝑥) dB/(watts)2
𝑓(𝑥) Free Space Path Loss (FSPL) in dB
𝑓′(𝑥) FSPL(dB)/km
𝑓′′(𝑥) FSPL(dB)/(km)2
𝐶 Concrete building constant
𝐵 Brick building constant
𝑊 Wood building constant
w Watts
Km Kilometers
dB Decibels (short for dBm)
dBm Decibel milliwatt
λ Wavelength
c Speed of Light constant
ν Frequency
FSPL Free Space Path Loss
r Radius
𝜋(𝑟)2 Area of a circle
FCC Callsign Unique government designated tower
x Input variable
𝑑𝑦
𝑑𝑥 𝑎𝑛𝑑
𝑑2𝑦
𝑑𝑥2
Leibniz Notation
*Metric Units used throughout the project and for results.
Undergraduate Journal of Mathematical Modeling: One + Two, Vol. 11, Iss. 2 [2021], Art. 5
https://digitalcommons.usf.edu/ujmm/vol11/iss2/5DOI: https://doi.org/10.5038/2326-3652.11.2.4933

15
REFERENCES
B., Nicky. “Technical & Sales Resources for RSI Distributors.” Radio Solutions Inc., Radio
Solutions Inc., rsibda.com/news/minimum-inbound-outbound-signal-strength/.
Collins, Austin. Map Developers, 25 Apr. 2020, www.mapdevelopers.com/draw-circle-
tool.php?circles=%5B%5B15000%2C27.7080057%2C-
82.3041788%2C%22%23AAAAAA%22%2C%22%23000000%22%2C0.4%5D%2C%5B
15000%2C27.850123%2C-
82.173469%2C%22%23AAAAAA%22%2C%22%23000000%22%2C0.4%5D%2C%5B1
5000%2C27.918688%2C-
82.368623%2C%22%23AAAAAA%22%2C%22%23000000%22%2C0.4%5D%5D.
Collins, Austin. Map Developers, 25 Apr. 2020, www.mapdevelopers.com/draw-circle-
tool.php?circles=%5B%5B5000%2C27.918688%2C-
82.368623%2C%22%23AAAAAA%22%2C%22%23000000%22%2C0.4%5D%2C%5B5
000%2C27.850123%2C-
82.173469%2C%22%23AAAAAA%22%2C%22%23000000%22%2C0.4%5D%2C%5B5
000%2C27.7080057%2C-
82.3041788%2C%22%23AAAAAA%22%2C%22%23000000%22%2C0.4%5D%5D.
Collins, Austin. Map Developers, 25 Apr. 2020, www.mapdevelopers.com/draw-circle-
tool.php?circles=%5B%5B7500%2C27.7080057%2C-
82.3041788%2C%22%23AAAAAA%22%2C%22%23000000%22%2C0.4%5D%2C%5B
7500%2C27.850123%2C-
82.173469%2C%22%23AAAAAA%22%2C%22%23000000%22%2C0.4%5D%2C%5B7
500%2C27.918688%2C-
82.368623%2C%22%23AAAAAA%22%2C%22%23000000%22%2C0.4%5D%5D.
“FCC Callsign WPDV262 (Hillsborough Co. Sheriff's Office).” WPDV262 (Hillsborough Co.
Sheriff's Office) FCC Callsign Details, Radio Reference LLC, 30 Apr. 2020, 5:41 pm,
www.radioreference.com/apps/db/?fccCallsign=WPDV262.
“FCC.” ULS License - PubSafty/SpecEmer/PubSaftyNtlPlan,806-817/851-862MHz,Trunked
License - WPDV262 - Hillsborough Co. Sheriff's Office - Frequencies Summary,
wireless2.fcc.gov/UlsApp/UlsSearch/licenseFreqSum.jsp?licKey=1301307&keyLoc=1414
0574&pageNumToReturn=1.
Collins: Emergency Communications Deficiency Locator
Produced by The Berkeley Electronic Press, 2021

16
“Hillsborough County (EDACS) - Site Map.” Site Map: Hillsborough County (EDACS)
Trunking System, Hillsborough County, Florida, Radio Reference LLC, 4 Apr. 2020, 9:34
am, www.radioreference.com/apps/db/?action=siteMap&sid=220&type=fcc.
“Hillsborough County (EDACS).” East System Site Details (Hillsborough County (EDACS)),
Radio Reference LLC, 4 Apr. 2020, 9:34 am,
www.radioreference.com/apps/db/?siteId=217.
Kayla. “Wavelength Equation.” Calculations with Wavelength and Frequency,
Chemguide.co.uk, 23 June 2016, socratic.org/questions/what-is-the-frequency-of-green-
light-with-a-wavelength-of-530-10-9-m.
Kuo, Yajun. “Derivation the DB Version of the Path Loss Equation for Free Space.” Derivation
the DB Version of the Path Loss Equation for Free Space., Www.ece.uvic.ca, 19 Sept.
2000, www.ece.uvic.ca/~peterd/35001/ass1a/node1.html.
United States, Congress, Committee, Technical. “NFPA 1: Fire Code 2018.” NFPA 1: Fire Code
2018, vol. 1, National Fire Protection Association, 2017. Sec. 11.10.1-11.10.2.
United States, Congress, Senate, Florida. “Florida Legislature.” Florida Legislature, Florida
Senate, 2018. Statute 633.202.
APPENDICES
Code Reference
Undergraduate Journal of Mathematical Modeling: One + Two, Vol. 11, Iss. 2 [2021], Art. 5
https://digitalcommons.usf.edu/ujmm/vol11/iss2/5DOI: https://doi.org/10.5038/2326-3652.11.2.4933

17
Code Reference
Collins: Emergency Communications Deficiency Locator
Produced by The Berkeley Electronic Press, 2021

18
Site Survey Example 1
Site Survey Example 2
Point
Hand Held Gain
(dBm)
Donor Tower Gain
(dBm)
Frequency Inbound
Downlink RSSI (dBm)
PASS/FAIL Path Loss
Outbound Uplink
RSSI(dBm) PASS/FAIL
OUTSIDE SE Corner 34 51.76 02 851.700 -75 PASS 126.76 -92.76 PASS
OUTSIDE NE Corner 34 51.76 02 851.700 -70 PASS 121.76 -87.76 PASS
OUTSIDE SW Corner 34 51.76 02 851.700 -76 PASS 127.76 -93.76 PASS
OUTSIDE NW Corner 34 51.76 02 851.700 -85 PASS 136.76 -102.76 FAIL
Fire Pump Room 34 51.76 02 851.700 -100 FAIL 151.76 -117.76 FAIL
Sprinkler Riser 1 34 51.76 02 851.700 -85 PASS 136.76 -102.76 FAIL
Sprinkler Riser 2 34 51.76 02 851.700 -85 PASS 136.76 -102.76 FAIL
Electric Room / FACP 34 51.76 02 851.700 -95 PASS 146.76 -112.76 FAIL
ROOF SE Corner 34 51.76 02 851.700 -67 PASS 118.76 -84.76 PASS
ROOF NE Corner 34 51.76 02 851.700 -60 PASS 111.76 -77.76 PASS
ROOF SW Corner 34 51.76 02 851.700 -64 PASS 115.76 -81.76 PASS
ROOF NW Corner 34 51.76 02 851.700 -64 PASS 115.76 -81.76 PASS
10 3/12/2020 34 51.76 -78 PASS 129.76 -95.76 FAIL
11 3/12/2020 34 51.76 -75 PASS 126.76 -92.76 PASS
12 3/12/2020 34 51.76 -79 PASS 130.76 -96.76 FAIL
13 3/12/2020 34 51.76 -74 PASS 125.76 -91.76 PASS
14 3/12/2020 34 51.76 -80 PASS 131.76 -97.76 FAIL
15 3/12/2020 34 51.76 -70 PASS 121.76 -87.76 PASS
16 3/12/2020 34 51.76 -78.5 PASS 130.26 -96.26 FAIL
17 3/12/2020 34 51.76 -75 PASS 126.76 -92.76 PASS
18 3/12/2020 34 51.76 -78.5 PASS 130.26 -96.26 FAIL
19 3/12/2020 34 51.76 -74.5 PASS 126.26 -92.26 PASS
Undergraduate Journal of Mathematical Modeling: One + Two, Vol. 11, Iss. 2 [2021], Art. 5
https://digitalcommons.usf.edu/ujmm/vol11/iss2/5DOI: https://doi.org/10.5038/2326-3652.11.2.4933