Emergency Care Services - AJEF - Association des...
50
Please cite this paper as: Berchet, C. (2015), “Emergency Care Services: Trends, Drivers and Interventions to Manage the Demand”, OECD Health Working Papers, No. 83, OECD Publishing, Paris. http://dx.doi.org/10.1787/5jrts344crns-en OECD Health Working Papers No. 83 Emergency Care Services TRENDS, DRIVERS AND INTERVENTIONS TO MANAGE THE DEMAND Caroline Berchet JEL Classification: H51, I10, I18
Transcript of Emergency Care Services - AJEF - Association des...

Please cite this paper as:
Berchet, C. (2015), “Emergency Care Services: Trends,Drivers and Interventions to Manage the Demand”, OECDHealth Working Papers, No. 83, OECD Publishing, Paris.http://dx.doi.org/10.1787/5jrts344crns-en
OECD Health Working Papers No. 83
Emergency Care Services
TRENDS, DRIVERS AND INTERVENTIONS TOMANAGE THE DEMAND
Caroline Berchet
JEL Classification: H51, I10, I18

Unclassified DELSA/HEA/WD/HWP(2015)6 Organisation de Coopération et de Développement Économiques Organisation for Economic Co-operation and Development 01-Sep-2015 ________________________________________________________________________________________________________ English text only DIRECTORATE FOR EMPLOYMENT, LABOUR AND SOCIAL AFFAIRS HEALTH COMMITTEE
Health Working Papers
OECD Working Paper No. 83 EMERGENCY CARE SERVICES: TRENDS, DRIVERS AND INTERVENTIONS TO MANAGE THE DEMAND Caroline Berchet*
JEL classification: I10, I18 and H51 Authorised for publication by Stefano Scarpetta, Director, Directorate for Employment, Labour and Social Affairs (*) OECD, Directorate for Employment, Labour and Social Affairs, Health Division.
All Health Working Papers are now available through the OECD's Internet Website at http://www.oecd.org/health-systems/health-working-papers.htm JT03381148
Complete document available on OLIS in its original format This document and any map included herein are without prejudice to the status of or sovereignty over any territory, to the delimitation of international frontiers and boundaries and to the name of any territory, city or area.
DELSA
/HEA
/WD
/HW
P(2015)6 U
nclassified
English text only
DELSA/HEA/WD/HWP(2015)6
2
DIRECTORATE FOR EMPLOYMENT, LABOUR AND SOCIAL AFFAIRS
www.oecd.org/els
OECD HEALTH WORKING PAPERS
http://www.oecd.org/els/health-systems/health-working-papers.htm
OECD Working Papers should not be reported as representing the official views of the OECD or of its member countries. The opinions expressed and arguments employed are those of the author(s).
Working Papers describe preliminary results or research in progress by the author(s) and are published to stimulate discussion on a broad range of issues on which the OECD works. Comments on Working Papers are welcomed, and may be sent to the Directorate for Employment, Labour and Social Affairs OECD, 2 rue André-Pascal, 75775 Paris Cedex 16, France.
This series is designed to make available to a wider readership selected health studies prepared for use within the OECD. Authorship is usually collective, but principal writers are named. The papers are generally available only in their original language – English or French – with a summary in the other.
The statistical data for Israel are supplied by and under the responsibility of the relevant Israeli authorities. The use of such data by the OECD is without prejudice to the status of the Golan Heights, East Jerusalem and Israeli settlements in the West Bank under the terms of international law.
Applications for permission to reproduce or translate all or part of this material should be made to:
Head of Publications Service
OECD 2, rue André-Pascal
75775 Paris, CEDEX 16 France
Copyright OECD 2015

DELSA/HEA/WD/HWP(2015)6
3
ACKNOWLEDGEMENTS
I would like to thank Valérie Paris for her guidance and her comments on earlier versions of this paper.

DELSA/HEA/WD/HWP(2015)6
4
SUMMARY
Emergency departments are the front line of health care systems and play a critical role in ensuring an efficient and high-quality response for patients in stress or crisis situations. A growing demand for emergency care might however reduce patients’ satisfaction (through waiting times), increase health provider workload and adversely affect quality of care. This working paper begins with an overview of the trends in the volume of emergency department visits across 21 OECD countries. It then explores the main drivers of emergency department visits in hospital settings, paying attention to both demand and supply side determinants. Thereafter, national approaches instituted by countries to reduce the demand for emergency care and to guarantee a more efficient use of emergency resources are presented.
RÉSUMÉ
Les services d'urgence sont souvent en première ligne des systèmes de soins de santé et jouent un rôle essentiel pour apporter une réponse efficace aux patients dont la situation est difficile. Une demande croissante de soins urgents peut néanmoins conduire à un mécontentement des patients au vu des délais d’attente, à une augmentation de la charge de travail du personnel de santé, et la qualité des soins peut s’en ressentir. Ce document de travail examine tout d’abord l’évolution du nombre de patients qui se rendent aux urgences dans 21 pays de l’OCDE. Il analyse ensuite les principaux déterminants de l’utilisation des services d’urgence, en étudiant à la fois les déterminants liés à la demande et à l’offre de soins. Enfin, le document de travail passe en revue les approches nationales adoptées par certains pays pour réduire la demande de soins urgents et assurer une utilisation plus efficiente des ressources.
DELSA/HEA/WD/HWP(2015)6
5
TABLE OF CONTENTS
ACKNOWLEDGEMENTS ............................................................................................................................ 3
SUMMARY .................................................................................................................................................... 4
RESUMÉ ......................................................................................................................................................... 4
1. INTRODUCTION ....................................................................................................................................... 7
2. TRENDS IN THE VOLUME OF VISITS TO EMERGENCY DEPARTMENTS ACROSS OECD COUNTRIES ................................................................................................................................................... 8
2.1. The number of visits to emergency departments has increased over the past decade in almost all OECD countries ........................................................................................................................................... 8 2.2. Emergency department visits are more frequent in the very young and the very old, while injury diagnoses constitute one of the most common reasons for visiting hospital emergency departments ...... 10 2.3. A significant proportion of ED visits are considered “inappropriate” in a number of OECD countries13
3. DETERMINANTS OF EMERGENCY DEPARTMENT VISITS ........................................................... 15
3.1. On the demand side: individuals’ preferences, health needs and socio-economic factors.................. 15 3.2. On the supply side: a lack of access to primary care services and changing medical practice ........... 18
A lack of access to primary health care and a shortage of out-of-hours services are associated with the demand for emergency care ................................................................................................................... 18 The development of ambulatory surgery may partly explain the rise in ED visits ................................ 20
4. POLICY OPTIONS TO MANAGE VISITS TO EMERGENCY DEPARTMENTS .............................. 21
4.1. Interventions aimed at reducing the demand for emergency care ....................................................... 21 4.1.1. Increasing primary and community care accessibility, especially out-of-hours primary care services and community care centres ..................................................................................................... 21 4.1.2. Financial incentives on the demand side might potentially reduce the demand for emergency care, but the evidence on impact is mixed .............................................................................................. 28 4.1.3. Using information and communication technologies to improve patient self-monitoring and management, as well as to provide health services in remote areas, can be effective............................ 29
4.2. Interventions aimed at improving pathways of care and reducing costs for inappropriate use of emergency departments ............................................................................................................................. 30
4.2.1. There is mixed evidence of the impact of GPs working in emergency departments ................... 30 4.2.2. Using fast-track systems to redirect non-urgent patients reduces the use of emergency department services ................................................................................................................................ 31 4.2.3. Payment system design can help enhance patient discharge from emergency departments or reduce emergency admissions ................................................................................................................ 32
5. CONCLUSIONS ....................................................................................................................................... 34
REFERENCES .............................................................................................................................................. 36
ANNEX ......................................................................................................................................................... 42
DELSA/HEA/WD/HWP(2015)6
6
Tables
Table 1. Emergency department visits by patient age (% col), selected OECD countries ........................ 11 Table 2. Emergency department visits by main causes or diagnostics (% col), selected OECD countries12 Table 3. Predominant mode of provision of out-of-hours primary care in OECD countries ..................... 18 Table 4. Use of co-payments in emergency departments in selected OECD countries ............................. 29 Table A1. Sources and definitions of data used for each OECD country .................................................. 42 Table A2. Absolute number of visits to emergency department across OECD countries, 2001 (or nearest available year) and 2012 (or most recent year) .......................................................................................... 43 Table A3. Number of visits to emergency departments per 100 population across OECD countries, 2001 (or nearest available year) and 2011 (or most recent year) ........................................................................ 44 Table A4. Evolution of annual growth rate in the number of visits to emergency departments ................ 45 Table A5. Structure of the population by age groups, selected OECD countries ...................................... 46
Figures
Figure 1. Number of visits to emergency department per 100 population, 2001 (or nearest available year) and 2011 (or most recent year) .................................................................................................................... 9 Figure 2. Average annual growth rate in emergency department visits over the past decade (calculated based on the number of visits per 100 population) .................................................................................... 10 Figure 3. Frequency of ED visits among people aged 65 or more, selected OECD countries, 2008 and 2012 ........................................................................................................................................................... 16 Figure 4. Waiting times for an appointment with a doctor or nurse when sick or needing care ................ 19
Boxes
Box 1. Definition and criteria used to define inappropriate (or appropriate) ED visits in selected studies14 Box 2. “SOS médecins” in France ............................................................................................................. 24 Box 3. Definition of walk-in centres and minor injury units in the United Kingdom .............................. 26 Box 4. Example of alternative sites of primary care in Canada ................................................................. 26
DELSA/HEA/WD/HWP(2015)6
7
1. INTRODUCTION
1. Emergency departments (EDs) are highly visible and critical services that often form the frontline of health care systems for patients facing difficult circumstances. In many OECD countries, the number of visits to EDs has increased, raising questions about the efficient use of ED resources.
2. The increase in ED utilisation might adversely affect patient outcomes, increase health care costs and place further strain on health professionals’ workloads. Several OECD countries have had to deal with a significant proportion of patients attending EDs for conditions not requiring urgent attention. These conditions could be managed in primary and community care settings, suggesting there might be scope to reduce demand for emergency care and divert inappropriate or non-urgent visits away from EDs.
3. This paper provides international perspectives on emergency care services across 21 OECD countries. It explores the trends in the volume of ED visits and their drivers, paying particular attention to factors related to the socio-economic characteristics of patients using ED services and to the availability of primary and community-based health care services. A system level perspective is adopted to examine national approaches that have been implemented to reduce and manage the demand for emergency care services.
4. The paper is structured as follows. The next section (Section 2) presents data on the trend in the volume of ED visits over time across OECD countries and discusses the main causes of these visits. Section 3 provides insights on the main determinants of ED visits using a literature review. Section 4 identifies national approaches or interventions adopted by some OECD countries to reduce overall demand for emergency care and to prevent the inefficient use of emergency services. The paper then draws conclusions on some broad policy recommendations for consideration.
DELSA/HEA/WD/HWP(2015)6
8
2. TRENDS IN THE VOLUME OF VISITS TO EMERGENCY DEPARTMENTS ACROSS OECD COUNTRIES
5. This section finds that the volume of ED visits has increased over time in almost all OECD countries, except Chile, Israel, Poland, the Czech Republic and Ireland. Although no consistent trend emerges from the year-on-year growth of ED visits among OECD countries, the section also shows that hospital ED visits are generally more frequent among the youngest and oldest populations and that injury diagnoses constitute one of the most common reasons for visiting EDs. Of particular concern is the fact that “non-urgent” or “inappropriate” ED visits are reported in several OECD countries including Australia, Belgium, Canada, England, France, Italy, Portugal and the United States.
2.1. The number of visits to emergency departments has increased over the past decade in almost all OECD countries
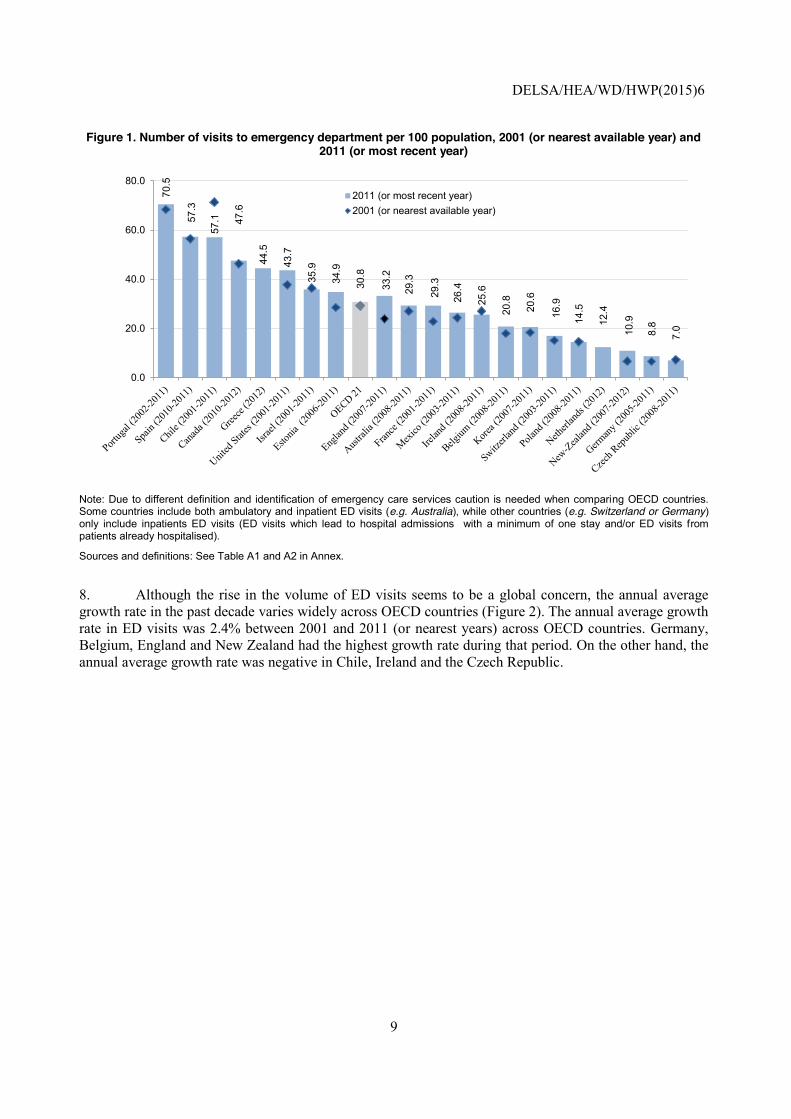
6. In 2011, the number of ED visits across OECD countries was about 31 per 100 population (Figure 1). The number of visits per capita was the highest in Portugal, with over 70 visits per 100 population in 2011. The number of visits to EDs was also well above the OECD average in Spain, Chile, Canada, Greece and the United States, with more than 40 visits per 100 population. On the other hand, the Czech Republic, Germany, New Zealand, the Netherlands, Poland and Switzerland have fewer than 20 visits per 100 population, relatively little compared with the OECD average.
7. The number of ED visits has increased over time in almost all OECD countries over the past decade (Figure 1 and Table A2 in the Annex). The number of ED visits for the 21 OECD countries for which data were available over the period increased by nearly 5.2%, from 29.3 visits per 100 population in 2001 to 30.8 visits per 100 population in 2011 (Figure 1). While the rise in the number of visits is recorded in 14 countries out of 22, the numbers of ED visits has decreased in Chile, Israel, Poland, the Czech Republic and Ireland.
DELSA/HEA/WD/HWP(2015)6
9
Figure 1. Number of visits to emergency department per 100 population, 2001 (or nearest available year) and 2011 (or most recent year)
Note: Due to different definition and identification of emergency care services caution is needed when comparing OECD countries. Some countries include both ambulatory and inpatient ED visits (e.g. Australia), while other countries (e.g. Switzerland or Germany) only include inpatients ED visits (ED visits which lead to hospital admissions with a minimum of one stay and/or ED visits from patients already hospitalised).
Sources and definitions: See Table A1 and A2 in Annex.
8. Although the rise in the volume of ED visits seems to be a global concern, the annual average growth rate in the past decade varies widely across OECD countries (Figure 2). The annual average growth rate in ED visits was 2.4% between 2001 and 2011 (or nearest years) across OECD countries. Germany, Belgium, England and New Zealand had the highest growth rate during that period. On the other hand, the annual average growth rate was negative in Chile, Ireland and the Czech Republic.
70.5
57.3
57.1 47
.6
44.5
43.7
35.9
34.9
30.8
33.2
29.3
29.3
26.4
25.6
20.8
20.6
16.9
14.5
12.4
10.9
8.8
7.0
0.0
20.0
40.0
60.0
80.02011 (or most recent year)2001 (or nearest available year)

DELSA/HEA/WD/HWP(2015)6
10
Figure 2. Average annual growth rate in emergency department visits over the past decade (calculated based on the number of visits per 100 population)
Note: Due to different definition and identification of emergency care services caution is needed when comparing OECD countries. Some countries include both ambulatory and inpatient ED visits (e.g. Australia), while other countries (e.g. Switzerland or Germany) include only inpatient ED visits (ED visits leading to hospital admissions with a minimum of one stay and/or ED visits from patients already hospitalised).
Sources and definitions: See Table A1 and A2 in Annex.
9. No consistent trend emerges from year-on-year growth of ED visits among OECD countries in the past decade (see Table A4 in the Annex). In Ireland, for example, the number of ED visits decreased by 12% between 2009 and 2010, while it increased by 2% over the same period in Australia. Variability in ED visits across and within countries over time is likely to be explained by variations in population health needs, and variations in seasonal and pandemic influenza. It might also reflect recent initiatives implemented at the national level to reduce the demand for emergency care (see Section 4).
2.2. Emergency department visits are more frequent in the very young and the very old, while injury diagnoses constitute one of the most common reasons for visiting hospital emergency departments
10. Across countries reporting ED visits by age group, young and old patients visit these ED services more frequently than the rest of the population, possibly because of higher health needs. In a systematic review of the literature examining the demand for hospital EDs, He et al. (2011) show that in general, older people are more likely to use EDs for urgent medical conditions, while younger people tend to present more frequently to EDs for injury and less-urgent illness such as fever, cough, nausea or vomiting.
11. This is the case in the United States, where ED visits appear more frequent among the youngest and oldest groups of the population. While the population aged under 6 and the population aged 75 or more represent 7% and 6% respectively of the total population in the United States (see Table A5 in the Annex), more than half of ED visits are by these groups (Table 1). In a similar vein, ED visits in Switzerland and New Zealand are more frequent in adults aged 75 and over (averaging 22% in both countries), while over the same period this age group represents 8% and 6% of the total population in both countries respectively
-2.2 -1.9
-0.9 -0.1 0.0 0.31.1 1.5 1.5 1.6
2.4 2.5 2.7 2.8 3.04.1
4.9 5.0
8.5
10.2
-3.0
0.0
3.0
6.0
9.0
12.0Average annual growth rate (%)

DELSA/HEA/WD/HWP(2015)6
11
(see Table A5 in the Annex). In Australia, Canada and England, however, the most common age group reported for ED visits is 15-24.
12. A recent French survey found patients aged 75 years or more represent nearly 12% of ED visits (of which 5% are by patients aged 85 or more), while these age groups represent 10% and 4% of the general population respectively (Boisguerin and Valdelièvre, 2014). The utilisation rates of EDs in France are highest in the very young and the very old populations. Specifically, the utilisation rate for children under age 1 and for adults over age 85 are nearly three times higher than the utilisation rate of patients aged between 55 and 64. These trends are similar in Belgium, where utilisation rates for children aged 5 or less and for those aged 90 or more are twice the utilisation rates of the population aged between 55 and 64 (De Wolf and Vanoverloop, 2011). In Switzerland, the Health Observatory shows that utilisation rates are the highest among people aged over 86, followed by children aged less than 6 (Swiss Health Observatory, 2013).
Table 1. Emergency department visits by patient age (% col), selected OECD countries Frequency by age
group AUS (2012) CAN (2012) ENG (2012) SWZ (2012)
0-4 11.6% 8.7% 10.0% 8.9% 5-14 9.9% 8.1% 9.9% 2.3%
15-24 14.9% 14.0% 15.3% 5.8% 25-34 13.8% 13.8% 14.2% 10.3% 35-44 11.6% 11.9% 11.4% 9.8% 45-54 10.2% 13.0% 10.7% 11.7% 55-64 8.8% 11.0% 8.1% 13.3% 65-74 7.8% 8.3% 7.4% 15.4% 75+ 11.4% 11.3% 13.0% 22.6% Total 100% 100% 100% 100%
Frequency by age group US (2010) Frequency by age group NZ (2013) 0-5 24.2%
6-17 15.6% (among adults only) 18-64 19.6% 15-24 16% 65-74 20.4% 25-34 13% 75+ 27.0 35-44 11% Total 100% 45-54 11%
55-64 12 % 65-74 14% 75+ 22% Total 100%
Sources: Data for Australia were taken from the Department of Health (2013); data for Canada were taken from the Canadian Institute for Health Information (2013); data for Estonia, Portugal and Switzerland were provided by national authorities; data for England were taken from the Health and Social Care Information (2014); data for New Zealand were taken from the Ministry of Health (2013); and data for the United States were taken from the National Hospital Ambulatory Medical Care Survey (2010).
13. Injuries (such as fracture, dislocation, sprain or strain) are most often the main reason for visiting EDs in the seven OECD countries where data are available (see Table 2). Injuries represented about 13% of ED visits in Switzerland, 14.5% in England, 22.5% in the United States, 25.6% in Canada, 35% in Estonia and 40% in France. Portugal is a notable exception since more than 80% of ED visits are due to diseases. Acute conditions or acute diseases (such as diseases of the circulatory and respiratory system) were also common, ranging from 5.5% in England to 13.3% in Estonia.
14. Injuries and some acute diseases might threaten the life or the physiological functioning of patients. They may require immediate attention that justifies the use of ED resources. However, as the next

DELSA/HEA/WD/HWP(2015)6
12
section discusses, a significant number of ED visits could have been avoided through the use of alternative sources of care available at the community or primary care level.
Table 2. Emergency department visits by main causes or diagnostics (% col), selected OECD countries
Canada - 2012/2013 Main reasons % of total visits Trauma 18.3 Unintentional Falls 5.7 Motor Vehicle Collisions 1.6 Pneumonia 1.2 Asthma 0.7 Acute Myocardial Infarction 0.2
Estonia - 2013 Top three reasons % of total visits Injury, poisoning and certain other consequences of external causes 35.8 Diseases of the circulatory and respiratory system 13.3 Diseases of the digestive system 7.2
England - 2012 Main reasons % of total visits Diagnosis not classifiable 13.8 Dislocation/fracture/joint injury/amputation 4.7 Sprain, Ligament injury 3.7 Gastrointestinal conditions 3.7 Laceration 3.7 Soft tissue inflammation 3.5 Respiratory conditions 3.2 Contusion/abrasion 2.6 Head injury 2.3 Cardiac conditions 2.3
France - 2013 Top three reasons % of total visits Injury, poisoning and certain other consequences of external causes 39.8 Symptoms, signs and abnormal clinical and laboratory findings, not elsewhere classified 17 Diseases of the digestive system, Endocrine, nutritional and metabolic diseases 5.5
Portugal - 2012 Causes for emergency visit % of total visits Disease 82.0 Injury by accident 11.8 Intentional self-harm 0.0 Injury due to aggression 0.5 Other causes 5.7
Switzerland - 2013 Main reasons % of total visits Diseases of the musculoskeletal system and connective tissue 13.2 Injury, poisoning and certain other consequences of external causes 13.0 Diseases of the circulatory system 11.0 Diseases of the digestive system 8.3 Pregnancy, childbirth and the puerperium 7.4 Mental and behavioural disorders 6.8
United States - 2010 Principal reasons % of total visits Injury and poisoning (fractures, sprains and strains, open wounds) 22.46 Symptoms, signs, and ill-defined conditions 21.6 Diseases of the respiratory system 9.8 Diseases of the musculoskeletal system and connective tissue 6.3 Diseases of digestive system 3.1
Sources: Data for Canada were taken from the Canadian Institute for Health Information (2013); data for Estonia, Portugal and Switzerland were provided by national authorities; data for England were taken from the Health and Social Care Information (2014); data for France were taken from Boisguerin and Valdelièvre (2014); and data for the United States were taken from the National Hospital Ambulatory Medical Care Survey (2010).

DELSA/HEA/WD/HWP(2015)6
13
2.3. A significant proportion of ED visits are considered “inappropriate” in a number of OECD countries
15. Given the growing demand for emergency care across OECD countries, several countries have tried to identify “inappropriate” ED visits, where patients seek care for non-urgent problems or minor health conditions.
16. “Inappropriate” or non-urgent visits are characterised by low urgency problems and require other health services than emergency admission including, for example, telephone-based services and primary or community health care services (McHale et al., 2013). Such inappropriate ED visits are for conditions that could be better managed in the community by a general practitioner (GP) or by the broader primary care clinical team. Internationally, inappropriate ED visits are a cause of concern for several reasons. Inappropriate visits consume ED inputs, such as health professional and medical equipment, diverting them from more severe patients and increasing the professional workload. Non-urgent visits might not only hinder the ability of EDs to treat other patients in a timely and safe manner, but also reduce access for true emergency patients. High prevalence of inappropriate ED visits adversely affects health professionals’ attitudes and workload, decreases patient satisfaction, and reduces the quality of care through prolonged waiting times and delayed diagnoses or treatments (Rocovich and Patel, 2012; Durand et al., 2012), which might also lead to workplace violence. Exposure to violence, such as verbal abuse and physical assault, is disproportionately high for health professionals working in EDs compared to those working in other hospital departments (Adriaenssens, De Gucht and Maes, 2015; Taylor and Rew, 2010; Crilly, Chaboyer and Creedy, 2004). Lastly, the opportunity cost associated with inappropriate ED visits might also be significant. In England for example, the cost of inappropriate visits was estimated at nearly £100 million between 2011 and 2012 (McHale et al., 2013).
17. Although “inappropriate” ED visits have been extensively documented, the criteria used to define such visits are diverse (see Box 2). An international literature review shows that different criteria are used to define inappropriate or non-urgent visits, ranging from the triage category, the need for tests or treatments, the need for hospitalisation or the possibility of treatment at a lower level of care (Carret, Fassa and Domingues, 2009). Based on other evidence, there are concerns that the figures overstate the actual burden of inappropriate primary care-type patients (Nagree et al, 2013).
18. According to national definitions and estimates (see Box 2), “avoidable”, “inappropriate” or non-urgent visits to EDs account for nearly 12% of ED visits in the United States, 20% in Italy, 25% in Canada, 31% in Portugal, 32% in Australia and 56% in Belgium. In England, different estimates suggest that the proportion of inappropriate ED visits ranges from 11.7% (McHale et al., 2013) to 15% (Wise, 2014).
19. The large inter-country variation in “inappropriate” presentations appears to relate primarily to the different definitions and data collections used (see Box 2). Non-urgent or inappropriate visits across OECD countries not only relates to the subjective nature of the debate, but can also relate to the organisation of the health care system, notably the access and availability of alternative sources of care (see Section 3).

DELSA/HEA/WD/HWP(2015)6
14
Box 1. Definition and criteria used to define inappropriate (or appropriate) ED visits in selected studies Australia – Source: AIHW, 2013
Potentially avoidable GP-type presentations to EDs indicate the number of attendances at public hospital EDs that potentially could have been avoided through the provision of non-hospital health services. They are defined as a type of emergency presentation where the patient: (i) was allocated a triage category of 4 (semi-urgent conditions for which assessment and treatment start within 60 minutes) or 5 (non-urgent conditions for which assessment and treatment start within 120 minutes); (ii) did not arrive by ambulance or by police or correctional vehicle; (iii) at the end of the episode was not admitted to the hospital, was not referred to another hospital and did not die.
32.4% of ED visits are
inappropriate
Belgium – Source: De Wolf and Vanoverloop, 2011 Emergency visits are considered appropriate when the patient is referred by a GP or by the emergency helplines; when the patient is admitted to the hospital at the end of the episode; when the plaster room is used; when the patient dies on the same day; when it is a psychiatric emergency; or when child delivery is expected in the coming three months. Visits are considered inappropriate for all other situations.
56.0% of ED visits are
inappropriate
Canada – Source: Afilalo et al., 2004 Inappropriate visits are measured as non-urgent use of the emergency department. The Canadian Triage System (CTAS) is used to categorise non-urgent use. It corresponds to Code 5, which denotes a patient who can wait two hours before being seen by a physician. The condition may be acute but not urgent and may be part of a chronic problem but with or without evidence of deterioration. These patients could potentially be referred to and treated in primary care centres.
25% of ED visits are
inappropriate
England – Source: McHale et al., 2013 Visits to EDs are considered inappropriate if the patient was self-referred; the attendance category was the initial ED attendance or unplanned follow-up; the investigation code was ‘none’ and the treatment code was either ‘none’ or ‘guidance/advice only’; and the disposal method was discharge with no follow-up or discharge with follow-up from a GP. Visits to EDs are considered appropriate if the source of referral was any other than self-referred; the attendance category was planned follow-up; the attendance had a valid investigation code other than ‘none’ or a valid treatment code other than ‘none’ or ‘guidance/advice only’; and the disposal method was either admission, referral to clinic, transfer to other health care provider, referral to other healthcare professional or other.
11.7% of ED visits are
inappropriate
France – Source: Cour des comptes, 2014 Avoidable visits result from patients seeking care for conditions that could have been treated in the community by the primary care system. The triage system, Classification Clinique des malades aux urgences (CCMU), is used to categorise avoidable visits. Patients falling under CCMU1 have a stable clinical condition for which it is not necessary to carry out additional medical tests.
19.4% Of ED visits are avoidable
Italy – Source: Bianco, Pileggi and Angelillo, 2003 An inappropriate visit to an ED is classified as a non-urgent visit according to the following criteria: the patient has no active symptoms or they were recent and minor; there is no feeling of emergency and the patient desires a check-up; and a prescription refill or a return-to-work release.
19.6% of ED visits are
inappropriate
Portugal – Source: Pereira et al., 2001 An ED visit is considered appropriate if it results in patient hospitalisation; if death occurs in the ED; if the patient is transferred to another hospital; or according to explicit criteria based on specific diagnostic tests or treatment performed. A visit is appropriate if it requires imaging studies such as MRI, ultra-sonographic studies, CT scan, and if treatment requires intravenous fluids, oxygen, prescription medications administered in the ED, transfusion of blood products, orthopaedic treatments, wound management (other than cleaning or bandaging minor abrasions), and removal of foreign bodies (in eyes, and digestive or respiratory tract). Visits are considered inappropriate for all other situations.
31.3% of ED visits are
inappropriate
United-States – Source: NEHI, 2010 Avoidable ED use results from patients seeking non-urgent care or ED care for conditions that could have been treated and/or prevented by prior primary care.
12.1% of ED visits are
inappropriate Source: OECD Secretariat based on existing literature

DELSA/HEA/WD/HWP(2015)6
15
3. DETERMINANTS OF EMERGENCY DEPARTMENT VISITS
20. This section presents the main factors influencing the demand for emergency care. The literature review maps out different determinants related to demand and supply factors. Demand factors relate to patient preferences, health needs, or socio-economic characteristics, while supply factors pertain to availability of alternative sources of care, and might also relate to ongoing changes in medical practice. Among these determinants, the rapid population ageing, the lack of access to primary care services, and the increased number of people in vulnerable situations because of the economic crisis are most certainly important factors contributing to the growing number of ED visits.
3.1. On the demand side: individuals’ preferences, health needs and socio-economic factors
Patients find the emergency department convenient
21. Consumer preferences for seeking emergency care have been traditionally high (Durand et al., 2012). EDs are convenient for patients for several reasons. Patients can access a full range of services at any time, 24 hours a day, seven days a week. Availability of resources including medication, laboratory tests and radiography, access to technical facilities, and the opportunity to carry out specialist tests in one single place, are all good reasons for patients to visit EDs rather than primary care physicians.
22. Convenience of ED attendance is confirmed in several countries including France, Italy and the United States. In France, the most recent survey asked patients about their motivation to attend the ED. Accessibility of care related to the availability of technical capacity or geographical proximity were the reasons most often reported. Nearly 60% of patients visited an ED for its accessibility. Among them, 27% of patients mentioned the need to receive quick medical attention, 23% the opportunity to perform additional clinical tests, 22% the geographical proximity and 12% the opportunity to consult a specialist (Boisguerin and Valdelièvre, 2014). In Italy, the most common reason mentioned by patients was the diagnostic and therapeutic facilities in EDs. Carrying out specialist tests and consultations in one place appeared to be an extremely attractive arrangement for patients (Lega and Mengoni, 2008). In a systematic review of the literature examining determinants of non-urgent visits to the ED in the United States, Uschner-Pines et al. (2013) found that greater convenience compared with other ambulatory care settings played a significant role in decisions to seek care in the ED for non-urgent conditions.
Population ageing and the growing burden of chronic conditions place further strain on emergency departments
23. All OECD countries face a demographic shift with a growing ageing population, which inevitably implies an increased prevalence of chronic illness. On average, across OECD countries, the share of the population aged over 65 years increased by nearly 12% between 2001 and 2011 (OECD, 2013). This might significantly account for the growing number of ED visits. Older patients with chronic conditions are more likely to use the ED because of complex problems requiring resource-intensive evaluation during acute care episodes.
24. Several studies have demonstrated the increased presence of elderly patients in EDs (Georges, Jell and Todd, 2006; Vilpert et al., 2013; Pines et al., 2013). Elderly patients are found to be at increased

DELSA/HEA/WD/HWP(2015)6
16
risk of ED visits and ED return visits because of cognitive disorders or the presence of multiple co-morbidities. In the United States, for example, ED use increased by 25% for adults aged 65 and older from 2001 to 2009. The greatest increase in utilisation was found in the oldest group, those aged 85 or more. In a similar vein, the number of people aged 65 or more who were transported by ambulance in Japan doubled between 2001 and 2011, accounting for 53.1% of all emergency transportation cases in 2011 (Japanese Ministry of Health, Labour, and Welfare, 2011). Figure 3 below shows that the frequency of ED visits among people aged 65 or more has increased in Australia, Canada, and Switzerland. The rise is particularly striking for Australia, where the prevalence of ED visits among people aged 65 or more increased by nearly 6% between 2008 and 2012, while it increased by 4% in Switzerland and nearly 2% in Canada in the same period.
25. At the same time, cognitive impairment and dementia are common conditions among older adults in the ED. In the United States for example, the proportion of older adults who present to the ED with cognitive impairments range from 21% to 40% (Clevenger et al., 2012). These people are likely to come to the ED for after-hours care, urgent prescription refills, triage of trauma-associated injury, assessment of new symptoms and caregiver reassurance. In a recent empirical study, Feng et al. (2013) show that the increasing number of older individuals affected by dementia has been associated with frequent and often potentially avoidable ED visits.
Figure 3. Frequency of ED visits among people aged 65 or more, selected OECD countries, 2008 and 2012
Note: The 2008 data for England are not directly comparable with the 2012 data. In 2008, the prevalence of ED visits has been computed among people aged 60 years or more.
Sources: Data for Australia were taken from the Department of Health (2013); data for Canada were taken from the Canadian Institute for Health Information (2013); data for Switzerland were provided by national authorities; data for England were taken from the Health and Social Care Information (2014).
Socio-economic deprivation and a lack of social support are associated with a greater use of emergency departments
26. Poverty, minority status and lack of social support are all associated with a higher likelihood of visiting EDs (Purdy, 2010; He et al., 2011; Ushner-Pines, 2013). In this respect, the economic crisis that has increased the number of people in a vulnerable situation due to rising unemployment, housing
0
10
20
30
40
Australia (+ 6.1%) Canada (+1.6%) England (-5.1%) Switzerland (+4.1%)
2008 2012
DELSA/HEA/WD/HWP(2015)6
17
insecurity and household debt (Eurofound, 2014) might have contributed to the growing demand for emergency care. Eurofound has recently shown that demand for emergency care has increased following the economic crisis, because it is cheaper to access and payments due from patients are less likely to be collected1. In Greece and Portugal, for example, low-income populations have bypassed primary care in favour of emergency services because hospitals are more likely to waive co-payments than primary health care centres (Eurofound, 2014).
27. Two other different hypotheses might be proposed to explain why economically and socially deprived people are more likely to visit an ED. First, the literature around social determinants of health (Marmot et al., 2008) shows that poverty, low schooling and disadvantaged social status are significantly associated with higher prevalence of many health conditions. Economically and socially deprived people also tend to engage in more risky health behaviours such as smoking, drinking alcohol and poor diet (Grossman, 1972; Cutler and Lleras-Muney, 2010), adding important risk factors for chronic conditions. Taken together, higher prevalence of health conditions and risky health behaviours increase the likelihood of attending an ED. Economically and socially deprived people are less likely to have a regular doctor (such as a GP) and to receive adequate information on the organisation of the health care system (VanStone et al., 2014; Lang et al., 1997). Because of this lack of information around appropriate health care services and a shortage of primary care physicians, the most deprived individuals are more likely to use EDs as a usual source of care. This is particularly true for some vulnerable groups of immigrants, typically the poorest and lowest educated, who have limited health literacy and face communication barriers to access relevant health information (Mahmoud and Hou, 2012).
28. The impact of socio-economic characteristics on the use of EDs has been proven in England, where social deprivation predicted nearly 48% of the variation in adult ED visits (Hull et al, 1998). In a similar vein, a clear positive association has been established in the United States between social deprivation and the use of the ED (Beattie, Gorman and Walker, 2001; Walls, Rhodes and Kennedy, 2002). Using the 1998 National Health Interview Survey, Walls, Rhodes and Kennedy (2002) showed that ethnicity, a low educational level and a lack of health insurance were all associated with a higher likelihood of visiting an ED as a usual source of care. In the Canadian context, the most socially and materially deprived patients use EDs more than the most advantaged population (VanStone et al., 2014). In Ontario, nearly 25% all ED visits are from the most deprived population, and almost half of these visits are for non-urgent conditions. The study shows that the over-representation of the most deprived population is firstly explained by a poorer health status and poorer health care practice. The proportion of patients attending the ED for non-urgent conditions reporting having no primary care physician is between three to four times higher for the most deprived population than the least deprived population (VanStone et al., 2014).
29. In France, the association between economic deprivation and ED visits is more ambiguous. The most recent survey shows that recipients of the French State Medical Aid (a specific health coverage for undocumented migrants) and people having no open right to the French compulsory health insurance scheme account for only 2% of ED visits (Boisguerin and Valdelièvre, 2014). Further, people entitled to the subsidised complementary health insurance (the poorest households) do not seem to disproportionally use EDs. It is worth noting that before the implementation of the subsidised complementary health insurance –in 2000-, economic and social deprivation was positively associated with ED use. For example, Lang et al. (1997) showed that the ED was the regular source of care for socially deprived individuals, with no usual source of primary care and a high level of risk factors. The study demonstrated an over-representation of unemployed, homeless persons with precarious housing and foreign-born patients.
1 A cut in outpatient care (as seen in Ireland) and the fact that family members cannot afford to keep patients
at home (as seen in Bulgaria and Slovenia) are other important conditioning factors explaining the increase in the use of emergency care following the economic crisis (Eurofound, 2014).

DELSA/HEA/WD/HWP(2015)6
18
30. Beyond material living conditions, social exclusion and poor social support have been associated with the likelihood of visiting an ED. In a systematic review of 100 studies, He et al. (2011) found that social support plays a significant role in ED demand. The relationship appears particularly strong for elderly patients. In the United States, for example, adults aged 71 years and older who lived alone were 60% more likely to visit the ED than other elderly patients ceteris paribus (Hastings et al., 2008).
3.2. On the supply side: a lack of access to primary care services and changing medical practice
A lack of access to primary health care and a shortage of out-of-hours services are associated with the demand for emergency care
31. Attending EDs is likely to be inversely related to access to primary care services and to the availability of out-of-hours (OOH) primary care services. When patients face long waiting times to access primary care physicians or when OOH primary care services are not available, it is natural for patients to attend the ED to seek care in a timely manner. In this case, EDs play a critical role in taking care of unplanned patients for whom ambulatory health care services do not provide a satisfactory answer.
32. As shown in Table 3, the ED is the predominant mode of provision of OOH primary care services in only a few OECD countries. In nine OECD countries (Australia, Canada, Chile, Finland, Greece, Korea, Luxembourg, Mexico and Poland), OOH primary care services in rural or urban areas are provided by EDs. This means that patients in these countries have limited access to OOH services outside of the ED, which undoubtedly accounts for the high demand for in-hospital emergency care. This is, for example, the case for Chile and Greece, which report the fourth and the fifth highest number of ED visits per capita across selected OECD countries (see Figure 1). In all other countries, OOH care is provided by primary care physicians, companies employing doctors, walk-in primary care centres or by other primary care schemes.
Table 3. Predominant mode of provision of out-of-hours primary care in OECD countries
Mode of provision of out-of-hours primary care In urban areas In rural areas
Primary care physicians (in solo, group practice, or in large-
scale organisations)
Belgium, Chile, Czech Republic, Denmark, Germany, Italy,
Netherlands, Slovenia, Switzerland, United States
Belgium, Chile, Czech Republic, Denmark, Germany, Greece, Iceland, Italy, Netherlands, Norway, Slovenia, Spain, Switzerland, United States
Companies employing doctors Australia, Poland, United Kingdom Poland, United Kingdom
Hospital emergency departments Canada, Chile, Finland, Greece,
Korea, Luxembourg, Mexico, Poland
Australia, Canada, Chile, Finland, Korea, Luxembourg, Mexico
Walk-in OOH primary care centres Portugal Portugal
Other OOH primary care services France, Iceland, Ireland, Israel, Norway, Spain, Sweden
France, Ireland, Israel, Norway, Sweden
Source: Health System Characteristics Survey 2012
33. The 2013 Commonwealth Fund International Health Policy Survey shows that waiting times to get an appointment with a doctor or nurse can be important in several OECD countries (Figure 5). The proportion of people who waited six days or more to get an appointment with a doctor or a nurse when sick or needing care ranges from 5% in New Zealand to 14% in the Netherlands and Australia, to more than 25% in the United States, Norway and Canada. In a similar vein, less than half of individuals obtain an appointment with a doctor or a nurse on the same day or next day in the United States and Canada. By contrast, about three-quarters of patients in Germany and New Zealand, and 60% of patients in the Netherlands, Australia and Sweden, obtain an appointment the same or next day.

DELSA/HEA/WD/HWP(2015)6
19
34. Countries with the lowest proportion of patients waiting six days or more for an appointment when sick or needing care are also countries in which ED visits rates are the lowest. This is the case in Germany, New Zealand and the Netherlands, which display both the lowest number of ED visits per 100 population (see Figure 1) and the lowest proportion of individuals waiting six days or more for an appointment with a GP or a nurse (see Figure 4). In contrast, the United States and Canada report high numbers of ED visits per 100 population (see Figure 1) and the highest proportion of individuals waiting six days or more for an appointment (see Figure 4). As Section 4.1 emphasises, increasing access to primary care to reduce waiting times, as well as improving the availability of OOH care, might be desirable to reduce the demand for care in an ED.
Figure 4. Waiting times for an appointment with a doctor or nurse when sick or needing care
Source: 2013 Commonwealth Fund International Health Policy Survey in Eleven Countries
35. Several studies confirm the relationship between the lack of OOH services or the inability to get a timely appointment in the primary care setting, and higher demand for emergency care. In England, for example, a GP patient survey found an inverse relationship between the ability of patients to access their GP quickly and the frequency in which a patient is likely to use EDs (Morse, 2013). Research conducted by the Imperial College London shows that 26.5% of unplanned hospital emergency visits are due to an inability to obtain a GP appointment (Cowling et al., 2014). In France, the situation is similar. Boisguerin and Valdelièvre (2014) found that visits to EDs are the most appropriate solution for 11% of patients because usual sources of care were not available. Accordingly, 6% of patients visited the ED because their GP was absent and 5% of patients because of waiting times to perform additional exams.
36. In the United States, Gindi, Cohen and Kinzinger (2012), using data from the 2011 survey conducted by the Centers for Disease Control and Prevention, concluded that about 80% of adults who visited an ED in the past 12 months did so because they lacked access to other providers. Of particular interest was that 48% of patients visited the ED because the doctor's office was not open, while 46% of
15
5
14
14
22
19
16
28
16
26
33
76
72
63
58
58
58
57
52
52
48
41
80 70 60 50 40 30 20 10 0 10 20 30
Germany
New-Zealand
Netherlands
Australia
Sweden
OECD 10
France
Norway
United-Kingdom
United-States
Canada
Same-day or next-day 6 days or more
% of individual

DELSA/HEA/WD/HWP(2015)6
20
patients did so because there was no other place to go. In Canada, the research conducted in Ontario by Wong et al. (2009) showed that 57.4% of patients presenting to the ED stated they would have consulted their family physicians if they had been available at the time.
37. In Japan, the configuration of primary care is unusual compared with most other OECD countries. Rather than having a distinct physical setting, primary care is delivered in clinics that form part of the hospital setting (OECD, forthcoming). As a result of these arrangements, patients tend to seek medical treatment in the ED for both urgent and non-urgent conditions. This is also the case in Greece, where the congestion of ED services has been directly related to a lack of access to primary care services.
The development of ambulatory surgery may partly explain the rise in ED visits
38. Changing medical practice has been reported as an important factor influencing levels of emergency visits and admissions in England. The current trend is a shift from inpatient care to day-case intervention for elective procedures. While in the past, all patients undergoing a surgical procedure used to stay a few days in hospital, now a significant share of patients return home the same day.
39. In England, day-case interventions more than doubled between 1998 and 2013, from 3 million to 7.4 million. Although day-case interventions have been associated with positive health outcomes for almost all patients, 3% of them developed complications that led to an emergency admission. In a study examining determinants in emergency admissions, Morse (2013) concluded that 9.4% of the rise in emergency admissions in England is explained by complications that developed due to day-case intervention. This relationship, however, cannot be extrapolated to other OECD countries because of a lack of empirical evidence.
DELSA/HEA/WD/HWP(2015)6
21
4. POLICY OPTIONS TO MANAGE VISITS TO EMERGENCY DEPARTMENTS
40. Internationally, a number of mechanisms have been used to manage visits to EDs. The literature review maps out two types of approaches: (i) developing interventions aimed at reducing the overall demand for emergency care (both appropriate and inappropriate demand); and (ii) setting up mechanisms aimed at improving pathways of care and reducing ED costs for inappropriate use.
4.1. Interventions aimed at reducing the demand for emergency care
41. Interventions that seek to reduce overall demand for emergency care include increasing access to primary and community care services, through the use of telephone-based services, the organisation of out-of-hours primary care services, and the development of alternative sites of primary care services or community care centres. They also comprise setting up appropriate financial incentives on the demand side, as well as using information and communication technologies to improve patient information and self-management.
4.1.1. Increasing primary and community care accessibility, especially out-of-hours primary care services and community care centres
42. Given that poor access to primary care services is strongly correlated with the number of ED visits (see section 3.2), the reorganisation of primary care is seen as a key strategy to manage the overall demand for emergency care services. Amongst OECD countries, great attention has been given to the development of telephone-based services, the organisation of OOH services, the development of walk-in centres, minor injury units or local emergency wards, as well as the development of community care centres. The implementation of these strategies aims to increase patients’ access to primary and community care during both working time and outside normal office hours, so that patients can receive medical attention more promptly.
Using telephone-based services
43. Telephone-based services have been developed in several OECD countries, including the United Kingdom, France, Belgium, Australia and Denmark. Such services have been adopted as new pathways for primary and urgent care, especially for those seeking services outside practice hours. They act as dispatch centres to organise an appropriate response and provide rapid transportation to health facilities. By identifying health needs, addressing unmet demand for health services, and by proving referral to appropriate health care services, telephone-based services can be key instruments to provide effective health care services (WHO, 2008). Although the timeliness and quality of care provided by telephone-based services have been shown to improve patient outcomes (WHO, 2008), few studies have evaluated their impact on reducing ED visits. Existing evidence in the United Kingdom is inconclusive.
44. In the United Kingdom, NHS Direct was the first nurse-led telephone helpline. Its aim was to address unmet demand for health services and to provide referral to appropriate care to prevent inappropriate visits to EDs. NHS 111 was introduced in 2010 to progressively replace NHS Direct. The more recent version uses non-clinical advisers to direct callers towards more appropriate services. NHS 111 is staffed by a team of fully trained advisers, experienced nurses and paramedics. The team assesses a patient’s symptoms and gives health care advice, or directs patients to the most appropriate services such
DELSA/HEA/WD/HWP(2015)6
22
as EDs, an out-of-hours doctor, an urgent care centre, or a walk-in centre, or arranges an ambulance if medically necessary. In a systematic review of 40 studies examining the impact of initiatives to improve access to and choice of primary and urgent care in the United Kingdom, Tan and Mays (2014) found no significant reduction in ED attendance after the introduction of NHS Direct and NHS 111.
45. In France, the “Services d’aide médicale urgente” (SAMU) is a freely-accessible telephone-based service that works in close cooperation with the police and the fire brigade emergency call centres. The SAMU is staffed by specialised call receptionists who are supervised by emergency physicians. After assessing the patient’s symptoms, the SAMU can advise the patient to go to the nearest ED, to visit a primary care physician, or to call back after a few hours to confirm symptoms. The SAMU can also send a mobile intensive-care unit (Services mobiles d’urgence et de réanimation; SMUR) or an ambulance to transport the patient to the ED. As in the United Kingdom, the objective of the SAMU is to deal with patient requests and direct the patient to the most appropriate health care service.
46. To reduce the use of EDs and direct patients towards the most appropriate health-care settings (especially outside normal office hours), Belgium has set up a similar telephone-based service. A unique call number (1733) is now available 24h/7, with a professional dispatcher dealing with medical emergencies and other medical requests. Based on the assessment of the patient’s health needs, the dispatcher can advise the patient to call the GP the next day, to visit the GP on duty to request medical care, to go to the ED, or to wait for emergency medical services (Jonckheer et al, 2011).
47. In Australia, the National Health Call Centre Network (NHCCN), trading as Healthdirect Australia, was established in 2007. The Network provides a range of services, including a 24/7 telephone-based nurse triage service providing information and advice in all states and territories (except Queensland and Victoria which operate state-specific services). It also has an after-hours GP helpline that provides a telephone-based GP medical advice service for people who cannot access their usual health service. Overall, the service was established to provide users with access to accurate and current provider service information such as location, opening hours and telephone numbers for general practices, pharmacies, hospitals and EDs.
48. At the beginning of 2014, Denmark set up a new organisation of emergency medical services that was initially an experiment in the capital region. As part of the new organisation, a telephone-based service was set up as the only entry point into the system for patients who are injured or experience sudden illness outside normal office hours. Patients no longer have direct access to emergency wards. The service is staffed by nurses who decide whether the patient will be redirected to a doctor on the phone, be attended by a doctor, go to an ED or stay at home (Olejaz et al., 2012). The new initiative has been controversial and has been criticised by GPs and the Danish Medical Association, who argue that the new organisation will lead to a deterioration of emergency medical services (Olejaz et al., 2012). The initiative in the capital region is being evaluated to determine whether adjustments are needed. The remaining four regions have yet to decide whether to implement the model.
Developing the organisation of out-of-hours primary care services
49. Patients who are injured or experience sudden illness outside normal office hours may need to access primary medical care. The organisation of OOH primary care services, generally from 6:30 pm until 8 am on weekdays and all day on weekends and bank holidays, is critical to provide appropriate and timely access to primary care services. It might reduce ED attendance. This is the case in the Netherlands, Sweden, the United States, Ireland and Luxembourg, where most studies suggested a negative relationship between the organisation of OOH primary care services and patient attendance rates at EDs.
DELSA/HEA/WD/HWP(2015)6
23
50. In the Netherlands, primary care physicians are expected to deliver OOH care in large cooperatives, with between 40 and 120 full-time primary care physicians participating. Van Uden et al. (2005) found that the establishment of GP cooperatives resulted in a major shift in patient flow from emergency care to primary care, reducing the use of hospital emergency care. In Sweden, research demonstrates that improvement in primary care access and availability of services after normal office hours decreased ED attendance (Sjonell, 1986). In the United States, several studies show that expanding availability of primary care physicians through OOH provision reduced the use of EDs among both the adult and young population (Piehl et al. 2000; Lowe et al. 2005). The establishment of a first OOH general practice in Ireland was also associated with a significant reduction in ED attendances for patients with minor conditions (O’Kelly et al., 2010). In Luxembourg, OOH primary care services are carried out by Maisons Medicales that were specifically set up in 2008 to reduce the number of ED visits outside normal office hours. Between 2008 and 2010, ambulatory ED visits decreased from 76.5% to 75.9%, while the proportion of people who could have been treated in Maisons Médicales declined by 1.6% in the same period (information provided by Luxembourg). In Israel, a network of Medical Centres has been established to guarantee the delivery of primary care services outside office hours. Medical Centres consist of GPs, specialists in family medicine as well as paediatricians. The project is supported by the state, the local authorities and the health funds. In 2015, 10 medical centres were operating in the country but the plan is to set up seven new Medical Centres to improve access to primary medical care outside office hours.
51. In France, the organisation of OOH primary care services suffers from several limitations. OOH primary care services have been organised by Regional Health Agencies since 2002. While before 2002 it was mandatory for physicians to participate in the provision of OOH services, it is now voluntary. Primary care physicians receive special fees (“forfait d’astreinte”), which are equal to EUR 50 from 08:00 pm to 12:00 am; EUR 100 from 12:00 am to 8:00 am; and EUR 150 on Sundays and bank holidays. In 2013, the audit office (Cour des comptes) highlighted the weaknesses of the current arrangement. The number of territories covered by OOH services is progressively decreasing (from 1 910 in 2012 to 1 764 in 2013), as is the number of volunteer primary care physicians. OOH services from 12 am to 8 am are no longer organised in 22 departments. This means that in a number of regions, the organisation of OOH services is no longer guaranteed (or not comprehensively guaranteed). This places further pressure on EDs to take care of unplanned patients. At the same time, the “Maisons Médicales de Gardes” (MMG) have been established in France as a network of GPs to provide emergency care in the community setting and during OOH. While MMG should play an important role by ensuring OOH primary care services, their development and utilisation is still rather limited (Cour des comptes, 2013). In 2013, there were only 369 MMG (covering nearly 23% of OOH care services), with a wide variation in their availability across the country (Cour des comptes, 2014).
52. The last model of OOH primary care services in France is the so-called “SOS médecins” (see Box 2). SOS médecins is an independent association created in 1966 to organise OOH primary care services and emergency medical assistance. The association gathers volunteer primary care physicians, and has its own telephone-based service. In most cases, it consists of home consultations by mobile physicians, but health facilities have recently been developed. The association provides on-call advice, assesses the situation, orients the patient and provides home visits. It plays a critical role in France, mainly in large cities but also underserved regions with no – or few – OOH primary care services. It is worth noting that SOS médecins and SAMU are separate organisations and both services do not work systematically in close co-operation and co-ordination (Cour des comptes, 2013).

DELSA/HEA/WD/HWP(2015)6
24
Box 2. “SOS médecins” in France
SOS médecins is the first private network of emergency care and of out-of-office hours in France. It provides 24 hours a day, 7 days a week medical attention for unplanned care, non- life-threatening emergencies and medical assistance outside normal office hours. In 2013, there were 64 independent associations in France. Doctors participating in the association are private practitioners organised in the same model as group practice, and are contracted physicians.
In 2013, the association handled more than 4 million calls and provided about 2.5 million home interventions or consultations. Some 60% of procedures are performed at night, on Saturday afternoon, Sunday and bank holidays.
The association has recently set up health-care facilities to complement their home consultations and to overcome the issue of the “medical desert”, where some areas are characterised by low physician density.
The role played by SOS médecins in taking care of unplanned emergency care and in providing OOH primary care services is critical in France and has increased in recent decades. The health care service provides care of high quality and is greatly appreciated by users, as evidenced by the steady increase in its activity.
Source: http://www.sosmedecins-france.fr/
Providing alternative sites of primary care for non-urgent conditions
53. Beyond telephone-based services and the organisation of OOH services, walk-in centres, minor injury units and local emergency wards aim to improve access to primary care services by generating greater service availability. These alternative sites provide primary health care services to patients without an appointment, and are therefore set up to develop emergency care outside hospitals and within the community. They can be attached - or not - to the hospital ED, and might also provide care outside normal office hours. Although the distinction between these alternative services is not clear, they share the same overarching objective of reducing the demand for hospital emergency care. As discussed in this sub-section, evidence of the impact of alternative primary care sites is mixed.
54. Walk-in centres and minor injury units were established in England in 2000 to reduce the demand for the ED (see Box 3 for definitions). These new models of emergency and urgent care services (also called Type 3 units) are designed to meet the needs of patients with minor injuries or illnesses, and to provide emergency care outside hospitals. Walk-in centres and minor injury units can be located outside or within hospitals directly next to EDs (Monitor, 2014). One recent empirical study (Pinchbeck, 2014) found that the availability of walk-in services had a significant effect on reducing overall volumes of ED attendances. Diverting patients from EDs was more pronounced when the walk-in centres were located within hospitals (next to the ED). By contrast, in a systematic review of 40 studies examining the impact of initiatives to improve access to and choice of primary and urgent care in the United Kingdom, Tan and Mays (2014) found a limited impact.
55. Evidence shows that new forms of primary care settings do not divert patients from the ED. While some studies found that ED attendances increased after establishing walk-in centres, others indicate that establishing walk-in centres or minor injury units did not significantly reduce ED visits (Tan and Mays, 2014; Pinchbeck, 2014). Several explanations have been proposed as to why new emergency and urgent care services do not provide a perfect substitute for the ED (Tan and Mays, 2014; Pinchbeck, 2014). First, it is possible that new sites of emergency care increase overall demand, by either generating greater service availability or because particular health needs were previously unmet. Second, it might be possible that patients are confused with the array of emergency services available, and thereby uncertain
DELSA/HEA/WD/HWP(2015)6
25
about how to access OOH care beyond the ED. This is demonstrated by the most recent GP survey that found only 55.4% of patients said they knew who to contact to access OOH care (King's Fund, 2015). Last, evidence points to the potential difficulty of changing patients’ preferences, as well as patients’ consultation patterns and perceptions of the appropriate place for treatment. Risk aversion and incomplete information about the level of severity of their condition are important conditioning factors explaining ED attendance.
56. In other OECD countries however, evidence has shown that walk-in centres or walk-in clinics reduce ED visits. This is the case in Ireland, where a pilot study showed that ED visits declined by nearly 30% following the development of walk-in centres (http://www.healthpei.ca/). These alternative primary care sites will be developed as part of the 2013-2017 policy initiatives that aim to increase the effectiveness and efficiency of the health care system. The intention is that patients will receive the right service at the right time and in the right place. Minor injury clinics in New Zealand, located alongside the ED and staffed by a team of nurses, also freed up the ED by providing care to patients with low- priority conditions (Ministry of Health, 2011).
57. At the same time, local emergency wards or centres (also called primary care emergency services) have been developed in several other OECD countries to bring non-urgent emergency care into the community. In Norway the local authorities are legally responsible for organising emergency medical services in and out of normal practice hours (Ringard et al., 2013; OECD, 2014). While during normal practice hours the emergency medical services are usually provided at regular GP clinics, emergency primary care centres provide medical care on evenings, nights, weekends and public holidays. Some of the emergency primary care centres are organised collaboratively between two or more municipalities. The doctor on call primarily treats patients at the centre, but may also carry out home visits. The services handle all types of emergencies, including psychiatric emergency situations. Patients are not allowed to present themselves directly to EDs. During the OOH period, patients have to contact an emergency primary care centre and a referral from the doctor on call is needed to access secondary care. From 1 January 2016, the local authorities will be legally responsible for establishing emergency 24/7 beds. Only patients who can be treated safely at a primary care level can be admitted and their stay should normally not exceed three days. From 2012, these beds have gradually been established in an increasing number of municipalities.
58. Canada has introduced Urgent Care Centres2 and Collaborative Emergency Centres to provide urgent primary care services for minor health conditions outside the ED (See Box 4). In Chile, these primary care emergency services are called Servicio de Atención Primaria de Urgencia (SAPU). SAPUs are strategically located in different parts of cities, close to the community, offering OOH medical and nursing care services for low-complexity emergencies and general consultations. High-complexity emergencies are referred to the hospital if medically necessary. In general, SAPUs consist of doctors and nursing technicians who can prescribe basic medication such as pain killers or some antibiotics. Available data suggest that the development of the SAPU strategy moved emergency visits from hospitals towards SAPUs. Between 2008 and 2011, for example, visits to the second and third level of emergency care decreased slightly (Table A4), while at the same time the number of visits to SAPUs increased.
2 Urgent Care Centres have also been established in England (Monitor, 2014), to provide emergency services
that are very similar to those offered at walk-in centres. Urgent Care Centres in England are generally led by a GP, are available on a walk-in basis and mostly treat routine primary care conditions.

DELSA/HEA/WD/HWP(2015)6
26
Box 3. Definition of walk-in centres and minor injury units in the United Kingdom
Walk-in Centres and minor injury units together have the overarching aim of providing emergency services outside hospitals for patients with minor injuries or illness. There is no standard definition of walk-in centres and minor injury units across countries and, perhaps as a result, it might be difficult to distinguish the two emergency care services. The NHS provides the following definitions:
x Walk-in centres are sites providing routine and urgent primary care for minor ailments and injuries with no requirement for patients to pre-book an appointment. They are specifically dedicated to patients with minor illnesses or injuries. The centres are usually managed by a nurse or a GP. They are generally open for longer hours than GP practices, including after normal working hours and weekends. Walk-in centres treat coughs, cold and flu-like symptoms, skin conditions or infections, stomach upset or pain, breathing problems, back pain, urinary tract infections, ear, eye and throat infections, cuts, strains and sprains, and insect and animal bites. While all walk-in centres provide basic advice and treatment for minor conditions, the full range of services vary greatly by location. In 2012, there were 185 walk-in centres operating throughout England, including 135 GP-led and 50 nurse-led (only staffed by nurses with no doctors present).
x Minor injury units (MIU) are assessment and treatment centres led by specially-trained nurses, including emergency nurse practitioners. The intention is to handle less serious injuries than would ordinarily be treated at an ED. Major injuries, chest and stomach pains, breathing difficulties, allergic reactions, overdoses and other more serious health problems cannot be treated at the MIU. A patient requiring further diagnosis and treatment will be sent to the ED or referred to another, more appropriate service. MIUs are available on a walk-in basis, and are generally open seven days a week, 24 hours a day. The main difference between an MIU and a walk-in centre is that health professionals are not trained in primary care and, as a result, MIUs do not handle primary care conditions.
Source: Monitor (2014). Walk-in centre review: final report and recommendations. IRRES 02/14.
Box 4. Example of alternative sites of primary care in Canada
Urgent Care Centres in Alberta
Urgent Care Centres have been introduced as a mean of providing extended hour access for unexpected, but non-life-threatening health concerns, which require same day or evening treatment. Their role is to provide a transitional step of health service between community physician offices and hospitals. Urgent Care Centres have a broader range of services than physician clinics, but are not equivalent to EDs. They also help conserve emergency room resources for more serious, life-threatening conditions.
Collaborative Emergency Centres in Nova Scotia
Nova Scotia is the first province to introduce Collaborative Emergency Centres (CECs). CECs are an innovative way to improve access to both primary health care and emergency care. This model of health care delivery was developed and successfully implemented by Nova Scotia in communities which had difficulty maintaining 24/7 emergency services. CECs are open 24 hours a day, seven days a week. Services vary at each centre and reflect community needs, but they commonly offer access to primary health care by a team of professionals, including doctors and nurse practitioners, for 12 hours a day, seven days a week. At night, a team that includes a nurse and a paramedic (with physician oversight through the emergency medical services system) offers care and coordination of emergency services. CECs are now established in other provinces, including Saskatchewan and Prince Edward Island.
Source: Information provided by Canadian authorities.

DELSA/HEA/WD/HWP(2015)6
27
Community care centres for elderly populations, patients with chronic conditions and deprived populations
59. Community care centres or community health centres have been developed in some OECD countries to provide a source of primary care services for vulnerable or deprived populations, such as low-income earners, ethnic minorities or elderly patients with chronic conditions. Community care centres generally offer an array of health services for both adults and children, and try to place prevention and chronic disease management at the forefront of their organisation. There is strong empirical evidence showing that community care centres successfully reduce ED visits.
60. In Ireland, community health centres can take different forms, such as rapid access clinics based in the community, as well as community and home-based care. Such community care service initiatives are specifically designed to provide non-emergency care for the elderly population with long-term conditions. In Dublin, for example, a rapid access clinic has been set up for patients aged over 70 years who are referred by GPs and EDs. Community and home-based care have the objective of maintaining older people in their communities, to reduce both emergency attendance and emergency admission in acute hospital beds. The strategy provides home-help hours for high dependent elderly at risk of injury (Government of Ireland, 2009). By providing specific support to the frail elderly population, such strategies have the potential not only to reduce accidents, but also to prevent inappropriate use of emergency care.
61. In Italy, community care networks have been recently developed to increase primary care accessibility (Brunni, Mammi and Ugolini, 2013). Since 2012, the establishment of medical associations or partnerships among GPs, as well as community care networks, have been encouraged to improve quality and comprehensiveness of care. Although community care networks can take many different forms (such as medical associations, GPs cooperatives or primary care centres integrated into hospital EDs), the underlying idea is to ensure appropriate and coordinated care for patients with long-term conditions through group activity and integrated care (OECD, Forthcoming a). In an empirical analysis, Brunni, Mammi and Ugolini (2013) showed that setting up community care networks with extended opening hours favours a more appropriate use of ED visits in Italy.
62. The GP Super Clinics Programme in Australia is similar to the Italian community care network. These clinics bring together GPs, practice nurses, medical specialists and other health care providers in one location to deliver integrated multidisciplinary primary health care. The aim of the Programme is to provide access to affordable, best practice, multidisciplinary care, with a specific focus on meeting the needs and priorities of the local community, including the prevention and management of chronic disease. Whilst a critical focus of the GP Super Clinics Programme was to tackle the challenge of chronic diseases, such as diabetes and asthma, and risk factors such as obesity and smoking, GP Super Clinics deliver the additional benefit of relieving pressure on local hospitals and EDs.
63. Community care centres in the United States, called health centres or health care homes, are designed to redirect ED demand to primary care settings (Choudhry et al., 2007). They are community-based providers where patients receive medical attention in a continuous and patient-centred manner. Community care centres serve the most vulnerable, such as low-income populations, uninsured individuals and ethnic minorities. In 2007, there were 5 000 health centre sites across the Unites States. Patients going to health care centres saw improvements in health outcomes and were less likely to visit the ED, which overall contained the cost of care (Choudhry et al., 2007). In New York, for example, users of health centres had nearly 50% fewer ED visits than non-users. Overall, health centres improve access to primary care services and significantly reduce non-urgent and avoidable ED visits. Community care centres could potentially generate a 30% saving on annual Medicaid spending by preventing avoidable visits to EDs. The reduction of ED visits related to the establishment of community health centres is particularly visible for uninsured patients (Rust et al. 2009).

DELSA/HEA/WD/HWP(2015)6
28
4.1.2. Financial incentives on the demand side might potentially reduce the demand for emergency care, but the evidence on impact is mixed
64. Introducing cost-sharing for the use of emergency care (through the use of co-payments or deductibles) or removing payments at the point of care for outpatient primary care visits are two political options that have been considered to reduce the demand for emergency care services. Overall, studies that focused on the impact of cost-sharing on ED utilisation found mixed evidence, while studies assessing the effect of removing payments at the point of care for primary care services are absent.
65. Cost-sharing for emergency care is hoped to increase personal responsibility and discourage unnecessary use of emergency services. Cost-sharing for ED visits is not widely used amongst OECD countries. One obvious reason is the risk that such financial incentives discourage patients from seeking necessary care due to the financial burden.
66. Cost-sharing for emergency visits applies in Belgium, Finland, Italy, Ireland, Portugal and the United States (see Table 4). In Belgium, patients are required to get a referral from primary care physicians to attend an ED. Self-referred patients attending the ED have been subjected to a financial charge since 2007. Evidence suggests that such financial disincentives apply to nearly 43% of ED visits. The strategy, however, does not seem to be effective, since ED visits have not decreased following its implementation (De Wolf and Vanoverloop, 2011). In Italy, a co-payment of EURO 25 was introduced in 2011 for inappropriate ED visits for patients aged 14 and over. Regions are permitted to fully apply this co-payment or to enact regional rules for specific exemptions. A 2011 survey found that 26% of households saw an increase in emergency expenditure (Belvis et al., 2012). In Portugal, the recent increase in co-payments (which at present vary between €15 and €20) had no significant impact on the use of emergency services (Ramos and Almeida, 2014).
67. Results of these studies are inconsistent with most of the research conducted in the United States (Flores-Mateo G. et al., 2012; Morgan et al., 2013; Smulowitz, Honigman and Landon, 2013). In the literature review conducted by Morgan et al. (2013), of more than 10 studies evaluating the impact of cost-sharing in the United States, nine found significant reductions in the use of the ED (with reductions ranging from 3% to 50%). In the RAND Health Insurance Experiment, conducted in the 1980s, higher cost-sharing was associated with a reduction in ED use for both appropriate and inappropriate visits (O'Grady et al., 1985). ED expenses were 42% higher for people with no cost-sharing than those with a co-insurance rate of 95%, and 16% higher than those with smaller amounts of cost-sharing. The study also suggested that cost-sharing leads to a greater reduction in emergency care utilisation among low-income people, which has a greater impact on this population because they more frequently depend on emergency care services ceteris paribus. Selby et al. (1996) found that the introduction of a co-payment of between $25 and $35 led to a 15% reduction in ED use, while having a lesser impact on urgent ED visits. In a similar vein, Wharam et al (2007) found that ED co-payments averaging $49 leads to a 10% reduction in ED visits, with a more pronounced effect on reducing non-urgent visits. However, , consistent with O'Grady et al. (1985), the study found that cost-sharing was associated with a reduction in urgent ED visits among people living in low-income areas. More recently, Taubman et al. (2014) found that the expansion of the Medicaid programme for uninsured and low-income adults in Oregon increased ED use for both urgent and non-urgent conditions. Overall, expanded Medicaid coverage for low-income groups significantly increased emergency use by 40%, relative to the control group.
68. Whilst introducing cost-sharing might be a strategy to reduce inappropriate ED demand, it is critical to ensure that it does not reduce access by placing too much of a financial burden on individuals, particularly on the most deprived populations (Cooke et al., 2004). An alternative policy option is to remove payments at the point of care for outpatient primary care visits. This strategy provides easier access

DELSA/HEA/WD/HWP(2015)6
29
to primary care services, and removes incentives to seek free care in EDs to avoid the cost of outpatient primary care visits.
69. This is the case in Canada, Denmark, Italy, Poland, Spain, the United Kingdom and in most cases in Germany, where there is no payment at the point of care (in these countries outpatient primary care services are free at the point of care). Steps in this direction are underway in France. The new National Health Strategy plans to remove payments at the point of care for ambulatory care services by 2017. At the moment, some patients pay the full costs of outpatient visits before being partly reimbursed by health insurance. The change toward free access to primary care services at the point of care is intended to improve accessibility to outpatient primary care services and might also reduce the overall demand for emergency care in France. The strategy might, however, increase health care costs if removing payments at the point of care leads to a rise in the volume of primary care visits.
Table 4. Use of co-payments in emergency departments in selected OECD countries
Country examples
Type of cost-sharing
Belgium (De Wolf and Vanoverloop,
2011)
From 2007, self-referred patients going to EDs must pay a fee of €18.30 (or €10 for patients entitled to “preferential reimbursement”, called bénéficiaires de l'intervention majorée).
Finland (HSC, 2012)
Patients aged 18 and over pay a fee of €27.50 for visiting an emergency policlinic in hospital at night, and on Saturdays, Sundays and other public holidays, while there is no fee to visit a family health clinic or a nurse.
Italy (de Belvis et al., 2012)
In 2011, a co-payment of €25 was introduced for inappropriate visits to the ED for patients aged 14 and over.
Ireland (HSC, 2012) Patients attending an ED are subjected to a €100 charge.
Portugal (Ramos and Almeida, 2014)
From 2012, patients must pay €15 for basic emergency service visits, €17.5 for medical surgical visits and €20 for polyvalent emergency service visits.
The United States (http://www.medicaid.gov)
Under the Medicaid programme, states have the option to impose higher co-payments when people visit an ED for non-emergency services. This co-payment is limited to non-emergency services, as emergency services are exempt from all out-of-pocket charges. For people with incomes 150% above federal poverty level, such co-payments may be established up to the state's cost of the service, but certain conditions must be met.
Note: In each country cost sharing is subject to a number of exemptions.
4.1.3. Using information and communication technologies to improve patient self-monitoring and management, as well as to provide health services in remote areas, can be effective
70. Telemedicine, including both telehealth and telecare, is another potential method to reduce ED visits through home case management, teleconsultation or the diffusion of information around the most appropriate place of treatment. Telehealth can complement usual care by providing equipment for monitoring vital signs and sending the data to a clinician, while telecare uses equipment to support the patient in their own home (Purdy, 2010). Both strategies involve using information and communication technologies (ICT) to examine, monitor, and treat patients over a distance. Exchanging information between patients and health care professionals might improve patients’ literacy around the management of chronic disease and around what health services are locally available. Through these mechanisms, telemedicine could help patients to understand better their health conditions, provide tools for self-monitoring and shift health care delivery from secondary to community settings. Although there is still relatively little research examining its impact, current evidence shows that the use of telemedicine is effective in reducing ED utilisation, particularly for patients with long-term conditions.
71. With regards to the management of chronic conditions, telemedicine has been associated with fewer ED attendances, a reduction of hospital admissions and lower health costs (Purdy, 2010; McLean et
DELSA/HEA/WD/HWP(2015)6
30
al., 2012; Steventons et al., 2012; Bashur et al., 2014). A three-year randomised controlled trial in England showed positive results associated with the use of telemedicine on patients with long-term conditions including diabetes, chronic obstructive pulmonary disease (COPD) and heart failure. Telemedicine in this trial involved monitoring systems such as a pulse oximeter for COPD, a glucometer for diabetes, and weighting scales for heart failure. It also managed symptom questions and allowed educational messages to be sent to participants either via a telehealth base unit or via a box connected to a television. The trial found that if appropriately applied to long-term conditions, telehealth significantly reduced emergency admissions by 20%, emergency attendance by 15% and mortality rates by 45%.
72. Teleconsultation might also reduce the use of emergency care by providing access to primary care consultations. Teleconsultations can take several forms, ranging from email encounters, where patients receive answers to their concerns, to the use of web-based eVisit, where patients directly communicate with physicians from a computer. It can also include setting up a telemedicine station at different places, such as a nursing home or a community health centre, to provide patients with access to primary or specialised care (NEIH, 2010). Norway is one of the most advanced countries with respect to the use of telemedicine. The country has a long tradition of using telemedicine to provide health care services in rural areas. Although telemedicine has not been specially established to reduce inappropriate use of emergency care, its utilisation is regarded as a key instrument to keep patients closer to their communities, and is considered an alternative to face-to-face outpatient visits. Telemedicine in Norway involves consultations with different specialities, provision of emergency expertise to remote locations, monitoring patients undergoing dialysis, and providing support to elderly patients or patients with chronic conditions. Real time video-conferencing is used for teleconsultation, as well as store and forward applications to transmit medical data. An interesting feature in Norway is the fact that the reimbursement scheme covers the cost of video-conferencing (Zanaboni, Knarvik and Wootton 2013). In Australia, telehealth services were introduced in July 2011 to provide for specialist consultations via video-conferencing. These services enable GPs, other medical practitioners, nurse practitioners, midwives, Aboriginal health workers and practice nurses to provide face-to-face clinical services to patients during consultations with specialists.
73. Beyond home-case management for chronic disease and teleconsultation, countries also use information and communication technologies to improve patients’ information around the most appropriate place of treatment. This is the case in Canada, where patients can have online access to real-time ED waiting times, and to information about alternative options to an ED visit. Although not formally evaluated by the empirical literature, this strategy might be effective in reducing inappropriate ED visits by helping patients better decide where to seek care. To this end, patients with non-urgent conditions are informed about long waiting times in the ED and can thereby decide to attend urgent care centres or walk-in clinics to receive more appropriate medical attention.
4.2. Interventions aimed at improving pathways of care and reducing costs for inappropriate use of emergency departments
74. Specific interventions have been introduced to improve the efficiency of emergency services by redirecting non-urgent patients to more appropriate ambulatory settings, or to enhance patient discharge from the ED. The involvement of primary care physicians within the ED, the introduction of fast-track systems and the design of smart payment systems together have the potential to manage inappropriate demand for emergency care, which might improve pathways of care and reduce ED costs.
4.2.1. There is mixed evidence of the impact of GPs working in emergency departments
75. Because people presenting in EDs for primary care represent a significant proportion of visits, the involvement of primary care physicians within the ED has been proposed to give a more appropriate
DELSA/HEA/WD/HWP(2015)6
31
response to patients (Cooke et al., 2004; Carson et al., 2010). The use of GPs in EDs might provide more comprehensive and cost-effective care for patients with non-urgent problems. Primary care physicians are placed at the front of the ED to act as a filter in order to prevent patients with non-urgent problems from receiving costly ED treatments. By seeing non-urgent patients quickly and by redirecting them to ambulatory settings, the involvement of primary care physicians might reduce waiting times and patient length of stay. Overall, emergency physicians and emergency resources are expected to be freed up to treat patients with more urgent problems. However, as discussed in this sub-section, there is mixed evidence around the impact of such a strategy.
76. In a systematic review of the literature analysing innovations to reduce attendances and waits in the ED, Cooke et al (2004) show that the impact of GPs working in the ED is ambiguous. While the strategy can be cost-effective because of a lower use of emergency services, it might at the same time increase the number of primary care attenders to the ED, which in turn leads to an increase in waiting times.
77. In England, evidence suggests that GPs working in the ED may result in fewer inpatient admissions and tests being undertaken in the ED (Carson et al, 2010). Although some studies reported benefits in terms of costs, processes and patient experience, there was mixed evidence regarding the redirection of patients out of the ED. On the one hand, the involvement of GPs in EDs was associated with an increase in ED re-attendance, while on the other hand the strategy was associated with an increase in primary care attendance (Carson et al, 2010).
78. In the Netherlands, new care models have been developed, where GPs are involved in the ED. A before and after comparative study conducted by Boeke et al. (2010) found the new model of care had a positive impact. Patients treated by GPs were significantly more satisfied with their ED visits, and the proportion of patients referred to their GPs after the ED visit also increased. The involvement of GPs in EDs was found to be more effective than the usual model of care in terms of waiting and treatment time, without decreasing the quality of diagnosis. Overall, inappropriate ED visits appear to be handled more effectively with this strategy.
79. The Swiss version of such a strategy is the hospital-integrated general practice for emergency care service (HGP). Point of care diagnoses are based on a team of GPs and facilities are located within hospital EDs (Wang et al., 2013). The new emergency care model turned out to be considerably more efficient than the traditional one, resulting in reduced time from admission to discharge and a decrease in ED resource utilisation. It is a promising model to manage inappropriate use of ED resources.
4.2.2. Using fast-track systems to redirect non-urgent patients reduces the use of emergency department services
80. Another option to manage inappropriate ED visits is to introduce fast-track systems aimed at redirecting non-urgent patients to more appropriate ambulatory settings (Cooke et al., 2004; Yoon, 2003; Sanchez et al., 2006). The system prevents the inappropriate use of emergency care by treating patients with non-urgent conditions in a dedicated area where professionals have the competence to make discharge decisions. Medical attention is undertaken only by one person for low-urgency patients, while some patients with no need for emergency care are discharged to appropriate clinics. Acute and ambulatory patients are assessed and treated by less expensive health care providers such as residents, nurse practitioners, and physician assistants specifically dedicated to fast-track patients. These programmes apply for stable patients for whom medical workload is weak and who do not require medical imaging or biology. There is strong evidence that fast-track systems are effective in managing non-urgent patients, reducing the use of ED resources and increasing patient satisfaction.

DELSA/HEA/WD/HWP(2015)6
32
81. In Canada, fast-track systems are widely established in EDs to treat non-urgent patients as quickly as possible (Yoon, 2003). The system appears to be less resource-intensive compared with managing similar patients in regular EDs, leading to a reduction in ED costs per capita. Lengths of stay for low acuity patients have been shortened and fast-track systems have not adversely affected quality of care.
82. In the United States, Sanchez et al. (2006) showed that the opening of a fast-track system was significantly associated with an improvement in ED effectiveness, without having a detrimental effect on quality of care. The fast-track system reduced patient waiting time and length of stay in EDs, and led to a large reduction of people leaving without being seen, as well as a slight reduction in revisit rates and mortality rates.
83. In a similar vein, the study conducted in the United Kingdom by Rogers et al. (2004) demonstrates the positive effect of the fast-track system on patient waiting times. The proportion of patients assessed within 15 minutes rose from 82% to 98%, while those assessed within one hour rose from 63% to 90%. The system enabled the removal of a large number of patients from the general ED, which in turn freed up the remainder of the staff to concentrate on patients with a high level of acuity or injury (Rogers et al., 2004).
84. In France, fast-track systems (called “circuit courts”) are implemented in nearly one-third of EDs (Cour des comptes, 2014). Evidence shows that the fast-track system in a local Parisian hospital takes care of nearly 30% of ED patients. ED physicians and other expensive ED resources are not inappropriately used and are freed up for patients with the most severe or life-threatening conditions.
4.2.3. Payment system design can help enhance patient discharge from emergency departments or reduce emergency admissions
85. The way emergency physicians and hospitals are paid for emergency care is an important factor contributing to the inefficient use of emergency resources. Funding systems for EDs might encourage over-provision of expensive emergency care services and also promote induced activities. To offset perverse incentives, some OECD countries such as Japan, England and Canada have introduced financial incentives to enhance patient discharge from the ED, as well as to avoid emergency admission. Although these strategies do not directly address the issue of inappropriate ED visits, financial incentives for providers have the potential to reduce the inefficient use of emergency services. Available evidence shows that financial incentives improve efficiency in EDs through reduced waiting times.
86. To reduce the over-reliance on the hospital sector, financial incentives have been recently introduced in Japan under the revision of the fee schedule (OECD, forthcoming b). Additional fees have been increased to encourage patient discharge from hospital EDs. Accordingly, EDs receive higher fees when ED patients are discharged to primary care clinics (Japanese Ministry of Health, 2014). In Canada, financial incentives are provided to hospitals that demonstrate a measurable reduction in ED waiting times (CIHI, 2012). This strategy was launched in Ontario in 2008 as part of the Emergency Room Wait Times Strategy. Between 2008 and 2012, the average waiting time improved by up to 14%. In Vancouver, a pay-for-performance programme has been introduced to reward hospitals for meeting ED length-of-stay targets. Improvements in ED waiting time targets were achieved between 2007 and 2008, ranging from 13% to 24%. Similar strategies have also been introduced in England, with the introduction of a Quality Premium for clinical commissioning groups to reduce avoidable emergency admissions (Morse, 2013). Clinical commissioning groups can receive additional funding by achieving specific targets such as reducing avoidable emergency admissions for long-term and chronic conditions. This is also the case in the United States, where an experimental pay-for-performance program has been implemented to reduce asthma-related emergency admission for children. The programme consists of a range of preventive interventions, including, for example, home-based support from community health support (Galloway, 2014).

DELSA/HEA/WD/HWP(2015)6
33
87. Such financial incentives have not been introduced in France, although there are some concerns related to the ED funding system (Cour des comptes, 2014). In France, funding of EDs is based on a fixed grant (which increases with the number of cases) and a per-case payment, to which complementary billing is added for technical and medical examinations, as well as for revenue in case of inpatient admission following the ED visit. This funding system might provide perverse incentive for over-provision. In particular, the modulation of the fixed grant and the per-case payment encourages EDs to increase activities in order to achieve a higher level of payment. Induced activities are also likely to happen given the complementary billing for technical and medical examinations. Under these arrangements, EDs have incentives to deliver more services so as to maximise their revenue.

DELSA/HEA/WD/HWP(2015)6
34
5. CONCLUSIONS
88. The efficiency with which EDs are used is of central importance to policy makers, payers, physicians and users. Inefficient utilisation of ED services might lead to congestion of EDs. This not only increases health care costs, it also diminishes health care quality, and increases staff workloads and workplace violence. The working and employment conditions within EDs are hectic and unpredictable. Exposure to traumatic events (severe injuries, death, oral and physical aggression), excessive workloads and organisational issues related to inefficient utilisation (such as understaffing or adequacy of work schedules) are important factors conditioning the work environment, thereby requiring policy attention.
89. By providing an international perspective on emergency care services across 22 OECD countries, this fast-track paper finds that the volume of ED visits has increased over time in almost all OECD countries, except Chile, Israel, Poland, the Czech Republic and Ireland. Notably, the number of ED visits increased by nearly 7% on average between 2001 and 2011, going from 31.5 visits per 100 people in 2001 to 33.5 visits per 100 people in 2011. Although no consistent trend emerges from year-on-year growth of ED visits among OECD countries, the paper shows that hospital ED visits are generally more frequent among the oldest and youngest populations, and that injury-related diagnoses constitute one of the most common reasons for visiting EDs. Of particular concern is the fact that “non-urgent” or “inappropriate” ED visits are reported in several OECD countries including Australia, Belgium, Canada, England, France, Italy, Portugal and the United States. Accordingly, a significant proportion of patients - ranging from 12% in England to 56% in Belgium - could have been more effectively treated in alternative settings such as primary or community care, although variability across OECD countries is due to the different approaches and criteria used to identify these patients.
90. Whilst the relative contribution of the many different factors affecting the demand for emergency services is difficult to measure, there is strong empirical evidence suggesting that convenience and accessibility of EDs are all attractive arrangements for patients. This is particularly the case in France, where 60% of patients visited an ED due to its accessibility and its technical capacity. The growing use of ED services is also driven by the rapidly ageing population and the rising burden of chronic conditions which require resource-intensive evaluation during acute decompensation. These factors seem to play a strong role in the United States, Japan, Australia, Canada and Switzerland, where older people are more likely to use EDs frequently than the rest of the population. A substantial body of literature shows that lower socio-economic status significantly increases the demand for emergency services in England, the United States and Canada. The economic crisis most certainly has contributed to the growing demand for emergency care by increasing the number of people in vulnerable situations.
91. On the supply side, the development of ambulatory surgery as well as the access and availability of alternative sources of care are factors affecting the demand for emergency care services. The rapid development of day-case interventions that has occurred in England since 1998 appears to be responsible for a rise in emergency admissions of nearly 9%. Of great concern is the critical role played by EDs when outpatient primary care services do not provide a timely and appropriate answer for patients. Countries with more robust after-hours options for care, as well as those with short waiting times for a primary care appointment, seem less likely to have a high volume of ED visits, as seen in Germany, New Zealand and the Netherlands. By contrast, countries where patients are unable to get a rapid primary care appointment (such as England, the United States and Canada) or where access to OOH services outside hospital EDs is limited (such as Greece and Chile) display a high volume of ED visits.
DELSA/HEA/WD/HWP(2015)6
35
92. Many governments have implemented policies to reduce the demand for emergency care services and divert inappropriate visits away from EDs. Extending access to primary and community care services is the key policy option that has been considered in almost all OECD countries (e.g. 14 countries reviewed). Although the impact of telephone-based services and of alternative sites of primary care is rather ambiguous, strong empirical evidence supports the development of OOH primary care services and of community care centres to act as a substitute for emergency care services, and to reduce non-urgent ED visits. They are worth considering as possible options in countries where emergency visits are relatively high and causes are clearly identified. Introducing cost-sharing for emergency care (as in Belgium, Finland, Italy, Ireland, Portugal and the United States) or removing payments at the point of outpatient primary care visits (as in Canada, Denmark, Italy, Poland, Spain, the United Kingdom and Germany) are alternative interventions that have been implemented by governments, although their effectiveness in reducing ED visits is unclear. The use of telemedicine (as seen in England, Norway or Canada) successfully reduces ED visits by improving self-management for chronic disease, providing access to teleconsultation, and by improving patients’ information around the most appropriate place of treatment.
93. The literature review found consistent evidence supporting fast-track systems, as in Canada, the United States, the United Kingdom and France. Such interventions redirect non-urgent patients to more appropriate ambulatory settings, improving pathways of care and reducing ED costs. The impact of interventions aimed at involving GPs in the ED is more ambiguous. While in the Netherlands and Switzerland the intervention is found to be effective to handle inappropriate ED visits, it is associated with an increase in primary care attendance in England. Finally, although limited to the Canadian context, evidence shows that the introduction of financial incentives for providers (such as in Japan, Canada, England and the United States) might have potential to improve the efficiency of ED.
94. Whilst it might be difficult to change patients’ preferences for EDs, the following recommendations can be drawn to reduce the volume of ED visits and manage the inefficient use of ED resources across OECD countries:
x Improve primary care accessibility, notably by extending OOH services outside the hospital ED and by developing new forms of community care facilities.
x Encourage the use of telemedicine to keep patients closer to their community, improve patient self-management and information around the most appropriate place of treatment.
x Introduce fast-track systems to prevent inefficient use of emergency care resources by redirecting non-urgent ED patients to more appropriate ambulatory settings and arranging for these patients to be treated by less expensive health care providers.
x Involve a primary care physician in the ED to act as a filter in order to prevent patients with non-urgent problems from receiving costly ED treatments, while ensure that the strategy does not lead to an increase in the number of primary care visits to the hospital ED.
DELSA/HEA/WD/HWP(2015)6
36
REFERENCES
Adriaenssens J., V. De Gucht, and S. Maes (2015), Determinants and prevalence of burnout in emergency nurses: A systematic review of 25 years of research. International Journal of Nursing Studies 52 (2015) 649-661.
Afilalo J, Marinovich A, Afilalo M, Colacone A, Leger R, Unger B, et al. Nonurgent emergency department patient characteristics and barriers to primary care. Acad Emerg Med 2004; 11:1302-10.
AIHW 2013. Australian hospital statistics 2012-13: emergency department care. Health services series 52. Cat. no. HSE 142. Canberra: AIHW.
Bashur RL., GW. Shannon, BR. Smith (2014). The empirical foundations of telemedicine interventions for chronic disease management, Telemedicine and e-health, Vol 20, n°9. DOI: 10.1089/tmj.2014.9981
Beattie TF., DR. Gorman and JJ. Walker. 2001. The association between deprivation levels, attendance rate and triage category of children attending a children’s accident and emergency department. Emerg Med J 2001 18: 110-111. doi: 10.1136/emj.18.2.110
De Belvis AG., et al. (2012), The financial crisis in Italy : implications for the healthcare sector, Health Policy. 2012 Jun;106(1):10-6. doi: 10.1016/j.healthpol.2012.04.003
Bianco A, Pileggi C, Angelillo IF. Non-urgent visits to a hospital emergency department in Italy. Public Health 2003; 117:250-5.
Boeke A., et al. 2010. Effectiveness of GPs in accident and emergency departments. Br J Gen Pract 2010; DOI: 10.3399/bjgp10X532369
Boisguerin B., H. Valdelièvre. 2014. Urgences : la moitié des patients restent moins de deux heures, hormis ceux maintenus en observation. Etudes et Résultats 889. Direction de la recherche, des études, de l’évaluation et des statistiques (DREES)
Bruni ML., Mammi I., Ugolini C. 2013. Does the extension of primary care practice opening hours reduce inappropriate use of emergency services? An IV approach.Department of Economics, University of Bologna. June 2013.
Carret ML, Fassa AC, Domingues MR (2009) Inappropriate use of emergency services: a systematic review of prevalence and associated factors. Cad Saude Publica 2009, 25:7–28.
Carson D., H. Clay, R. Stern. 2010. Primary Care and emergency Departments. Report from the primary care foundation.March 2010.
Choudhry L., M. Douglass, Lewis J. et al. (2007). The Impact of Community Health Centers & Community-Affiliated Health Plans on Emergency Department Use. Association for Community Affiliated Plans.
DELSA/HEA/WD/HWP(2015)6
37
Canadian Institute for Health Information (2012). Health care in Canada: A focus on wait times. Ottawa, ON: CIHI; 2012.
Clevenger, C.K., T.A. Chu, Z. Yang, and K.W. Hepburn. 2012. "Clinical care of persons with dementia in the emergency department: A review of the literature and agenda for research." J Am Geriatr Soc 60(9): 1742-8.
Cour des comptes (2013), Rapport sur l’application des lois de financement de la sécurité sociale pour 2013, chapitre XII : la permanence des soins, La Documentation française, septembre 2013, p. 579-585, disponible sur www.ccomptes.fr
Cour des comptes (2014). Rapport sur l'application des lois de financement de la sécurité sociale pour 2014, chapitre XII : Les urgences hospitalières : une fréquentation croissante, une articulation avec la médecine de ville à repenser. La Documentation française, septembre 2014, p. 351-377, disponible sur www.ccomptes.fr
Cooke M. et al. (2004), Reducing Attendances and Waits in Emergency Departments. A systematic review of present innovations, Report to the National Co-ordinating Centre for NHS Service Delivery and Organisation R & D (NCCSDO). Available at http://www.sdo.nihr.ac.uk/files/project/29-finalreport.pdf
Cowling T, Harris M, Watt H, Gibbons D, Majeed M (2004). Access to general practice and visits to accident and emergency (A&E) departments in England: cross sectional analysis of national patient survey. Br J Gen Pract;434-9:10.3399/bjgp14X680533.
Crilly J, Chaboyer W, Creedy D. Violence towards emergency department nurses by patients. Accid Emerg Nurs. 2004; 12(2): 67-73. PMid:15041007 http://dx.doi.org/10.1016/j.aaen.2003.11.003
Cutler DM., A. Lleras-Muney (2010), Understanding differences in health behaviours by education, Journal of Health Economics 29 (2010) 1-28.
De Wolf F, J. Vanoverloop. 2011. Analyse de profil des patients recourant aux urgences hospitalières. Union Nationale des Mutualités Socialistes. Direction Etudes.
Durand A-C, Palazzolo S, Tanti-Hardouin N, Gerbeaux P, Sambuc R, Gentile S: Nonurgent patients in emergency departments: rational or irresponsible consumers? Perceptions of professionals and patients. BMC Research Notes 2012, 5:525.
Eurofound (2014), Access to healthcare in times of crisis, Publications Office of the European Union, Luxembourg.
Feng Z., L. Coots, Y. Kaganova, and J. Wiener ( 2013), Hospital and emergency department use by people with alzheimer’s disease and related disorders: Final report. U.S. Department of Health and Human Services Assistant Secretary for Planning and Evaluation Office of Disability, Aging and Long-Term Care Policy. August 2013.
Flores-Mateo G, Violan-Fors C, Carrillo-Santisteve P, Peiro´ S, Argimon J-M (2012) Effectiveness of Organizational Interventions to Reduce Emergency Department Utilization: A Systematic Review. PLoS ONE 7(5): e35903. doi:10.1371/journal.pone.0035903
Galloway (2014). Using pay-for-success to increase investment in the non-medical determinants of health. Health Affairs, 33, N°11 (2014):1897-1904. doi: 10.1377/hlthaff.2014.0741

DELSA/HEA/WD/HWP(2015)6
38
Georges G., C Jell and B Todd (2006). Effect of population ageing on emergency department speed and efficiency: a historical perspective from a district general hospital in the UK. Emerg Med J2006;23:379-383 doi:10.1136/emj.2005.029793
Gindi, RM., RA. Cohen, WK. Kirzinger (2012), Emergency room use among adults aged 18–64: Early release of estimates from the National Health Interview Survey, January–June 2011. National Center for Health Statistics. May 2012. Available from: http://www.cdc.gov/nchs/nhis/releases.htm.
Government of Ireland (2009). Emergency Departments. Report of the Comptroller and Auditor General. Available from http://www.audgen.gov.ie/documents/vfmreports/70_Emergency_Departments.pdf.
Grossman, M., 1972. On the concept of health capital and the demand for health. Journal of Political Economy 80 (2), 223–255.
Hastings SN. et al. (2008), Does lack of social support lead to more ED visits for older adults? Am J Emerg Med. 2008 May;26(4):454-61. doi: 10.1016/j.ajem.2007.07.005.
He J. et al. (2011). Demand for hospital emergency departments: a conceptual understanding. World J Emerg Med, Vol 2, No 4,pp. 253-261.
Hull, S., Rees Jones, I. and Moser, K. 1998. ‘Relation of rates of self referral to A&E departments to deprivation’, British Medical Journal 317:538.
Japanese Ministry of Health, Labour, and Welfare (2011), Overview of Primary Emergency Medical System. A vailable online at http://www.mhlw.go.jp/stf/shingi/2r98520000030p5p-att/2r98520000030p9s.pdf
Japanese Ministry of Health, Labour, and Welfare (2014), Overview of health care payment system Available at http://www.mhlw.go.jp/file/06-Seisakujouhou-12400000-Hokenkyoku/0000039891.pdf
Jonckheer P, Dubois C, Verhoeven E, Rinchard E, Baudewyns A-M, Haezaert T, et al. (2011). After-hours in primary care : which solutions ? Brussels, Belgian Health Care Knowledge Centre.
Lang T. et al. (1997), “Using the hospital emergency department as a regular source of care”, European Journal of Epidemiology 13: 223-228.
Lega F, A Mengoni (2008). Why non-urgent patients choose emergency over primary care services? Empirical evidence and managerial implications. Health Policy 88: 326-338.
Lowe RA, Localio AR, Schwarz DF, Williams S, Tuton LW, et al. (2005) Association between primary care practice characteristics and emergency department use in a medicaid managed care organization. Med Care 43: 792–800.
Mahmoud and Hou. 2012. Immigrants and the utilisation of hospital emergency departments. World Journal of Emergency Medicine, Vol 3, N°4.
Marmot M. et al. (2008), Closing the gap in a generation: health equity through action on the social determinants of health, Lancet 2008; 372: 1661–69.
McHale et al. (2013). Who uses emergency departments inappropriately and when - a national cross-sectional study using a monitoring data system. BMC Medicine 2013, 11:258
DELSA/HEA/WD/HWP(2015)6
39
McLean S. et al. (2012), Telehealthcare for chronic obstructive pulmonary disease: Cochrane Review and meta-analysis, Br J Gen Pract. Nov 2012; 62(604): e739–e749.
Ministry of Health (2011). Targeting Emergencies. Shorter stays in Emergency Departments. https://www.health.govt.nz/system/files/documents/publications/targeting-emergencies-health-target.pdf
Ministry of Health (2013). Emergency Department Use 2011/12: Key findings of the New Zealand Health Survey. Wellington: Ministry of Health.
Monitor (2014). Walk-in centre review: final report and recommendations. IRRES 02/14. Available from www.monitor.gov.uk
Morse A. 2013. Emergency Admissions to hospital: managing the demand. National Audit Office Report, Department of Health, HC 739 SESSION 2013-14.
Morgan SR., AM. Chang, M. Algatari, JM Pines. 2013. Non–Emergency Department Interventions to Reduce ED Utilization: A Systematic Review. ACADEMIC EMERGENCY MEDICINE 2013; 20:969–985. doi: 10.1111/acem.12219
Nagree Y et al, 2013, “Quantifying the proportion of general practice and low-acuity patients in the emergency department” in Med J Aust 198 (11): 612-61
NEHI (2010), A Matter of Urgency: Reducing Emergency Department Overuse. ANEHI Research Brief – March 2010.
OECD (2013), Health at a Glance 2013: OECD Indicators, OECD Publishing. http://dx.doi.org/10.1787/health_glance-2013-en
OECD (2014), OECD Reviews of Health Care Quality: Norway 2014: Raising Standards, OECD Publishing. http://dx.doi.org/10.1787/9789264208469-en
OECD (Forthcoming a), OECD Reviews of Health Care Quality: Italy 2014: Raising Standards, OECD Publishing.
OECD (forthcoming b), OECD Reviews of Health Care Quality: Japan 2014: Raising Standards, OECD Publishing.
O'Grady, K. F., Manning, W. G., Newhouse, J. P., & Brook, R. H. (1985). The impact of cost sharing on emergency department use. N Engl J Med, 313(8), 484-490. doi: 10.1056/nejm198508223130806
Olejaz M. et al. (2012), Denmark Health System Review”, Health Systems in Transitions, Vol. 14, No 2, pp.1-192.
O’Kelly FD. et al. (2010), Impact of a GP cooperative on lower acuity emergency department attendances, Emerg Med J. ;27(10):770-3. doi: 10.1136/emj.2009.072686.
Pereira S, Oliveira-e-Silva A, Quintas M, Almeida J, Marujo C, Pizarro M, et al. Appropriateness of emergency department visits in a Portuguese university hospital. Ann Emerg Med 2001; 37:580-6.
Pines et al. 2013. National Trends in Emergency Department Use, Care Patterns, and Quality of Care of Older Adults in the United States. Journal of the American Geriatrics Society, 61(1).
DELSA/HEA/WD/HWP(2015)6
40
Pickin, D.M., et al. (2004), "The Impact of a General Practice Co-operative on Accident and Emergency Services, Patient Satisfaction and GP Satisfaction." Family Practice 21(2): 180-82.
Piehl MD, Clemens CJ, Joines JD. (2000) Narrowing the gap: decreasing emergency department use by children enrolled in the Medicaid program by improving access to primary care. Arch Pediatr Adolesc Med. 2000; 154:791–5.
Pinchbeck T. 2014. Walk This Way: Estimating Impacts of Walk in Centres at Hospital Emergency Departments in the English National Health Service. SERC Discussion Paper 167. December 2014
Purdy S. (2010). Avoiding hospital admissions, What does the research evidence say? The king’s Fund 2010.
Ramos and Almeida (2014), The Impact of an Increase in User Costs on the Demand for Emergency Services: The Case of Portuguese Hospitals. FEP working papers, n° 531 March 2014, ISSN: 0870-8541.
Ringard et al. (2013), “Norway Health System Review”, Health Systems in Transitions, Vol. 15, No 8, pp.1-162.
Rust G., P. Baltrus, J. Ye et al. 2009. Presence of a community Health Center and Uninsured Emergency Department visit rates in Rural counties. J Rural Health. 2009 ; 25(1): 8–16. doi:10.1111/j.1748-0361.2009.00193.x.
Rocovich, C. and Patel, T. (2012), Emergency department visits: Why adults choose the emergency room over a primary care physician visit during regular office hours? Word J Emerg Med, Vol3, No2, 2012.
Rogers T., N. Ross, D. Spooner. 2004. Evaluation of a ‘see and treat’ pilot study introduced to an emergency department. Accident and Emergency Nursing (2004) 12, 24–27.
Sanchez M., A. Smally, R Grant and L Jacobs. 2006. Effects of a fast-track area on emergency department performance. The Journal of Emergency Medicine. Volume 31, Issue 1, July 2006, Pages 117–120
Selby JV, Fireman BH, Swain BE. Effect of a copayment on use of the emergency department in a health maintenance organization. N Engl J Med. 1996; 334:635–41.
Sjönell, G. 1986. ‘Effect of establishing a primary care health centre on the utilisation of primary health care and other outpatient care in a Swedish urban area’, Family Practice 3:148-54.Smulowitz PB., L.
Swiss Health Observatory (2013), Consultations dans un service d’urgence en Suisse », OBSAN BULLETIN 3/2013
Honigman, BE Landon. 2013. A Novel Approach to Identyfying Targets for Cost Reduction in the Emergency Department. Annals of Emergency Medicine Volume 61(3): March 2013.
Steventon A. et al. (2012) 'Effect of telehealth on use of secondary care and mortality: findings from the Whole System Demonstrator cluster randomised trial', British Medical Journal 344: e3874.
Tan S, Mays N. 2014. Impact of initiatives to improve access to, and choice of, primary and urgent care in the England: a systematic review, Health Policy (2014), http://dx.doi.org/10.1016/j.healthpol.2014.07.011

DELSA/HEA/WD/HWP(2015)6
41
Taubman SL. et al. (2014). Medicaid increases Emergency Department Use: Evidence from Oregon's Health Insurance Experiment. Science 343, 263. DOI: 10.1126/science.1246183
Taylor JL, Rew L. A systematic review of the literature: workplace violence in the emergency department. J Clin Nurs. 2010
The King's Fund. 2015. What’s going on in A&E? The key questions answered. Available at: http://www.kingsfund.org.uk. Page updated 14 January 2015.
van Uden CJ., et al. 2005. The impact of a primary care physician cooperative on the caseload of an emergency department: the Maastricht integrated out-of-hours service. J Gen Intern Med. 2005 Jul;20(7):612-7.
Uschner-Pines L. et al. (2013), Emergency department visits for nonurgent conditions: systematic literature review, Am J Manag Care. 2013 Jan;19(1):47-59.
VanStone NA., P. Belanger, K. Moore, JM. Caudle. 2014. Socio-economic composition of low-acuity emergency department users in Ontario. Can Fam Physician 2014;60:355-62
Vilpert S., et al., Emergency department use by oldest-old patients from 2005 to 2010 in a Swiss university hospital. BMC Health Services Research 2013, 13:344. doi:10.1186/1472-6963-13-344
Walls CA., KV. Rhodes, JJ. Kennedy. 2002. The Emergency Department as Usual Source of Medical Care: Estimates from the 1998 National Health Interview Survey. ACAD EMERG MED, November 2002, Vol. 9, No. 11
Wang et al. (2013). Hospital-integrated general practice: a promising way to manage walk-in patients in emergency departments. Journal of Evaluation in Clinical Practice. doi:10.1111/jep.12074.
Wharam JF, et al. (2007), Emergency department use and subsequent hospitalizations among members of a high-deductible health plan. JAMA. 2007;297: 1093-1102.
WHO (2008), Emergency Medical Services Systems in The European Union, Report of an assessment project co-ordinated by the world health organisation, The Regional Office for Europe of the World Health Organization 2008.
Wise J. (2014). Most emergency attendances at hospital are appropriate, finds study. BMJ 2014; 348:g3479
Wong WB. et al. (2009), Can after-hours family medicine clinics represent an alternative to emergency departments? Survey of ambulatory patients seeking after-hours care, Can Fam Physician. Nov 2009; 55(11): 1106–1107.e4.
Yoon P (2003). Emergency department fast-track system. HTA Initiative #10, March 2003. Alberta Heritage Foundation for Medical Research
Zanaboni P., U. Knarvik, R. Wootton. 2013. Adoption of routine telemedicine in Norway: the current picture. Global Health Action2014, 7:22801.
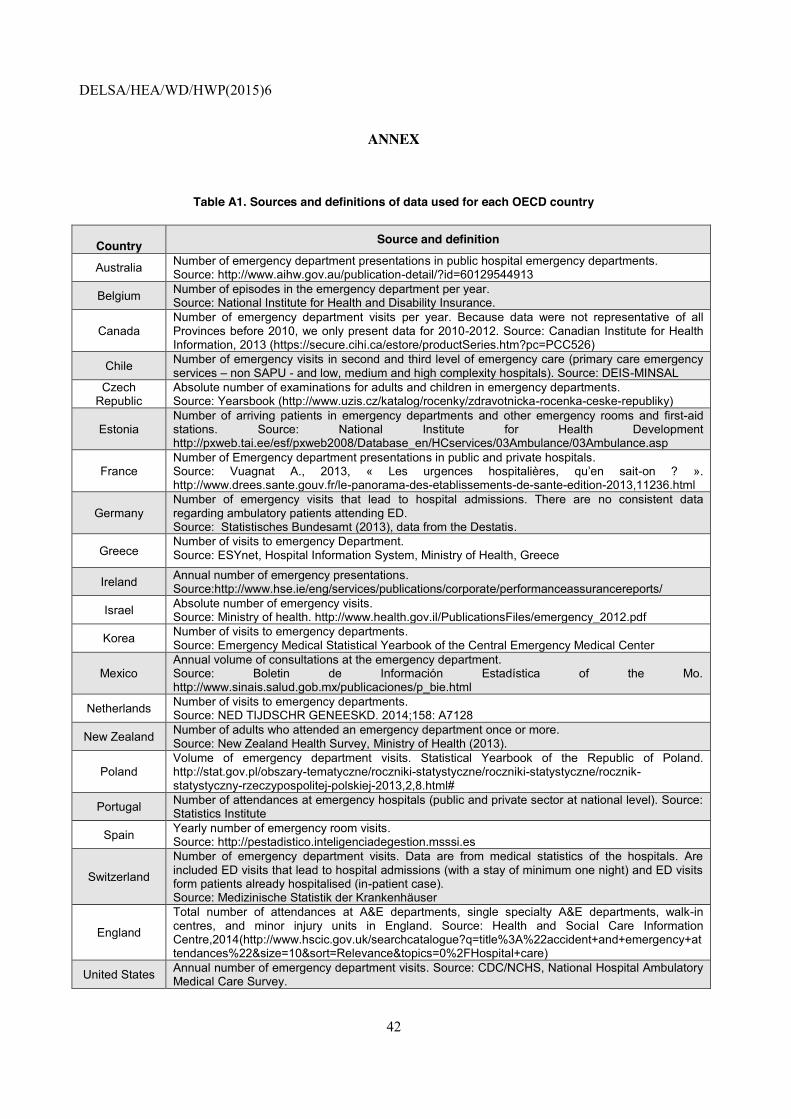
DELSA/HEA/WD/HWP(2015)6
42
ANNEX
Table A1. Sources and definitions of data used for each OECD country
Country Source and definition
Australia Number of emergency department presentations in public hospital emergency departments. Source: http://www.aihw.gov.au/publication-detail/?id=60129544913
Belgium Number of episodes in the emergency department per year. Source: National Institute for Health and Disability Insurance.
Canada Number of emergency department visits per year. Because data were not representative of all Provinces before 2010, we only present data for 2010-2012. Source: Canadian Institute for Health Information, 2013 (https://secure.cihi.ca/estore/productSeries.htm?pc=PCC526)
Chile Number of emergency visits in second and third level of emergency care (primary care emergency services – non SAPU - and low, medium and high complexity hospitals). Source: DEIS-MINSAL
Czech Republic
Absolute number of examinations for adults and children in emergency departments. Source: Yearsbook (http://www.uzis.cz/katalog/rocenky/zdravotnicka-rocenka-ceske-republiky)
Estonia Number of arriving patients in emergency departments and other emergency rooms and first-aid stations. Source: National Institute for Health Development http://pxweb.tai.ee/esf/pxweb2008/Database_en/HCservices/03Ambulance/03Ambulance.asp
France Number of Emergency department presentations in public and private hospitals. Source: Vuagnat A., 2013, « Les urgences hospitalières, qu’en sait-on ? ». http://www.drees.sante.gouv.fr/le-panorama-des-etablissements-de-sante-edition-2013,11236.html
Germany Number of emergency visits that lead to hospital admissions. There are no consistent data regarding ambulatory patients attending ED. Source: Statistisches Bundesamt (2013), data from the Destatis.
Greece Number of visits to emergency Department. Source: ESYnet, Hospital Information System, Ministry of Health, Greece
Ireland Annual number of emergency presentations. Source:http://www.hse.ie/eng/services/publications/corporate/performanceassurancereports/
Israel Absolute number of emergency visits. Source: Ministry of health. http://www.health.gov.il/PublicationsFiles/emergency_2012.pdf
Korea Number of visits to emergency departments. Source: Emergency Medical Statistical Yearbook of the Central Emergency Medical Center
Mexico Annual volume of consultations at the emergency department. Source: Boletin de Información Estadística of the Mo. http://www.sinais.salud.gob.mx/publicaciones/p_bie.html
Netherlands Number of visits to emergency departments. Source: NED TIJDSCHR GENEESKD. 2014;158: A7128
New Zealand Number of adults who attended an emergency department once or more. Source: New Zealand Health Survey, Ministry of Health (2013).
Poland Volume of emergency department visits. Statistical Yearbook of the Republic of Poland. http://stat.gov.pl/obszary-tematyczne/roczniki-statystyczne/roczniki-statystyczne/rocznik-statystyczny-rzeczypospolitej-polskiej-2013,2,8.html#
Portugal Number of attendances at emergency hospitals (public and private sector at national level). Source: Statistics Institute
Spain Yearly number of emergency room visits. Source: http://pestadistico.inteligenciadegestion.msssi.es
Switzerland
Number of emergency department visits. Data are from medical statistics of the hospitals. Are included ED visits that lead to hospital admissions (with a stay of minimum one night) and ED visits form patients already hospitalised (in-patient case). Source: Medizinische Statistik der Krankenhäuser
England
Total number of attendances at A&E departments, single specialty A&E departments, walk-in centres, and minor injury units in England. Source: Health and Social Care Information Centre,2014(http://www.hscic.gov.uk/searchcatalogue?q=title%3A%22accident+and+emergency+attendances%22&size=10&sort=Relevance&topics=0%2FHospital+care)
United States Annual number of emergency department visits. Source: CDC/NCHS, National Hospital Ambulatory Medical Care Survey.

D
ELSA/H
EA/W
D/H
WP(2015)6
43
Table A2. Absolute number of visits to em
ergency department across O
ECD countries, 2001 (or nearest available year) and 2012 (or m
ost recent year)
Note: D
ue to different definitions and identification of emergency care services caution is needed w
hen comparing O
EC
D countries. S
ome countries include both am
bulatory and inpatient E
D visits (e.g. Australia), w
hile other countries (e.g. Switzerland or Germ
any) include only inpatient ED
visits (ED
visits which lead to hospital adm
issions with a m
inimum
of one stay and/or E
D visits from
patients already hospitalised).
Source: Table A
1
20012002
20032004
20052006
20072008
20092010
20112012
Australia5,742,139
5,957,9616,183,288
6,547,3426,712,224
Belgium
1,921,5692,193,351
2,295,9942,376,572
Canada
15,800,00016,200,000
16,600,000C
zech Republic
755,042831,454
734,891739,459
741,775C
hile11,115,563
9,537,9929,625,475
9,558,0419,300,382
9,109,1949,492,658
10,001,04210,047,912
9,994,8889,849,752
10,086,110E
stonia383,878
396,983413,703
427,988453,426
465,256472,978
France13,584,206
14,202,15514,685,493
14,835,08015,210,377
15,937,01816,422,296
16,915,38517,554,175
17,566,74518,522,747
Germ
any5,420,009
5,702,1425,963,137
6,320,9506,621,561
6,844,0227,163,214
7,464,171G
reece4,936,410
Ireland1,207,497
1,223,0001,087,388
1,172,8011,206,797
Israel2,340,933
2,332,8622,434,233
2,421,5502,481,535
2,535,6782,548,295
2,552,7542,672,357
2,794,5002,789,041
Korea
8,905,76610,814,628
10,232,01610,327,028
10,243,040M
exico25,414,994
25,449,40527,113,474
26,896,52624,813,422
25,648,64129,472,250
29,806,01130,546,510
32,429,840N
etherlands2,079,172
New
-Zealand283,000
483,000P
oland5,556,094
6,278,9965,667,478
5,583,489P
ortugal7,122,383
7,287,5337,044,811
7,296,0367,287,900
7,573,8617,402,689
7,500,8197,535,925
7,442,2797,300,892
Spain
25,967,35226,443,775
25,715,001S
witzerland
1,136,8811,168,830
1,182,3931,216,203
1,255,8021,291,209
1,304,7651,321,481
1,340,5691,328,536
England
12,318,05113,794,072
15,569,73616,244,934
17,619,70818,328,896
United S
tates107,500,000
110,200,000113,900,000
110,200,000115,300,000
119,200,000116,800,000
123,761,000136,072,000
129,843,000136,296,000
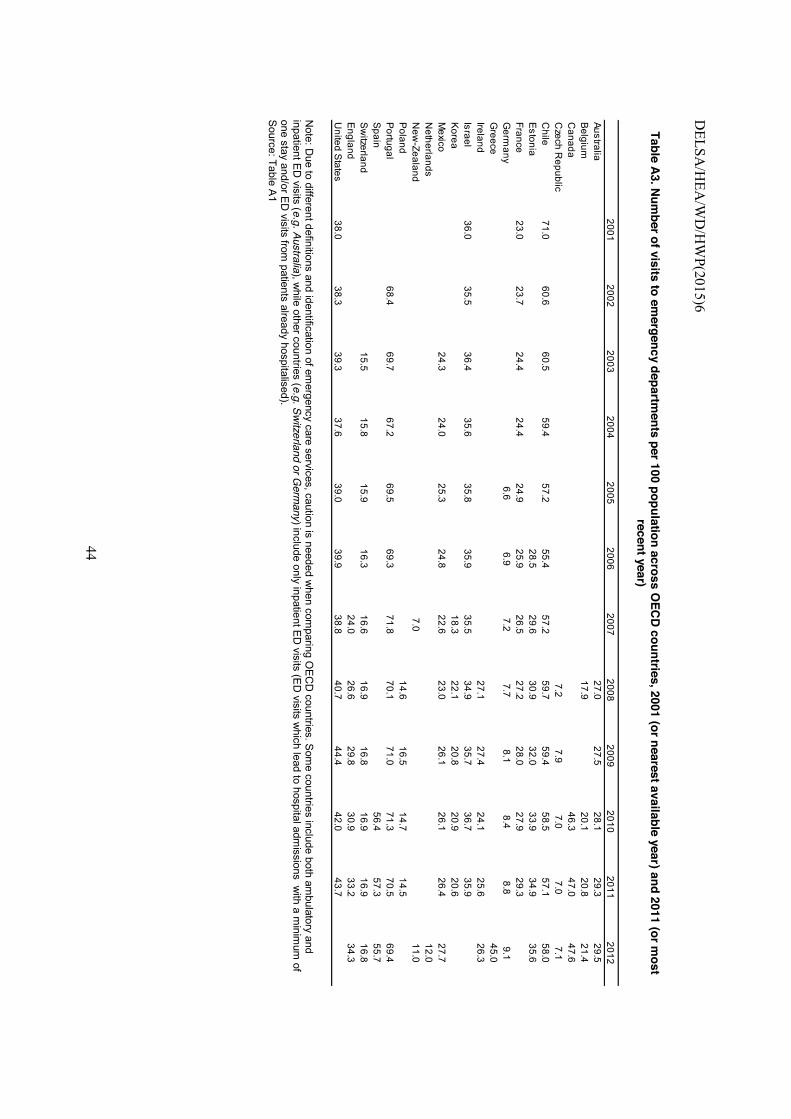
DELSA
/HEA
/WD
/HW
P(2015)6
44
Table A3. Num
ber of visits to emergency departm
ents per 100 population across OEC
D countries, 2001 (or nearest available year) and 2011 (or most
recent year)
Note: D
ue to different definitions and identification of emergency care services, caution is needed w
hen comparing O
EC
D countries. S
ome countries include both am
bulatory and inpatient E
D visits (e.g. Australia), w
hile other countries (e.g. Switzerland or Germ
any) include only inpatient ED
visits (ED
visits which lead to hospital adm
issions with a m
inimum
of one stay and/or E
D visits from
patients already hospitalised). S
ource: Table A1
20012002
20032004
20052006
20072008
20092010
20112012
Australia27.0
27.528.1
29.329.5
Belgium
17.920.1
20.821.4
Canada
46.347.0
47.6C
zech Republic
7.27.9
7.07.0
7.1C
hile71.0
60.660.5
59.457.2
55.457.2
59.759.4
58.557.1
58.0E
stonia28.5
29.630.9
32.033.9
34.935.6
France23.0
23.724.4
24.424.9
25.926.5
27.228.0
27.929.3
Germ
any6.6
6.97.2
7.78.1
8.48.8
9.1G
reece45.0
Ireland27.1
27.424.1
25.626.3
Israel36.0
35.536.4
35.635.8
35.935.5
34.935.7
36.735.9
Korea
18.322.1
20.820.9
20.6M
exico24.3
24.025.3
24.822.6
23.026.1
26.126.4
27.7N
etherlands12.0
New
-Zealand7.0
11.0P
oland14.6
16.514.7
14.5P
ortugal68.4
69.767.2
69.569.3
71.870.1
71.071.3
70.569.4
Spain
56.457.3
55.7S
witzerland
15.515.8
15.916.3
16.616.9
16.816.9
16.916.8
England
24.026.6
29.830.9
33.234.3
United S
tates38.0
38.339.3
37.639.0
39.938.8
40.744.4
42.043.7
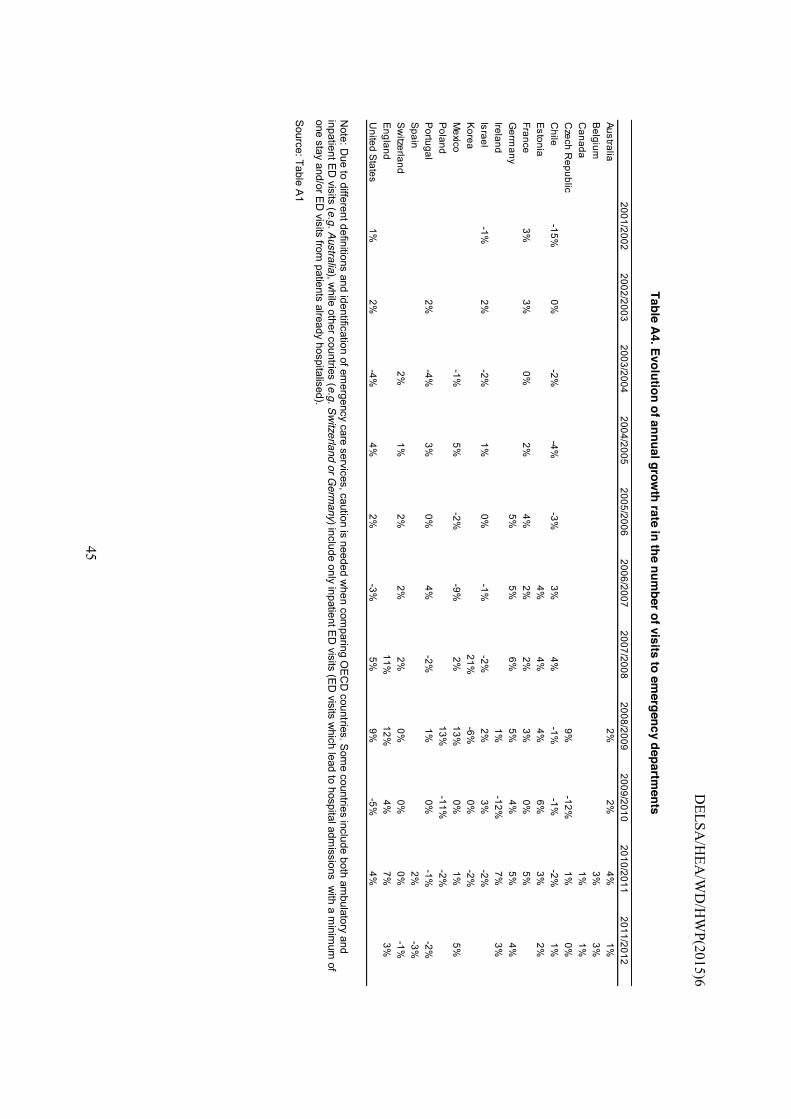
D
ELSA/H
EA/W
D/H
WP(2015)6
45
Table A4. Evolution of annual growth rate in the num
ber of visits to emergency departm
ents
Note: D
ue to different definitions and identification of emergency care services, caution is needed w
hen comparing O
EC
D countries. S
ome countries include both am
bulatory and inpatient E
D visits (e.g. Australia), w
hile other countries (e.g. Switzerland or Germ
any) include only inpatient ED
visits (ED
visits which lead to hospital adm
issions with a m
inimum
of one stay and/or E
D visits from
patients already hospitalised).
Source: Table A
1 2001/20022002/2003
2003/20042004/2005
2005/20062006/2007
2007/20082008/2009
2009/20102010/2011
2011/2012Australia
2%2%
4%1%
Belgium
3%3%
Canada
1%1%
Czech R
epublic9%
-12%1%
0%C
hile-15%
0%-2%
-4%-3%
3%4%
-1%-1%
-2%1%
Estonia
4%4%
4%6%
3%2%
France3%
3%0%
2%4%
2%2%
3%0%
5%G
ermany
5%5%
6%5%
4%5%
4%Ireland
1%-12%
7%3%
Israel-1%
2%-2%
1%0%
-1%-2%
2%3%
-2%K
orea21%
-6%0%
-2%M
exico-1%
5%-2%
-9%2%
13%0%
1%5%
Poland
13%-11%
-2%P
ortugal2%
-4%3%
0%4%
-2%1%
0%-1%
-2%S
pain2%
-3%S
witzerland
2%1%
2%2%
2%0%
0%0%
-1%E
ngland11%
12%4%
7%3%
United S
tates1%
2%-4%
4%2%
-3%5%
9%-5%
4%

DELSA/HEA/WD/HWP(2015)6
46
Table A5. Structure of the population by age groups, selected OECD countries
Age groups US 2010 SWZ (2011) NZ (2013)
0-4 7% 5% 7% 5-14 13% 10% 13%
15-24 14% 12% 14% 25-34 13% 13% 13% 35-44 13% 15% 13% 45-54 15% 16% 14% 55-64 12% 12% 11% 65-74 7% 9% 8% 75+ 6% 8% 6%
Source: OECD Population Statistics

DELSA/HEA/WD/HWP(2015)6
47
OECD HEALTH WORKING PAPERS
A full list of the papers in this series can be found on the OECD website: http://www.oecd.org/els/health-systems/health-working-papers.htm
No. 82 MENTAL HEALTH ANALYSIS PROFILES (MhAPs) Sweden (2015) Pauliina Patana
No. 81 MENTAL HEALTH ANALYSIS PROFILES (MhAPs) England (2015) Emily Hewlett and Kierran Horner
No. 80 ASSESSING THE IMPACTS OF ALCOHOL POLICIES (2015) Michele Cecchini, Marion Devaux, Franco Sassi
No. 79 ALCOHOL CONSUMPTION AND HARMFUL DRINKING: TRENDS AND SOCIAL DISPARITIES ACROSS OECD COUNTRIES (2015) Marion Devaux and Franco Sassi
No. 78 TAPERING PAYMENTS IN HOSPITALS – EXPERIENCES IN OECD COUNTRIES (2015) Grégoire de Lagasnerie, Valérie Paris, Michael Mueller, Ankit Kumar
No. 77 WAGE-SETTING IN THE HOSPITAL SECTOR (2014) James Buchan, Ankit Kumar, Michael Schoenstein
No. 76 HEALTH, AUSTERITY AND ECONOMIC CRISIS: ASSESSING THE SHORT-TERM IMPACT IN OECD COUNTRIES (2014) Kees van Gool and Mark Pearson
No. 75 COMPARING HOSPITAL AND HEALTH PRICES AND VOLUMES INTERNATIONALLY (2014) Francette Koechlin, Paul Konijn, Luca Lorenzoni, Paul Schreyer
No. 74 MENTAL HEALTH ANALYSIS PROFILES (MhAPS) Scotland (2014) Alessia Forti
No. 73 MENTAL HEALTH ANALYSIS PROFILES (MhAPs) Netherlands (2014) Alessia Forti, Chris Nas, Alex van Geldrop, Gedrien Franx, Ionela Petrea, Ype van Strien, Patrick Jeurissen
No. 72 MENTAL HEALTH ANALYSIS PROFILES (MhAPs) Finland (2014) Pauliina Patana
No. 71 MENTAL HEALTH ANALYSIS PROFILES (MhAPs) Italy (2014) Alessia Forti
No. 70 PRICING AND COMPETITION IN SPECIALIST MEDICAL SERVICES – AN OVERVIEW FOR SOUTH AFRICA (2014) Ankit Kumar, Grégoire de Lagasnerie, Frederica Maiorano, Alessia Forti
No. 69 GEOGRAPHIC IMBALANCES IN DOCTOR SUPPLY AND POLICY RESPONSES (2014) Tomoko Ono, Michael Schoenstein, James Buchan
No. 68 HEALTH SPENDING CONTINUES TO STAGNATE IN MANY OECD COUNTRIES (2014) David Morgan and Roberto Astolfi
No. 67 MEASURING AND COMPARING WAITING TIMES IN OECD COUNTRIES (2013) Luigi Siciliani, Valerie Moran and Michael Borowitz
No. 66 THE ROLE OF FISCAL POLICIES IN HEALTH PROMOTION (2013) Franco Sassi

DELSA/HEA/WD/HWP(2015)6
48
No. 65 is now Health Working Paper no. 79.
No. 64 MANAGING HOSPITAL VOLUMES: GERMANY AND EXPERIENCES FROM OECD COUNTRIES (2013) Michael Schoenstein and Ankit Kumar
No. 63 VALUE IN PHARMACEUTICAL PRICING (2013) Valérie Paris, Annalisa Belloni
No. 62 HEALTH WORKFORCE PLANNING IN OECD COUNTRIES: A REVIEW OF 26 PROJECTION MODELS FROM 18 COUNTRIES (2013) Tomoko Ono, Gaetan Lafortune and Michael Schoenstein
No. 61 INTERNATIONAL VARIATIONS IN A SELECTED NUMBER OF SURGICAL PROCEDURES (2013) Klim McPherson, Giorgia Gon, Maggie Scott
No. 60 HEALTH SPENDING GROWTH AT ZERO: WHICH COUNTRIES, WHICH SECTORS ARE MOST AFFECTED? (2013) David Morgan and Roberto Astolfi
No. 59 A COMPARATIVE ANALYSIS OF HEALTH FORECASTING METHODS (2012) Roberto Astolfi, Luca Lorenzoni, Jillian Oderkirk
No. 58 INCOME-RELATED INEQUALITIES IN HEALTH SERVICE UTILISATION IN 19 OECD COUNTRIES, 2008-09 (2012) Marion Devaux and Michael de Looper
No. 57 THE IMPACT OF PAY INCREASES ON NURSES’ LABOUR MARKET: A REVIEW OF EVIDENCE FROM FOUR OECD COUNTRIES (2011) James Buchan and Steven Black
No. 56 DESCRIPTION OF ALTERNATIVE APPROACHES TO MEASURE AND PLACE A VALUE ON HOSPITAL PRODUCTS IN SEVEN OECD COUNTRIES (2011) Luca Lorenzoni and Mark Pearson
No. 55 MORTALITY AMENABLE TO HEALTH CARE IN 31 OECD COUNTRIES: ESTIMATES AND METHODOLOGICAL ISSUES (2011) Juan G. Gay, Valerie Paris, Marion Devaux, Michael de Looper
No. 54 NURSES IN ADVANCED ROLES: A DESCRIPTION AND EVALUATION OF EXPERIENCES IN 12 DEVELOPED COUNTRIES (2010) Marie-Laure Delamaire and Gaetan Lafortune
No. 53 COMPARING PRICE LEVELS OF HOSPITAL SERVICE ACROSS COUNTRIES: RESULTS OF A PILOT STUDY (2010) Luca Lorenzoni
No. 52 GUIDELINES FOR IMPROVING THE COMPARABILITY AND AVAILABILITY OF PRIVATE HEALTH EXPENDITURES UNDER THE SYSTEM OF HEALTH ACCOUNTS FRAMEWORK (2010) Ravi P. Rannan-Eliya and Luca Lorenzoni
No. 51 EFFECTIVE WAYS TO REALISE POLICY REFORMS IN HEALTH SYSTEMS (2010) Jeremy Hurst
No. 50 HEALTH SYSTEMS INSTITUTIONAL CHARACTERISTICS A SURVEY OF 29 OECD COUNTRIES (2010) Valerie Paris, Marion Devaux and Lihan Wei
No. 49 THE CHALLENGE OF FINANCING HEALTH CARE IN THE CURRENT CRISIS (2010) Peter Scherer, Marion Devaux

DELSA/HEA/WD/HWP(2015)6
49
RECENT RELATED OECD PUBLICATIONS
OECD HEALTH STATISTICS 2015 (Database available from http://www.oecd.org/health/healthdata
ADDRESSING DEMENTIA – THE OECD RESPONSE (2015)
CARDIOVASCULAR DISEASE AND DIABETES – POLICIES FOR BETTER HEALTH AND QUALITY OF CARE (2015)
DEMENTIA RESEARCH AND CARE: CAN BIG DATA HELP? (2015)
FIT MIND, FIT JOB – FROM EVIDENCE TO PRACTICE IN MENTAL HEALTH AND WORK (2015)
TACKLING HARMFUL ALCOHOL USE – ECONOMICS AND PUBLIC HEALTH POLICY (2015)
MAKING MENTAL HEALTH COUNT: THE SOCIAL AND ECONOMIC COSTS OF NEGLECTING MENTAL HEALTH CARE (2014)
HEALTH AT A GLANCE: EUROPE (2014)
HEALTH AT A GLANCE: ASIA/PACIFIC (2014)
GEOGRAPHIC VARIATIONS IN HEALTH CARE: WHAT DO WE KNOW AND WHAT CAN BE DONE TO IMPROVE HEALTH SYSTEM PERFORMANCE? (2014)
PAYING FOR PERFORMANCE IN HEALTH CARE: IMPLICATIONS FOR HEALTH SYSTEM PERFORMANCE AND ACCOUNTABILITY (2014)
OBESITY HEALTH UPDATE (2014) http://www.oecd.org/els/health-systems/Obesity-Update-2014.pdf (electronic format only)
OECD REVIEWS OF HEALTH CARE QUALITY –JAPAN (2015)
OECD REVIEWS OF HEALTH CARE QUALITY – ITALY (2015)
OECD REVIEWS OF HEALTH CARE QUALITY – PORTUGAL (2015)
OECD REVIEWS OF HEALTH CARE QUALITY – CZECH REPUBLIC (2014)
OECD REVIEWS OF HEALTH CARE QUALITY – NORWAY (2014)
OECD REVIEWS OF HEALTH CARE QUALITY – TURKEY (2014)
OECD REVIEWS OF HEALTH CARE QUALITY – DENMARK (2013)
OECD REVIEWS OF HEALTH CARE QUALITY – SWEDEN (2013)
CANCER CARE – ASSURING QUALITY TO IMPROVE SURVIVAL (2013)
ICTs AND THE HEALTH SECTOR –TOWARDS SMARTER HEALTH AND WELLNESS MODELS (2013)
A GOOD LIFE IN OLD AGE? MONITORING AND IMPROVING QUALITY IN LONG-TERM CARE (2013)
STRENGTHENING HEALTH INFORMATION INFRASTRUCTURE FOR HEALTH CARE QUALITY GOVERNANCE (2013)
WAITING TIME POLICIES IN THE HEALTH SECTOR, WHAT WORKS? (2013)
HEALTH AT A GLANCE (2013): OECD INDICATORS (2013) See http://www.oecd.org/health/healthataglance for more information
For a full list, consult the OECD On-Line Bookstore at www.oecd.org, or write for a free written catalogue to the following address:
OECD Publications Service, 2, rue André-Pascal, 75775 PARIS CEDEX 16 or to the OECD Distributor in your country


![Emergency Care[1]](https://static.fdocuments.in/doc/165x107/554b0917b4c905c12d8b5479/emergency-care1.jpg)