EMEA Webinar - An Introduction to Real User Measurement
32
Introduction to Real User Measurement
-
Upload
soasta -
Category
Technology
-
view
30 -
download
1
Transcript of EMEA Webinar - An Introduction to Real User Measurement
Introduction toReal User Measurement

© 2013 SOASTA. All rights reserved. 2
Agenda
Introduction to RUM
Why RUM First
Demo of mPulse
Questions & Answers - input via Chat
Hosts:Chris Addis & Oliver Hunt
© 2013 SOASTA. All rights reserved. 3
Speed is a means to an end,not the ultimate goal

HappyCustomer
sSpend &
Stay Around
© 2013 SOASTA. All rights reserved. 5
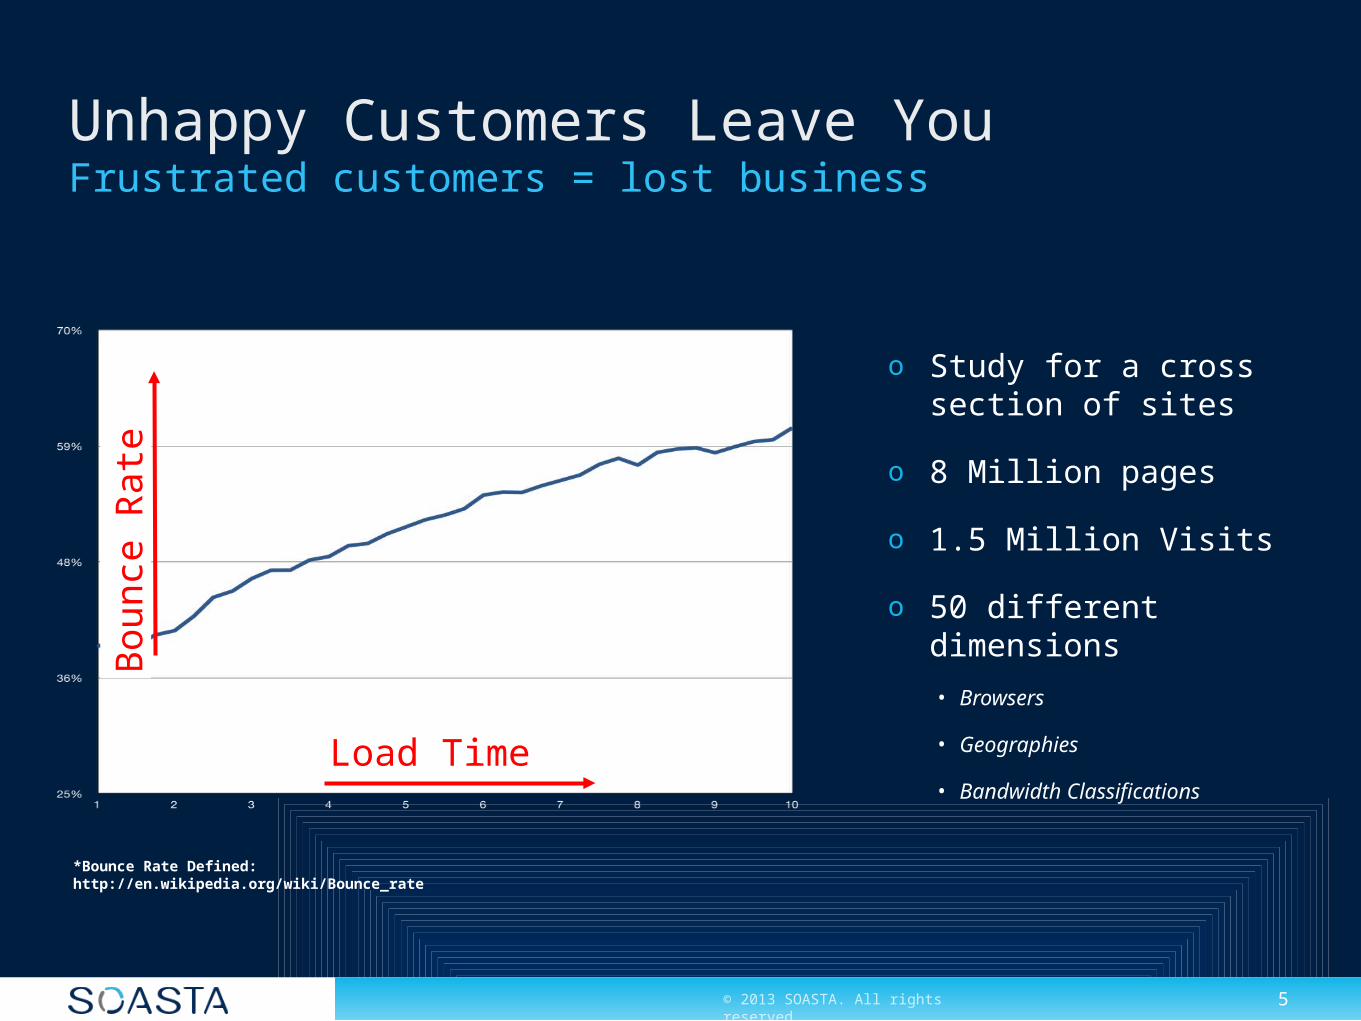
Unhappy Customers Leave YouFrustrated customers = lost business
Bou
nce
Rat
e
Load Time
*Bounce Rate Defined: http://en.wikipedia.org/wiki/Bounce_rate
o Study for a cross section of sites
o 8 Million pages
o 1.5 Million Visits
o 50 different dimensions
• Browsers
• Geographies
• Bandwidth Classifications

© 2013 SOASTA. All rights reserved. 6
Unhappy Customers Don’t BuyA case study from the world’s largest retailer
o 2011 – Walmart presents findings from a RUM study done to show the impact of site performance on revenue
o Results are staggering
• 1s improvement = 2% conversion lift
• 100ms improvement = 1% increase in incremental revenue
Source: SF WebPerf Meetup - http://minus.com/msM8y8nyh#2e
© 2013 SOASTA. All rights reserved. 7
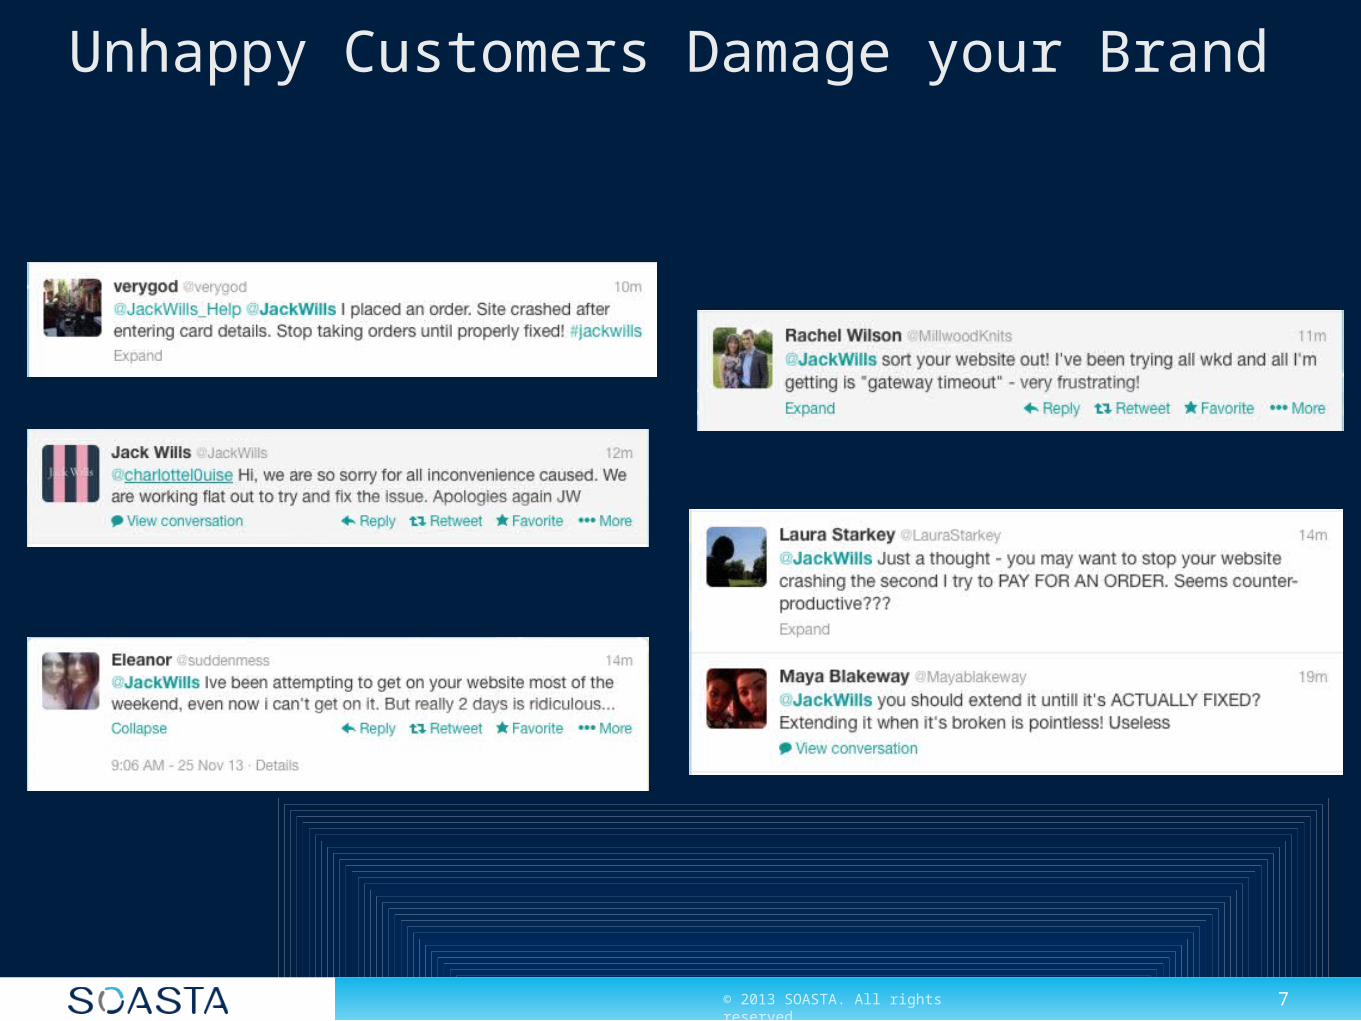
Unhappy Customers Damage your Brand

© 2013 SOASTA. All rights reserved. 8
So if we want happy customers, everything we do should put the user first,

© 2013 SOASTA. All rights reserved. 9
Which means our performance measurement should focus on measuring
users

© 2013 SOASTA. All rights reserved.
How fast am I?
How fast should I be?
How do I get there?

© 2013 SOASTA. All rights reserved.
How fast am I?
How fast should I be?
How do I get there?

http://www.flickr.com/photos/usnavy/
How do you measure a user?

© 2013 SOASTA. All rights reserved. 13
Users are different in many waysDifferent locations, browsers, pages & devices

© 2013 SOASTA. All rights reserved. 14
But all users use computers &/or mobile devices

© 2013 SOASTA. All rights reserved. 15
So put something inside the computer

But not these computers
http://www.flickr.com/photos/luc/

http://www.flickr.com/photos/luc/
These computers

© 2013 SOASTA. All rights reserved.
How Fast Am I?Instrument Every Interaction On Your Web Site
Copy
Paste
View Results

© 2013 SOASTA. All rights reserved.
How fast am I?
How fast should I be?
How do I get there?

© 2013 SOASTA. All rights reserved. 20
Start with the behaviors you care aboutMeasure them using RUM
Bounce RateConversion
Revenue
Likes, Shares, EtcCommen
ts
Items Sold
Signups

© 2013 SOASTA. All rights reserved. 21
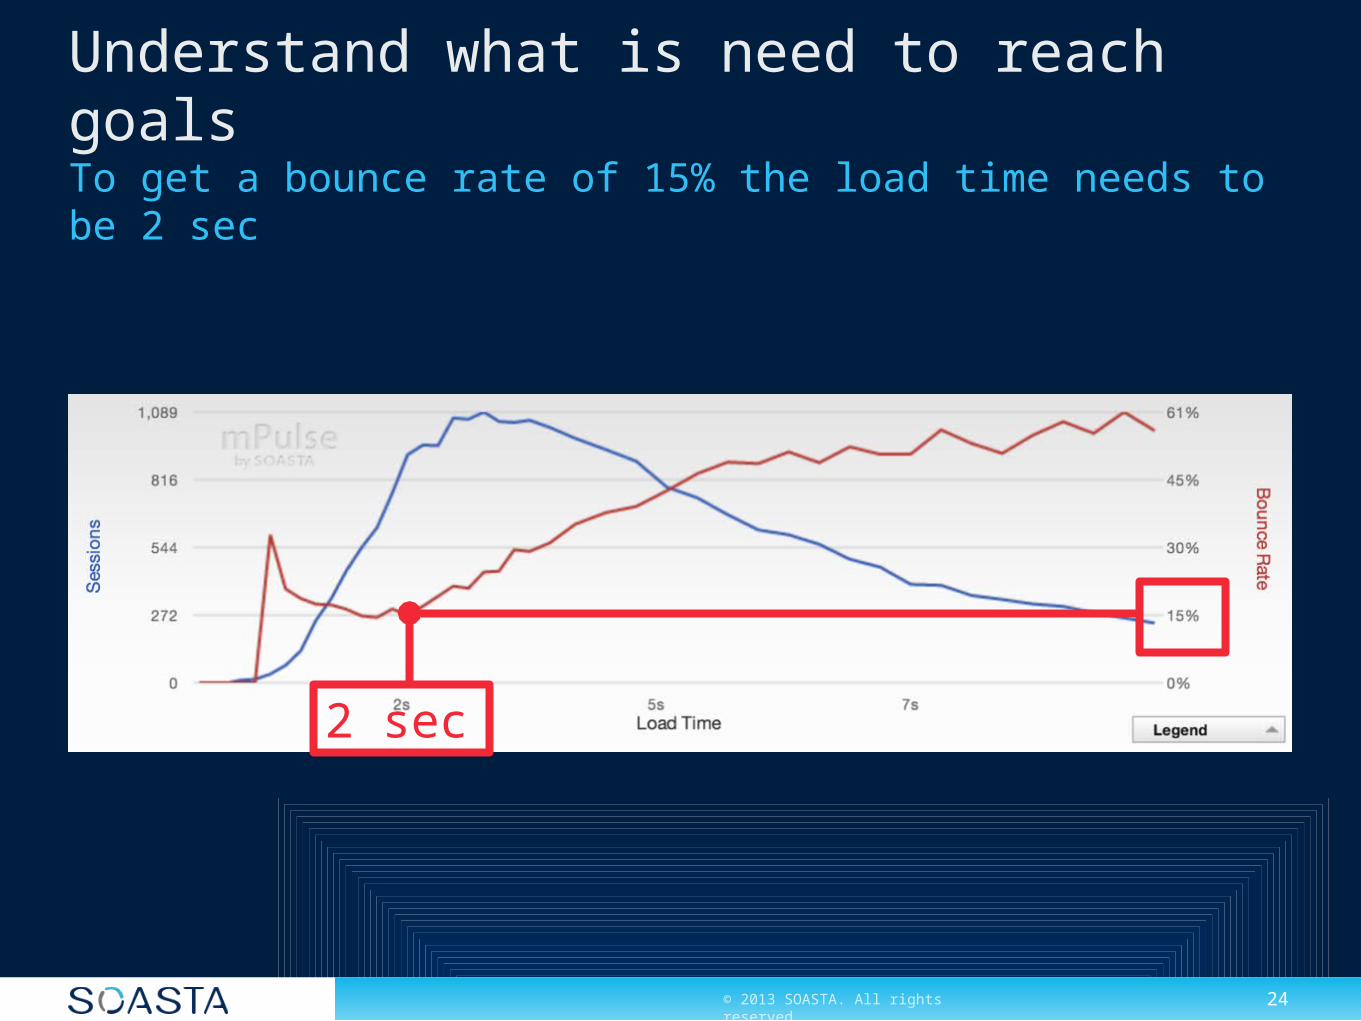
Then plot how speed changes the metricsExample: Bounce rate vs. page load time

© 2013 SOASTA. All rights reserved. 22
Choose a metric value to targetExample: 30% Bounce Rate

© 2013 SOASTA. All rights reserved. 23
Derive the required speed from the chartExample: 3.5 second load time for a 30% or better bounce rate
3.5 sec
© 2013 SOASTA. All rights reserved. 24
Understand what is need to reach goalsTo get a bounce rate of 15% the load time needs to be 2 sec
2 sec

© 2013 SOASTA. All rights reserved.
How fast am I?
How fast should I be?
How do I get there?
© 2013 SOASTA. All rights reserved.© 2013 SOASTA. All rights reserved. 26
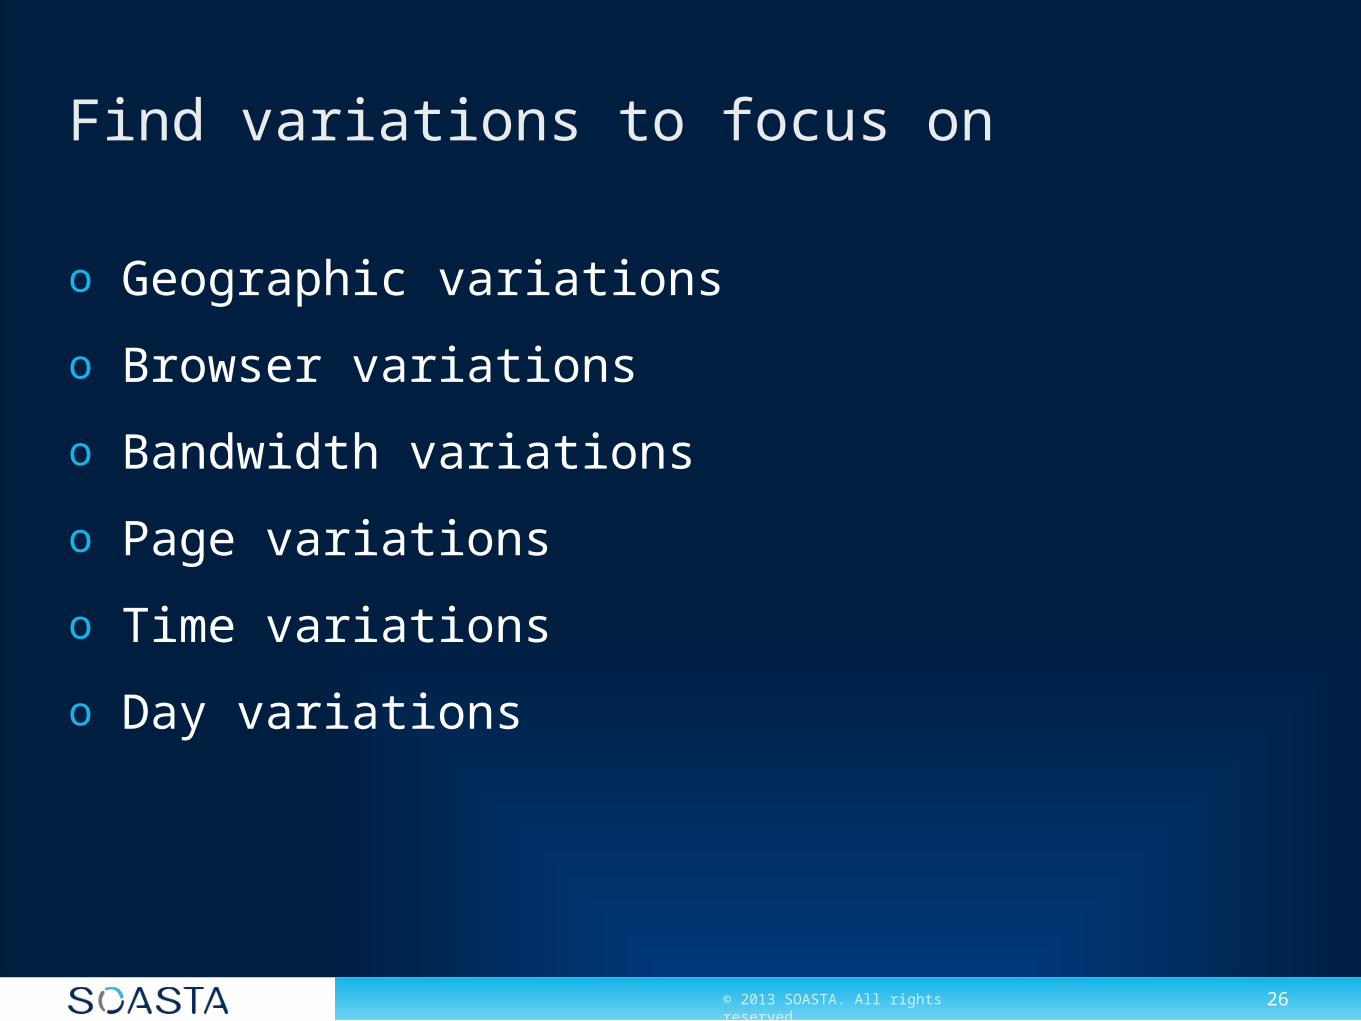
Find variations to focus on
o Geographic variations
o Browser variations
o Bandwidth variations
o Page variations
o Time variations
o Day variations

© 2013 SOASTA. All rights reserved.© 2013 SOASTA. All rights reserved. 27
Page variations

© 2013 SOASTA. All rights reserved.© 2013 SOASTA. All rights reserved. 28
Browser variations

© 2013 SOASTA. All rights reserved.© 2013 SOASTA. All rights reserved. 29
Geographic variations

© 2013 SOASTA. All rights reserved.© 2013 SOASTA. All rights reserved. 30
mPulse supports all of these

© 2013 SOASTA. All rights reserved.
mPulse
Collect everything
Map to business objectives
View real user data
in real time
Real Time, Real User Intelligence
SOASTA mPulse
SOASTA mPulsewww.soasta.com/mpulse