EMC Precompliance Concepts
8
EMC Precompliance Concepts with Real Time Spectrum Analyzers Featuring Spike’s EMC Precompliance Tools Introduction The design, development, and troubleshooting process of producing an EMC compliant device is complex and potentially expensive. There are stringent EMC/EMI Compliance standards for commercial, industrial, military, and space applications. In order to avoid costly and time-consuming redesigns after EMC Compliance testing failure, many electronics manufacturers perform EMC Precompliance. The equipment for EMC Precompliance and knowledge regarding how to implement the insights derived from that equipment pose challenges. Fortunately, real-time spectrum analyzers (RTSAs) equipped with EMC Precompliance software tools can provide a significant edge in precompliance testing that can limit costly redesigns and speed up time to market. In order to maintain some semblance of order and limit disruptive electromagnetic interference (EMI) from preventing operation of electronic devices for consumer, commercial, public safety, and military applications, government organizations have developed electromagnetic compatibility (EMC) standards. These standards dictate the emissions and susceptibility requirements for different classes of electronics, with special provisions for RF, military, commercial, emergency responder, and medical applications. Technical BRIEF Figure 1: For the different classes of electronics, in the United States and other countries, the standards organizations and type of approval varies. (Source: https://www.ieee.li/pdf/essay/guide_to_global_emc_requirements_2007.pdf)
Transcript of EMC Precompliance Concepts

EMC Precompliance Concepts with Real Time Spectrum Analyzers Featuring Spike’s EMC Precompliance Tools
IntroductionThe design, development, and troubleshooting process of producing an EMC compliant device is complex and potentially expensive. There are stringent EMC/EMI Compliance standards for commercial, industrial, military, and space applications. In order to avoid costly and time-consuming redesigns after EMC Compliance testing failure, many electronics manufacturers perform EMC Precompliance. The equipment for EMC Precompliance and knowledge regarding how to implement the insights derived from that equipment pose challenges. Fortunately, real-time spectrum analyzers (RTSAs) equipped with EMC Precompliance software tools can provide a significant edge in precompliance testing that can limit costly redesigns and speed up time to market.
In order to maintain some semblance of order and limit disruptive electromagnetic interference (EMI) from preventing operation of electronic devices for consumer, commercial, public safety, and military applications, government organizations have developed electromagnetic compatibility (EMC) standards. These standards dictate the emissions and susceptibility requirements for different classes of electronics, with special provisions for RF, military, commercial, emergency responder, and medical applications.
Technical BRIEF
Figure 1: For the different classes of electronics, in the United States and other countries, the standards organizations and type of approval varies.
(Source: https://www.ieee.li/pdf/essay/guide_to_global_emc_requirements_2007.pdf)

2 // EMC Precompliance Benefits With RTSAs
EMC Precompliance Concepts with Real Time Spectrum Analyzers Featuring Spike’s New EMC Precompliance Tools // SignalHound.com
The organization that regulates EMC for the United States is the Federal Communications Commission (FCC) and in Europe, it is the Conformité Européene (CE). For electronics to operate legally in these countries, they must have passed and be certified via compliance testing. This testing can be very expensive, as it must be performed by certified laboratories.
Also, this doesn’t mean that every single product manufactured is FCC or CE compliant, as only the design and manufacturing process for a specific product is certified. Often, design changes during development may lead to products slipping through a quality assurance (QA) testing program, if any such program is even present. Nevertheless, there are very costly fines and possible products bans on products and devices that don’t meet EMC Compliance standards.
The main emissions testing for EMC Compliance are radiated emissions and conducted emissions. To perform radiated emissions testing, a facility with very limited interfering signals and reflections—either a semi-anechoic chamber, anechoic chamber, open area test site (OATS), or GTEM/TEM cell—that fits specific criteria can be used. However, using any test methods outside of exact compliance descriptions could result in measurements that differ dramatically from EMC Compliance lab testing. Conducted emissions testing requires measurements of the signals conducted by accessory conductive cables of a device and require current clamp measurements.
For these reasons, many organizations opt to perform EMC Precompliance testing during the design and development of a product, and/or implement EMC Precompliance testing during QA testing. EMC Precompliance many not use compliant tools or methods of testing. But, EMC Precompliance testing can provide valuable design insights to enhance a product during development to increase its likelihood of passing EMC Compliance testing.
EMC Precompliance during QA testing can prevent noncompliant products being released to a customer and potentially leading to legal and compliance hassles. Also, EMC Compliance testing only reveals pass or fail criteria on an entire system. And if it is a complex system with many subassemblies, there will be little information available for remedying the problem.
EMC Precompliance Benefits With RTSAsEMC Precompliance testing doesn’t require the very specific hardware and processes necessary for full EMC Compliance testing. So, EMC Precompliance testing can be performed much faster, and now with devices that could provide detailed insights into a device design’s conducted and radiative emissions behavior. Real-time spectrum analyzers (RTSAs) are new to the scene of EMC Precompliance, and have many features and flexible operation that could lend their use to high valued EMC Precompliance testing. Also, there are PC-driven and USB-based RTSAs that are feature
rich due to the sophisticated PC software that controls, displays, and processes the information generated by the RTSA. Some of these software suites, Signal Hound’s free Spike™ software for example, even include EMC Precompliance software tools.
RTSAs are not suited for EMC Compliance measurements, as this requires a very specifically designed receiver. However, for EMC Precompliance testing and QA, low-cost PC-Driven RTSAs can provide analysis data for device EMC behavior in the field, production facility, or during prototyping. Also, an RTSA can capture very short duration and intermittent signals that traditional spectrum analyzers or EMC receivers aren’t capable of measuring reliably. The time-varying behavior of these signals may be extremely important to deciphering the cause of the undesired emission, and as a diagnostic tool, an RTSA could save costs and time in the debugging and troubleshooting process.
For example, RTSAs can provide persistent displays, waterfall displays, max held trace, and frequency mask triggers, if available with a specific device. Signal Hound’s BB60C with Spike software can perform all of these measurements that reveal frequency and time-domain information simultaneously. These measurement methods are particularly useful for capturing and analyzing bursty, modulated, or intermittent signals, which may be completely missed by a traditional swept spectrum analyzer if the signal duration is shorter than the attack specification of the detector.
Figure 2: Spike’s new EMC software module offers easily accessible Frequency Scan Displays for common standards, Bar Meter Plots with quasi-peak
detector features, and a spur table display, all in one interface.

Spike Software Features a Free EMC Precompliance Toolset // 3
SignalHound.com // EMC Precompliance Concepts with Real Time Spectrum Analyzers Featuring Spike’s New EMC Precompliance Tools
Figure 3: A persistent display with EMC probes can reveal spurious and intermittent spurious activity of a standard USB 2.0 port.
An RTSA with fully overlapping fast fourier transforms (FFTs) enables digitization and PC-based processing of data of extremely short duration signals. The record and analysis abilities of a PC-Driven RTSA can be valuable diagnostic tools and are also valuable for tracking design documentation and progress. Once spurs and undesired responses are found, repeated testing may be necessary over many design cycles to mitigate the EMC issue.
RTSAs can be paired with magnetic and electric field probes, and provide real-time measurements of a device while in operation, in order to “sniff” out the EMC problem. Having a light and hand-portable PC-driven RTSA with a near-field probe attached directly to the RTSA, or through a preamplifier, can provide high quality measurements helping to pinpoint an emissions feature otherwise hard to catch.
Also, low-cost PC-Driven RTSAs could easily be adapted to an automated test equipment (ATE) installation for quality assurance purposes to ensure that a noncompliant device won’t be released into the market or deployed in a mission critical application.
Spike Software Features a Free EMC Precompliance ToolsetLike any test and measurement tool or system, EMC Precompliance test systems are only as good as understanding how to use the system and knowing how to interpret the results effectively. Fortunately, there are features available in some EMC
Precompliance software suites that help interpret the results of EMC Precompliance testing, and aid in building an understanding of the device behavior with time-saving and easy-to-use analysis tools. This article will use Signal Hound’s Spike software to explain the operation of several common EMC Precompliance software tools with tips on how to use these tools to develop or troubleshoot a design.
Path Loss & Antenna Factor Correction TablesCabling and antenna frequency dependant behavior could either add to or detract from the real radiated or conducted emissions EMC Precompliance testing. This could cause inaccurate results that paint a rosy picture of a device’s behavior or cost significant amounts of development reducing emissions on an already compliant devices. Fortunately, Path Loss and Antenna Factor Correction Tables can be used to calibrate or compensate for an EMC Precompliance test setup’s frequency response imperfections.
For example, a Path Loss Table can be used to compensate for non flat frequency response for EMC test systems with cables, preamplifiers, and attenuators, or when using compact antennas with built-in preamplifiers for radiated emissions testing. With Spike, the path loss table correction factors— frequency and dB pairs imported as CSV files—are applied to the signal prior to the display or processing of the signal for standard frequency sweeps, real-time spectrum analysis, and scalar network analysis.
The Antenna Factor Correction Tables are similar to Path Loss Tables, but are formed as frequency and dBm pairs, and are converted to electric field strength units, which are used to be consistent in EMC Compliance testing. EMC Compliance antennas may come with Antenna Factor Correction tables, or a calibration system can be used to build such a table for radiated emissions antennas used in test chambers or conducted emissions using current clamps.
Figure 4: When path loss is applied, the correction adjusts the amplitude of a signal based upon the figures in an imported Path Loss Table.

4 // Limit Line Tables & Range Tables
EMC Precompliance Concepts with Real Time Spectrum Analyzers Featuring Spike’s New EMC Precompliance Tools // SignalHound.com
Limit Line Tables & Range TablesAs EMC Compliance Frequency Scan Displays can have many frequency ranges with many complex level requirements, Limit Line Tables and Range Tables are used to generate and simplify the use of complex EMC Plots. A Range table is a configuration table that dictates the attributes of an EMC Frequency Scan Display including resolution bandwidth, start/stop frequency, selectivity, detector settings, and more.
Range tables enable several precisely configured tables to be displayed simultaneously, and be adjusted, saved, and loaded without having to go through the time-consuming effort of setting up each display individually. Range Tables could also be useful for identifying interferers in frequency channels of interest in interference hunting applications. In Spike, up to 10 ranges can be implemented, and a change in a range table is immediately updated in the display configuration.
Potentially, hundreds of spurs could be measured for a specific device under test, and tracking which spurs violate the different standards power level limits at certain frequencies could be very challenging or impossible with intermittent behavior. An important EMC Precompliance measurement tool is the Limit Line Tables: this table enables a limit line to be displayed on the graticule, and can be programmed with different values corresponding with the EMC Compliance standards and Range Tables. Any spur that violates a limit line will trigger a “Fail” status to be displayed at the top of the Frequency Scan Display. This can be especially helpful as changes are made to a design, to ensure that the failing response is diminished and the modification to the device in development doesn’t induce other EMC failing responses. Zero padding may be required, as with the Path Loss and Antenna Factor Correction tables.
RANGE TABLE CONFIGURATION PARAMETERS (SPECIFICALLY FOR SPIKE SOFTWARE)
Load Default Load the default range table inputs.
Save Table Save the current table setup to a CSV file.
Load Table Load a previously saved table setup. This overrides the current setup.
Enabled Enable or disable the selected range. Enabling ranges are swept and shown on the sweep display.
Start Freq Select the start frequency of the selected range.
Stop Freq Select the stop frequency of the selected range.
RBW Shape Select between the 6dB CISPR RBW (Gaussian) or Flattop 3dB RBW filter.
RBW Resolution Bandwidth.
VBW Video Bandwidth.
Auto VBW When enabled, tracks RBW. When disabled, VBW must be equal to or lower than RBW.
Video Units Video processing unit type.
Detector Select between Peak and Average detectors.
Dwell TimeSelect the duration the spectrum analyzer dwells at any given frequency. This is helpful for capturing a periodic event. It is recommended to have the peak detector enabled when increasing dwell time.
Threshold Minimum signal level for a signal to be considered a spur. This value must be lower than the limit setting.
Limit Set the level at which a signal is considered to fail the test setup.
SelectivityDetermines how sensitive the spur detector is. Higher values increase the necessary separation needed for a signal to be considered a spur. Caution: low selectivity values may greatly increase the number of reported spurs.

Frequency Scan Display & Spur Tables // 5
SignalHound.com // EMC Precompliance Concepts with Real Time Spectrum Analyzers Featuring Spike’s New EMC Precompliance Tools
Frequency Scan Display & Spur TablesA common main tool for EMC Precompliance is a full frequency and lag-magnitude electric field voltage plot generated with the configuration information from the Range Table. The Frequency Scan Display includes all Range Table configurations, limit lines, and also displays markers that identify each spur across the entire
display. The pass or fail indicator in a Frequency Scan Display is controlled by the limit line settings. Each EMC Compliance standard requires a specific configuration of a frequency scan display including military and aerospace standards. As intermittent signals may be of concern, a normal frequency sweep or Max Hold sweep can be set for this display.
CISPR 16-1-1 BW, RBW, & FREQUENCY RANGE
BAND FREQ. RNG. BW (6dB) RBW
A 9-150 kHz 100 - 300 Hz 200 Hz
Band 0.15 - 30 MHz 8 - 10 kHz 9 kHz
C + D 30 - 1000 MHz 100 - 500 kHz 120 kHz
E 1 - 18 GHz 300 - 2000 kHz 1 MHz
ANSI C63.2 BWS & FREQUENCIES FOR PEAK, AVERAGE, & RMS DETECTORS
FREQUENCY BANDWIDTH
10 Hz - 20 kHz 10, 100 and 1000 Hz
10 kHz - 150 kHz 1 and 10 kHz
150 kHz - 30 MHz 1 and 10 kHz
30 MHz - 1 GHz 10 and 100 kHz
1 kHz - 40 GHz 0.1, 1.0 and 10 MHz
MIL-STD-461E FREQUENCY RANGE & BANDWIDTHS
FREQUENCY BANDWIDTH
30 Hz - 1 kHz 10 Hz
1 kHz - 10 kHz 100 Hz
10 kHz - 100 kHz 1 kHz
150 kHz - 30 MHz 10 kHz
30 MHz - 1 GHz 100 kHz
1 GHz + 1 MHz

6 // Frequency Scan Display & Spur Tables
EMC Precompliance Concepts with Real Time Spectrum Analyzers Featuring Spike’s New EMC Precompliance Tools // SignalHound.com
Some EMC test software, such as Spike, enables automatic Spur Table Generation, for ease of identifying, tracking, and analyzing spurs in the Frequency Scan Display.The spurs identified using the Range Table spur identification configuration settings will be marked and the spur information will be entered into a Spur Table including a peak identification number, the range the peak occurred in based on the range table, frequency, and amplitude. In Spike, if
a spur violates a limit line, it will be denoted with a red trace color. The Spur Table can be exported and the sweep information can be used to analyze a device design for development or quality assurance purposes. Also, Spike enables a spur to be selected for a Bar Meter Plot measurement by simply selecting the “spur to meter” option.
Figure 5: In an EMC Compliance frequency sweep display, the limit lines are used to dictate a pass or fail criteria based on any spurs surpassing a limit line power level.
Figure 6: A spur table marks the frequency and amplitude of each spur in an EMC frequency sweep display, as well as the minimum to maximum peak order and the range table number in the sweep in which the spur is contained.
Bar Meter Plots & Quasi-Peak Detector Measurements // 7
SignalHound.com // EMC Precompliance Concepts with Real Time Spectrum Analyzers Featuring Spike’s New EMC Precompliance Tools
Though largely beneficial in EMC Precompliance testing, these same features could be used for Interference Hunting and Security applications when there are many frequency ranges of interest and set monitoring criteria. Other features of a real-time spectrum analyzer (RTSA) can be used to further analyze a signal’s behavior once a suspicious signal is discovered and identified.
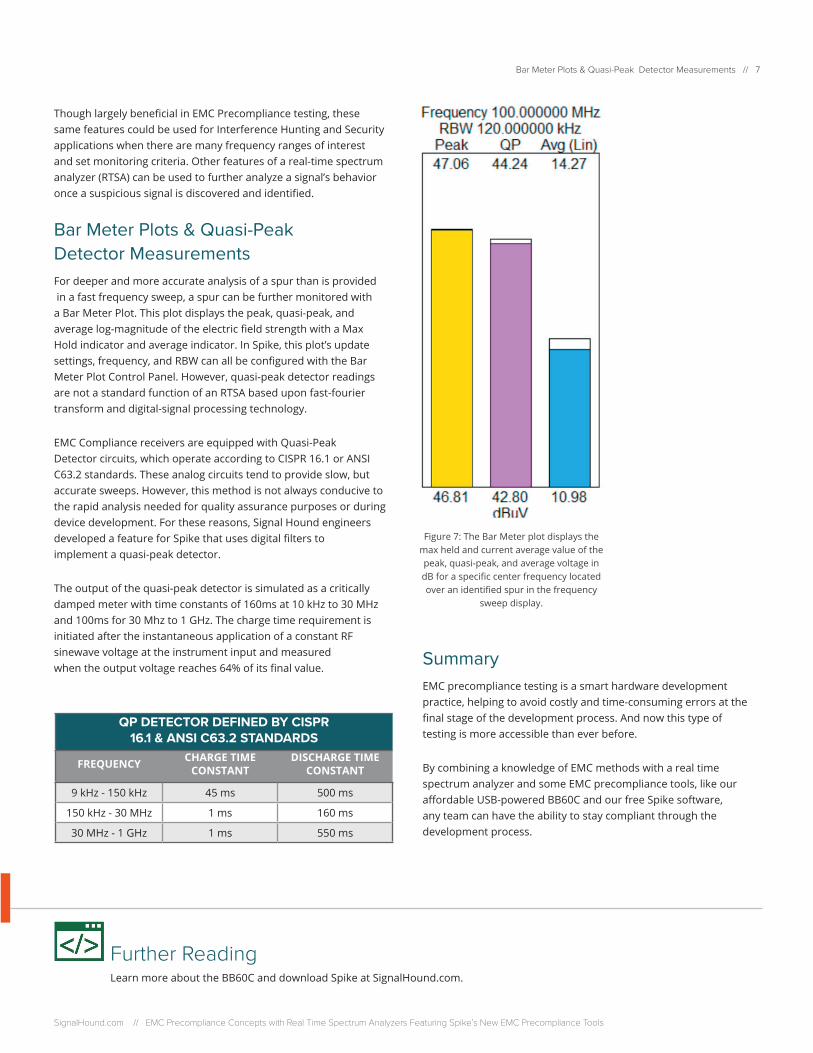
Bar Meter Plots & Quasi-Peak Detector MeasurementsFor deeper and more accurate analysis of a spur than is provided in a fast frequency sweep, a spur can be further monitored with a Bar Meter Plot. This plot displays the peak, quasi-peak, and average log-magnitude of the electric field strength with a Max Hold indicator and average indicator. In Spike, this plot’s update settings, frequency, and RBW can all be configured with the Bar Meter Plot Control Panel. However, quasi-peak detector readings are not a standard function of an RTSA based upon fast-fourier transform and digital-signal processing technology.
EMC Compliance receivers are equipped with Quasi-Peak Detector circuits, which operate according to CISPR 16.1 or ANSI C63.2 standards. These analog circuits tend to provide slow, but accurate sweeps. However, this method is not always conducive to the rapid analysis needed for quality assurance purposes or during device development. For these reasons, Signal Hound engineers developed a feature for Spike that uses digital filters to implement a quasi-peak detector.
The output of the quasi-peak detector is simulated as a critically damped meter with time constants of 160ms at 10 kHz to 30 MHz and 100ms for 30 Mhz to 1 GHz. The charge time requirement is initiated after the instantaneous application of a constant RF sinewave voltage at the instrument input and measured when the output voltage reaches 64% of its final value.
SummaryEMC precompliance testing is a smart hardware development practice, helping to avoid costly and time-consuming errors at the final stage of the development process. And now this type of testing is more accessible than ever before.
By combining a knowledge of EMC methods with a real time spectrum analyzer and some EMC precompliance tools, like our affordable USB-powered BB60C and our free Spike software, any team can have the ability to stay compliant through the development process.
Figure 7: The Bar Meter plot displays the max held and current average value of the peak, quasi-peak, and average voltage in dB for a specific center frequency located over an identified spur in the frequency
sweep display.
QP DETECTOR DEFINED BY CISPR 16.1 & ANSI C63.2 STANDARDS
FREQUENCY CHARGE TIME CONSTANT
DISCHARGE TIME CONSTANT
9 kHz - 150 kHz 45 ms 500 ms
150 kHz - 30 MHz 1 ms 160 ms
30 MHz - 1 GHz 1 ms 550 ms
Further ReadingLearn more about the BB60C and download Spike at SignalHound.com.

1502 SE COMMERCE AVE, STE 101 // BATTLE GROUND, WA 98604 // (360) 313-7997 // SIGNALHOUND.COM // ©2021 ALL RIGHTS RESERVED.
About Signal Hound
Signal Hound designs and builds powerful, affordable spectrum analyzers and signal generators for engineers and RF
professionals around the globe. Whether you’re needing EMC precompliance capabilities in a small two-person shop or
spectrum monitoring on a national scale, our test equipment is designed with you in mind. Accurate and powerful enough
for mission-critical RF analysis, priced at a point accessible to most, and supported by a talented group of engineers
committed to what they do – we truly believe that our devices offer unrivaled value in the test equipment industry.
In business since 1996 and selling our own line of Signal Hound test equipment since 2010, we’ve built the foundation
of our company on years of test equipment repair, service, hardware and software development, and manufacturing
experience. Signal Hound is a small company with big goals – and an even bigger commitment to providing our
customers with an outstanding experience when purchasing and using our products.