Embracing the Institution of Marriage: The Characteristics ...
30
Embracing the Institution of Marriage: The Characteristics of Remarried Americans Diana B. Elliott, U.S. Census Bureau Jamie M. Lewis, University of North Carolina at Chapel Hill PAA Annual Meeting Dallas, TX April 17, 2010 DRAFT: Do not distribute or cite without permission from the authors.
Transcript of Embracing the Institution of Marriage: The Characteristics ...

Embracing the Institution of Marriage: The Characteristics of Remarried Americans
Diana B. Elliott, U.S. Census Bureau Jamie M. Lewis, University of North Carolina at Chapel Hill
PAA Annual Meeting Dallas, TX
April 17, 2010
DRAFT: Do not distribute or cite without permission from the authors.

1
Introduction
It has been suggested that marriage in the U.S. has become deinstitutionalized (Cherlin
2004), as a consequence of its diminished status in American society. In the past, marriage was a
commonplace, even required, stage of the life course and a marker of the transition to adulthood.
Today, it is a less obligatory institution (Thornton and Young-DeMarco 2001), and some openly
question the decision to marry. Those who do choose to marry do so at a later age than in the
recent past. Between 1960 and 2005, the estimated median age at first marriage increased from
23 to 27 for men, and from 20 to 25 for women (U.S. Census Bureau 2006).
Furthermore, those forming relationships and families today have other “socially
sanctioned” options in addition to marriage, including cohabitation and childbearing outside of
marriage (Cherlin 2004). Among those marrying between 1965 and 1974, about 11% of
marriages were preceded by cohabitation (Bumpass and Sweet 1989), in contrast to 56% of
marriages between 1990 and 1994 being preceded by cohabitation (Bumpass and Lu 2000).
Thus, cohabitation is increasingly accepted as an alternative to or trial for marriage (Wu 2000),
and has consequently become more institutionalized (Cherlin 2004). Marriage is also no longer
seen as a necessary precursor for having children. Americans are increasingly having children
outside of the institution of marriage, as nonmarital childbearing has increased from about 5% of
all American births in 1960 (Ventura and Bachrach 2000) to 40% in 2007 (Hamilton et al. 2009).
Demographic scholars interpret the deinstitutionalization of marriage and associated
changes in the family in different ways. Some believe that a decline in the importance of the
family has occurred through the loss of several social functions and its decreased influence on
individuals’ behavior and attitudes (Popenoe 1988, 1993; Wilson 2002). Others maintain that the
family is resilient, though changed, and that numerous family forms are valid and effective

2
(Coontz 1997, 2000; Goode 1970). In an attempt to better understand the meaning of marriage
today and the factors that have lead to the deinstitutionalization of marriage, researchers have
begun to explore why Americans today continue to marry. By extension, this paper explores the
factors that impel people to remarry. That is, within the context of deinstitutionalized marriage,
which people choose to remarry? Are they more similar to or different from those marrying for
the first time? Who remarries compared to those who cohabit or stay single following the end of
a first marriage?
Existing evidence suggests that remarriage, compared with first marriage, is an
incomplete institution. Remarriage lacks many of the norms that guide behavior in first
marriages; expectations for dealing with partners’ children are much less clear (Cherlin 1978).
Other problems these families encounter include the incorporation of new kin and quasi-kin into
the nuclear and extended family (Cherlin 1978), the lack of consistent or appropriate terms for
these kin (Ganong and Coleman 2004; Koenig Kellis, LeClair-Underberg, and Normand 2008),
ill-defined roles for these new relationships (Boss 1987), and boundary ambiguity, or uncertainty
about who is a member of the family system (Boss and Greenberg 1984; Stewart 2005). Indeed,
those in the same stepfamily may even disagree on definitions of family (Berger 1998; Smart et
al. 2001). Legal provisions are also ambiguous in the treatment of remarried families, doing
little to aid such families in negotiating rights, responsibilities, and resources between family
members (especially between stepparents and stepchildren) (Cherlin 1978).
In addition to the difficulties it creates, the incomplete institutionalization of remarriage
may lead to fewer rewards, increased risks, and more negative outcomes for remarried families.
The lack of clarity in family membership and roles following remarriage may heighten
dissatisfaction, misunderstandings, and resentment among family members (Fine and Kurdek,

3
1994). These, in turn, can contribute to family stress, depression, and inadequate family
functioning (Boss 1980; Boss et al. 1990; Burns 1987, Madden-Derdich, Leonard, and
Christopher 1999). This mechanism helps explain why the risk of divorce is higher for
remarriages compared with first marriage (Booth and Edwards 1992; Bramlett and Mosher
2002), and why wives report lower levels of relationship quality and union stability as family
ambiguity increases (Stewart 2005).
Given the difficulties associated with remarriage in many circumstances, and the
deinstitutionalization of marriage in general, we might expect remarriage to be an unattractive
option for Americans today. However, many Americans continue to remarry, and may even
remarry multiple times. Cherlin has suggested that American culture generally places such a
high value on marriage that it is viewed more positively in the United States relative to other
Western countries (2009). But, is remarriage an alternative for all or just some? As with first
marriages, there are likely social forces at work that affect the ways Americans view remarriage
as well. Using new marital history questions from the 2008 American Community Survey
(ACS), this paper will explore three possible explanations for variations in who remarries in
America: cohort effects; variations in social and demographic characteristics such as education,
income, race, and ethnicity; and geographic variations promoting a “culture” of marriage.
Theoretical Explanations for Remarriage
Cohort effect
Attitudes toward marriage and divorce have changed over time, such that different birth
cohorts have experienced varying “cultures” of marriage. Members of elder cohorts tend to
show greater endorsement of traditional family structures (Pagnini and Rindfuss 1993), in part
because they were socialized and/or first married prior to the dramatic changes that occurred in

4
family attitudes and behavior in the latter part of the 20th century. Those raised during the Great
Depression may have been particularly interested in starting their families early and having large
families because of their childhood experiences and their subsequent experiences following
World War II (Elder 1999). Those in elder cohorts who divorced may have been more inclined
to remarry than those of younger cohorts due to more traditional norms and expectations
regarding marriage.1
In contrast, those in subsequent cohorts, such as the baby boomers and more recent
cohorts (Generations X, Y, and the oldest of the Millenials) may place less emphasis on family
life than older cohorts (Coltrane 2001). Following the post-World War II upsurge in marriage
and childbearing, there were marked declines in marriage and fertility rates (Cherlin 1992; Fitch
and Ruggles 2000; Haines 1996). This has occurred, in part, because younger individuals now
spend more time in early adulthood pursuing education and careers, simultaneously detracting
from their investment in marital relationships and offering alternative routes to life fulfillment.
In addition, shifts in societal attitudes in recent decades may also contribute to those in younger
cohorts having less attachment to marriage. Societal attitudes now express a greater tolerance
about a variety of family conduct and family forms (Thornton and Young-DeMarco 2001).
Marriage is now less pivotal than it was in the past in the regulation of personal identities,
transitions to adulthood, romantic relationships, household composition, and the bearing and
raising of children (Axinn and Thornton 2000), and those who feel marriage is unnecessary for a
1 It is important to note that the cohort effect proposed here could be confounded with an age effect. In either case, we would expect older adults to be more likely to remarry than younger adults. However, the logic behind this pattern differs for the two effects. A cohort effect would occur if elder individuals are more likely to remarry due to the influence of more traditional family values and patterns they encountered in their youth. An age effect would operate if older individuals are more likely to remarry simply because they have completed a greater portion of their lifespan and were thus exposed to a greater risk of divorce and, consequently, remarriage.
5
satisfactory life now outnumber those who believe it is key to life satisfaction (Kaufman and
Goldscheider 2007).
Historical data collected about attitudes toward marriage and divorce find that there were
particularly important transitional periods. This suggests the benefit of studying cohort effects
and the propensity to remarry. For example, in the period from 1957 to 1976, marriage attitudes
altered markedly, so that fewer Americans expressed negative feelings toward remaining single
and there was a pronounced rise in those who viewed marriage in a negative light and had
concerns about the restrictiveness of marriage (Veroff, Douvan, and Kulka 1981). During the
1960s and 1970s, the divorce rate markedly increased as the legal restrictions on divorce
loosened (Cherlin 1992; Cherlin 2009) and Americans became more approving of divorce
(Thornton and Young-DeMarco 2001), but these shifts slowed in the 1980s and 1990s (Casper
and Bianchi 2002). Despite this slowing in change, acceptance of divorce remains at fairly high
levels. About one fifth of adults believe that divorce is never justified (Inglehart 1997), and
approximately four fifths of youth think divorce is acceptable even if children are present in the
family (Thornton and Young-DeMarco 2001). Even among conservative religious groups in the
United States, divorce is not a desired outcome, but it is a tolerated life status (Cherlin 2009).
In this paper, we theorize that pre-boomers will be more likely to remarry compared with
the baby boomers, and especially compared with more recent cohorts including Generations X,
Y, and the Millennials. Given the difficulties in untangling age, period, and cohort effects, we
will approach the analyses by using age groups, broken into their respective cohort designations,
to approximate an understanding of cohort differences.

6
Social Characteristics
Marriage once served as the bedrock of an adult life, and young adults frequently married
before accomplishing things in other realms. Today, however, marriage now serves as more of a
capstone or crowning achievement, symbolizing prestige and marking personal success (Cherlin
2004). Many young adults today see marriage as a status that one builds up to, often benefiting
from a trial period (i.e., cohabitation) beforehand (Popenoe and Whitehead 2009). The list of
items that they wish to accomplish prior to marriage has lengthened considerably, and financial
stability is particularly important (Edin and Kefalas 2005; Smock, Manning, and Porter 2005).
Even the wedding ceremony itself has risen in prominence, serving as a marker of the couple’s
success (Bulcroft, Bulcroft, Bradley, and Simpson 2000; Cherlin 2004). Accordingly, many
young couples today believe their wedding merits a large celebration, and that a small ceremony
is less appropriate (Smock 2004; Smock, Manning, and Porter 2005).
Due to this shifting view of marriage, those who are better off and have demonstrably
advanced in other areas are more likely to marry and often have better marriage prospects than
others. Since the 1970s, marital rates have diverged according to women’s education (Raley and
Bumpass 2003). While two-parent married couple families are enduringly common among
couples with high levels of educational attainment, they are ever more infrequent among those
with less education (McLanahan 2004). Similarly, higher income is predictive of marriage. This
is now the case for both women and men, likely because both men and women seek marriage
partners with higher earning potential (Sweeney 2002). In contrast, though marriage continues
to be a valued and ideal state for the poor and near poor (Sanchez et al. 2002), for many of them
it remains out of reach (Edin and Kefalas 2005; Edin 2000). Women from lower income classes
have difficulty forming fiscally advantageous marriages, as they have difficulty attracting the
7
most marriageable men, likely because men with higher incomes also seek partners who have
better economic prospects (Oppenheimer, Kalmijn, and Lim 1997; Wilson 1987). In contrast,
individuals who have achieved success in other realms of life are not only more likely to marry;
they are also less likely to divorce. When women have higher incomes, the quality of their
marriages, as well as the advantages to remaining married, are enhanced (Rogers and DeBoer
2001; Sayer and Bianchi 2000; Schoen et al. 2002).
In addition to economic class differences, a social characteristic related to marriage
formation is race/ethnicity. Though marriage rates have fallen across various groups, the decline
has been dramatic for some. The downturn in marriage has been particularly pronounced among
African Americans when compared with Whites (Fitch and Ruggles 2000; Koball 1998).
Current research investigating the relationship between social characteristics and
marriage focuses primarily on first marriages or all marriages. To date, few studies have
examined whether the same attributes predict remarriage. It is possible that the very attributes
that are desirable in a first spouse—higher earnings and education—are also sought when
considering remarriage. If this is the case, we anticipate finding in this paper that remarriage is
higher for those with more education and income. However, we may also find that those with
more education and income are less represented among the remarried because of their greater
marital stability. Similarly, we may also find in this paper that just as African Americans,
relative to Whites, have lower rates of first marriage, they may also be less likely to remarry.
Geographic Variation
Cultural values regarding marriage and divorce vary geographically, as do the legal
mandates regulating union formation and dissolution. Family legislation fluctuates widely
among states because under the U.S. Constitution, marriage and divorce are regulated by the

8
states (Hawkins et al. 2002). In general, social policy and cultural norms are closely related to
one another. Rather than occur within a social vacuum, constituents’ actions and beliefs both
shape and are shaped by laws and judicial decisions (Brotherson and Teichert 2001; Brotherson
and Duncan 2004).
In recent years, a marriage movement, aiming to bolster marriage, has developed, taking
root particularly at the state level. Hawkins et al. (2002) suggest that this movement developed as
a result of the mixture of high divorce rates and enduring support of marriage as an institution.
In several cases, the marriage movement has prompted state policies aimed at promoting
marriage. Indeed, there is evidence that such policies occur in the context of a strong marriage
culture.2 Brotherson and Duncan (2004) assert that endorsement of government acts to fortify
marriage requires crucial cultural assumptions, including that 1) the institution of marriage
provides indispensable benefits to adults, children, and society; and 2) these benefits cannot be
duplicated through legislative provisions or social programs.
Marriage promotion policies are least common in the Northeast region of the United
States. Rather than respond to the marriage movement, policy in this part of the nation has
continued in the tradition of family legislation that was dominant for most of the 20th century.
Under this tradition, the goal of marriage and family policy is the maintenance of family privacy
and the defense of households against superfluous state interference (McIntyre 1995).
In contrast, southern states have reacted most strongly to the marriage movement,
enacting a variety of marriage promotion policies. Louisiana was the first state, in 1997, to
authorize covenant marriage (Sanchez et al. 2002), and Arkansas followed in 2001 (Hawkins et
2 It is possible that some states enacted marriage promotion legislation not out of a desire to increase marriage, but in response to high divorce rates. However, the motivation to arrest the prevalence of divorce still entails the presumption that marriage and two-parent families are preferable over divorce and single parenthood. Thus, policies aimed at thwarting divorce also are indicative of a pro-marriage culture.
9
al. 2002). Compared with conventional marriage, covenant marriage places stricter standards on
entry into and exit from marriage. Prior to marrying, couples must participate in counseling and
sign an affidavit recognizing marriage as a lifetime commitment. Covenant couples must
undergo marital counseling before divorce, and divorce is much more difficult to attain. Several
Southern states that have not enacted covenant marriage do have various marital counseling
and/or education programs in place, including Alabama, Florida, Maryland, Mississippi,
Oklahoma, Tennessee, Texas, and South Carolina.
Marriage promotion in many states, but particularly in the South, is also tied to the
Temporary Assistance for Needy Family (TANF) program. Some TANF programs were
designed such that married couples may receive more money per month or may have the income
of a new spouse disregarded with respect to their monthly payment to encourage marriage
(Hawkins et al. 2002; Gardiner et al. 2002). The Southern states of Arkansas, Louisiana, and
North Carolina have also all issued proclamations affirming the importance of marriage to
society (Gardiner et al. 2002).
In addition to increasing regulations regarding marriage formation, legislation in many
Southern states reflects a more restrictive attitude regarding divorce. While nearly all states
enacted no-fault divorce legislation in the 1970s and early 1980s, Arkansas became the final
state, in 1991, to authorize no-fault divorce (Martin and Parashar 2006). In Oklahoma and
Tennessee, the waiting period before divorce is extended for couples with children, and in
Florida, Tennessee, and Virginia, divorcing couples with children are required to participate in
divorce education. Georgia has modified no-fault divorce legislation such that no-fault divorce is
permitted only in cases where no children are involved and both parties agree to the divorce
(Gardiner et al. 2002).

10
Compared with the South, Western states are less unanimous in their enactment of
marriage promotion policies. Arizona and Utah are two Western states that have been noticeably
influenced by the marriage movement. Arizona was the second state, in 1998, to pass covenant
marriage legislation (Hawkins et al. 2002), and one million dollars in TANF funds have been
committed to fund community-based instruction in marriage and communication skills. Utah
proclaimed marriage to be a public good, and established Marriage Awareness Week. In 2002,
$600,000 of Utah’s TANF funds were allocated to marriage promotion efforts, including
relationship skills training and a website for couples intending to marry (Brotherson and Duncan
2004). In contrast, other Western states like California, Hawaii, Nevada, and Oregon offer no
explicit benefit to couples on TANF who are married (Moffitt et al. 2009).
Marriage promotion initiatives have also been passed in parts of the Midwest, though
they remain less pervasive than in the South. Marital education and/or counseling have been
instituted in Indiana, Minnesota, South Dakota, and Wisconsin. Indeed, premarital counseling is
mandated in Indiana (Gardiner et al. 2002). A few states have allocated TANF money to such
programs, though in smaller amounts compared with other regions. Michigan has committed
$250,000 to a pilot initiative, and Wisconsin has designated $210,000 for use in a community-
based program (Brotherson and Duncan 2004).
Certainly, legislation is not the only indicator of marriage culture in a state, but it may be
the most objective way we have to evaluate the undercurrent of regional attitudes toward
marriage. Overall, the marriage movement has been most effective in impacting policy in the
South, and least embraced by states in the Northeast (with the exception of the same-sex
marriage movement which has been most embraced by the Northeast). Marriage promotion
policies have also been adopted, though on a more limited basis, in the Midwest and West.

11
Using legislation and policy as our indicators, these findings suggest that a strong marriage
culture is active in the South, while the marriage culture in the Northeast may be oriented toward
allowing more personal choice and diversity regarding family life. The strength of the marriage
culture in the West and Midwest is less clearly marked, though it appears to be high in Arizona
and Utah. Thus, in this paper we would expect marriage to be more pervasive in the South
compared with the Northeast and that regions and states that promote marriage may also foster
remarriage as well as first marriage.
Data and Methods
The analyses in this paper use new marital history items that were recently added to the
American Community Survey (ACS) in 2008. Consequently, data are available annually on
marriage, divorce, and widowhood nationally and for states, as well as data about the year
individuals were last married and the number of times they were married. The addition of
marital history variables to the ACS, and particularly the number of times married, allow a never
before realized opportunity to understand remarriage patterns in the United States.
The ACS was fully implemented in 2005 and was designed to replace the collection of
data from the long form decennial census questionnaire that was previously distributed to 1 in 6
households in 2000. Data from the ACS are collected on an annual basis: the Census Bureau
mails out a quarter-million ACS questionnaires every month to a nationwide sample, and follows
up through phone and in-person interviews, ultimately collecting data from an unweighted
sample ranging from 1.9 to 2.0 million households in the U.S. annually. This sample is then
weighted to be representative of the nation’s population as a whole. The ACS is notable for its
ability to examine annual data for small geographies and consequently is well suited for
analyzing geographic differences (such as state level and regional variations as this paper does).

12
Additional information about the ACS, its methodology, and data products can be found at
http://www.census.gov/acs/www.
In this paper, we have restricted our analyses to those individuals age 15 and older who
have ever been married in order to compare the patterns of those who have remarried to those
who have only been married once. Overall, 167,048,362 Americans age 15 and over (weighted)
have ever been married and among that number, 24% have been married more than one time.3
Specifically, we explore the reasons why Americans form multiple unions in an era where
marriage is becoming “deinstitutionalized” (Cherlin 2004) by examining cohort differences,
socio-demographic differences such as education, income, and race/ethnicity, and geographic
differences. This study uses two dependent variables of interest in descriptive as well as
multinomial logistic regression analyses. First, we investigate differences among those 15 and
older who report marrying once compared to those who marry two or three or more times. Then,
we explore differences among individuals age 20 and older who had a first marriage that resulted
in a remarriage, cohabitation with an unmarried partner, or separation or divorce as reported at
the time of survey.4 The coding of the independent variables used in the multinomial logistic
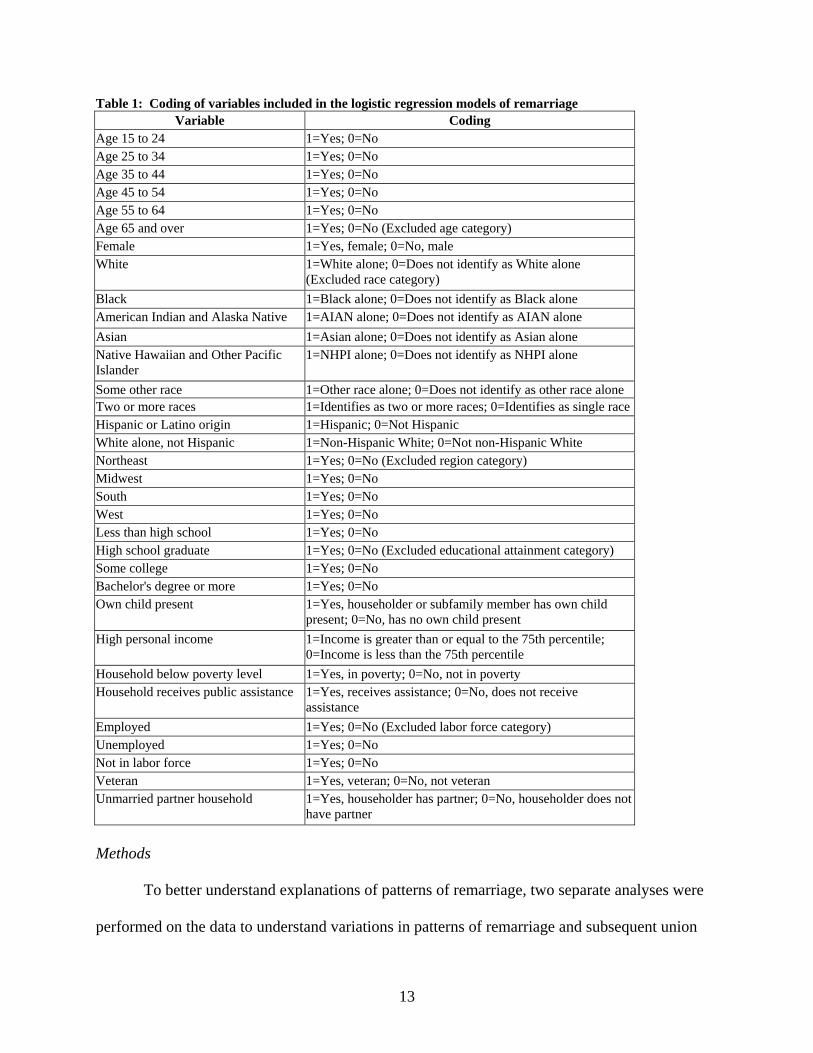
regression models in this paper are listed in Table 1, and these variables are anticipated to relate
to an individual’s likelihood of remarriage.
3 2008 ACS estimates of those married more than one time are from table B12505 on American Fact Finder, http://factfinder.census.gov/servlet/DatasetMainPageServlet?_program=ACS&_submenuId=&_lang=en&_ts=. 4 The analyses of remarriage, cohabitation, or divorce are performed on the population age 20 and older who were married once previously, are either remarried, living with an unmarried partner, or are separated or divorced and are householders or the householders’ unmarried partners or spouses. The sample is restricted by age because editing procedures in the ACS do not allow anyone under the age of 20 to report being married twice. The sample is further restricted to householders and householders’ unmarried partners or spouses because the ACS questionnaire does not determine the presence of unmarried partners for those living in subfamilies and does not ask the relationship to householder question for those living in group quarters housing. However, only 2.4% of all individuals with a first marriage that ended were members of subfamilies. Also, remarried individuals may have had a first marriage that ended through widowhood, but we are unable to detect this with the ACS data. Because widowhood is a less common end to marriage than separation or divorce, the small population of the previously widowed is not likely to affect our conclusions about the remarried.
13
Table 1: Coding of variables included in the logistic regression models of remarriage Variable Coding
Age 15 to 24 1=Yes; 0=No Age 25 to 34 1=Yes; 0=No Age 35 to 44 1=Yes; 0=No Age 45 to 54 1=Yes; 0=No Age 55 to 64 1=Yes; 0=No Age 65 and over 1=Yes; 0=No (Excluded age category) Female 1=Yes, female; 0=No, male White 1=White alone; 0=Does not identify as White alone
(Excluded race category)
Black 1=Black alone; 0=Does not identify as Black alone American Indian and Alaska Native 1=AIAN alone; 0=Does not identify as AIAN alone
Asian 1=Asian alone; 0=Does not identify as Asian alone Native Hawaiian and Other Pacific Islander
1=NHPI alone; 0=Does not identify as NHPI alone
Some other race 1=Other race alone; 0=Does not identify as other race alone Two or more races 1=Identifies as two or more races; 0=Identifies as single race Hispanic or Latino origin 1=Hispanic; 0=Not Hispanic White alone, not Hispanic 1=Non-Hispanic White; 0=Not non-Hispanic White Northeast 1=Yes; 0=No (Excluded region category) Midwest 1=Yes; 0=No South 1=Yes; 0=No West 1=Yes; 0=No Less than high school 1=Yes; 0=No High school graduate 1=Yes; 0=No (Excluded educational attainment category) Some college 1=Yes; 0=No Bachelor's degree or more 1=Yes; 0=No Own child present 1=Yes, householder or subfamily member has own child
present; 0=No, has no own child present
High personal income 1=Income is greater than or equal to the 75th percentile; 0=Income is less than the 75th percentile
Household below poverty level 1=Yes, in poverty; 0=No, not in poverty Household receives public assistance 1=Yes, receives assistance; 0=No, does not receive
assistance
Employed 1=Yes; 0=No (Excluded labor force category) Unemployed 1=Yes; 0=No Not in labor force 1=Yes; 0=No Veteran 1=Yes, veteran; 0=No, not veteran Unmarried partner household 1=Yes, householder has partner; 0=No, householder does not
have partner
Methods To better understand explanations of patterns of remarriage, two separate analyses were
performed on the data to understand variations in patterns of remarriage and subsequent union
14
formation. To understand variation in the number of times individuals marry, a descriptive
bivariate comparison table was run to show variations in the characteristics among individuals
married once, twice, and three or more times (Table 2). A subsequent multinomial logistic
regression model was then run to understand if individuals age 25 and older5 with particular
characteristics (cohort, class and race/ethnicity variations, geographic location) were more likely
to be married once, twice, or three or more times (Table 3).6 Then, descriptive analyses were run
for individuals living in households who were age 20 and older and had been married previously,
but the marriage had ended and culminated in remarriage, cohabitation with an unmarried
partner, or separation or divorce (Table 4). Finally, a multinomial logistic regression model was
also performed to understand who was likeliest to be living with an unmarried partner or to be
divorced or separated and not in a union compared to those who had remarried (Table 5). This
paper adds to the literature by examining with the most representative and large-scale data ever
collected on marital history patterns which Americans are likeliest to remarry and whether
theorized explanations for such variations matter.
Findings
WHO ARE REMARRIED AMERICANS?
Table 2 shows the descriptive characteristics of Americans married once, twice, and three
or more times.
5 The sample in this model was restricted to individuals age 25 and older because editing procedures do not allow those under the age of 25 to be married three or more times. 6 An ordinal logistic regression model was also run for the number of times married outcome variable, but results from a score test suggested that a multinomial logistic regression model was more appropriate for this variable.

15
Table 2: Demographic Characteristics of Ever Married People 15 or Over by Times Married: ACS 2008 (Population 15 and older who were ever married; Weighted; n=167,048,362)
Times Married Total Ever Married Once Twice Three or More
167,048,362 126,198,264 32,310,448 8,539,650 Demographic Characteristics % SE/1 % SE/1 % SE/1 % SE/1
100.0 - 100.0 - 100.0 - 100.0 -
Age
15 to 24 years 2.1 0.01 2.7 0.02 0.3 0.01 - -
25 to 34 years 13.5 0.03 16.2 0.03 6.1 0.05 1.9 0.05
35 to 44 years 20.5 0.03 21.6 0.04 18.7 0.07 11.9 0.11
45 to 54 years 23.1 0.03 21.6 0.04 27.8 0.08 27.9 0.15
55 to 64 years 18.6 0.03 16.2 0.03 24.4 0.07 31.8 0.15
65 years and over 22.2 0.03 21.7 0.03 22.7 0.07 26.4 0.14
Sex
Male 46.4 0.04 46.3 0.04 46.7 0.08 47.0 0.16
Female 53.6 0.04 53.7 0.04 53.3 0.08 53.0 0.16
Race and Hispanic Origin
One race 98.7 0.01 98.8 0.01 98.6 0.02 98.3 0.04
White 80.3 0.03 79.0 0.04 83.5 0.07 88.1 0.11
Black or African-American 9.1 0.02 9.2 0.03 9.4 0.05 6.8 0.09
American Indian and Alaska Native 0.7 0.01 0.6 0.01 0.7 0.01 1.0 0.03
Asian 4.6 0.02 5.5 0.02 2.3 0.03 1.0 0.03
Native Hawaiian and Other Pacific Islander 0.1 0.00 0.1 0.00 0.1 0.01 0.1 0.01
Some other race 3.8 0.02 4.3 0.02 2.5 0.03 1.3 0.04
Two or more races 1.3 0.01 1.2 0.01 1.4 0.02 1.7 0.04
Hispanic or Latino origin (of any race) 12.2 0.03 13.5 0.03 9.1 0.05 5.6 0.08
White alone, not Hispanic or Latino 72.4 0.04 70.4 0.04 77.4 0.08 84.2 0.12
Region
Northeast 17.8 0.03 19.2 0.03 14.6 0.06 8.5 0.09
Midwest 22.2 0.03 22.4 0.03 21.7 0.07 21.4 0.12
South 37.4 0.04 35.8 0.04 41.4 0.08 46.9 0.16
West 22.6 0.03 22.6 0.04 22.4 0.07 23.3 0.14
Educational Attainment
Less than high school 14.8 0.03 15.0 0.03 13.7 0.06 15.7 0.12
High school graduate 28.8 0.03 27.9 0.04 31.0 0.08 33.0 0.15
Some college 29.1 0.03 27.8 0.04 32.9 0.08 34.8 0.15
Bachelor's degree or more 27.3 0.03 29.3 0.04 22.4 0.07 16.5 0.12
Own Child under 18 in Household 33.7 0.04 36.1 0.04 28.2 0.08 18.3 0.13
Economic Well-Being
High Personal Income 31.0 0.03 31.1 0.04 31.8 0.08 27.3 0.14
Household Below Poverty Level (n=164,033,354 living in households) 8.2 0.02 8.2 0.03 8.0 0.05 9.4 0.10
Household Receives Public Assistance (n=164,033,354 living in households) 2.0 0.01 2.0 0.01 2.1 0.03 2.5 0.05
Labor Force Status

16
Employed 62.2 0.04 62.8 0.04 61.6 0.08 55.2 0.16
Unemployed 2.8 0.01 2.7 0.02 2.9 0.03 3.1 0.06
Not in Labor Force 35.0 0.04 34.5 0.04 35.5 0.08 41.7 0.16
Veteran ( Includes those in military) 12.6 0.02 11.1 0.03 16.4 0.06 21.2 0.13
Unmarried Partner Households 1.5 0.01 1.4 0.01 1.6 0.02 1.8 0.13
- Represents or rounds to zero.
Source: U.S. Census Bureau, American Community Survey, 2008
1/ Standard errors were computed using the Taylor Expansion method.
Table 2 shows descriptive differences among those married once compared to those
married two or three or more times. With respect to cohort differences, proportionately, the
highest percentage married three or more times are baby boomers age 55 to 64 (31.8 percent).
Those age 65 and older constitute only 26.4 percent of those married three or more times. This
may reflect generational differences among those most affected by the social upheaval during the
1960s and 1970s that produced increases in the divorce rate (Cherlin 2009).
The socio-demographic characteristics described in Table 2 reveal variations. White
individuals are likely to remarry (constituting 88.1 percent of those married three or more times,
and 83.5 percent of the population married two times, compared with 79.0 percent of the
population married once). This is particularly the case when the White alone, not Hispanic or
Latino population is examined: although constituting 70.4 percent of the population married
once, White alone, non-Hispanic individuals comprise 77.4 percent of the population married
two times, and 84.2 percent of the population married three or more times. Those with a
bachelor’s degree are 29.3 percent of those married once, but 22.4 percent of those married twice
and 16.5 percent of those married three or more times. Finally, veterans constitute 11.1 percent
of those married once, while representing 16.4 percent of those married twice, and 21.2 percent
of those married three or more times (Table 2).
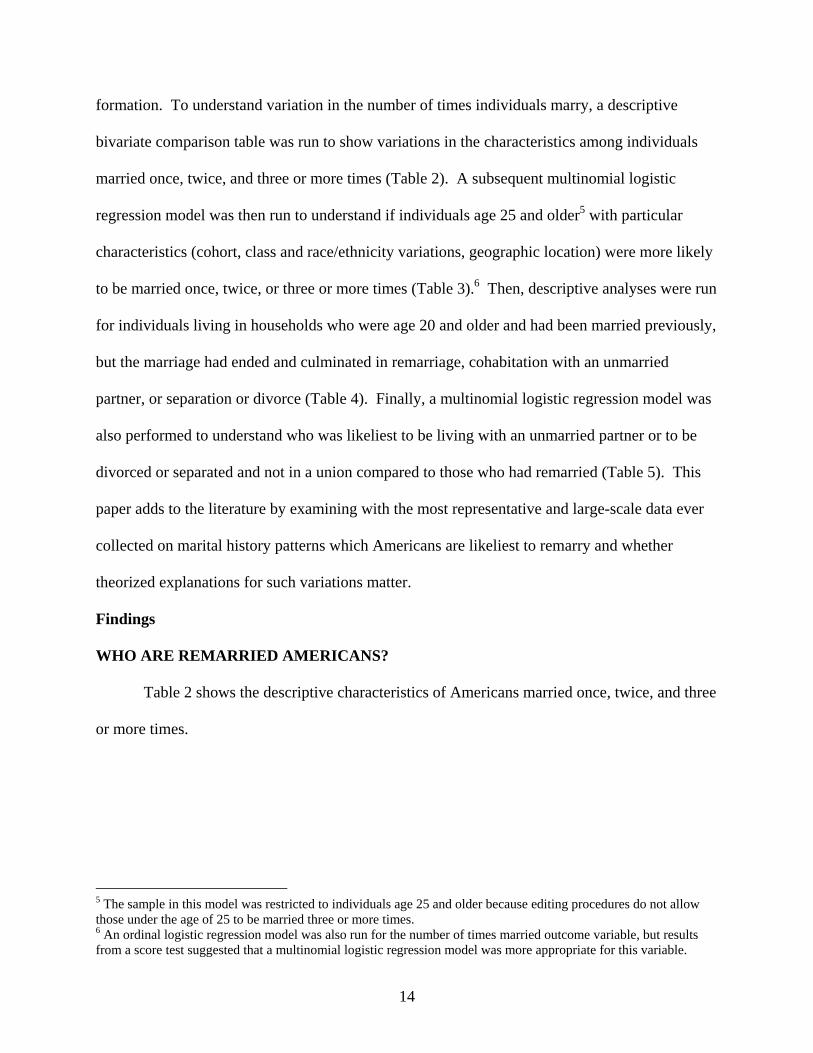
Looking at regional differences in Table 2, it is notable that the percent remarried in the
Northeast is low, while high in the South. Individuals in the Northeast represent 19.2 percent of
17
those married once, but, 14.6 percent of those married twice, and 8.5 percent of those married
three or more times. Those in the South represent 35.8 percent of those married once, but 41.4
percent of those married twice, and 46.9 percent of those married three or more times. These
descriptive characteristics present some evidence fitting with the hypothesis that the culture of
marriage may be higher in the South relative to the Northeast.
Table 3 presents the results from the multinomial logistic regression, where the likelihood
of being married twice and three or more times is tested against being married only once.
Table 3: Logistic Regression Predicting Likelihood of being married one, two, or three or more times: ACS 2008 (Population 25 and older who were married at least once and living in households; Weighted; n=160,589,635)
Married two times compared to one
Married three or more times compared to one
Estimate SE/1Odds Ratio Estimate SE/1
Odds Ratio
Age (excluded category is 65 and older)
25 to 34 years -0.9903 *** 0.011 0.371 -2.1076 *** 0.031 0.122
35 to 44 years -0.1426 *** 0.008 0.867 -0.4771 *** 0.017 0.621
45 to 54 years 0.2296 *** 0.007 1.258 0.2724 *** 0.012 1.313
55 to 64 years 0.3718 *** 0.006 1.45 0.5866 *** 0.01 1.798
Female 0.1075 *** 0.005 1.113 0.1381 *** 0.008 1.148
Race and Hispanic Origin
One race (excluded category is White)
Black or African-American 0.1167 *** 0.029 1.124 -0.1819 ** 0.059 0.834
American Indian and Alaska Native 0.2779 *** 0.034 1.32 0.6396 *** 0.062 1.896
Asian -0.5798 *** 0.031 0.56 -1.2208 *** 0.066 0.295
Native Hawaiian and Other Pacific Islander -0.1394 + 0.073 0.87 -0.4703 ** 0.159 0.625
Some other race -0.1361 *** 0.016 0.873 -0.2843 *** 0.039 0.753
Two or more races 0.398 *** 0.028 1.489 0.777 *** 0.055 2.175
Hispanic or Latino origin (of any race) -0.1197 *** 0.027 0.887 -0.5046 *** 0.054 0.604
White alone, not Hispanic or Latino 0.2849 *** 0.028 1.33 0.4954 *** 0.057 1.641
Region (excluded category is Northeast)
Midwest 0.221 *** 0.006 1.247 0.7113 *** 0.013 2.037
South 0.4763 *** 0.006 1.61 1.1679 *** 0.012 3.215
West 0.4028 *** 0.007 1.496 1.0488 *** 0.013 2.854
Educational Attainment (excluded category is HS grad)
Less than high school -0.0487 *** 0.007 0.952 0.0999 *** 0.012 1.105
Some college 0.0485 *** 0.005 1.05 0.0583 *** 0.009 1.06
Bachelor's degree or more -0.3992 *** 0.006 0.671 -0.7117 *** 0.011 0.491
Own child under 18 in household 0.00162 0.006 1.002 -0.1652 *** 0.011 0.848
Economic Well-Being

18
High Personal Income 0.0168 *** 0.005 1.017 -0.1113 *** 0.009 0.895
Household Below Poverty Level 0.0561 *** 0.008 1.058 0.1972 *** 0.013 1.218
Household Receives Public Assistance 0.1394 *** 0.015 1.15 0.3321 *** 0.023 1.394
Labor Force Status (excluded category is Employed)
Unemployed 0.1093 *** 0.013 1.115 0.2284 *** 0.021 1.257
Not in Labor Force -0.1127 *** 0.005 0.893 -0.1003 *** 0.009 0.905
Veteran ( Includes those in military) 0.3641 *** 0.006 1.439 0.594 *** 0.01 1.811
Unmarried Partner Household 0.0615 *** 0.016 1.063 0.1795 *** 0.026 1.197
Intercept -1.837 *** 0.03 -3.7971 *** 0.06
Source: U.S. Census Bureau, American Community Survey, 2008
1/ Standard errors were computed using the Taylor Expansion method.
Significance is noted as the following: + (p<0.1); *(p<0.05); **(p<0.01); ***(p<0.001).
Findings from Table 3 indicate a number of demographic differences among the ever
married. Looking at age, compared to those age 65 and older, those aged 55 to 64 are 1.5 times
more likely to be married two times and 1.8 times more likely to be married three or more times
all compared to being married once. This suggests that the baby-boomers who lived through the
dramatic changes in laws and social acceptance of divorce in the 1960s and 1970s (Cherlin 2009)
have very different remarriage patterns than those in the generation before them. The higher
likelihood of remarriage among 45 to 64 year olds compared to the younger age groups may also
reflect the effect of age: the older one is, the more time one has been exposed to the “risk” of
divorce and remarriage. This makes the contrast between those 65 and older and those aged 55
to 64 particularly noteworthy as a cohort effect.
Other socio-demographic characteristics are associated with a greater likelihood of
remarriage. Looking at race, Blacks compared to Whites have a higher likelihood of being
married two times, but a lower likelihood of being married three or more times compared to
being married once. However, American Indians and Alaska Natives and those who identify as
having two or more races are more likely than Whites to report being married two or three or
more times compared to being married just one time. But, looking at those who are White alone
and non-Hispanic, they are 1.3 times more likely to be married two times and 1.6 times more

19
likely to be married three times than other race and ethnic groups7 compared with being married
one time (Table 3). Another socio-demographic characteristic of interest is Veterans and those
in the military at the time of survey: Veterans were 1.4 times more likely to be married 2 times
compared to 1 time and 1.8 times more likely to be married 3 times compared to 1 time than non-
Veterans and non-military individuals (Table 3).
Region also produces interesting variations in who is remarried two or three or more
times. Compared to the Northeast, individuals in all other regions of the country are more likely
to be married two times compared to one time (Midwest is 1.2 times more likely; South is 1.6
times more likely; West is 1.5 times more likely). The odds ratios are even higher for all regions
compared to the Northeast when comparing those married three or more times compared to one
time (Midwest is 2 times more likely; South is 3.2 times more likely; and the West is 2.9 times
more likely). Such findings may suggest that the regional emphasis on personal choice in the
Northeast relative to the stronger culture of marriage in regions such as the South.
HOW DO REMARRIED AMERICANS DIFFER FROM THOSE WHO COHABIT WITH AN UNMARRIED PARTNER OR ARE DIVORCED OR SEPARATED?
Cherlin (2009) argues that relative to other Western countries, Americans are distinctive
in placing a high value on marriage. Furthermore, the individualistic approach to marriage in
America leads us to constantly assess and reassess our personal satisfaction in relationships.
These two characteristics make Americans particularly likely to form and reform partnerships
(Cherlin 2009). However, there may be a distinctive quality to those individuals who pursue
additional relationships by remarrying as opposed to simply cohabiting with their new partners
or living alone as a separated or divorced individual. The following analysis compares
7 The comparison group to White alone, not Hispanic or Latino, referred to here as other race and ethnic groups, includes all who indicate that they are of Hispanic or Latino descent and all who indicate that they are of a race other than White (Black or African-American, American Indian and Alaska Native, Asian, Native Hawaiian and Other Pacific Islander, some other race, or two or more races).
20
differences in those individuals who choose to remarry as opposed to choosing to cohabit or
remaining separated or divorced. All individuals in this sample were married previously – the
distinction being that one group remarried a second time, one group is cohabiting with a partner,
and the other group is still separated or divorced.
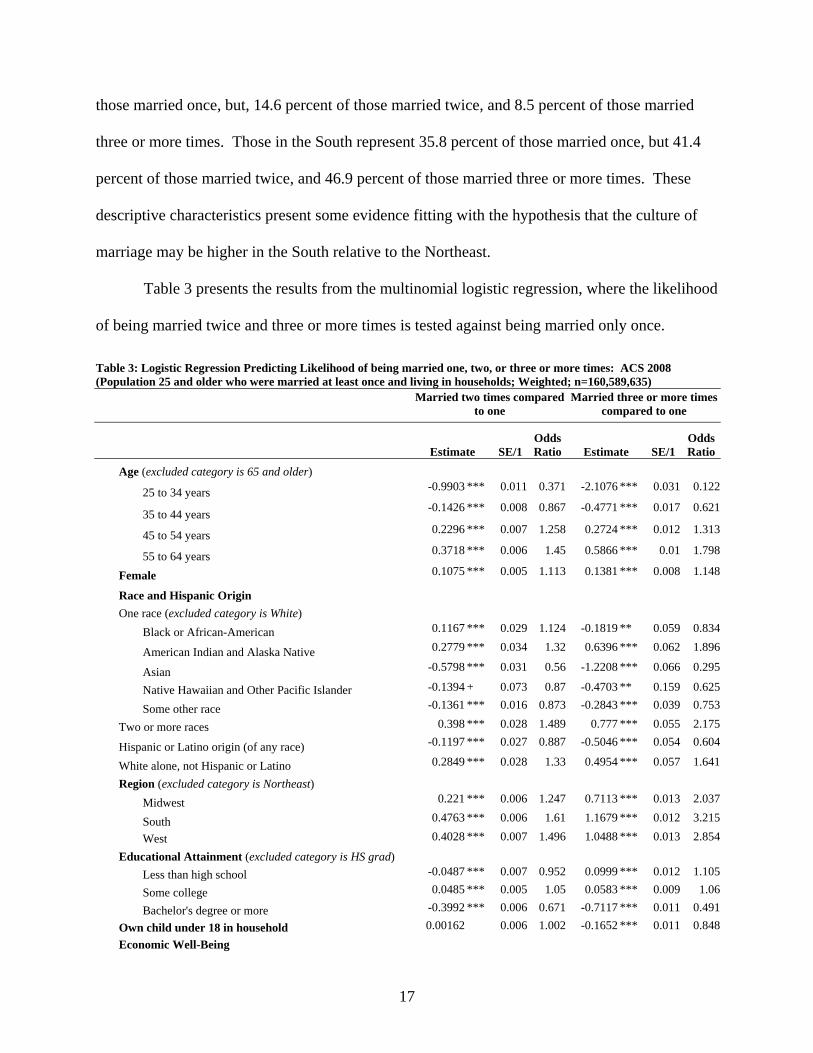
Table 4 shows the descriptive findings comparing those remarried, those cohabiting with
an unmarried partner, and those remaining separated and divorced among the population
previously married once.
Table 4: Demographic characteristics of those who remarried, live with an unmarried partner, or are separated or divorced: ACS 2008 (Population 20 and older who were previously married once and live in households; Weighted; n=38,707,673)
Those 20 and older who were
previously married at least once
Currently Remarried
Currently Living with an
Unmarried Partner
Currently Divorced
38,707,673 21,958,229 3,268,974 13,480,470
Demographic Characteristics % SE/1 % SE/1 % SE/1 % SE/1
100.0 100.0 100.0 100.0
Age
25 to 34 years 9.5 0.05 6.9 0.06 21.3 0.25 10.8 0.10
35 to 44 years 22.3 0.07 20.5 0.08 30.8 0.27 23.0 0.12
45 to 54 years 29.0 0.07 29.0 0.09 27.2 0.25 29.3 0.13
55 to 64 years 22.7 0.06 25.0 0.08 12.9 0.17 21.4 0.11
65 years and over 16.0 0.05 18.3 0.07 5.8 0.11 14.7 0.09
Sex
Male 46.2 0.08 51.0 0.10 50.1 0.28 37.3 0.14
Female 53.8 0.08 49.0 0.10 49.9 0.28 62.7 0.14
Race and Hispanic Origin
One race 98.6 0.02 98.7 0.02 98.3 0.08 98.4 0.04
White 81.0 0.07 85.4 0.08 81.1 0.23 73.7 0.13
Black or African-American 11.4 0.05 7.7 0.06 10.1 0.18 17.6 0.11
American Indian and Alaska Native 0.7 0.01 0.6 0.02 1.1 0.06 0.8 0.02
Asian 2.4 0.02 2.4 0.03 1.8 0.07 2.4 0.04
Native Hawaiian and Other Pacific Isl. 0.1 0.01 0.1 0.01 0.1 0.02 0.1 0.01
Some other race 3.0 0.03 2.4 0.04 4.0 0.12 3.7 0.06
Two or more races 1.4 0.02 1.3 0.02 1.7 0.08 1.6 0.04
Hispanic or Latino origin (of any race) 10.2 0.05 8.9 0.06 13.0 0.20 11.7 0.10
White alone, not Hispanic or Latino 74.3 0.07 79.4 0.09 72.8 0.26 66.4 0.14
Region
Northeast 16.6 0.06 14.9 0.07 19.3 0.22 18.7 0.11
Midwest 22.0 0.06 21.9 0.08 23.3 0.23 21.9 0.11
21
South 39.3 0.08 41.2 0.10 34.2 0.28 37.5 0.14
West 22.0 0.07 22.0 0.08 23.1 0.24 21.9 0.12
Educational Attainment
Less than high school 11.8 0.05 11.0 0.06 14.2 0.21 12.5 0.10
High school graduate 29.4 0.07 30.0 0.09 33.9 0.27 27.3 0.13
Some college 33.9 0.07 33.5 0.09 33.8 0.27 34.5 0.13
Bachelor's degree or more 24.9 0.07 25.5 0.08 18.1 0.21 25.7 0.12Own Child under 18 in Household 30.7 0.07 35.3 0.10 18.8 0.23 26.0 0.13Economic Well-Being
High Personal Income 34.6 0.07 36.3 0.09 29.0 0.25 33.2 0.13
Household Below Poverty Level/2 10.4 0.05 4.4 0.04 19.0 0.23 17.9 0.11
Household Receives Public Assistance/2 2.3 0.02 1.4 0.02 4.1 0.11 3.4 0.05
Labor Force Status
Employed 69.1 0.07 66.6 0.09 76.3 0.24 71.3 0.12
Unemployed 3.2 0.03 2.5 0.03 5.5 0.13 3.8 0.06
Not in Labor Force 27.7 0.07 30.8 0.09 18.2 0.21 24.9 0.12
Veteran ( Includes those in military) 14.5 0.05 17.5 0.07 11.2 0.17 10.5 0.08
Source: U.S. Census Bureau, American Community Survey, 2008
1/ Standard errors were computed using the Taylor Expansion method.
2/ This variable is a household-level variable (n=26,804,616), in contrast to the rest of the table which constitutes the eligible population living in households and may include more than one eligible person in a household (n=38,707,673).
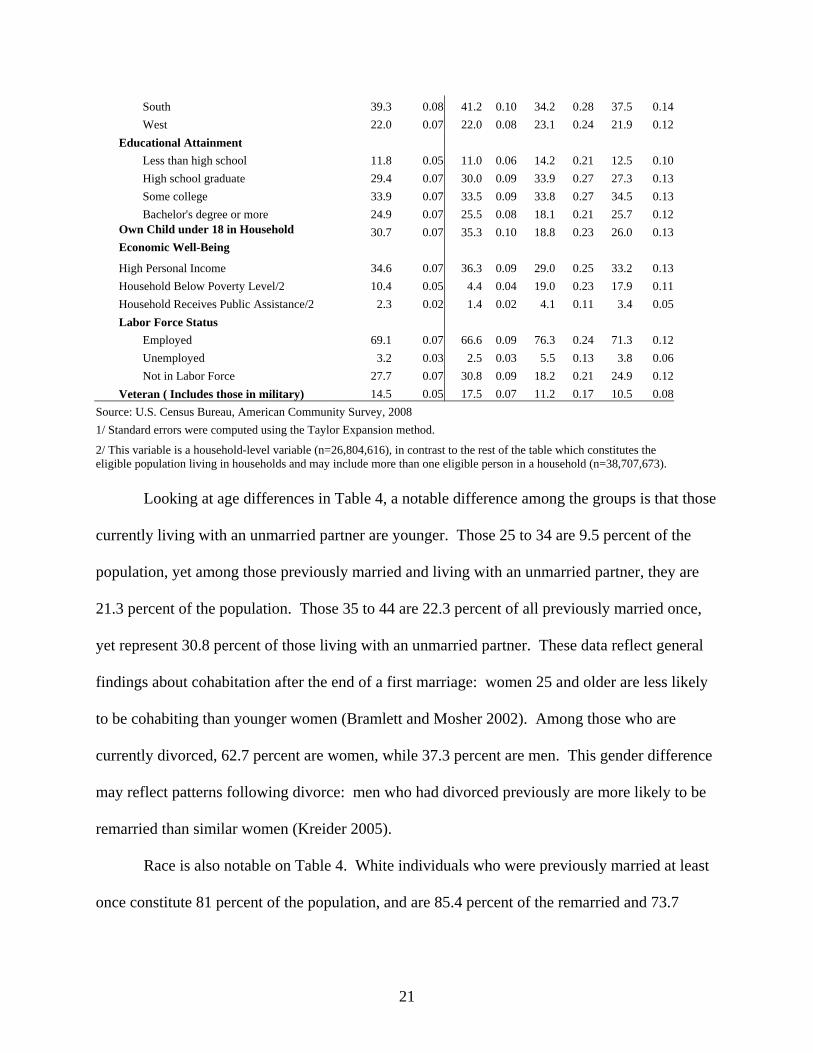
Looking at age differences in Table 4, a notable difference among the groups is that those
currently living with an unmarried partner are younger. Those 25 to 34 are 9.5 percent of the
population, yet among those previously married and living with an unmarried partner, they are
21.3 percent of the population. Those 35 to 44 are 22.3 percent of all previously married once,
yet represent 30.8 percent of those living with an unmarried partner. These data reflect general
findings about cohabitation after the end of a first marriage: women 25 and older are less likely
to be cohabiting than younger women (Bramlett and Mosher 2002). Among those who are
currently divorced, 62.7 percent are women, while 37.3 percent are men. This gender difference
may reflect patterns following divorce: men who had divorced previously are more likely to be
remarried than similar women (Kreider 2005).
Race is also notable on Table 4. White individuals who were previously married at least
once constitute 81 percent of the population, and are 85.4 percent of the remarried and 73.7
22
percent of those currently separated or divorced.8 White alone, non-Hispanic individuals are
74.3 percent of all previously married once, but represent 79.4 percent of those remarried and
66.4 percent of those separated or divorced. While Black individuals constitute 11.4 percent of
those previously married once, they are 7.7 percent of the remarried and 17.6 percent of those
separated or divorced.
Indicators of socio-economic status such as education and poverty level also show
variation. For example, those with a Bachelor’s degree or more constitute 24.9 percent of the
population married once previously, yet they are 18.1 percent of those living with an unmarried
partner following their first marriage.9 Those in poverty are 10.4 percent of all individuals
married once previously, and among those remarried are 4.4 percent of those who remarried, but
19.0 percent of those living with an unmarried partner, and 17.9 percent of those who are
separated and divorced (Table 4).
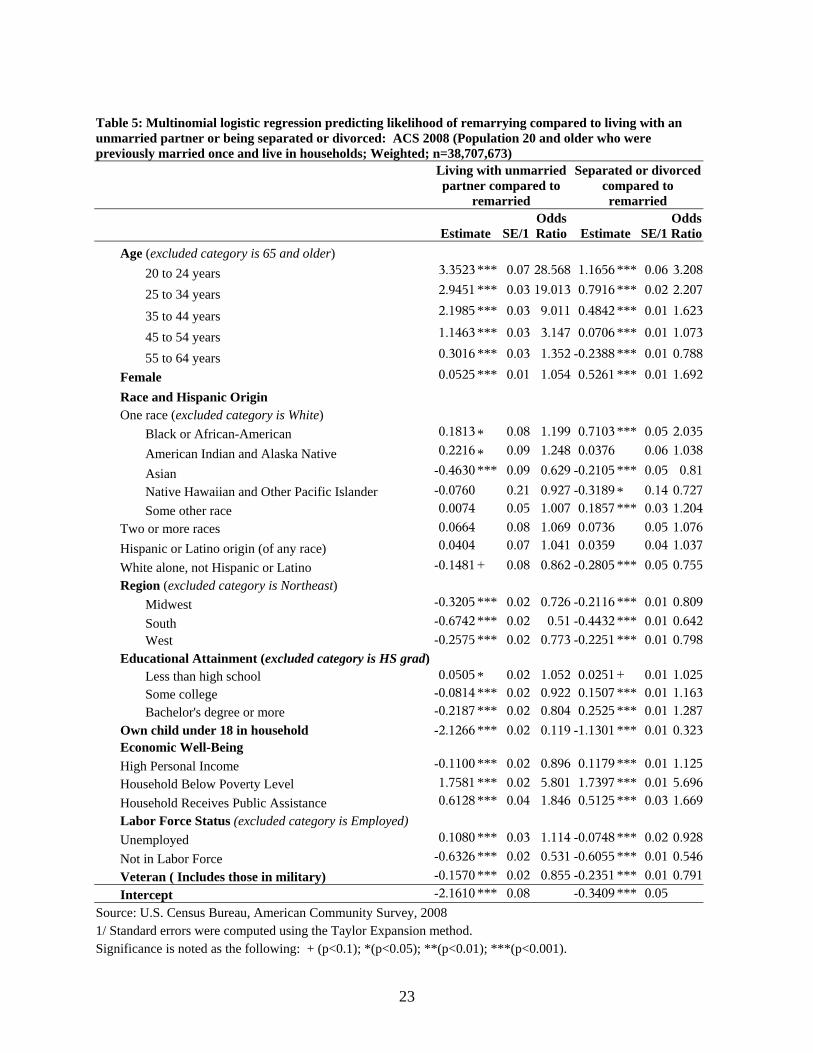
Table 5 presents the results of the multinomial logistic regression among those previously
married once, to understand variations among those who remarried, those living with an
unmarried partner, and those who remain divorced or separated.
8 The total percentage of Whites (81.0) is not significantly different from the percentage of Whites living with an unmarried partner (81.1). 9 The percentage of those with a Bachelor’s degree who are remarried (25.5) is not significantly different from the percentage of those with a Bachelor’s degree who are separated or divorced (25.7).
23
Table 5: Multinomial logistic regression predicting likelihood of remarrying compared to living with an unmarried partner or being separated or divorced: ACS 2008 (Population 20 and older who were previously married once and live in households; Weighted; n=38,707,673)
Living with unmarried partner compared to
remarried
Separated or divorced compared to remarried
Estimate SE/1Odds Ratio Estimate SE/1
Odds Ratio
Age (excluded category is 65 and older)
20 to 24 years 3.3523 *** 0.07 28.568 1.1656 *** 0.06 3.208
25 to 34 years 2.9451 *** 0.03 19.013 0.7916 *** 0.02 2.207
35 to 44 years 2.1985 *** 0.03 9.011 0.4842 *** 0.01 1.623
45 to 54 years 1.1463 *** 0.03 3.147 0.0706 *** 0.01 1.073
55 to 64 years 0.3016 *** 0.03 1.352 -0.2388 *** 0.01 0.788
Female 0.0525 *** 0.01 1.054 0.5261 *** 0.01 1.692
Race and Hispanic Origin One race (excluded category is White)
Black or African-American 0.1813 * 0.08 1.199 0.7103 *** 0.05 2.035
American Indian and Alaska Native 0.2216 * 0.09 1.248 0.0376 0.06 1.038
Asian -0.4630 *** 0.09 0.629 -0.2105 *** 0.05 0.81
Native Hawaiian and Other Pacific Islander -0.0760 0.21 0.927 -0.3189 * 0.14 0.727
Some other race 0.0074 0.05 1.007 0.1857 *** 0.03 1.204
Two or more races 0.0664 0.08 1.069 0.0736 0.05 1.076
Hispanic or Latino origin (of any race) 0.0404 0.07 1.041 0.0359 0.04 1.037
White alone, not Hispanic or Latino -0.1481 + 0.08 0.862 -0.2805 *** 0.05 0.755
Region (excluded category is Northeast)
Midwest -0.3205 *** 0.02 0.726 -0.2116 *** 0.01 0.809
South -0.6742 *** 0.02 0.51 -0.4432 *** 0.01 0.642
West -0.2575 *** 0.02 0.773 -0.2251 *** 0.01 0.798
Educational Attainment (excluded category is HS grad) Less than high school 0.0505 * 0.02 1.052 0.0251 + 0.01 1.025
Some college -0.0814 *** 0.02 0.922 0.1507 *** 0.01 1.163
Bachelor's degree or more -0.2187 *** 0.02 0.804 0.2525 *** 0.01 1.287
Own child under 18 in household -2.1266 *** 0.02 0.119 -1.1301 *** 0.01 0.323Economic Well-Being
High Personal Income -0.1100 *** 0.02 0.896 0.1179 *** 0.01 1.125
Household Below Poverty Level 1.7581 *** 0.02 5.801 1.7397 *** 0.01 5.696
Household Receives Public Assistance 0.6128 *** 0.04 1.846 0.5125 *** 0.03 1.669
Labor Force Status (excluded category is Employed)
Unemployed 0.1080 *** 0.03 1.114 -0.0748 *** 0.02 0.928
Not in Labor Force -0.6326 *** 0.02 0.531 -0.6055 *** 0.01 0.546
Veteran ( Includes those in military) -0.1570 *** 0.02 0.855 -0.2351 *** 0.01 0.791
Intercept -2.1610 *** 0.08 -0.3409 *** 0.05 Source: U.S. Census Bureau, American Community Survey, 2008 1/ Standard errors were computed using the Taylor Expansion method. Significance is noted as the following: + (p<0.1); *(p<0.05); **(p<0.01); ***(p<0.001).

24
A number of characteristics affect the likelihood of living with an unmarried partner or
being separated or divorced rather than remarrying after a first marriage that ended. Age is a
significant predictor of subsequent paths: Younger adults are more likely than older adults to be
cohabiting after an ended first marriage rather than remarrying (28.6 times more likely for those
age 20 to 24 and 19 times more likely for those age 25 to 34 compared to those age 65 and
older), reflecting general age patterns of cohabitation among the population overall. Also, the
older one is, generally, the more likely they are to be remarried rather than separated or divorced.
The exception to this statement is among those 55 to 64: they are more likely to be remarried
rather than separated or divorced compared to those 65 and older following an ended first
marriage (Table 5).
Looking at other socio-economic indicators on Table 5, compared to white individuals,
black individuals are 2 times more likely to be divorced or separated rather than remarrying
following a first marriage that ended. Those with an own child under 18 in the household are
one-third as likely as those without a child in the household to be divorced or separated rather
than remarried following the end of a first marriage. Both receiving public assistance and living
in a household below the poverty level are also predictors of living with an unmarried partner
rather than remarrying (5.8 times more likely for those in poverty and 1.8 times more likely for
those receiving public assistance) or being divorced or separated rather than remarrying (5.7
times more likely for those in poverty and 1.7 times more likely for those receiving public
assistance) following a first marriage that ended. Finally, looking at regional variations,
individuals in the Northeast are more likely than all other regions to live with an unmarried
partner or be separated or divorced following the end of a first marriage, rather than to remarry
(Table 5).

25
Conclusions
As hypothesized in this paper, remarriage in the United States varies considerably among
Americans, particularly when age/cohort, socio-demographic factors, and regional variations are
considered. Consequently, remarriage may also be considered a deinstitutionalized institution
for some, yet a thriving path to subsequent union formation for others.
Looking at age differences, we see, not surprisingly, that younger Americans are less
likely to be married more than one time and are more likely to be living with an unmarried
partner rather than remarrying following a first marriage that ended when compared with older
Americans. Such findings not only reflect a lower risk toward remarriage (simply by being
younger and having a lower exposure to, or “risk,” of having a subsequent marriage), but a
greater acceptance of cohabitation as an alternative union formation. But, the story is not simply
about age, either, but suggests that values have shifted for more recent cohorts of Americans.
Among the baby boomers (or those age 55 to 64 at the time of survey), there is a greater
likelihood to marry two or three or more times rather than just once, as well as to remarry rather
than being separated or divorced, relative to those 65 and older. This finding suggests that baby
boomers who were young adults during the years where considerable transition about attitudes
and laws about divorce happened may have different notions about marrying just once relative to
the generation prior.
The socio-demographic findings also show interesting variations in remarriage patterns.
Those who are White alone and non-Hispanic are 1.3 times more likely to be married two times
and 1.6 times more likely to be married three or more times compared to being married once
relative to other race and ethnic groups. Compared to white individuals, black individuals are 2
times more likely to be divorced or separated rather than remarried following a first marriage
26
that ended, consistent with the historical downturn from marriage among Blacks (Fitch and
Ruggles 2000). Veterans and those in the military were 1.4 times more likely to be married two
times compared to being married once and 1.8 times more likely to be married 3 times compared
to being married once than non-Veterans and non-military individuals, also consistent with
evidence that individuals in the military have transitions to adulthood that parallel those of
previous generations (Kelty, Segal, and Kleykamp 2010). Receiving public assistance and living
in a household below the poverty level are also predictors of living with an unmarried partner
rather than remarrying (5.8 times more likely for those in poverty and 1.8 times more likely for
those receiving public assistance) or being divorced or separated rather than remarrying (5.7
times more likely for those in poverty and 1.7 times more likely for those receiving public
assistance) following a first marriage that ended. Such evidence suggest that remarriage may be
out of reach for the poor and near poor, much in the way that first marriages are out of reach
among this population (Edin and Kefalas 2005; Edin 2000).
Finally, region also presents interesting evidence about variations in patterns of
remarriage. As was theorized, those in the Northeast are less likely than others to marry two or
three or more times and are less likely to remarry following a first marriage that ended compared
to those in other areas of the country. This is consistent with the idea that personal choice in
union formation may be more prevalent in the Northeast. In particular, those in the South were
much more likely to remarry two or three or more times compared to being married just once
relative to those in the Northeast. As the policy and legislation suggest, marriage is promoted in
a more traditional way in the South than it is in other regions of the country. However, the
“culture of marriage” in the South also makes divorce more difficult, which is not readily
apparent in these findings. These findings may demonstrate that the “risk to remarriage” is

27
higher in the South not only because of its regional “culture of marriage,” but also because such
a culture encourages first marriages to happen sooner in the South and thus puts individuals at a
higher risk for divorce and subsequent remarriage at an earlier point in their adult lives.10
Overall, these findings suggest that remarriage as an institution is not equally or
overwhelmingly uniform in the United States. For some groups and areas of the country,
marriage may be increasingly deinstitutionalized. But, for others, it remains a thriving option for
subsequent union formation following the end of a first, or even second or third marriage.
References Axinn, William G. and Arland Thornton. 2000. “The Transformation in the Meaning of Marriage.” Pp. 147-165 in Linda Waite and Chrisitne
Bachrach, Eds., The Ties that Bind: Perspectives on Marriage and Cohabitation. New York: Aldine de Gruyter. Berger, Roni. 1998. Stepfamilies: A Multi-Dimensional Perspective. New York: Haworth. Booth, Alan and John N. Edwards. 1992. “Starting Over: Why Remarriages are More Unstable.” Journal of Family Issues 13(2): 179-194. Boss, Pauline. 1980. “Normative Family Stress: Family Boundary Changes Across the Lifespan.” Family Relations 29: 445-450. Boss, Pauline. 1987. “Family Stress.” Pp. 695-723 in Marvin B. Sussman and Suzanne K. Steinmetz, Eds., Handbook of Marriage and Family.
New York: Plenum. Boss, Pauline, Wayne Caron, Joan Horbal, and James Mortimer. 1990. “Predictors of Depression in Caregivers of Dementia Patients: Boundary
Ambiguity and Mastery.” Family Process 29: 245-254. Boss, Pauline and Jan Greenberg. 1984. “Family Boundary Ambiguity: A New Variable in Family Stress Theory.” Family Process 23: 535-546. Bramlett, M.D. and W.D. Mosher. 2002. “Cohabitation, Marriage, Divorce, and Remarriage in the United States.” National Center for Health
Statistics. Vital Health Statistics 23(22): 1-93. Brotherson, Sean E. and William C. Duncan. 2004. “Rebinding the Ties that Bind: Government Efforts to Preserve and Promote Marriage.”
Family Relations 53: 459-468. Brotherson, Sean E. and Jeffrey B. Teichert. 2001. “Value of the Law in Shaping Social Perspectives on Marriage.” Journal of Law and Family
Studies 3: 23-56. Bulcroft, Richard, Kris Bulcroft, Karen Bradley, and Carl Simpson. 2000. “The Management and Production of Risk in Romantic Relationships:
A Postmodern Paradox.” Journal of Family History 25: 63-92. Bumpass, Larry and Hsien-Hen Lu. 2000. “Trends in Cohabitation and Implications for Children’s Family Contexts in the United States.”
Population Studies 54(1): 29-41. Bumpass, Larry L. and James A. Sweet. 1989. “National Estimates of Cohabitation.” Demography 26(4): 615-625. Burns, Linda Hammer. 1987. “Infertility as Boundary Ambiguity: One Theoretical Perspective.” Family Process 26: 359-372. Casper, Lynne M. and Suzanne M. Bianchi. 2002. Continuity and Change in the American Family. Thousand Oaks, CA: Sage Publications. Cherlin, Andrew. 1978. “Remarriage as an Incomplete Institution.” American Journal of Sociology 84: 634-650. Cherlin, Andrew. 1992. Marriage, Divorce, Remarriage. Cambridge, MA: Harvard University Press.
10 See tables R1204 and R1205 in the 2008 ACS American Fact Finder tables for state rankings of median age at first marriage for men and women: http://factfinder.census.gov/servlet/GRTSelectServlet?ds_name=ACS_2008_1YR_G00_.
28
Cherlin, Andrew. 2004. “The Deinstitutionalization of American Marriage.” Journal of Marriage and Family 66: 848-861. Cherlin, Andrew. 2009. The Marriage-Go-Round: The State of Marriage and the Family in America Today. New York: Alfred A. Knopf. Coltrane, Scott. 2001. “Marketing the Marriage ‘Solution’: Misplaced Simplicity in the Politics of Fatherhood.” Sociological Perspectives 44:
387-402. Coontz, Stephanie. 1997. The Way We Really Are: Coming to Terms with America’s Changing Families. New York: Basic Books. Coontz, Stephanie. 2000. “Historical Perspectives on Family Studies.” Journal of Marriage and Family 62: 283-297. Edin, Kathryn. 2000. “What Do Low-Income Single Mothers Say about Marriage?” Social Problems 47(1): 112-133. Edin, Kathryn and Maria Kefalas. 2005. Promises I Can Keep: Why Poor Women Put Motherhood before Marriage. Berkeley, CA: University of
California Press. Elder, Glen H., Jr. 1999. Children of the Great Depression: Social Change in Life Experience. Boulder, CO: Westview Press. Fine, Mark A. and Lawrence A. Kurdek. 1994. “A Multidimensional Cognitive-Development Model of Stepfamily Adjustment.” Pp. 15-32 in
Kay Pasley and Marilyn Ihinger-Tallman, Eds., Stepparenting: Issues in Theory, Research, and Practice. Westport, CT: Greenwood. Fitch, Catherine A. and Steven Ruggles. 2000. “Historical Trends in Marriage Formation, United States 1950-1990.” Pp. 59-88 in Linda Waite
and Chrisitne Bachrach, Eds., The Ties that Bind: Perspectives on Marriage and Cohabitation. New York: Aldine de Gruyter. Ganong, Lawrence H. and Marilyn Coleman. 2004. Stepfamily Relationships: Development, Dynamics, and Interventions. New York: Kluwer
Academic. Gardiner, Karen N., Michael E. Fishman, Plamen Nikolov, Asaph Glosser, and Stephanie Lund. 2002. State Policies to Promote Marriage: Final
Report. Washington, DC: U.S. Department of Health and Human Services. Goode, William J. 1970. World Revolution and Family Patterns. New York: The Free Press. (Original work published 1963.). Haines, Michael R. 1996. “Long-Term Marriage Patterns in the United States from Colonial Times to the Present.” History of the Family 1: 15-
39. Pp. 3-39 in Alan Booth, Ann C. Crouter, and Michael J. Shanahan, Eds., Transitions to Adulthood in a Changing Economy. Westport, CT: Praeger.
Hamilton, Brady E., Joyce A. Martin, and Stephanie J. Ventura. 2009. “Births: Preliminary Data for 2007.”National Vital Statistics Reports
57(12). Hawkins, Alan J., Steven L. Nock, Julia C. Wilson, Laura Sanchez, and James D. Wright. 2002. “Attitudes about Covenant Marriage and
Divorce: Policy Implications from a Three-State Comparison.” Family Relations 51: 166-175. Inglehart, Ronald. 1997. Modernization and Postmodernization: Cultural, Economic, and Political Change in 43 Societies. Princeton, NJ:
Princeton University Press. Kaufman, Gayle and Frances Goldscheider. 2007. “Do Men ‘Need’ a Spouse More than Women?: Perceptions of the Importance of Marriage for
Men and Women.” The Sociological Quarterly 48: 29-46. Kelty, Ryan, David R. Segal and Meredith Kleykamp. 2010. “The Military and the Transition to Adulthood.” In Future of Children, the
Transition to Adulthood. Cecilia Rouse, Gordon Berlin, Frank Furstenberg, and Mary Waters (Eds.). Princeton, NJ: Princeton University Press.
Koball, Heather. 1998. “Have African American Men become Less Committed to Marriage? Explaining the Twentieth Century Racial Cross-
Over in Men’s Marriage Timing.” Demography 32: 251-258. Koenig Kellis, Jody, Cassandra LeClair-Underberg, and Emily Lamb Normand. 2008. “Stepfamily Address Terms: ‘Sometimes they Mean
Something and Sometimes they Don’t.’” Journal of Family Communication 8(4): 238-263. Kreider, Rose M. 2005. “Number, Timing, and Duration of Marriages and Divorces: 2001,” Current Population Reports, P70-97. U.S. Census
Bureau, Washington, DC. Madden-Derdich, Debra A., Stacie A. Leonard, and F. Scott Christopher. 1999. “Boundary Ambiguity and Coparental Conflict after Divorce: An
Empirical Test of a Family Systems Model of the Divorce Process.” Journal of Marriage and Family 61: 588-598. Martin, Steven P. and Sangeeta Parashar. 2006. “Women’s Changing Attitudes Toward Divorce, 1974-2002: Evidence for an Educational
Crossover.” Journal of Marriage and Family 68: 29-40. McIntyre, Lisa J. 1995. “Law and the Family in Historical Perspective: Issues and Antecedents.” Marriage and Family Review 21: 5-30.
29
McLanahan, Sara. 2004. “Diverging Destinies: How Children are Faring Under the Second Demographic Transition.” Demography 41: 607-628. Moffitt, Robert A., Reville, Robert T., Winkler, Anne E., and Jane McClure Burstain. 2009. “Cohabitation and Marriage Rules in State TANF
Programs,” RAND Labor and Population Working Paper, WR-585-1. Oppenheimer, Valerie Kincade, Matthijs Kalmijn, and Nelson Lim. 1997. “Men’s Career Development and Marriage Timing in a Period of
Rising Inequality.” Demography 34: 311-330. Pagnini, Deanna L. and Ronald R. Rindfuss. 1993. “The Divorce of Marriage and Childbearing: Changing Attitudes and Behavior in the United
States.” Population and Development Review 19: 331-347. Pasley, Kay. 1987. “Family Boundary Ambiguity: Perceptions of Adult Stepfamily Members.” Pp. 206-224 in Kay Pasley and Marilyn Ihinger-
Tallman, Eds., Remarriage and Stepparenting: Current Research and Theory. New York: Guilford. Popenoe, David. 1988. Disturbing the Nest: Family Change and Decline in Modern Societies. New York: Aldine De Gruyter. Popenoe, David. 1993. “American Family Decline, 1960-1990: A Review and Appraisal.” Journal of Marriage and Family 55: 527-555. Popenoe, David and Barbara Defoe Whitehead. 2009. The State of Our Unions 2008 (National Marriage Project). Retrieved August 4, 2009, from
http://marriage.rutgers.edu/Publications/SOOU/2008update.pdf. Raley, R. Kelly and Larry Bumpass. 2003. “The Topography of the Divorce Plateau: Levels and Trends in Union Stability in the United States
after 1980.” Demographic Research 8: 245-259. Rogers, Stacy J. and Danelle D. DeBoer. 2001. “Changes in Wives’ Income: Effects on Marital Happiness, Psychological Well-Being, and the
Risk of Divorce.” Journal of Marriage and Family 63: 458-472. Sanchez, Laura, Steven L. Nock, James D. Wright, and Constance T. Gager. 2002. “Setting the Clock Forward or Back? Covenant Marriage and
the ‘Divorce Revolution.’” Journal of Family Issues 23(1): 91-120. Sayer, Liana and Suzanne M. Bianchi. 2000. “Women’s Economic Independence and the Probability of Divorce—A Review and
Reexamination.” Journal of Family Issues 21: 906-943. Schoen, Robert, Nan Marie Astone, Kendra Rothert, Nicola J. Standish, and Young J. Kim. 2002. “Women’s Employment, Marital Happiness,
and Divorce.” Social Forces 81: 643-662. Smart, Carol, Bren Neale, and Amanda Wade. 2001. The Changing Experience of Childhood: Families and Divorce. Malden, MA: Blackwell. Smock, Pamela J. 2004. “The Wax and Wane of Marriage: Prospects for Marriage in the 21st Century.” Journal of Marriage and Family 66: 966-
973. Smock, Pamela J., Wendy D. Manning, and Meredith Porter. 2005. ““Everything’s There Except Money”: How Money Shapes Decisions to
Marry among Cohabitors.” Journal of Marriage and Family 67: 680-696. Stewart, Susan D. 2005. “Boundary Ambiguity in Stepfamilies.” Journal of Family Issues 26(7): 1002-1029. Sweeney, Megan M. 2002. “Two Decades of Family Change: The Shifting Economic Foundations of Marriage.” American Sociological Review
67: 132-147. Thornton, Arland, and Linda Young-DeMarco. 2001. “Four Decades of Trends in Attitudes Toward Family Issues in the United States: The
1960s Through the 1990s.” Journal of Marriage and Family 63: 1009-1037. U.S. Census Bureau. 2006. Estimated Median Age at First Marriage, by Sex: 1890 to the Present. Retrieved August 12, 2009, from
http://www.census.gov/population/socdemo/hh-fam/ms2.pdf. Ventura, Stephanie J. and Christine A. Bachrach. 2000. “Nonmarital childbearing in the United States, 1940-99.” National Vital Statistics Reports
48(16). Veroff, Joseph, Elizabeth Ann Malcolm Douvan, and Richard A. Kulka. 1982. The Inner American: A Self-Portrait from 1957 to 1976. New
York: Basic Books. Wilson, James Q. 2002. The Marriage Problem: How Our Culture has Weakened Families. New York: Harper Collins. Wilson, William J. 1987. The Truly Disadvantaged: The Inner City, the Underclass, and Public Policy. Chicago: University of Chicago Press. Wu, Zheng. 2000. Cohabitation: An Alternative Form of Family Living. New York: Oxford University Press.