Embedded Value – Quo Vadis?€¦ · Embedded Value – Quo Vadis? A XIV. Altenburger Gyula...
38
Laszlo Hrabovszki, AMB Generali Derk Kleinrensing, Tillinghast Embedded Value – Quo Vadis? A XIV. Altenburger Gyula Szimpózium 21 May 2004
Transcript of Embedded Value – Quo Vadis?€¦ · Embedded Value – Quo Vadis? A XIV. Altenburger Gyula...
Laszlo Hrabovszki, AMB GeneraliDerk Kleinrensing, Tillinghast
Embedded Value – Quo Vadis?
A XIV. Altenburger Gyula Szimpózium21 May 2004

SEITE 2
Agenda
Introduction
Valuation Methods
Market-consistent Embedded Value
Sample
Outlook

SEITE 3
Content
■ Motivation for market-consistent valuation
■ Introduction into market-consistent valuation methods and applications for traditional life insurance products
■ Recognition of burn-through expenses
■ Sample for closed formulae (non-stochastic) valuation methods
SEITE 2
Gliederung
Einführung
Bewertungsmethoden
MCEV in Deutschland
Beispiel
Ausblick
Food for thought regarding the valuation of options and guarantees for life Insurance products
SEITE 4
IntroductionWhy market-consistent valuation methods?
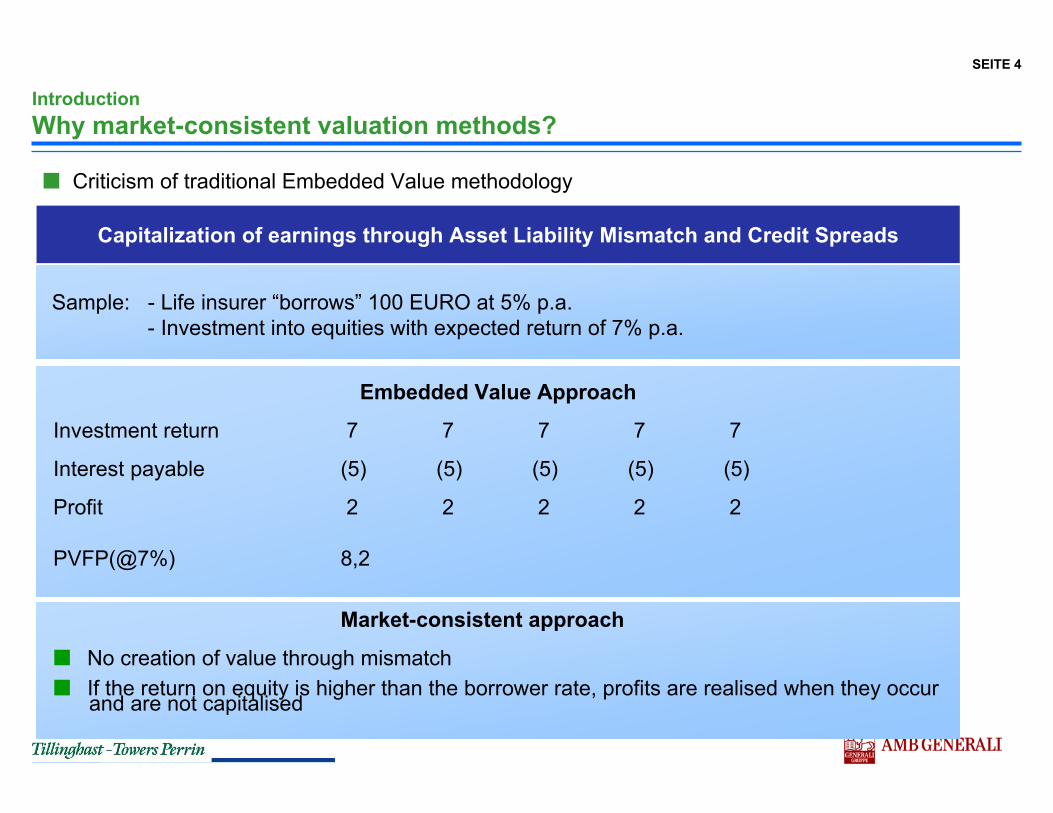
■ Criticism of traditional Embedded Value methodology
Embedded Value Approach
Investment return 7 7 7 7 7
Interest payable (5) (5) (5) (5) (5)
Profit 2 2 2 2 2
PVFP(@7%) 8,2
Market-consistent approach
■ No creation of value through mismatch■ If the return on equity is higher than the borrower rate, profits are realised when they occur
and are not capitalised
Sample: - Life insurer “borrows” 100 EURO at 5% p.a. - Investment into equities with expected return of 7% p.a.
Capitalization of earnings through Asset Liability Mismatch and Credit Spreads
SEITE 5
IntroductionWhy market-consistent valuation ?
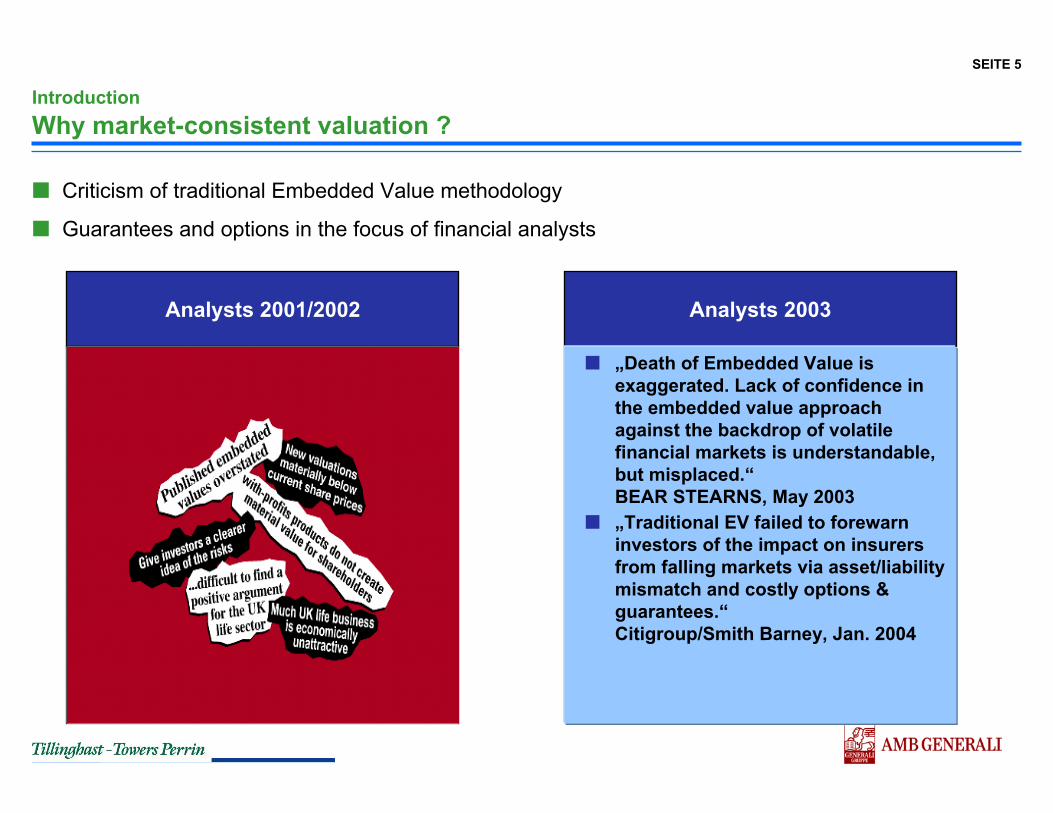
■ Criticism of traditional Embedded Value methodology
■ Guarantees and options in the focus of financial analysts
Analysts 2001/2002 Analysts 2003
■ „Death of Embedded Value isexaggerated. Lack of confidence in the embedded value approachagainst the backdrop of volatile financial markets is understandable, but misplaced.“ BEAR STEARNS, May 2003
■ „Traditional EV failed to forewarninvestors of the impact on insurersfrom falling markets via asset/liabilitymismatch and costly options & guarantees.“ Citigroup/Smith Barney, Jan. 2004
SEITE 6
IntroductionWhy market-consistent valuation ?
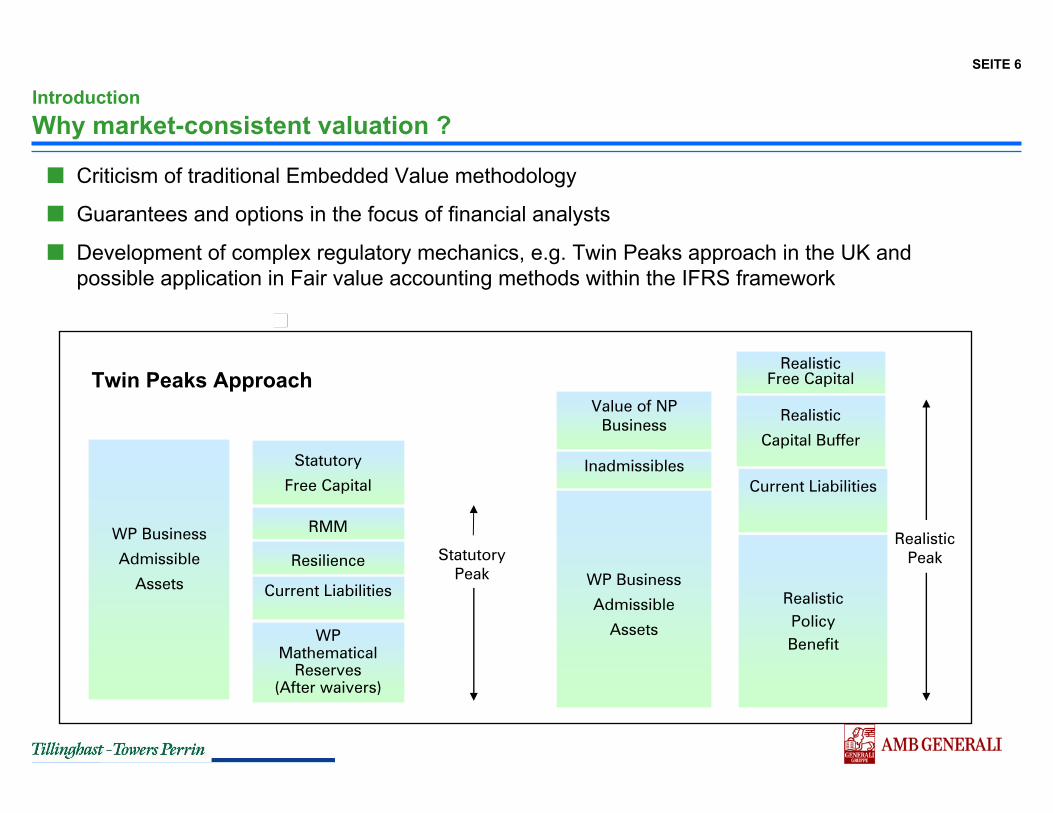
■ Criticism of traditional Embedded Value methodology
■ Guarantees and options in the focus of financial analysts
■ Development of complex regulatory mechanics, e.g. Twin Peaks approach in the UK and possible application in Fair value accounting methods within the IFRS framework
WP Business
Admissible
Assets WP Business
Admissible
Assets
Value of NP Business
InadmissiblesStatutory
Free Capital
WPMathematical
Reserves(After waivers)
Current Liabilities RealisticPolicy Benefit
Current Liabilities
RealisticFree Capital
Realistic
Capital Buffer
RealisticPeak
RMM
Resilience StatutoryPeak
Twin Peaks Approach

SEITE 7
IntroductionWhy market-consistent valuation ?
■ Criticism of traditional Embedded Value methodology
■ Guarantees and options in the focus of financial analysts
■ Development of complex regulatory mechanics, e.g. Twin Peaks approach in the UK and possible application in Fair value accounting methods within the IFRS framework
■ Doubts regarding the current business model
Münchener Rück 2004Allianz 2004

SEITE 8
Agenda
Introduction
Valuation Methods
Market-consistent Embedded Value
Sample
Outlook

SEITE 9
Valuation MethodsWhat are market-consistent valuation methods?
Market-consistent valuation methods for insurance liabilities aim at theirvaluation in accordance with modern finance theory
Description
■ Valuation in line with market theory■ Arbitrage-free assumptions■ Includes valuation of options and guarantees
■ Can be applied in various areas■ Insurance liabilities
■ Single products■ In-force portfolios
■ Shareholder dividends
Limitations
■ Insurance liabilities are not traded at capital markets■ E.g. Capital markets for long-term options with
low strikes are partially not liquid■ Biometric risks and guarantees are
not (yet) traded at capital markets
SEITE 10
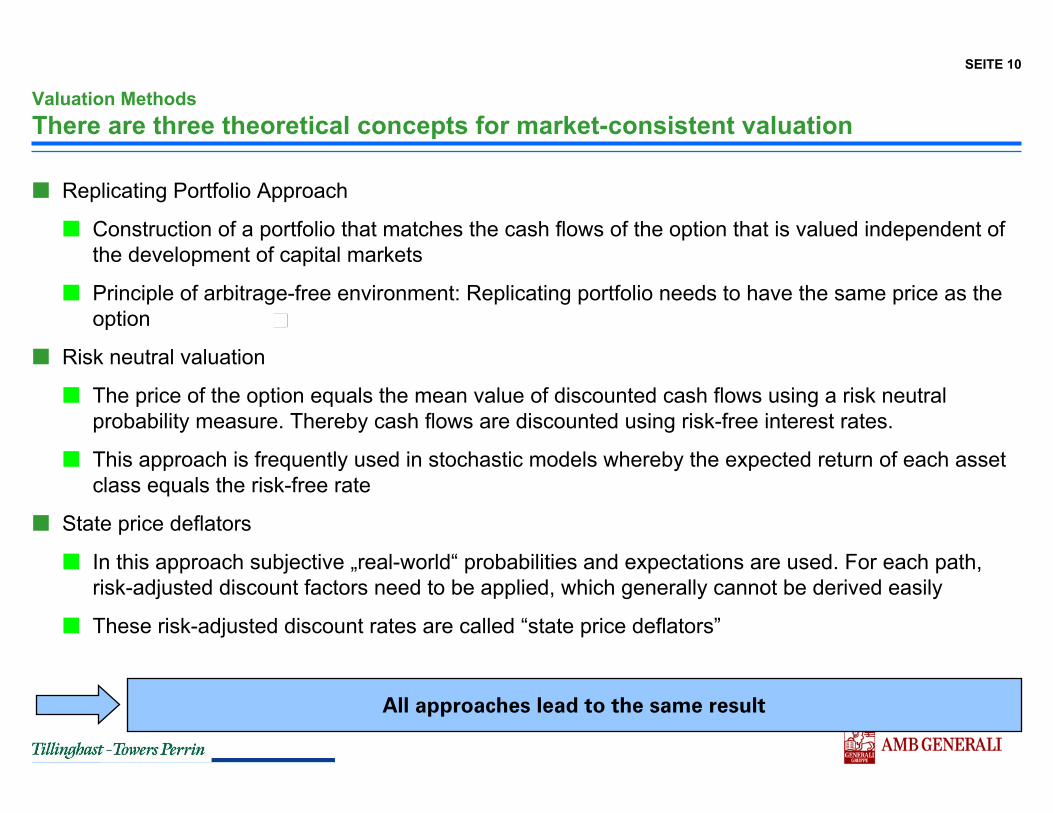
Valuation Methods There are three theoretical concepts for market-consistent valuation
■ Replicating Portfolio Approach
■ Construction of a portfolio that matches the cash flows of the option that is valued independent of the development of capital markets
■ Principle of arbitrage-free environment: Replicating portfolio needs to have the same price as the option
■ Risk neutral valuation
■ The price of the option equals the mean value of discounted cash flows using a risk neutral probability measure. Thereby cash flows are discounted using risk-free interest rates.
■ This approach is frequently used in stochastic models whereby the expected return of each asset class equals the risk-free rate
■ State price deflators
■ In this approach subjective „real-world“ probabilities and expectations are used. For each path, risk-adjusted discount factors need to be applied, which generally cannot be derived easily
■ These risk-adjusted discount rates are called “state price deflators”
All approaches lead to the same result

SEITE 11
Valuation Methods Calculation methods can be categorised as follows ...
Liabilities without optionality, e.g. Term assurance or unit-linked business
Options of more complex nature dependent on management actions and policyholder behaviour, e.g. traditional with-profit business
Deterministic Approach
Stochastic Simulations
Easy options, which costs cannot be influenced by management actions, e.g. lump-sum options for unit-linked annuities or GMDBs
Closed Formulae
■ Arbitrage-free■ Reproduction of
relevant market prices
Requirementsfor capital markets
SEITE 12
Valuation MethodsExample: Valuation of guaranteed annuity option
■ Situation
■ Non-profit unit-linked annuities
■ Guaranteed annuity conversion factors (i.e. mortality, technical interest rate)
■ Shareholder pays for guarantee because of no explicit loadings for this guarantee
■ Risk management
■ Reduction of biometric risk with reinsurance
■ Hedging of interest guarantees on capital markets

SEITE 13
Valuation MethodsWhat are the policyholders options?
■ Policyholder has the option to buy a portfolio of zero bonds for a price that has been fixed at outset, i.e. the valuation of the insurance option requires the valuation of interest rate derivatives
■ The value of the guaranteed annuity option equals the sum of the prices of the individual options („Replicating Portfolio“)
■ These options are generally not traded in liquid markets Construction via Receiver Swaptions
■ Valuation of Receiver Swaptions via closed formulae (Black) and implicit volatilities
LUMP-SUM PAYMENT ANNUITY
Deferral Period Deferral Period
€€

SEITE 14
■ The holder of a receiver swaptions has the right to acquire a bond with a fixed term and coupon (Strike) for afixed price
■ Motivation: Protection against fall in interest rates below a given level
■ Approach: Cash Flows of expected annuity payments is replicated with coupon bonds
■ Capital at annuity conversion = Present value of coupons and principle payments
■ Coupon = Discount rate = Technical rate = Strike (Swaptions)
■ Example:
■ Annuitant age 65; outstanding deferral period 5, 10, 15 years
■ Male, Standard German annuitant mortality table, 4% Technical rate, Capital at annuity conversion = 100.000 €
■ Mortality of 2nd order equals pricing assumptions
Payo
ut
Valuation MethodsConstruction of hedging portfolio using receiver swaptions
Interest rateStrike 1
Strike 2
€
SEITE 15
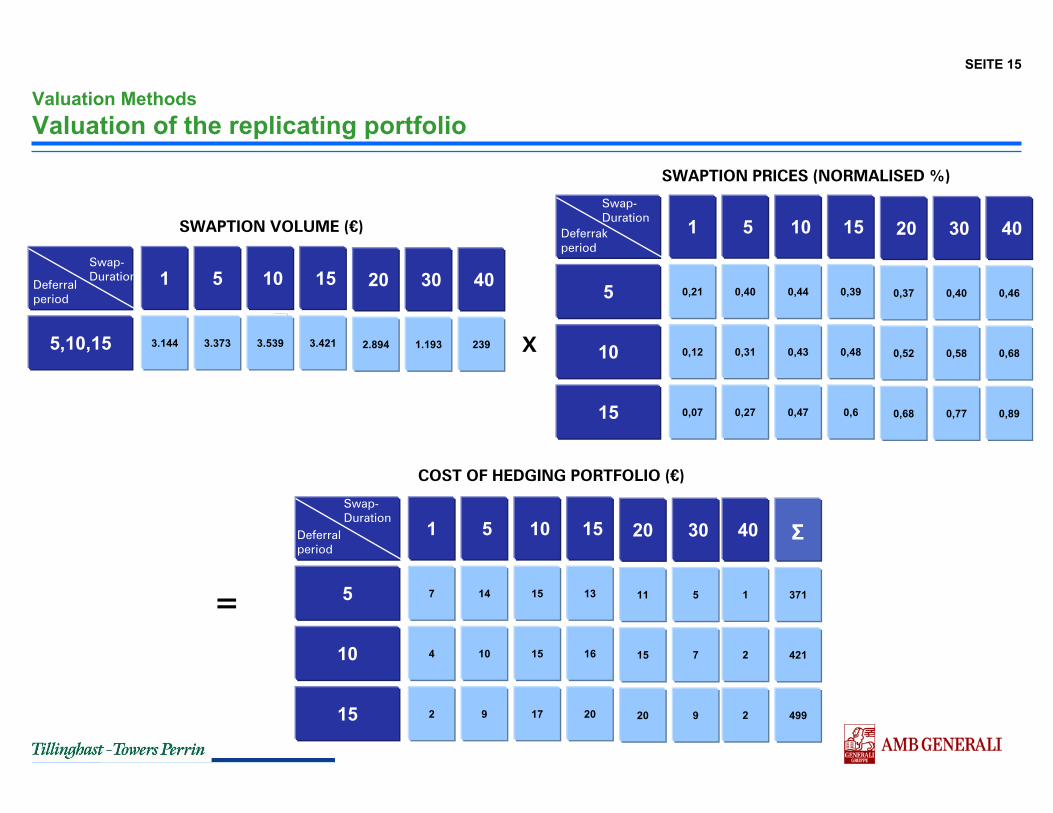
Valuation MethodsValuation of the replicating portfolio
SWAPTION PRICES (NORMALISED %)
0,21
1 5
0,44
10
5
10
0,40
0,12 0,430,31
0,39
15
0,48
15 0,07 0,470,27 0,6
0,37
20
0,52
0,40
30
0,58
0,68 0,77
Deferrakperiod
Swap-Duration
X
7
1 5
15
10
5
10
14
4 1510
13
15
16
15 2 179 20
11
20
15
5
30
7
20 9
Deferralperiod
Swap-Duration
COST OF HEDGING PORTFOLIO (€)
= 371
421
499
Σ
3.144
1 5
3.539
10
5,10,15 3.373 3.421
15
2.894
20
1.193
30Deferralperiod
Swap-Duration
SWAPTION VOLUME (€)
239
400,46
40
0,68
0,89
1
40
2
2
SEITE 16
Valuation MethodsThere are numerous limitations for such an approach
■ Which annuitisation capital has to be used?
■ Is the fund performance uncorrelated to interest rates Accumulation phase and annuitisation can be handeledseparately Capital at annuitisation equals the rolled-forward amount of capital plus future premiums using the risk-free interest rate
■ Is the fund performance correlated to interest rates (bond funds) : Stochastic projections for both phases become necessary (limited closed formulae can be used)
■ How does one derive the price of the swaption?
■ Bloomberg publishes implicit volatilities for strikes „at the money“
■ Because of the „Volatility Smile“ this leads to problems if the difference between strike and forward swap rate is very large
■ The constructed replicating portfolio gives an upper limit for the price of the option
■ Life insurer only exercises the options „in the money“
■ Policyholder has an option to a basket of cash flows
■ Other
■ Proportion of policyholders exercising the option prudently
■ Flexible anuitisation point
■ Costs for immediate annuities
■ ...

SEITE 17
Valuation MethodsCost of the guaranteed annuity option can vary very much
■ The cost of the option increase with
■ Higher guaranteed interest
■ Longer deferred period
■ Policyholder should be charged for these costs
■ E.g. By charging additionally 10 bp p.a. of the investment fund
■ Dependent on term to annuitisation and guaranteed interest
371 245
10
98
421 45150
15 499 87232
GaranteedInterest
DAV 94R 4%
DAV 94R 3,25%
DAV 94R 2,75%
Calculation of costs for option very interesting for product pricing process
Example: Costs in EURO for annuitisation capital of EUR 100.000
Def
erre
dpe
riod
SEITE 18
Agenda
Introduction
Valuation Methods
Market-consistent Embedded Value
Sample
Outlook

SEITE 19
MCEV for European Life Insurance IndustryHow can MCEV be calcualted for traditional with-profits business?
The high complexity of the business requires stochastic modelling techniques
... for European life insurers■ Policyholder profit participation
■ Profits are shared with policyholders using a formulae approach■ Policyholder bonus can be managed according to strategy
■ Smoothing effects■ Buffers on asset and liability side used for smoothing■ In reality no actual mark-to-market of options (similar to Asian options)
■ Policyholder and management behaviour■ Empirically there are not always prudent market participants as assumed in financial market
theory- Policyholders do not exercise options and guaranteed in a prudent way- Also, management actions are not always prudent in a financial sense
... Embedded Value ...■ Shareholder view, valuation of possible payouts to shareholders■ Valuation without new business■ Questions: Need for capital
Market-consistent ...■ Arbitrage-free
economic scenarios■ Calibration to relevant
capital market positions
SEITE 20
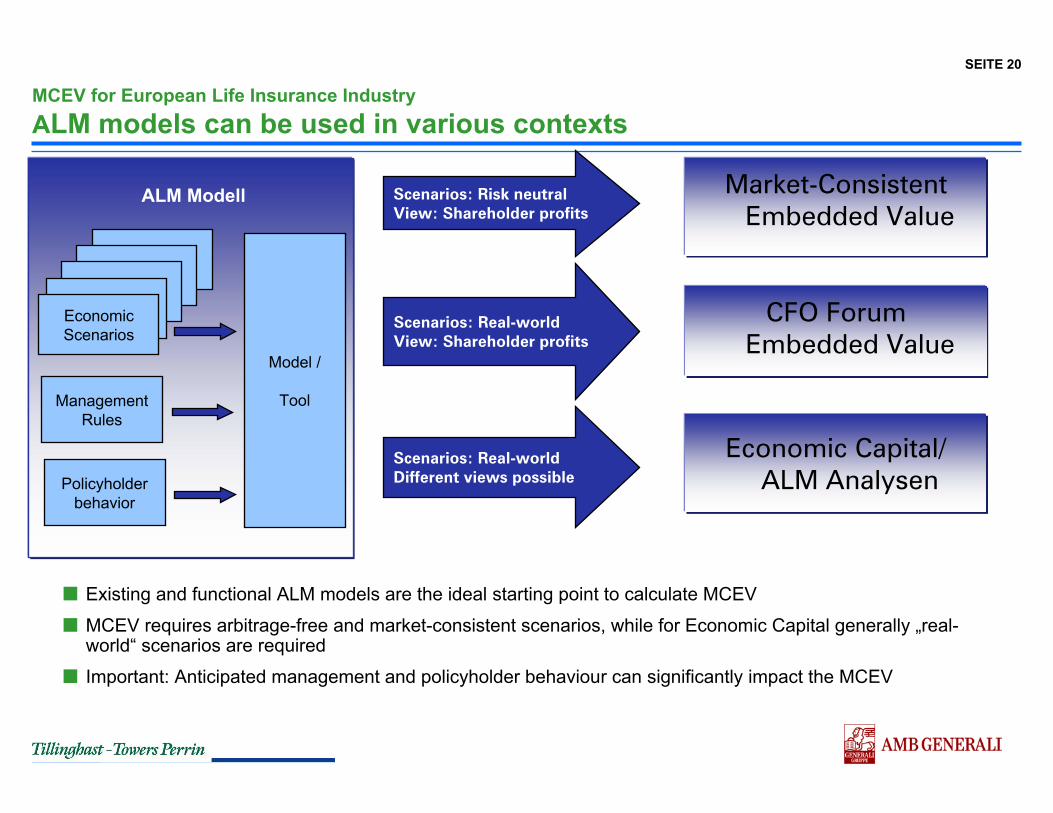
MCEV for European Life Insurance Industry ALM models can be used in various contexts
■ Existing and functional ALM models are the ideal starting point to calculate MCEV■ MCEV requires arbitrage-free and market-consistent scenarios, while for Economic Capital generally „real-
world“ scenarios are required■ Important: Anticipated management and policyholder behaviour can significantly impact the MCEV
Market-ConsistentEmbedded Value
Economic Capital/ ALM Analysen
Scenarios: Risk neutralView: Shareholder profits
Scenarios: Real-worldDifferent views possible
EconomicScenarios
ManagementRules
Model /
Tool
ALM Modell
Policyholderbehavior
CFO ForumEmbedded Value
Scenarios: Real-worldView: Shareholder profits

SEITE 21
MCEV for European Life Insurance Industry Analysis of results
■ „Value“ of options /guarantees could be reduced to zero bymanagement
■ Successful riskmanagement
Comment
In some scenarios■ Negative surplus■ Losses covered by shareholder
100%
Case 2
All scenarios■ Non-negative surplus■ Profits split, e.g. 90% / 10%
Policyholder / Shareholder■ No Shortfall / burn-through
Case 1
■ Equity market crash■ Long period of low interest
rates■ Results in lower MCEV
compared to case 1
Comment
some scenarios and years
all Scenarios and years
SEITE 22
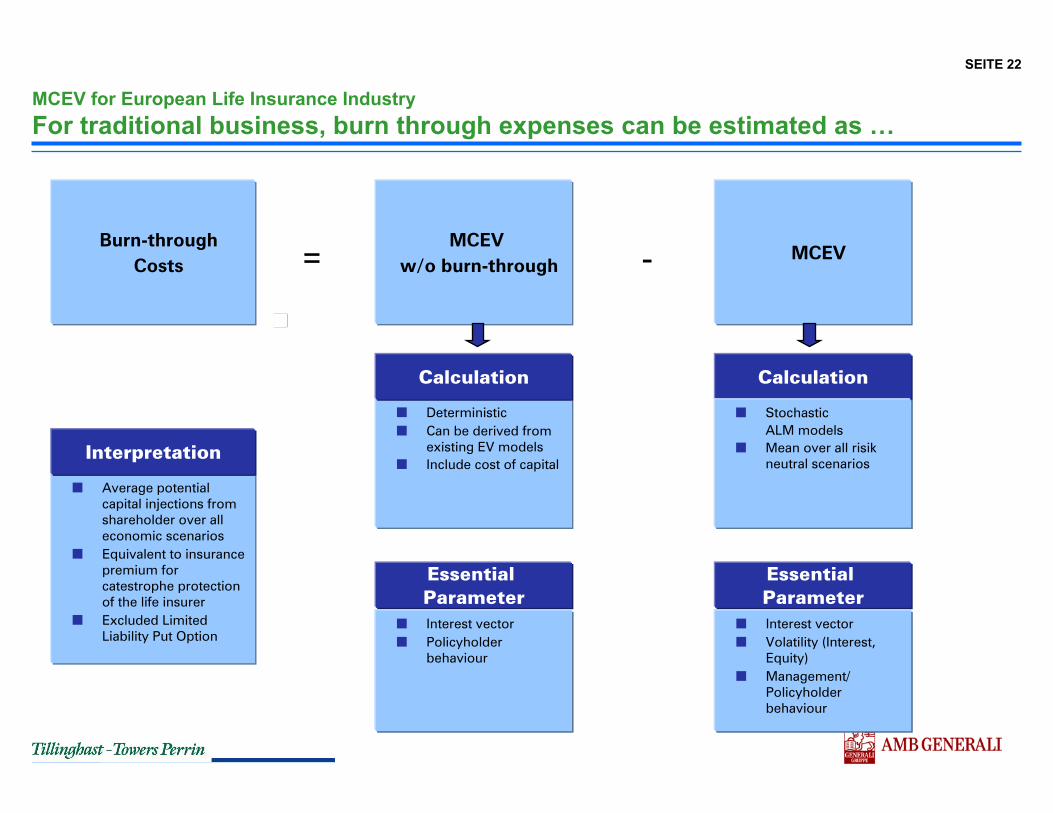
MCEV for European Life Insurance Industry For traditional business, burn through expenses can be estimated as …
■ Deterministic■ Can be derived from
existing EV models■ Include cost of capital
= -Burn-through
CostsMCEV
MCEV w/o burn-through
Calculation Calculation
Essential Parameter
Essential Parameter
■ Average potential capital injections from shareholder over all economic scenarios
■ Equivalent to insurance premium for catestrophe protection of the life insurer
■ Excluded Limited Liability Put Option
Interpretation
■ Interest vector■ Policyholder
behaviour
■ StochasticALM models
■ Mean over all risikneutral scenarios
■ Interest vector■ Volatility (Interest,
Equity)■ Management/
Policyholder behaviour
SEITE 23
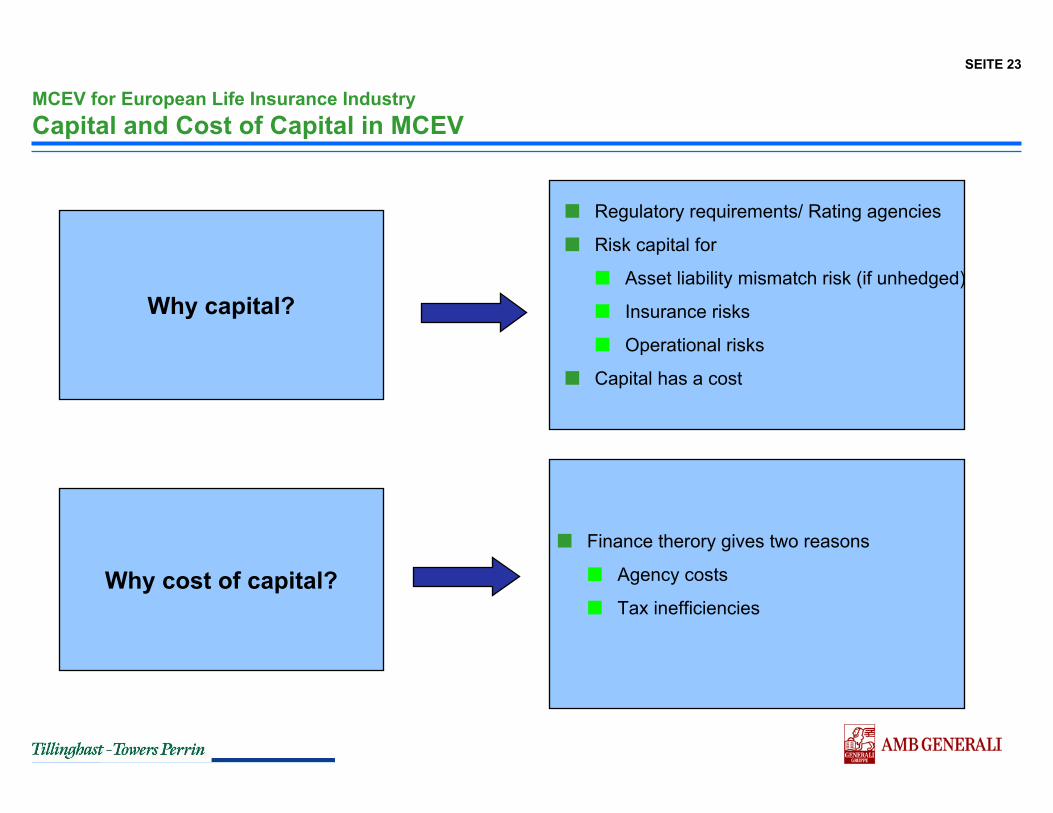
MCEV for European Life Insurance IndustryCapital and Cost of Capital in MCEV
■ Regulatory requirements/ Rating agencies
■ Risk capital for
■ Asset liability mismatch risk (if unhedged)
■ Insurance risks
■ Operational risks
■ Capital has a cost
■ Finance therory gives two reasons
■ Agency costs
■ Tax inefficiencies
Why capital?
Why cost of capital?
SEITE 24
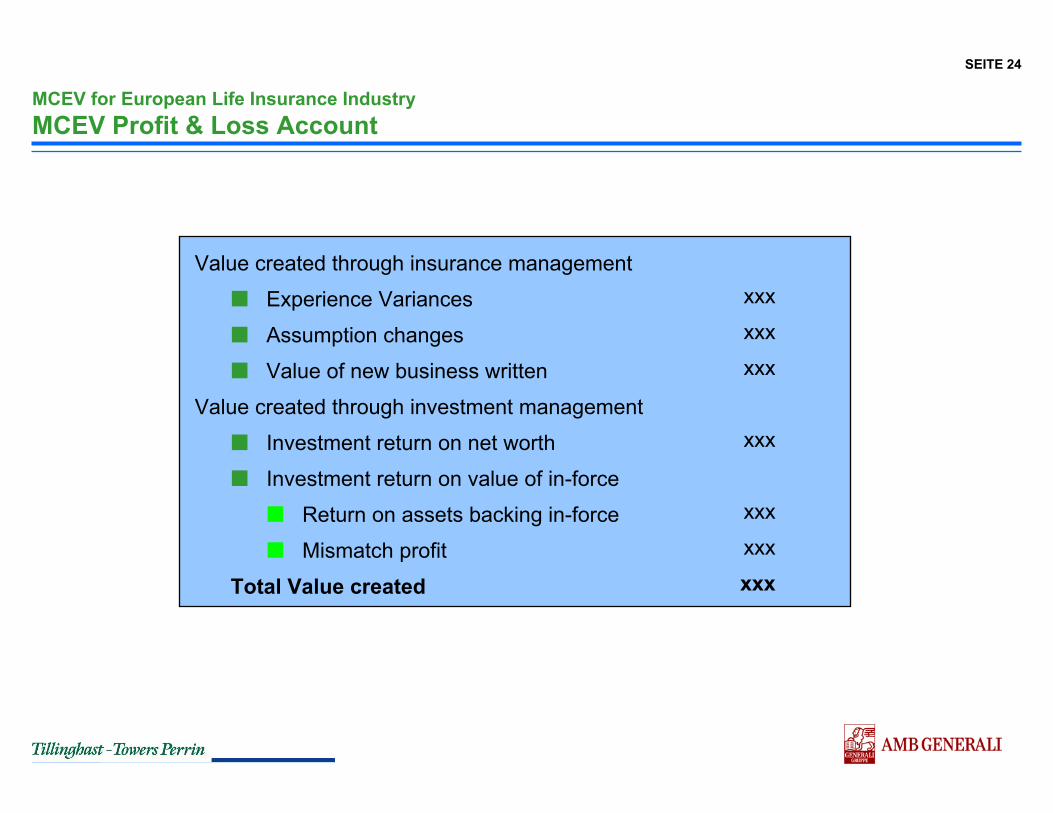
MCEV for European Life Insurance IndustryMCEV Profit & Loss Account
Value created through insurance management■ Experience Variances■ Assumption changes■ Value of new business written
Value created through investment management■ Investment return on net worth■ Investment return on value of in-force
■ Return on assets backing in-force■ Mismatch profit
Total Value created
xxxxxxxxx
xxx
xxxxxxxxx

SEITE 25
MCEV for European Life Insurance Industry
MCEV Sensitivities
Typical sensitivities currently
■ Future investment return
■ Risk discount rate
MCEV Balance Sheet risks
■ Levels of equity markets
■ Insurance risks
■ mortality/morbidity■ lapses■ expenses, one-off and
ongoing
■ Level and shape of yield curve■ Levels of option prices (implied
market volatility)■ Credit risk spreads
■ Management actions
SEITE 26
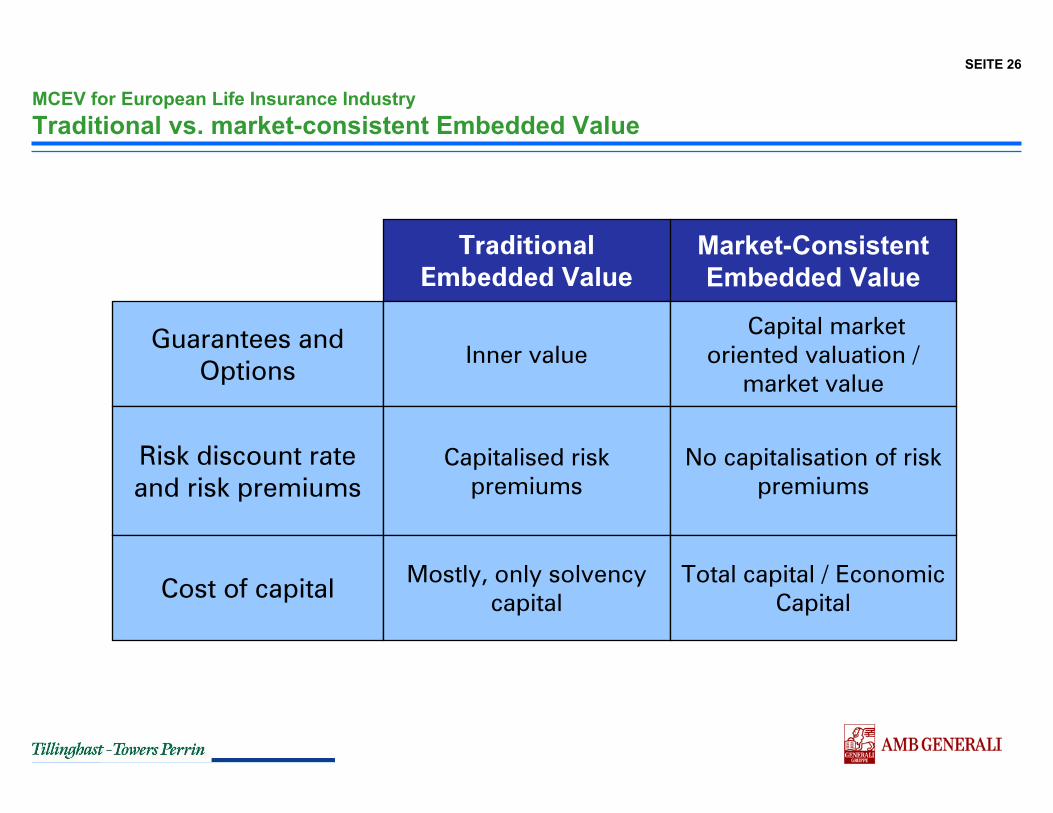
MCEV for European Life Insurance IndustryTraditional vs. market-consistent Embedded Value
Guarantees and Options
Guarantees and Options
Risk discount rate and risk premiums
Risk discount rate and risk premiums
Cost of capital
TraditionalEmbedded Value
Market-ConsistentEmbedded Value
Inner valueInner valueCapital market
oriented valuation / market value
Capitalised risk premiums
Capitalised risk premiums
No capitalisation of risk premiums
Mostly, only solvency capital
Total capital / Economic Capital
SEITE 27
Agenda
Introduction
Valuation Methods
Market-consistent Embedded Value
Sample
Outlook

SEITE 28
ExampleWhat‘s the effect of a hedge?
■ In bad scenarios a burn-through occurs
■ What is the cost of the burn-through?
■ No burn-through maximized MCEV
■ Effective hedge
■ No downside risk
■ Lower upside potential
ASSET ALLOCATION - UNHEDGED ASSET ALLOCATION - HEDGED
t = 0 t = 1
good
average
bad
Guarantee
good
average
bad
GuaranteeHedge
t = 0 t = 1
Simplified Scenario Analysis
Shareholder: + 10%
Shareholder: - 100%
Hedge
SEITE 29
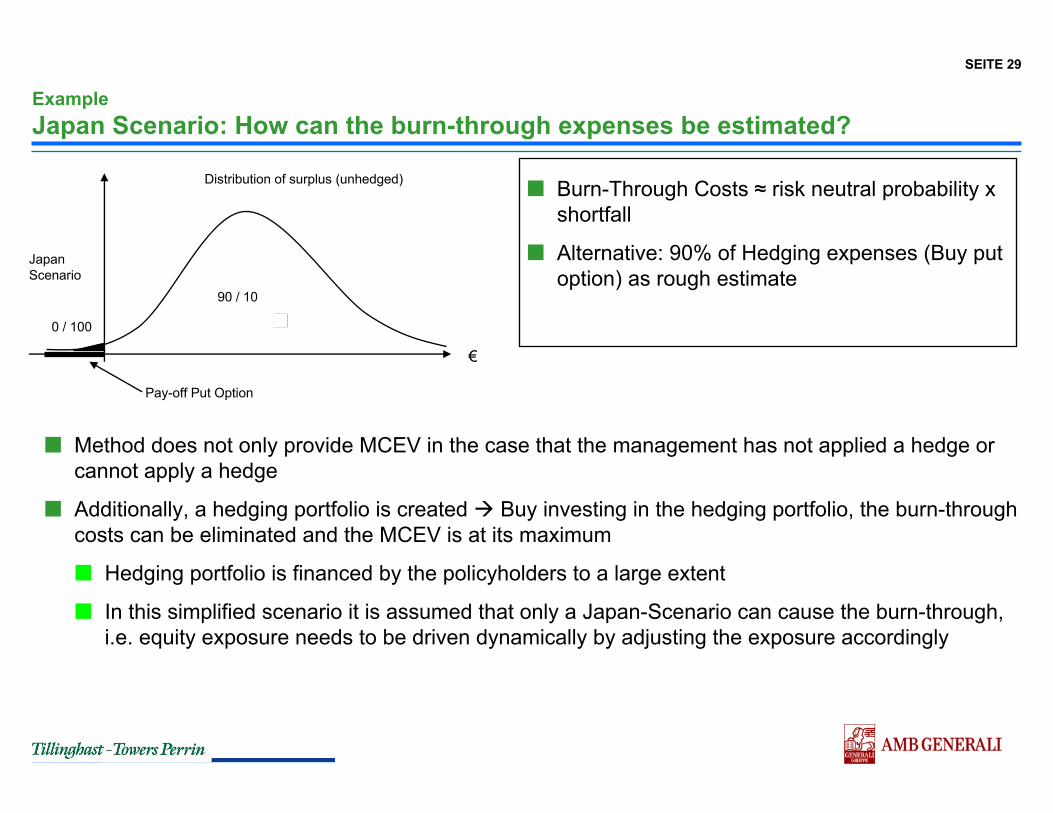
Example Japan Scenario: How can the burn-through expenses be estimated?
■ Method does not only provide MCEV in the case that the management has not applied a hedge or cannot apply a hedge
■ Additionally, a hedging portfolio is created Buy investing in the hedging portfolio, the burn-through costs can be eliminated and the MCEV is at its maximum
■ Hedging portfolio is financed by the policyholders to a large extent
■ In this simplified scenario it is assumed that only a Japan-Scenario can cause the burn-through, i.e. equity exposure needs to be driven dynamically by adjusting the exposure accordingly
■ Burn-Through Costs ≈ risk neutral probability x shortfall
■ Alternative: 90% of Hedging expenses (Buy put option) as rough estimate
Distribution of surplus (unhedged)
€
0 / 100
90 / 10
Japan Scenario
Pay-off Put Option
SEITE 30
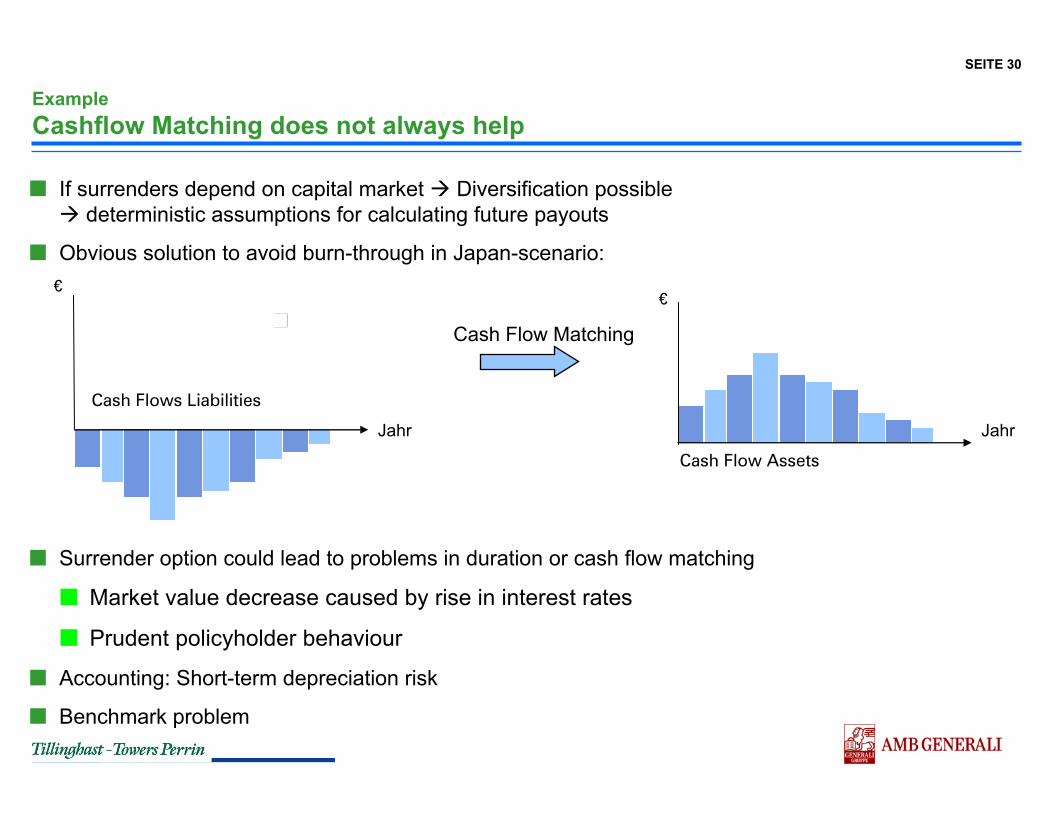
Example Cashflow Matching does not always help
■ Surrender option could lead to problems in duration or cash flow matching
■ Market value decrease caused by rise in interest rates
■ Prudent policyholder behaviour
■ Accounting: Short-term depreciation risk
■ Benchmark problem
Cash Flows Liabilities
■ If surrenders depend on capital market Diversification possibledeterministic assumptions for calculating future payouts
■ Obvious solution to avoid burn-through in Japan-scenario:
Cash Flow Assets
Cash Flow Matching
€€
Jahr Jahr

SEITE 31
Example Receiver Swaptions again build the hedging portfolio
■ Advantage of hedge portfolio of options
■ Reinvestment with pre-determined interest and thereby securing the policyholders guaranteed interest
■ Duration of assets can be shorter in comparison to liabilities low surrender risk
■ Receiver swaptions are simply not exercised when interest rates increase over the strike
Burn-through can be avoided in rising and falling interest rate scenario
■ Tasks
■ Determine hedging portfolios
■ Valuation of hedging portfolios

SEITE 32Example The construction of the hedging portfolio requires advanced modelling techniques
1. Step – Determine reinvestment profile
■ Cash flows (assets and liabilities)
■ Realistic bonus strategy
2. Step - Determine strikes
■ Guaranteed interest, but taking into account
■ Expense and risk profits
■ Current portfolio yield
■ Other buffers
■ Might be dependent on projection year
3. Step – Valuation of replicating portfolio
■ Reinvestment in coupon bonds swaptions
■ Valuation as in previous example lump-sum option
Guarantee
StrikeRisk profits
€
Year
ExpenseProfit
SWAPTION PREISE (NORMIERT %)
0,21
1 5
0,44
10
5
10
0,40
0,12 0,430,31
0,39
15
0,48
15 0,07 0,470,27 0,6
0,37
20
0,52
0,40
30
0,58
0,68 0,77
Aufschub-dauer
Swap-laufzeit
X
7
1 5
15
10
5
10
14
4 1510
13
15
16
15 2 179 20
11
20
15
5
30
7
20 9
Aufschub-dauer
Swap-laufzeit
KOSTEN DES HEDGEPORTFOLIOS (€)
= 371
421
499
Σ
3.144
1 5
3.539
10
5,10,15 3.373 3.421
15
2.894
20
1.193
30Aufschub-dauer
Swap-laufzeit
SWAPTION VOLUMEN (€)
239
400,46
40
0,68
0,89
1
40
2
2
SWAPTION PREISE (NORMIERT %)
0,21
1 5
0,44
10
5
10
0,40
0,12 0,430,31
0,39
15
0,48
15 0,07 0,470,27 0,6
0,37
20
0,52
0,40
30
0,58
0,68 0,77
Aufschub-dauer
Swap-laufzeit
X
7
1 5
15
10
5
10
14
4 1510
13
15
16
15 2 179 20
11
20
15
5
30
7
20 9
Aufschub-dauer
Swap-laufzeit
KOSTEN DES HEDGEPORTFOLIOS (€)
= 371
421
499
Σ
3.144
1 5
3.539
10
5,10,15 3.373 3.421
15
2.894
20
1.193
30Aufschub-dauer
Swap-laufzeit
SWAPTION VOLUMEN (€)
239
40
3.144
1 5
3.539
10
5,10,15 3.373 3.421
15
2.894
20
1.193
30Aufschub-dauer
Swap-laufzeit
SWAPTION VOLUMEN (€)
239
400,46
40
0,68
0,89
1
40
2
2
SEITE 33
Example Burn-Through expenses need to be calculated individually for each company
■ Number of price factors is significant
■ Interest rate environment/ Implicit volatilities
■ Guaranteed interest
■ Expense and risk profits
■ Proportion of annuity business
■ Structure of asset portfolio
■ There are again numerous limitations similar to the one previously stated
■ Based on our calculations for a sample in-force portfolio, the costs of a „Japan Hedge“ amount to about 1%-2% of total assets at year-end 2003
■ Very high, if shareholder has to pay alone (burn-through expenses)
■ Traditional Embedded Values currently amount to about 2%-3 % of total assets
Policyholder should participate in costs for hedge

SEITE 34
Example Remarks to the Example
■ In order to calculate the MCEV, 90% of the hedging costs are deducted from the deterministic maximum value
■ This approach is based on a rough estimate and only intends to give an indication of the size of the costs for the guaranteed interest in the case that no management actions are taken
■ There are many possible management actions that would reduce the burn-through costs and which could in general on be evaluated using stochastic models
■ The overall goal is not only to construct hedging portfolio but also price optimisation
■ Even though the MCEV does not decrease in the case of over hedging, only the lowest possible amount of assets should be tied in this portfolio
− Policyholders expect certain participation in equity performance
− Benchmark risk
■ For valuation purposes, receiver swaptions are of great use
■ There are liquid markets also for long durations
■ Protection against falling interest rates
■ In practice other alternatives might be necessary (limitations of use of derivatives)

SEITE 35
Agenda
Introduction
Valuation Methods
Market-consistent Embedded Value
Sample
Outlook

SEITE 36
OutlookWhat can MCEV‘s be used for?
■ Not the calculation of MCEV but the valuation of alternative management options is important
■ The amount of burn-through costs drives the necessity to take action
■ ALM strategies are compared in a capital market consistent way
■ Targets are set for ALM goals
Max. MCEV ➁➀ ➂ MCEV
Interestmismatch
Equitymismatch
Fixedbonus policy
MANAGEMENTACTION
MCEVbefore ALM ➁➀ ➂
MCEVafter ALM
“Japan-Hedge”
VaR Approach
Focus onTerminal Bonus
Maximizing MCEV is an important goal for the company
■ At the same time minimization of Economic Capital is desired
■ Combination of valuation and risk management
€€
SEITE 37
OutlookMCEV – Almost The Same – Only Completely Different

SEITE 38
OutlookOther publications
Market Consistent Embedded Valueswww.tillinghast.com
Economic Value: from fair value to share price?www.tillinghast.com