Emailing Fundamental Analysis
43
description
Emailing Fundamental Analysis
Transcript of Emailing Fundamental Analysis


3
5
7
9
11
13
15
40
50
60
70
80
90
100
110
120
2011 2012 2013 2014 2015
Sto
ck
Pri
ce
CEB
Price EPS
HIGH OIL PRICES
OVERCAPACITY
DECLINING OIL PRICES
INDUSTRY
RATIONALIZATION
PRICE WARS
Earnings

0.4
0.45
0.5
0.55
0.6
0.65
0.7
0.75
0.8
0.85
0.9
5
8
11
14
17
20
23
Dec-13 Mar-14 Jun-14 Sep-14 Dec-14 Mar-15 Jun-15
Sto
ck
Pri
ce
DNL
Price EPS
MORE SPECIALIZATION
SIGNIFICANT MARGIN IMPROVEMENT
ASSET CONSOLIDATION
Earnings

0.4
0.5
0.6
0.7
0.8
0.9
1
1.1
1.2
1.3
1.4
10
15
20
25
30
35
40
45
2011 2012 2013 2014 2015
Sto
ck
Pri
ce
ALI
Price EPS
AGGRESSIVE LAUNCHES
MARGIN IMPROVEMENT
BRAND BUILDING
STRATEGIC LAND ACQUISITION
Earnings

3.4
3.9
4.4
4.9
5.4
5.9
6.4
6.9
7.4
20
50
80
110
140
170
200
230
2011 2012 2013 2014 2015
Sto
ck
Pri
ce
URC
Price EPS
INT’L BUSINESS
CONSOLIDATION
COFFEE MIXES
RTD TEA
LOW COMMODITY PRICES
Earnings

0.4
0.45
0.5
0.55
0.6
5
6
7
8
9
10
11
Dec-13 Mar-14 Jun-14 Sep-14 Dec-14 Mar-15
Sto
ck
Pri
ce
RWM
Price EPS
SOLAIRE OPENS CITY OF DREAMS OPENS
CHINA CRACKDOWN
Earnings
150
200
250
300
350
400
450
1500
2500
3500
4500
5500
6500
7500
8500
2006 2007 2008 2009 2010 2011 2012 2013 2014 2015
Ind
ex
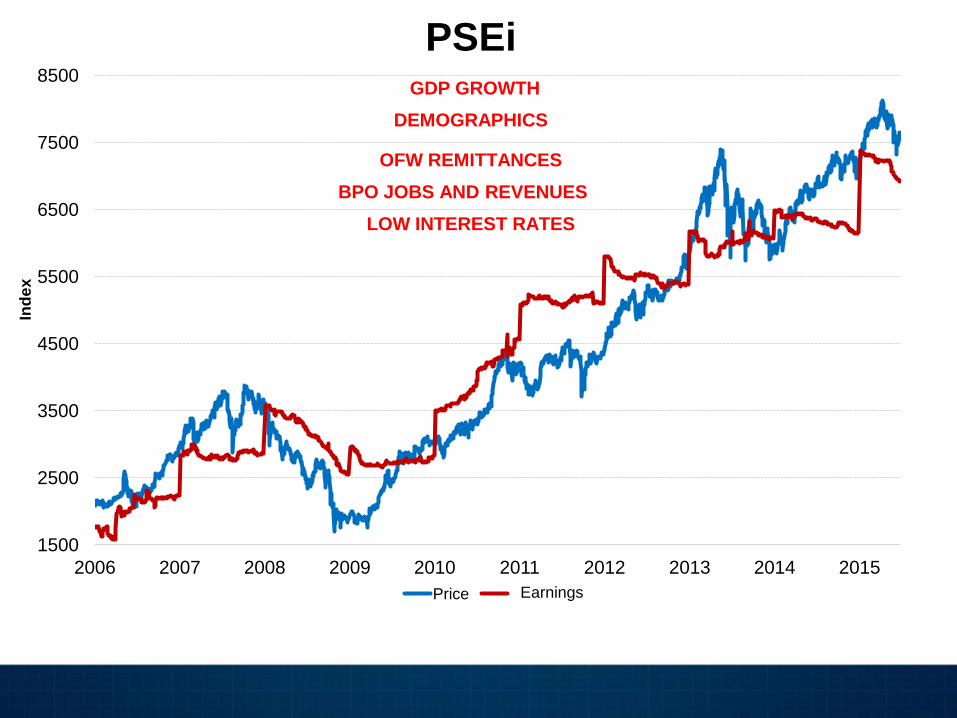
PSEi
Price EPS
GDP GROWTH
OFW REMITTANCES
BPO JOBS AND REVENUES
DEMOGRAPHICS
LOW INTEREST RATES
Earnings

How do we develop expectations?
Top down approach
Macro-Economics Analysis
Industry Analysis
Company
Analysis
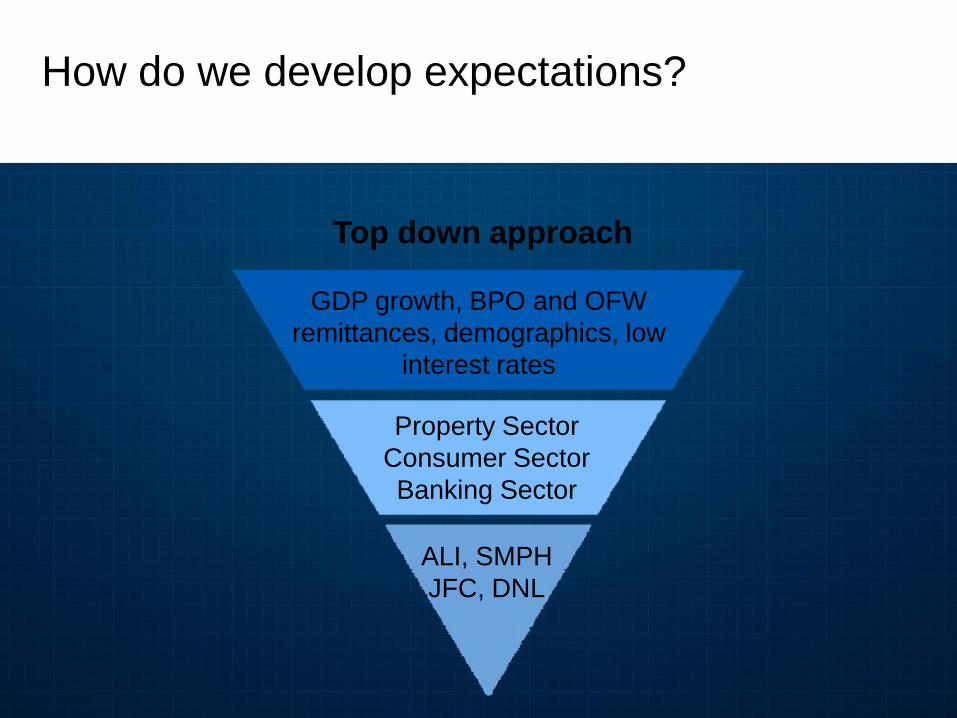
Top down approach
How do we develop expectations?
GDP growth, BPO and OFW
remittances, demographics, low
interest rates
Property Sector
Consumer Sector
Banking Sector
ALI, SMPH
JFC, DNL
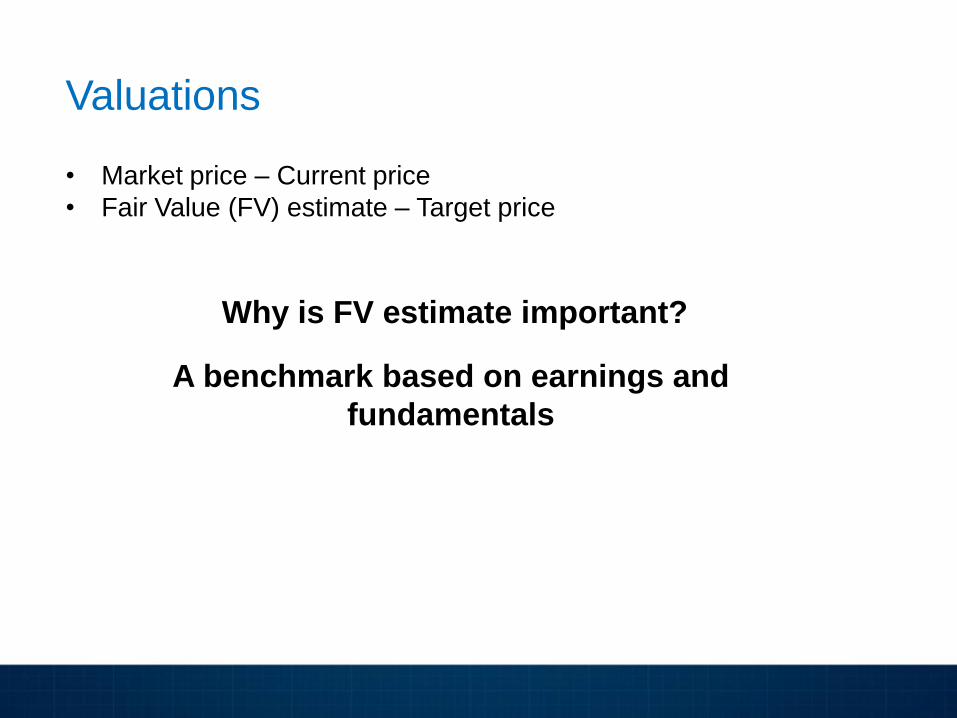
Valuations
• Market price – Current price
• Fair Value (FV) estimate – Target price
Why is FV estimate important?
A benchmark based on earnings and
fundamentals

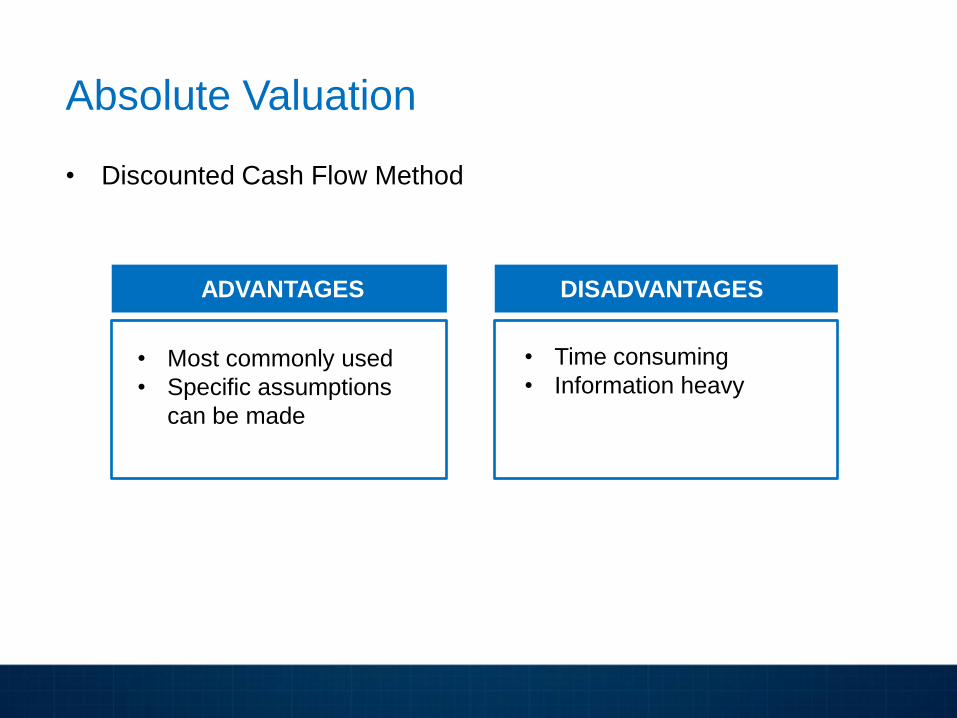
Absolute Valuation
• Discounted Cash Flow Method
ADVANTAGES DISADVANTAGES
• Most commonly used
• Specific assumptions
can be made
• Time consuming
• Information heavy

Company
Value of a company = How much cash it can make
Year 1 Cash Earnings
Year 2 Cash Earnings
Year 3 Cash Earnings
… and so on
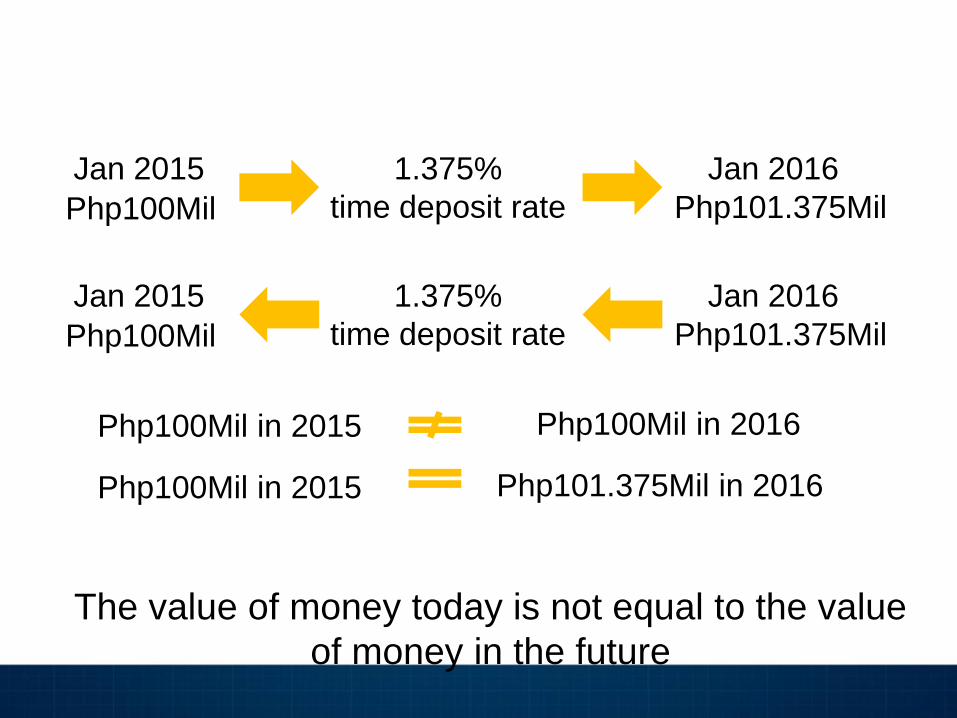
Php100Mil
1.375%
time deposit rate
Jan 2015 Jan 2016
Php101.375Mil
The value of money today is not equal to the value
of money in the future
Php100Mil
1.375%
time deposit rate
Jan 2015 Jan 2016
Php101.375Mil
Php100Mil in 2015 Php100Mil in 2016
Php100Mil in 2015 Php101.375Mil in 2016

Company
Value of a company = How much cash it can make
Year 1 Cash Earnings
Year 2 Cash Earnings
Year 3 Cash Earnings
… and so on
VALUE NOW

Company
Year 1 Cash Earnings
Year 2 Cash Earnings
Year 3 Cash Earnings
… and so on
VALUE NOW
FV estimate = Value of company per share

Absolute Valuation
• Discounted Cash Flow Method
ADVANTAGES DISADVANTAGES
• Most commonly used
• Specific assumptions
can be made
• Time consuming
• Information heavy
When do you BUY?
When do you SELL?

Relative Valuation • P/E and EPS growth
• P/BV and ROE
LOOP – Law Of One Price
DISADVANTAGES
• Easy to apply • Comparables and
multiples can be very
subjective
ADVANTAGES
Identical assets should trade at the same price

P/E and EPS growth
General Rule: Relatively cheaper if P/E is lower
STOCK A STOCK B
Current Price: Php10 Current Price: Php100
2015 EPS: Php1 2015 EPS: Php50
10X P/E 2X P/E
EPS = Earnings
Number of shares P/E =
Current price
Earnings per share

P/E and EPS growth
Higher EPS growth justifies higher P/E
STOCK A STOCK B
10X P/E 2X P/E
2016: 100% growth EPS 2016: 0% growth EPS
Limitation of relative valuation: Looking at a point in time

Which stock looks cheap?
Which stock looks expensive?
Company EPS Growth P/E
A
B
C
D
10%
20%
15%
8%
10.0
8.0
12.0
15.0
P/E and EPS growth
Company B looks cheap
Company D looks expensive

2015E P/E EPS growth
Consumer 28.2 13%
CIC 24.9 24%
CNPF 22.5 8%
DNL 27.9 -11%
EMP 18.3 22%
JFC 34.6 16%
PGOLD 21.5 9%
PIP 19 10%
RFM 15.9 8%
RRHI 24.2 21%
URC 33 13%
P/E and EPS growth

P/E and EPS growth 2015E P/E EPS growth
Conglomerates 18.4 18%
AC 24.5 10%
AEV 15.7 9%
AGI 13.6 29%
COSCO 13.2 11%
DMC 12.1 37%
FPH 8.2 1%
GTCAP 18.8 39%
JGS 21.1 30%
LTG 23 47%
MPI 12.5 20%
SM 23 8%
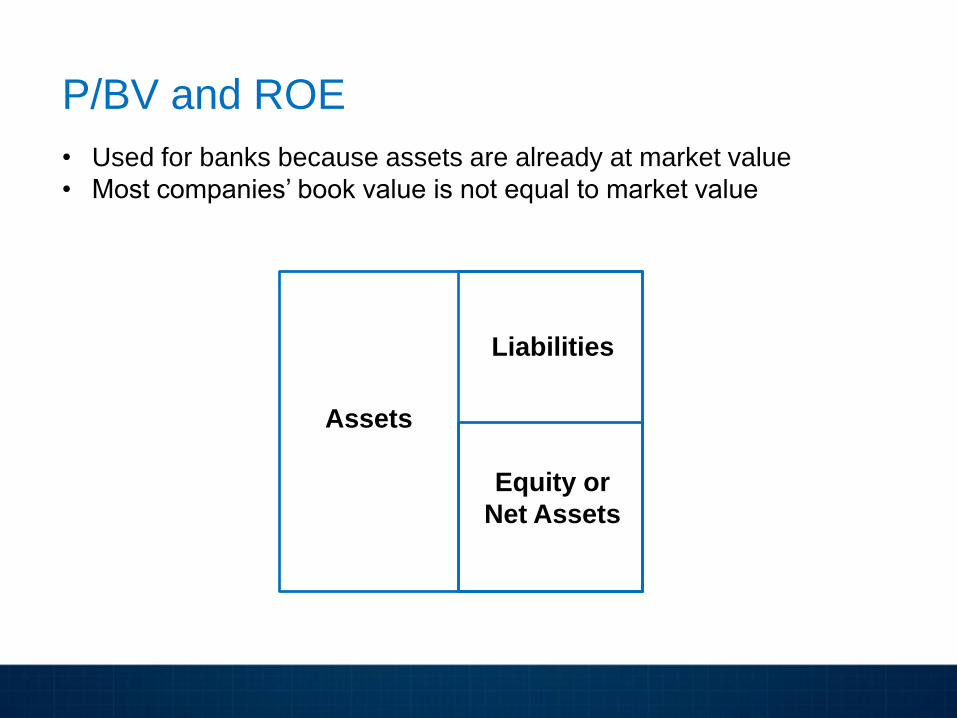
P/BV and ROE
• Used for banks because assets are already at market value
• Most companies’ book value is not equal to market value
Assets
Liabilities
Equity or
Net Assets

P/BV and ROE
General Rule: Relatively cheaper if P/BV is lower
Higher ROE justifies higher P/BV
P/BV = Current price
Book value per share
Book value per share = Equity
Number of shares
ROE = Net income
Equity

Which stock looks cheap?
Which stock looks expensive?
Company ROE P/BV
A
B
C
D
15%
12%
8%
15%
0.9
1.4
1.9
1.7
P/BV and ROE
Company A looks cheap
Company C looks expensive

P/BV and ROE
2015E P/BV ROE
Banks and Financials 1.8 13%
BDO 2.1 14%
BPI 2.6 15%
CHIB 1.3 10%
EW 1.0 11%
MBT 1.5 12%
PNB 1.0 7%
RCB 1.0 10%
SECB 1.8 16%
UBP 1.3 16%

Dividend Yield
• Salary as an investor
• Suited for more conservative investors
• Most high dividend yielding stocks are utility companies with
slower earnings growth
Ticker Company Dividend Yield
MER Manila Electric Company 5.2%
AEV Aboitiz Equity Ventures 2.7%
GLO Globe Telecom, Inc. 2.9%
TEL Philippine Long Distance Company 5.6%
Dividend Yield = Dividends per share
Current price

Where to get Information?
COL Reports
Investment Guide
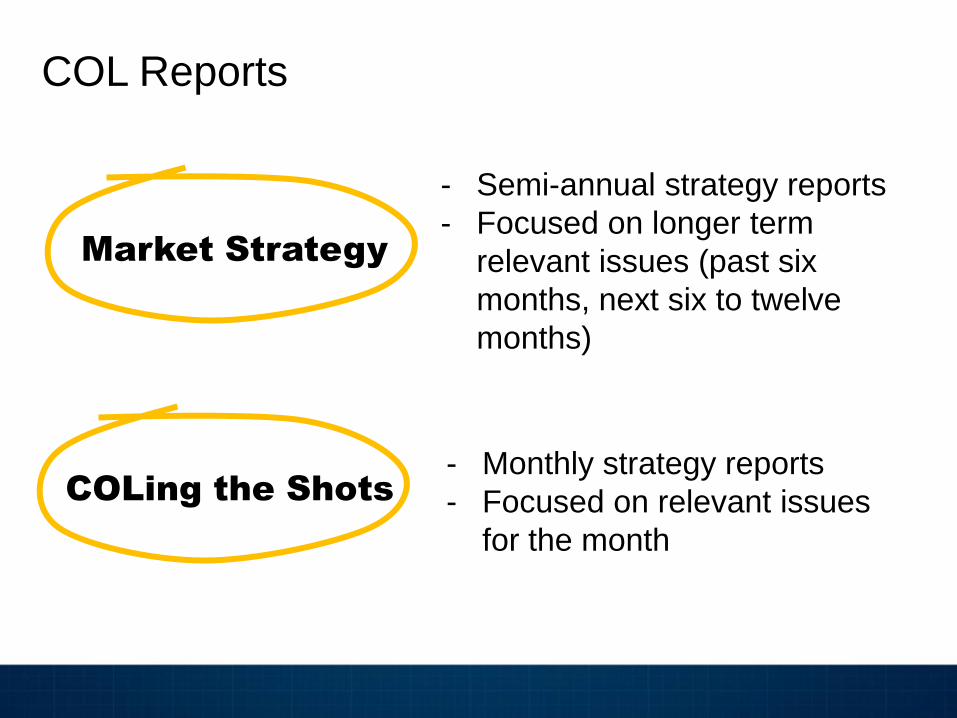
COLing the Shots
- Monthly strategy reports
- Focused on relevant issues
for the month
Market Strategy
- Semi-annual strategy reports
- Focused on longer term
relevant issues (past six
months, next six to twelve
months)
COL Reports

Company Report
- Company specific
- Earnings reports
- Meetings with management
Daily/Weekly
- Summary of both recent
economic and company
specific news
COL Reports

How to find
the reports
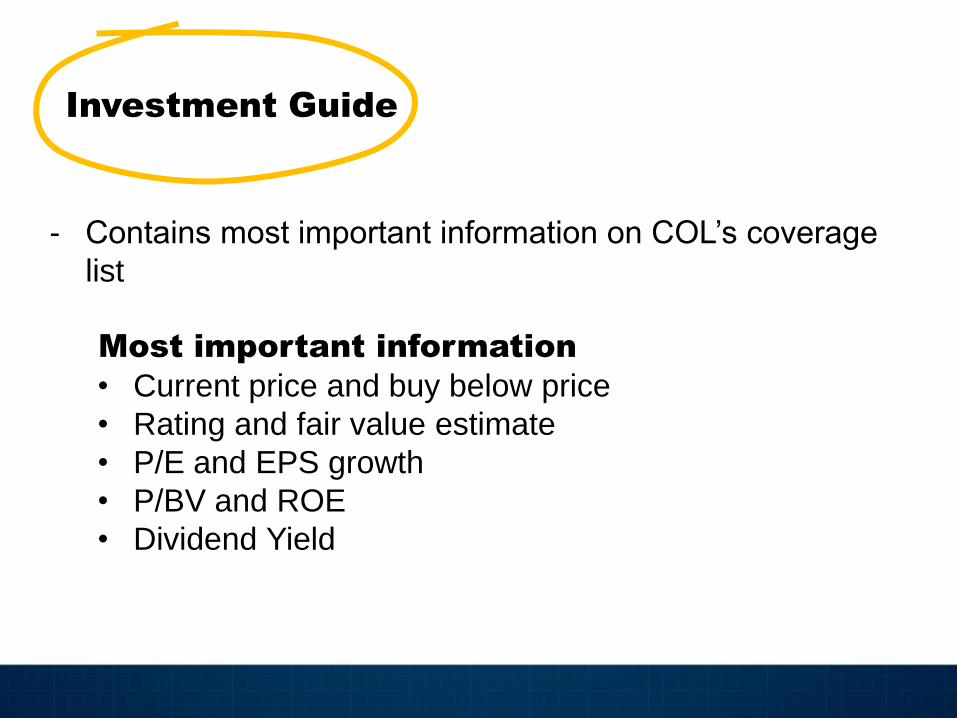
Investment Guide
- Contains most important information on COL’s coverage
list
Most important information
• Current price and buy below price
• Rating and fair value estimate
• P/E and EPS growth
• P/BV and ROE
• Dividend Yield

How to find Investment Guide
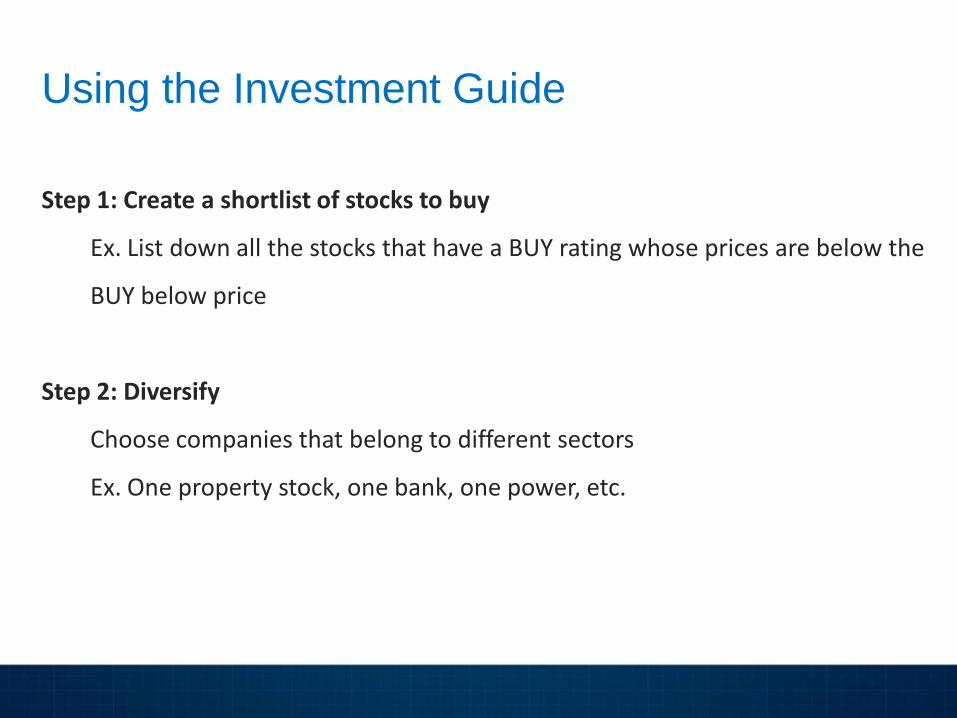
Step 1: Create a shortlist of stocks to buy
Ex. List down all the stocks that have a BUY rating whose prices are below the
BUY below price
Step 2: Diversify
Choose companies that belong to different sectors
Ex. One property stock, one bank, one power, etc.
Using the Investment Guide

Step 3: Determine your preferences Growth, value or income - Growth: high EPS growth - Value: high capital appreciation potential, low P/E, low P/BV - Income: high dividend yield Liquidity - Active traders with large portfolio: go for larger market cap stocks - Long term investor: can invest in smaller market cap stocks
Names - Major shareholders (Ayala, Aboitiz, Sy, Gokongwei, MVP, etc) - Brands (Jollibee, SM, Meralco, etc.)
Using the Investment Guide

COLing the Shots Model Portfolio
Sector Current Price Buy Below Price FV estimate
AC Conglomerates 791 701.6 877
MBT Banks 92.4 87.2 109
SMPH Property 20 18.88 23.6
FGEN Power 25.55 28.8 36
CEB Airline 85.55 124.8 156
FLI Property 1.87 1.94 2.42

Sources of Information
PSE Website
Focus on company
disclosure, especially 17A
(annual report) and 17Q
(quarterly report)
Company Website
Learn more about what
the company does
Sometimes, the company
would have press
releases, presentations
available
Newspaper Reports

“Be fearful when others are greedy and
greedy only when others are fearful”
- Warren Buffet

Invest for the Long Term
67
35
24
41
25 22 27
18 15 17 12 12 13
9 8 11 7 8
-39
-22 -16
-32
-16 -15 -11 -10 -8
-4 -5 -5 1 -3 -3 3 -2 -2
-60
-40
-20
0
20
40
60
80
1 2 5 10 20 30
Co
mp
ou
nd
An
nu
al
Re
turn
s (
%)
Years of Holding Period
Maximum and Minimum Real Holding Period Returns, 1802-1997
Maximum and Minimum Real Holding Period Returns, 1802-1997
Stocks
T-Bills
Bonds
Stocks
BondsT-Bills
26.7
17.7 14.9 16.912.4 11.6 12.6
8.8 8.3 10.67.4 7.6
-60
-40
-20
0
20
40
60
80
1 2 5 10 20 30
Years of Holding Period
Co
mp
ou
nd
An
nu
al R
etu
rns
(%
).
Stocks outperform all asset classes in the long run