Email Marketing Benchmark Report - Sign-Up.to sized organisations and public sector departments....
52
2017 Email Marketing Benchmark Report
Transcript of Email Marketing Benchmark Report - Sign-Up.to sized organisations and public sector departments....

2017Email Marketing Benchmark Report
Introduction
Welcome to the 2017 Email Benchmark Report.
When you’re running a business it can be difficult to find meaningful data to measure your marketing against. Reports on big businesses and US firms just aren’t that useful for most organisations. That’s why we created our email marketing benchmarks.
The 2017 report is our 9th annual report and contains more analysis and discussion than ever before. We’ve also included tips and advice on how to analyse and improve performance.
Please share this content.
Please feel free to share this document with your colleagues and to post excerpts and links - all we ask it that you reference Sign-Up.to and include a link to www.signupto.com when you do.
You can find the online version of this report, and all of our previous annual reports on our website.www.signupto.com/email-marketing-benchmarks/
Page 2/52

ContentsPage 3/52
1. Introduction . . . . . . . . . page 2
2. Highlights . . . . . . . . . page 6
3. Key performance by sector . . . . . . . . . page 8
4. Open and click-through rates . . . . . . . . . page 10
5. Opens / Open rate . . . . . . . . . page 12
6. Clicks / Click-through rate . . . . . . . . . page 14
7. Unsubscribes / Unsubscribe rate . . . . . . . . . page 16
8. Click-to-open / CTO rate . . . . . . . . . page 18
9. Unsubscribe-to-open / UTO rate . . . . . . . . . page 20
10. Click-through and CTO rates . . . . . . . . . page 22
11. Unsubscribe and UTO rates . . . . . . . . . page 23
12. Delivery . . . . . . . . . page 24
13. What’s changed? . . . . . . . . . page 26
- Open rate by sector . . . . . . . . . page 27
- Click-through rate by sector . . . . . . . . . page 28
- Unsubscribe rate by sector . . . . . . . . . page 29
- CTO rate by sector . . . . . . . . . page 30
- UTO rate by sector . . . . . . . . . page 31
14. Device type - Desktop vs mobile . . . . . . . . . page 32
- Desktop vs mobile - Opens . . . . . . . . . page 34
- Desktop vs mobile - Click-through . . . . . . . . . page 36
15. Marketing Automation . . . . . . . . . page 38
- Marketing Automation - Opens . . . . . . . . . page 39
- Marketing Automation - Click-through . . . . . . . . . page 40
16. Sends . . . . . . . . . page 42
- Week of the year . . . . . . . . . page 42
- Day of the week . . . . . . . . . page 44
- Hour of the day . . . . . . . . . page 45
17. Engagement . . . . . . . . . page 46
18. Additional resources . . . . . . . . . page 48
Appendix 1. Raw data . . . . . . . . . page 50
About Sign-Up.to . . . . . . . . . page 51
Contact Sign-Up.to . . . . . . . . . page 52
Section 1
Introduction
www.signupto.com
Page 4/52
Background and scope
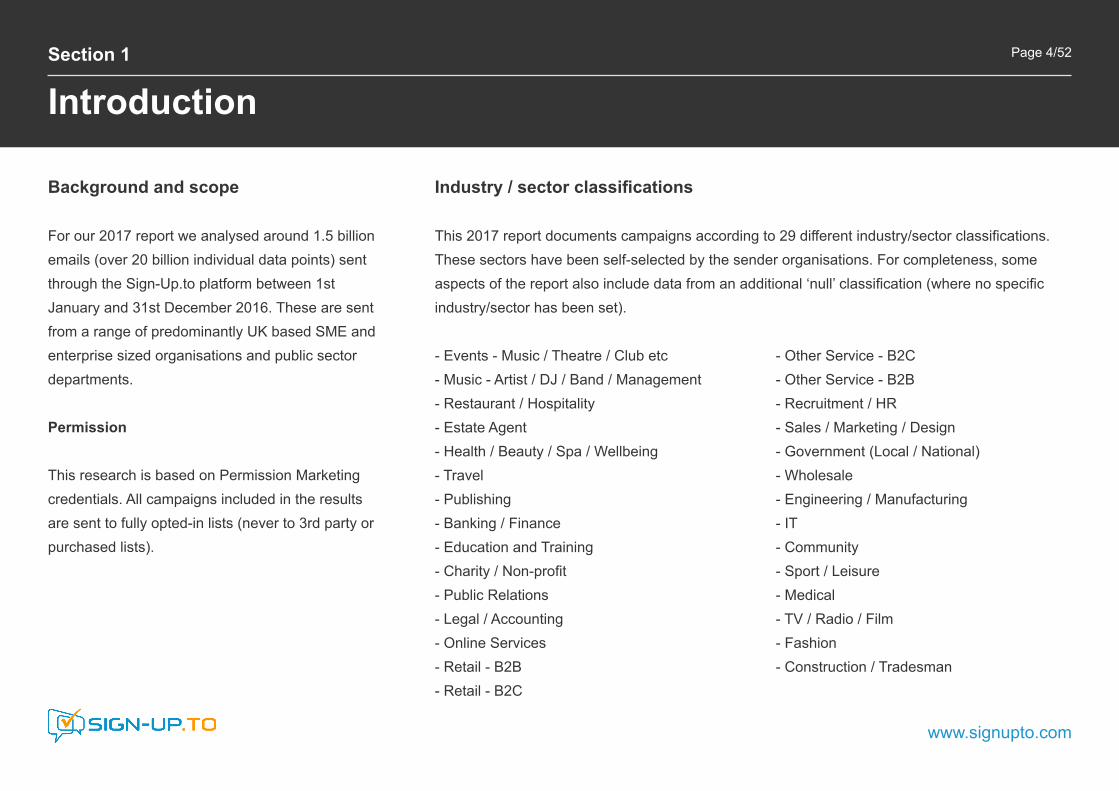
For our 2017 report we analysed around 1.5 billion emails (over 20 billion individual data points) sent through the Sign-Up.to platform between 1st January and 31st December 2016. These are sent from a range of predominantly UK based SME and enterprise sized organisations and public sector departments.
Permission
This research is based on Permission Marketing credentials. All campaigns included in the results are sent to fully opted-in lists (never to 3rd party or purchased lists).
- Events - Music / Theatre / Club etc - Music - Artist / DJ / Band / Management - Restaurant / Hospitality - Estate Agent - Health / Beauty / Spa / Wellbeing - Travel - Publishing - Banking / Finance - Education and Training - Charity / Non-profit - Public Relations - Legal / Accounting - Online Services - Retail - B2B - Retail - B2C
- Other Service - B2C - Other Service - B2B - Recruitment / HR - Sales / Marketing / Design - Government (Local / National) - Wholesale - Engineering / Manufacturing - IT - Community - Sport / Leisure - Medical - TV / Radio / Film - Fashion - Construction / Tradesman
Industry / sector classifications
This 2017 report documents campaigns according to 29 different industry/sector classifications. These sectors have been self-selected by the sender organisations. For completeness, some aspects of the report also include data from an additional ‘null’ classification (where no specific industry/sector has been set).

Section 1
Introduction
www.signupto.com
Page 5/52
Basic metrics
Unless otherwise specified all of the figures used are based on unique user actions - for example we only count the same recipient opening a campaign once. If they open that campaign again we don’t count that as another open.
• Bounced: messages returned by the receiving mail server as undeliverable.• Delivered: messages accepted for delivery by the receiving mail server (total sent - bounced).• Open rate: the proportion of delivered emails that were opened (measured by an image load or link click); i.e. number opened / delivered.• Clicks or Click-through rate: the proportion of delivered emails that had a link clicked; i.e. unique clicks / delivered.• Unsubscribe rate: the proportion of delivered emails that result in an unsubscription; i.e. unsubscribes / delivered.
All basic rates are typically expressed as a percentage.
Derived metrics
We also document ‘derived’ rates as these are a better way to compare some aspects of campaign performance. Again, unless specified otherwise only unique user actions are counted.
• Clicks-to-opens (CTO) rate: the proportion of opened emails that had a link clicked; i.e. unique clicks / opens.
• Unsubscribes-to-opens (UTO) rate: the proportion of opened emails that result in an unsubscription; i.e. unsubscribes / opens.
We use these ‘x-to-opens’ figures as ways to compare the performance of the actual campaign content because these look at what happens after the first objective of someone opening the campaign has been achieved.
All derived rates are typically expressed as a percentage.

The figure below shows a summary of the 5 standard metrics of the Benchmark Report - opens, click-throughs, unsubscribes, CTO and UTO. The open, click-through and unsubscribe rates provide a percentage measure of these actions for all campaigns, averaged across each tracked sector. Since the click-to-opens (CTO) and unsubscribe-to-opens (UTO) rates relate click and unsubscribe actions to the opened emails they are generally considered as a better way to measure the relative performance of email campaigns.
Section 2
Highlights
2016 Summary
24.79% Open rate 4.19% Click-through rate 0.49% Unsubscribe rate 11.88% Click-to-open rate 2.59% Unsubscribe-to-open rate
www.signupto.com
Page 6/52

What’s changed in the last 12 months?
Open rate 24.88% to 24.79%Click-through rate 3.42% to 4.19% Unsubscribe rate 0.52% to 0.49%Click-to-open rate 10.88% to 11.88%Unsubscribe-to-open rate 2.72% to 2.59%
What’s changed in the last 12 months?
Based on averages across all of the tracked sectors, open rate showed a slight decrease. Click-through and click-to-open (CTO) showed significant increases. The average unsubscribe and unsubscribe-to-open (UTO) rates showed a slight decrease.
Page 2/27Section 2
HighlightsPage 7/52
www.signupto.com
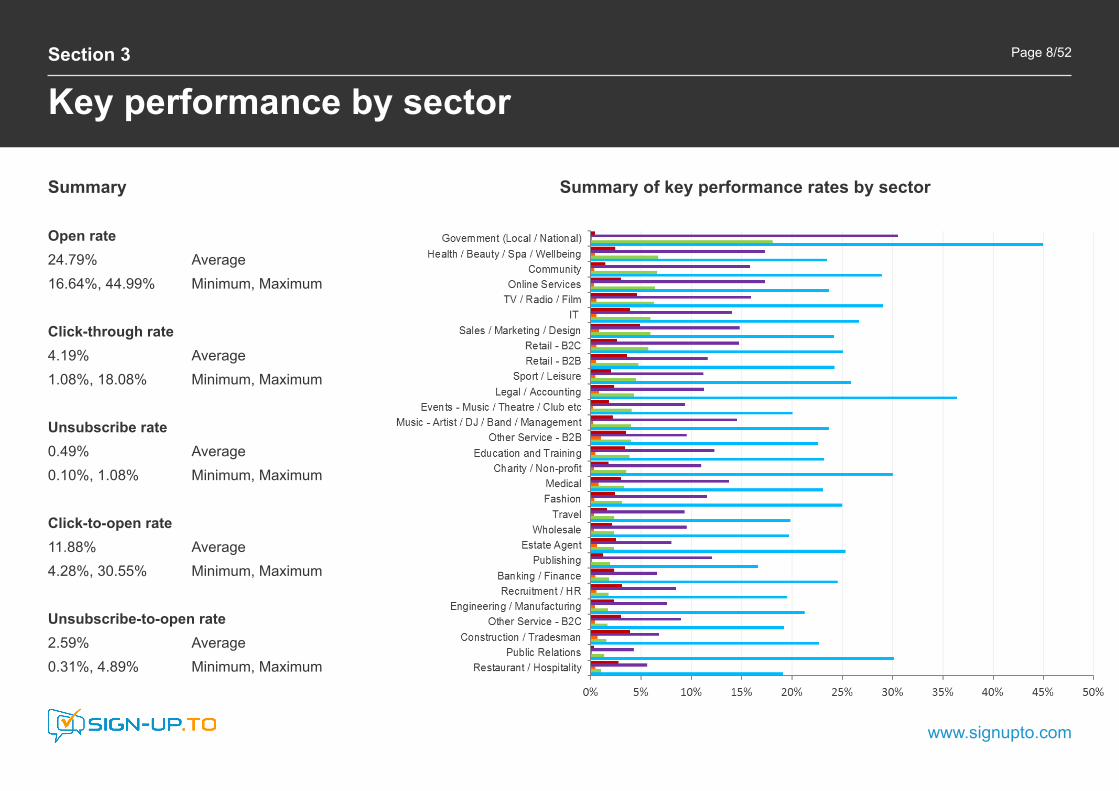
Summary
Open rate 24.79% Average 16.64%, 44.99% Minimum, Maximum
Click-through rate4.19% Average 1.08%, 18.08% Minimum, Maximum Unsubscribe rate0.49% Average 0.10%, 1.08% Minimum, Maximum Click-to-open rate11.88% Average 4.28%, 30.55% Minimum, Maximum Unsubscribe-to-open rate2.59% Average 0.31%, 4.89% Minimum, Maximum
Section 3
Key performance by sector
Summary of key performance rates by sector
www.signupto.com
Page 8/52

Section 3
Key performance by sector
Key performance rates by sector - ordered by opens
Page 9/52
www.signupto.com
Key performance rates by sector - ordered by clicks
Open rate 24.79% Average 16.64%, 44.99% Minimum, Maximum See page 12 for more detail on open rates.
Click-through rate4.19% Average 1.08%, 18.08% Minimum, Maximum See page 14 for more detail on click-through rates.
Section 4
Open and click-through rates
Summary
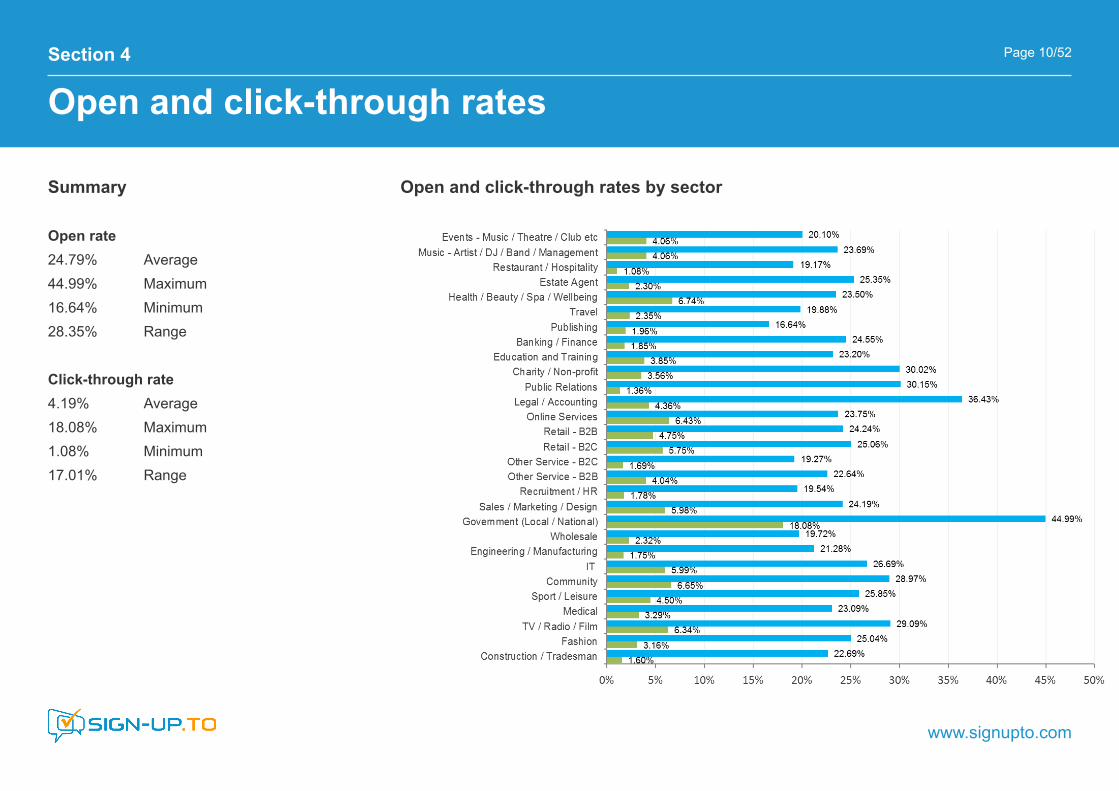
Open rate 24.79% Average 44.99% Maximum16.64% Minimum 28.35% Range
Click-through rate 4.19% Average 18.08% Maximum1.08% Minimum 17.01% Range
Open and click-through rates by sector
www.signupto.com
Page 10/52

Section 4
Open and click-through rates
www.signupto.com
Page 11/52
Open and click-through - ordered by open rate Open and click-through - ordered by click-through rate
Top open rate sectors - Government (Local / National) - Legal / Accounting - Public Relations
Top click-through rate sectors - Government (Local / National) - Health / Beauty / Spa / Wellbeing - Community

Section 5
Open / Open rate
Summary
Open rate - All sectors 24.79% Average 16.64%, 44.99% Minimum, Maximum
Open rate Top 3 sectors (by send volume) - Events - Music/Theatre/Club - TV/Radio/Film - Publishing 21.94% Average 16.64%, 29.09% Minimum, Maximum
Open rate Bottom 3 sectors (by send volume) - Medical - Fashion - Legal/Accounting 28.19% Average 23.09%, 36.43% Minimum, Maximum
Opens by sector
www.signupto.com
Page 12/52

Section 5
Open / Open rate
More about open rate
Open rate is is the number of recipients who opened (that is, viewed) your email divided by the total delivered. The result is expressed as a percentage.
Opens are tracked through the rendering of an included image pixel in each email. Since images are routinely downloaded (especially on many mobile devices) it can be a difficult metric to interpret.
There’s also no guarantee that an opened email has been actively read. That’s why although it’s a very common performance metric we wouldn’t generally consider open rate as the only (or a true) measure of campaign engagement. See section 17 for more discussion on engagement.
What impacts open rate?
Sender recognition – on average we only open around 25% of the emails we receive. Getting your subscribers to recognise and trust you as an email sender is a big first step in getting your campaigns opened. Consistently using a from-address and sender name will allow you to build up this trust, and once in place will be the first hurdle overcome.
Subject line – beyond who it is coming from the gateway to getting your email opened is your subject line (also your additional pre-header text if this is used). Your subject line is the teaser to your campaign contents, and hence why a reader should take the next step and open it. A general rule of thumb is to keep it short and interesting. If you can capture your reader’s attention and imagination in this short piece of text then an open is much more likely.
Timing – the timing of an email delivery is an important part of being relevant. A large proportion of emails are opened within the first hour or so after delivery so this is an important window of opportunity. Catching your reader at a time when the message is both convenient and timely can have a big impact on whether or not it is opened. It’s going to differ widely but understanding the relationship between your objective, your audience and the nature of your content will provide valuable insight into when might be an optimum time to hit ‘send’. See section 16 for more discussion on timing.
www.signupto.com
Page 13/52
Section 6
Clicks / Click-through rate
Summary
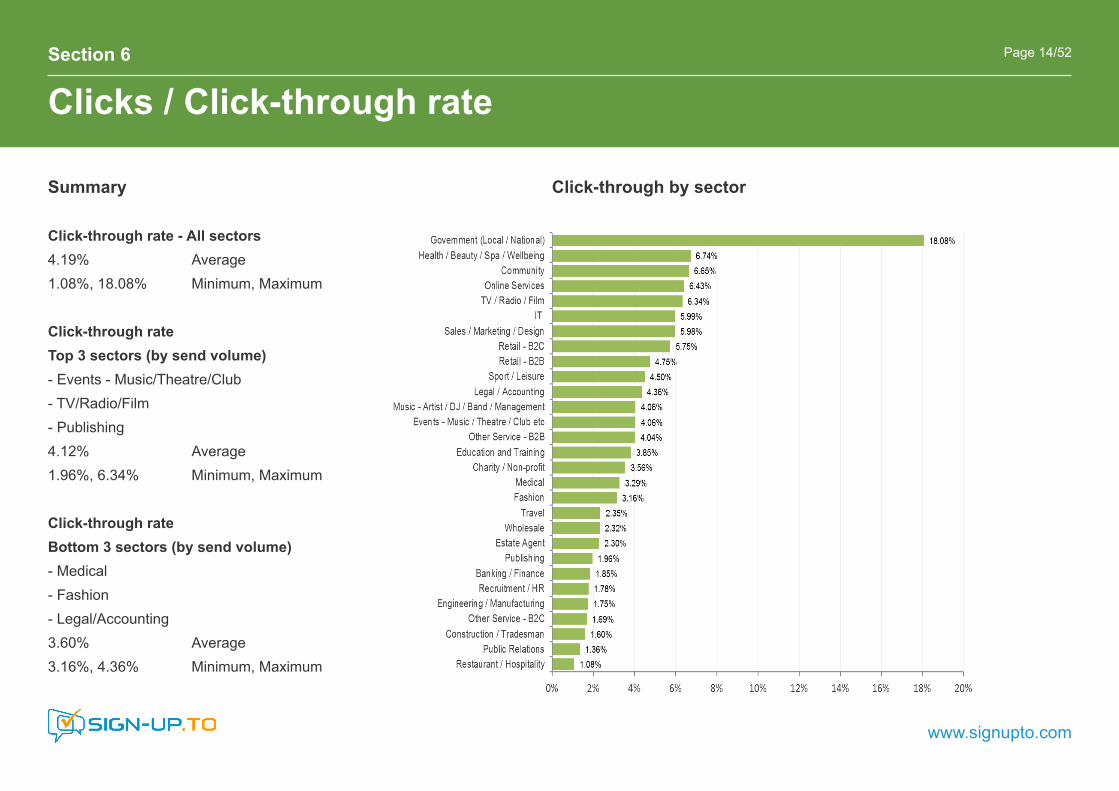
Click-through rate - All sectors 4.19% Average 1.08%, 18.08% Minimum, Maximum
Click-through rate Top 3 sectors (by send volume) - Events - Music/Theatre/Club - TV/Radio/Film - Publishing 4.12% Average 1.96%, 6.34% Minimum, Maximum
Click-through rate Bottom 3 sectors (by send volume) - Medical - Fashion - Legal/Accounting 3.60% Average 3.16%, 4.36% Minimum, Maximum
Click-through by sector
www.signupto.com
Page 14/52

Section 6
Clicks / Click-through rate
More about click-through rate
Click-through rate is defined as the number of unique clicks divided by the total delivered. The result is expressed as a percentage. You may also see this referred to as the click-to-deliver rate.
Since it requires both a successful open and a conscious completion action by the recipient click-through rate is generally a better measure of campaign engagement than open rate. It helps you to differentiate the motivation for opening your campaign and for subsequent interaction with your content.
For a more in-depth assessment always review your click-through results in relation to your click-to-open rate and ultimately to any specific goal-based objectives - See section 8.
What impacts click-through rate?
Content – your campaign has arrived and it’s been opened, so there’s a fair chance that it will now be read. It’s important to understand that people commonly skim read content. This applies to all content, but it’s especially evident with websites and emails. Many of your audience will be reading your email on a mobile or a tablet so make it quick and easy for your readers to find and digest the key points of your message. If you can do this well the core of your message will still be conveyed even if it is not read in detail.
Relevance – we engage with content which is relevant to us as individuals. Even adding a simple personalised greeting can add a sense of relevance. Precision marketing allows you to profile your audience according to various characteristics and then target content which is more relevant to them. Techniques like Dynamic Content can do this automatically but even a relatively simple differentiation of audience and associated content will have a dramatic effect on performance.
Call to action – making your call to action easy to find, easy to understand and easy to click will increase the likelihood that this action will be taken. Text links can be fiddly, especially on a mobile device. Images are good but it’s not always clear that the image is also a call to action, and remember, images are not always displayed. Dedicated HTML call to action buttons work best. Make them easy to find and include a concise, clear and irresistible instruction to act.
www.signupto.com
Page 15/52

Section 7
Unsubscribes / Unsubscribe rate
Summary
Unsubscribe rate - All sectors 0.49% Average 0.10%, 1.08% Minimum, Maximum
Unsubscribe rate Top 3 sectors (by send volume) - Events - Music/Theatre/Club - TV/Radio/Film - Publishing 0.35% Average 0.19%, 0.60% Minimum, Maximum
Unsubscribe rate Bottom 3 sectors (by send volume) - Medical - Fashion - Legal/Accounting 0.67% Average 0.37%, 0.87% Minimum, Maximum
Unsubscribes by sector
www.signupto.com
Page 16/52
Section 7
Unsubscribes / Unsubscribe rate
Some considerations
Unsubscribe is a clear indication that all is not right so it’s worthwhile taking some steps to understand and improve in this area.
• Understand if a rise in unsubscribes is a one-off or a growing trend. This will help you identify and address the cause.
• Check your data. Do you have permission and have you used this data in the way anticipated by your readers?
• Are you being relevant. Your reader cares enough to open your message, so unsubscribe is a clear indication that you are not addressing their needs or wishes.
• Ultimately, if unsubscribe is the desired action make it quick and easy to do and make sure your do not contact list is updated.
Understanding unsubscribes
The unsubscribe rate is the proportion of delivered emails that result in an unsubscription; i.e. unsubscribes / delivered. It is normally expressed as a percentage.
The option to unsubscribe, both at the point of data collection and within every subsequent communication, is a legal requirement of any email marketing activity.
The unsubscribe metric measures those who specifically request to opt-out using the embedded unsubscribe option. As a generally quoted performance metric it doesn’t typically include non-automated unsubscribes, i.e. those who reply or otherwise contact you to manually unsubscribe.
Unsubscribes aren’t something that you usually want to see when you’re managing your email marketing, but they can actually be good for you, so don’t be afraid of making it easy for people to opt-out. Put your unsubscribe option at the bottom of every email where people expect to find it. Making it easy to unsubscribe is not only an essential part of the permission process, it will also avoid driving unhappy subscribers to complaining or marking your messages as spam.
High unsubscribe rates are an active indication of dissatisfaction. High one-off unsubscribes might just indicate a campaign that’s missed its target, but where high or growing unsubscribes is a trend it is likely to indicate more serious problems with your data, content or both.
www.signupto.com
Page 17/52
Section 8
Click-to-open / CTO rate
Summary
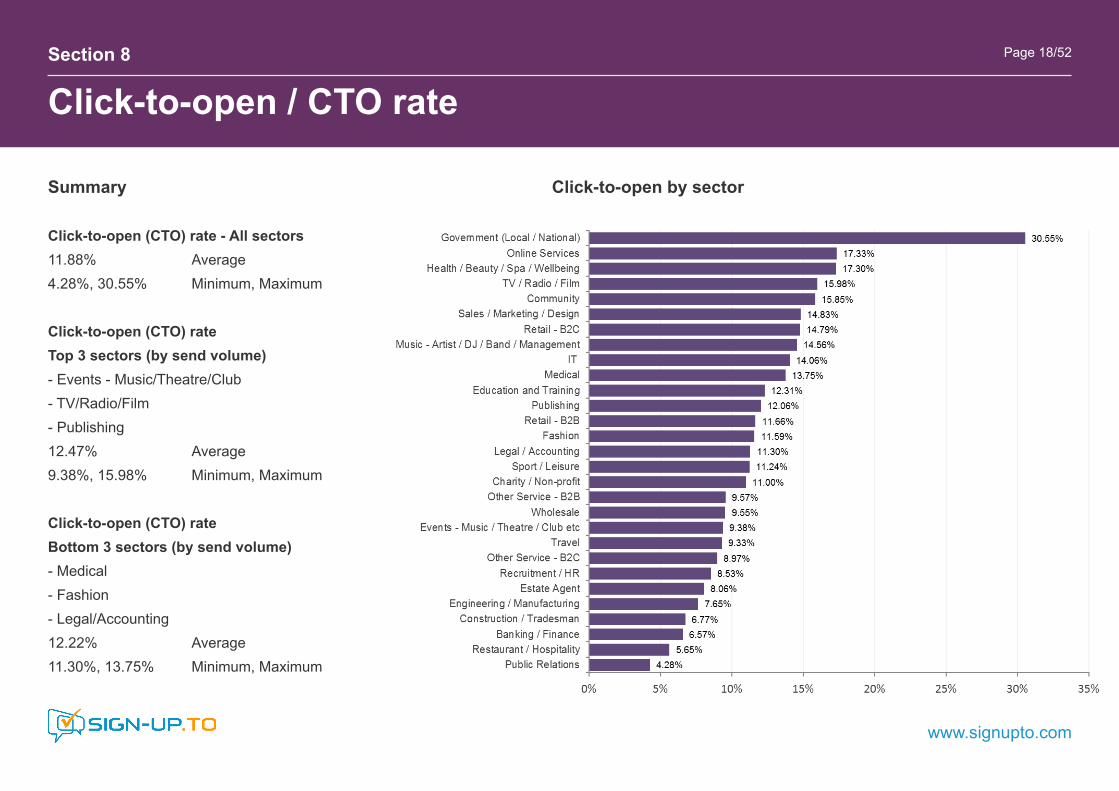
Click-to-open (CTO) rate - All sectors 11.88% Average 4.28%, 30.55% Minimum, Maximum
Click-to-open (CTO) rate Top 3 sectors (by send volume) - Events - Music/Theatre/Club - TV/Radio/Film - Publishing 12.47% Average 9.38%, 15.98% Minimum, Maximum
Click-to-open (CTO) rate Bottom 3 sectors (by send volume) - Medical - Fashion - Legal/Accounting 12.22% Average 11.30%, 13.75% Minimum, Maximum
Click-to-open by sector
www.signupto.com
Page 18/52

Section 8
Click-to-open / CTO rate
Goals and engagement
Click-to-open rate gives a basic but effective measure of campaign engagement. There are many factors which influence onward navigation from your initial message, but ultimately this comes down to the quality of your content and the strength of your next step.
Good as it is, click-to-open is still a fairly basic performance metric. For further insight there are a number of more advanced goal-based options which delve more deeply into campaign effectiveness, for example the download of additional content or, for eCommerce applications, the completion of an online purchase.
Goal-based metrics can be tracked as a one-off completion or monitored to provide behavioural insight over an extended period of time.
Understanding campaign engagement
Click-to-open is the proportion of opened emails that had a link clicked. It is defined as the number of unique clicks divided by the number of opens. The result is expressed as a percentage.
Click-to-open rate gives a deeper insight into campaign performance because it looks at post-open interactions in relation to opens rather than the total delivered. This puts the focus of the metric on the performance of the actual email content (the design and relevance and the strength of your call to action), and removes factors which influenced the recipient to open the email (factors like subject line and sender recognition).
It’s important to remember that different types of email campaigns will have different objectives. Not all campaigns contain click-through links and driving a click-through may not always be the primary objective. Many campaigns also contain multiple links - that’s why we record unique instead of total clicks per open when calculating click-to-open rates.
Where campaigns contain multiple call to action links a ‘heat-map’ can be an effective way of reviewing the relative engagement with each link. Understanding how subscribers are navigating and interacting with a campaign can be valuable in planning the placement of future content.
www.signupto.com
Page 19/52
Section 9
Unsubscribe-to-open / UTO rate
Summary
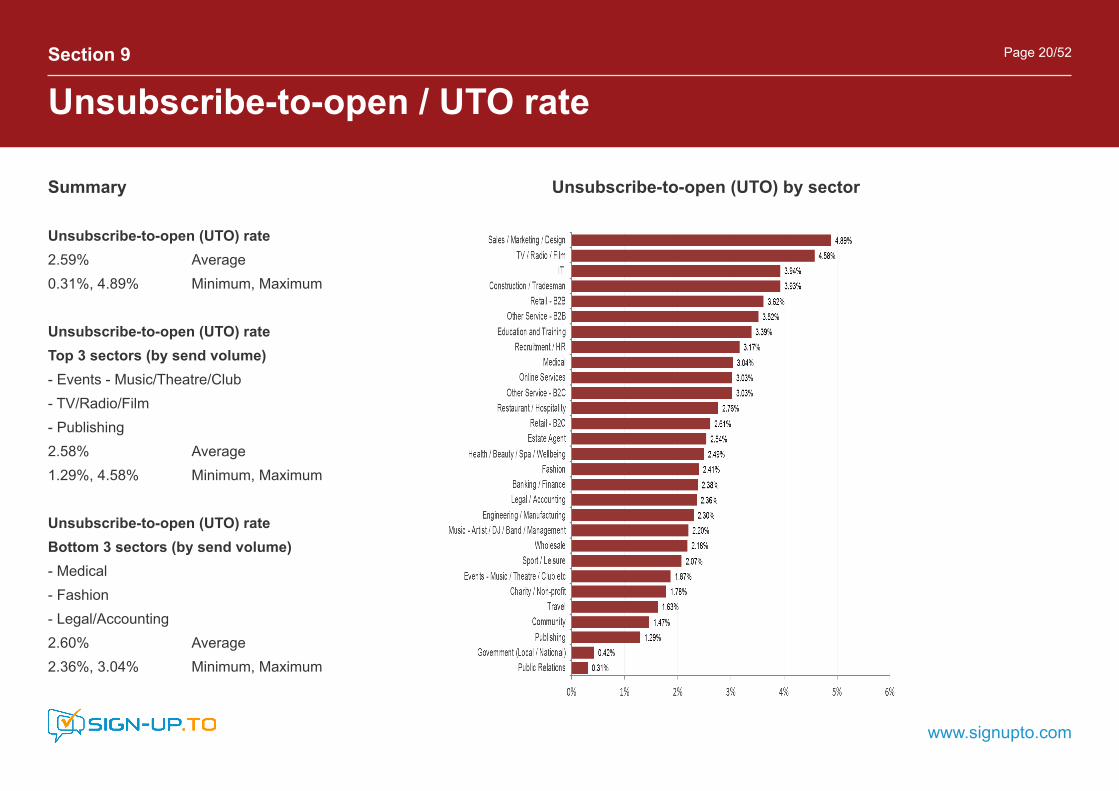
Unsubscribe-to-open (UTO) rate 2.59% Average 0.31%, 4.89% Minimum, Maximum
Unsubscribe-to-open (UTO) rate Top 3 sectors (by send volume) - Events - Music/Theatre/Club - TV/Radio/Film - Publishing 2.58% Average 1.29%, 4.58% Minimum, Maximum
Unsubscribe-to-open (UTO) rate Bottom 3 sectors (by send volume) - Medical - Fashion - Legal/Accounting 2.60% Average 2.36%, 3.04% Minimum, Maximum
Unsubscribe-to-open (UTO) by sector
www.signupto.com
Page 20/52
Section 9
Unsubscribe-to-open / UTO rate
Loyalty and engagement
Unsubscribing is a clear indication that all is not well. However it only provides a last resort view on how engaged (or in this case disengaged) your subscribers are.
Always provide a robust and polite unsubscribe process and try to capture some information on the reason for leaving. Also consider offering a selective unsubscribe so that readers can set individual preferences on what they receive.
Engagement
Understanding and more accurately quantifying campaign engagement is a more advanced technique. You can find more discussion on engagement as a campaign performance metric in Section 17.
Understanding subscriber loyalty
The unsubscribe-to-opens (UTO) metric provides a more insightful measure of dissatisfaction because it measures opt-out in relation to campaign opens. It is defined as the number of unsubscribes divided by the number of unique opens. The result is expressed as a percentage.
Never forget that when you send an email it’s going to a real person, and real people’s needs and interests change. Your newsletter might have been relevant to their job or hobby before, but they’ve moved on now and it’s just not right for them any more.
Unsubscribes and unsubscribes-to-opens are both useful measures of active disengagement. However, although it’s a clear negative action, unsubscribe still provides valuable information, especially if you investigate the causes and capture the reason at the point of exit.
Effective filtering means that the majority of true spam never reaches most people’s inboxes, so a majority of unsubscribes are to genuine communications. However this still leaves a significant proportion of ‘grey-mail’, that is messages that were once welcome but have since become irrelevant or redundant, but which are not actively unsubscribed. To understand the true nature of how your subscribers are receiving and interacting with your campaigns you’ll need to analyse your engagement credentials in more detail.
www.signupto.com
Page 21/52

Section 10
Click-through and click-to-open rates
Summary
Top click-through rates - Government (Local / National) - Health / Beauty / Spa / Wellbeing - Community
Top CTO rates - Government (Local / National) Ranked #1 click-through - Online Services Ranked #4 click-through - Health / Beauty / Spa / Wellbeing Ranked #2 click-through
Click-through and CTO by sector
www.signupto.com
Page 22/52
Section 11
Unsubscribe and unsubscribe-to-open rates
www.signupto.com
Page 23/52
Summary
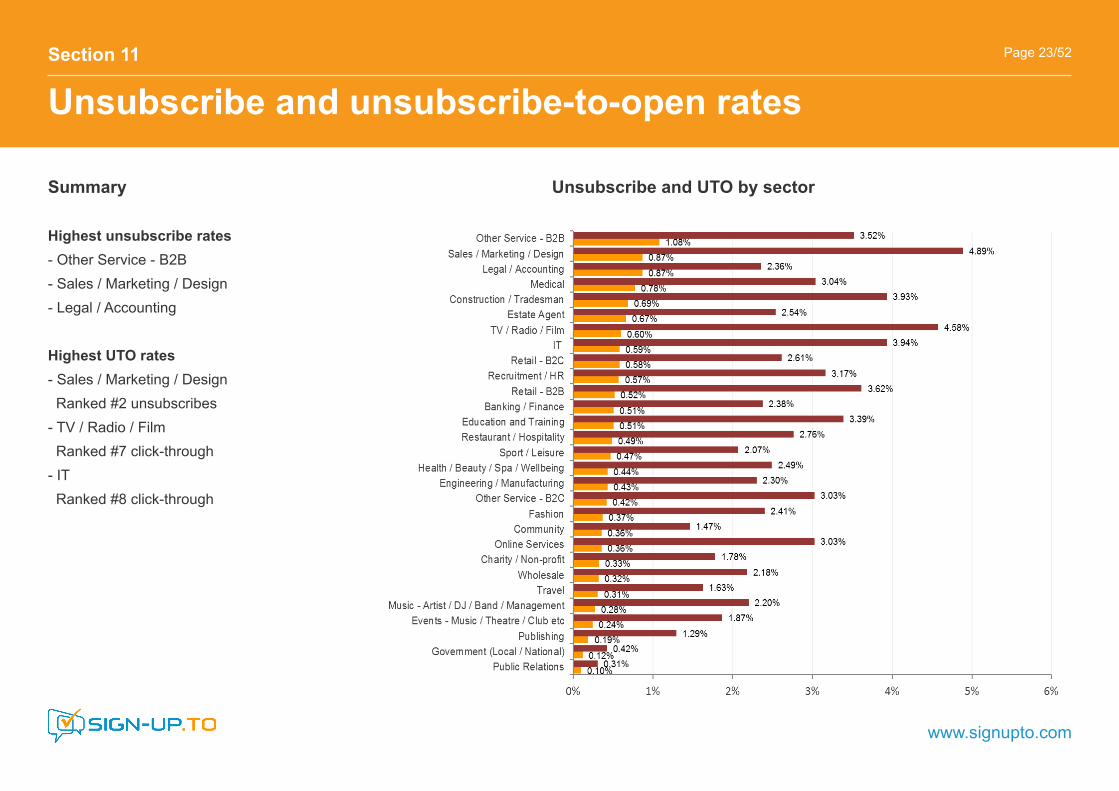
Highest unsubscribe rates - Other Service - B2B - Sales / Marketing / Design - Legal / Accounting
Highest UTO rates - Sales / Marketing / Design Ranked #2 unsubscribes - TV / Radio / Film Ranked #7 click-through - IT Ranked #8 click-through
Unsubscribe and UTO by sector

Other useful metrics
Delivered: this is the number of messages accepted for delivery. These messages got through the first phase of ISP filters (which look at the reputation of the sending domain and other technical characteristics) but this doesnʼt guarantee that the message got to the inbox as further spam filter checks may be applied furher down the line.
All being well, you should aim to be in the high 90%’s in terms of delivery percent.
Summary
Across all tracked sectors:
Average 95.94% Minimum, Maximum 91.65%, 98.39% Range 6.74%
Section 12
Delivery
www.signupto.com
Page 24/52
Delivery rate by sector

Understanding bounces
Bounced: related to the delivered metric, this is how many messages were rejected by the receiving mail servers.
When a message is bounced an error code is supplied by the rejecting server. These codes can yield useful information about the cause of the bounce and tell you if youʼre being intentionally blocked (and what to do about it).
Hard bounce – a permanent, fatal error, for example the mailbox for that user no longer exists.
Soft bounce – usually a temporary error, for example when the recipientʼs mailbox is full.
Section 12
Delivery
www.signupto.com
Page 25/52
What impacts delivery rate?
Data quality – having a robust process to collect, build and actively maintain a high quality of data is an important foundation of any email strategy. If you have other data sources, like a CRM system, integrate this directly with your email marketing. This will add multiple collection and validation points and will ensure that the data used in your email marketing will always be as up to date as possible.
Reputation – ISPs are becoming increasingly sophisticated in the way they monitor and approve email traffic, so what your recipients do with your campaigns is an important factor in your future delivery success. A history of positive interaction, such as opening, clicking links and forwarding will act in your favour - a history of poor interaction, and especially negative actions like marking as spam, will make it much more likely that your current campaign will be removed.
Content – the quality of your content is still important in getting your campaigns delivered. If your content looks and feels like spam then ISPs are likely to identify it as such and decline delivery. Check that your link destinations are working and valid. Also check your HTML code quality and items like ALT-text for images - spam emails generally lack such finesse, and avoid building your campaigns entirely with images or packing them full of words and puntuation that are likely to get them rejected.
Section 13
What’s changed?
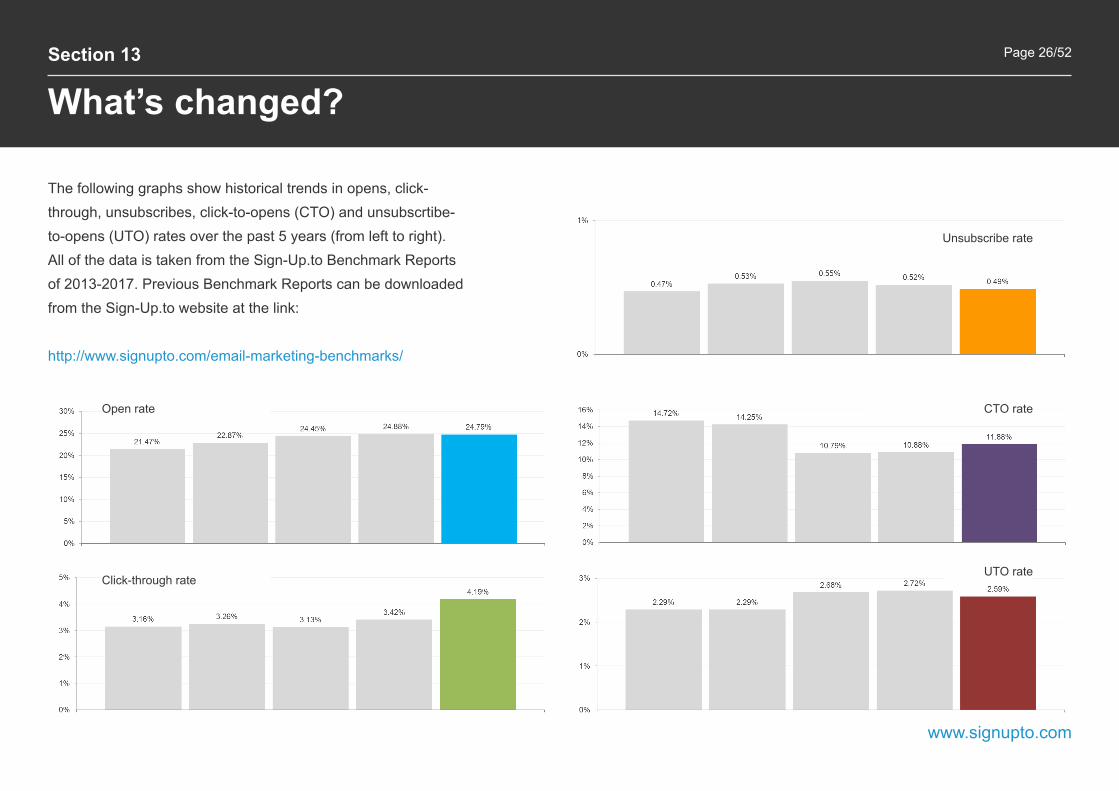
The following graphs show historical trends in opens, click-through, unsubscribes, click-to-opens (CTO) and unsubscrtibe-to-opens (UTO) rates over the past 5 years (from left to right). All of the data is taken from the Sign-Up.to Benchmark Reports of 2013-2017. Previous Benchmark Reports can be downloaded from the Sign-Up.to website at the link: http://www.signupto.com/email-marketing-benchmarks/
www.signupto.com
Page 26/52
Open rate
Click-through rate
Unsubscribe rate
CTO rate
UTO rate
Section 13
What’s changed? - Open rate by sector
Summary - Open rate
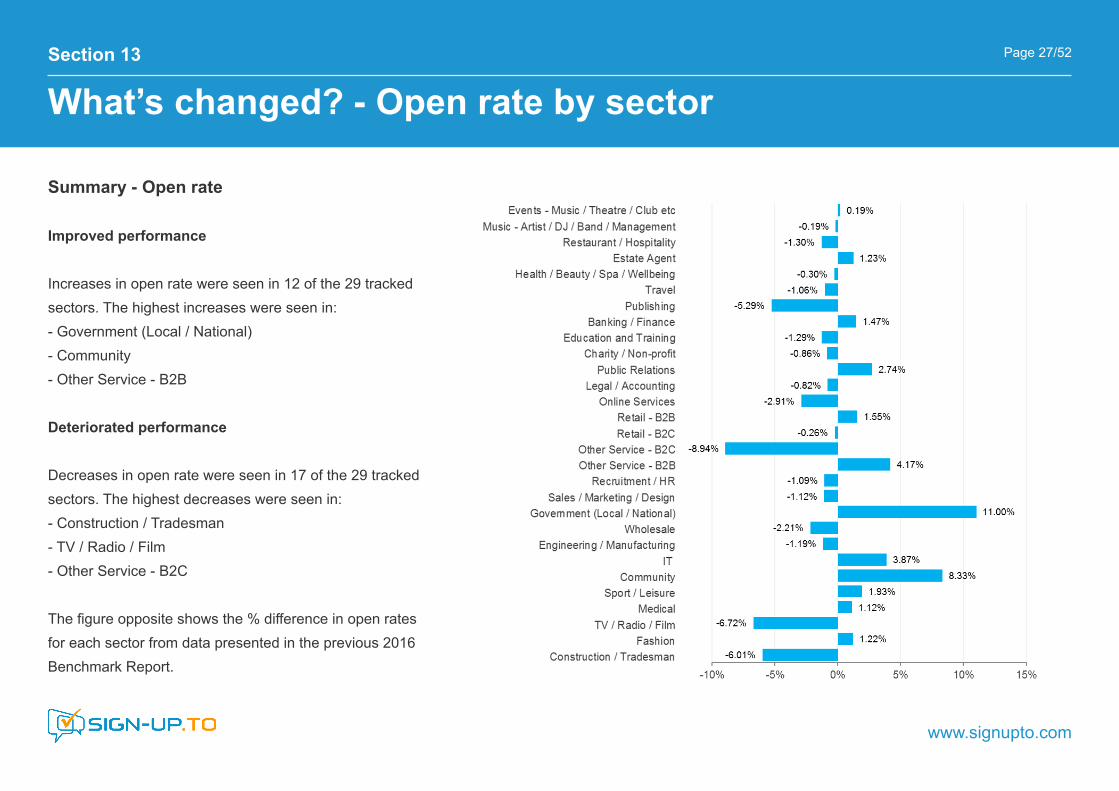
Improved performance Increases in open rate were seen in 12 of the 29 tracked sectors. The highest increases were seen in: - Government (Local / National) - Community - Other Service - B2B Deteriorated performance Decreases in open rate were seen in 17 of the 29 tracked sectors. The highest decreases were seen in: - Construction / Tradesman - TV / Radio / Film - Other Service - B2C
The figure opposite shows the % difference in open rates for each sector from data presented in the previous 2016 Benchmark Report.
www.signupto.com
Page 27/52

Section 13
What’s changed? - Click-through rate by sectorPage 28/52
Summary - Click-through rate
Improved performance
Increases in click-through rate were seen in 19 of the 29 tracked sectors. The highest increases were seen in: - Government (Local / National) - TV / Radio / Film - Community Deteriorated performance Decreases in click-through rate were seen in 10 of the 29 tracked sectors. The highest decreases were seen in: - Publishing - Other Service - B2C - Construction / Tradesman
The figure opposite shows the % difference in click-through rates for each sector from data presented in the previous 2016 Benchmark Report.
Section 13
What’s changed? - Unsubscribe rate by sector
Summary - Unsubscribe rate
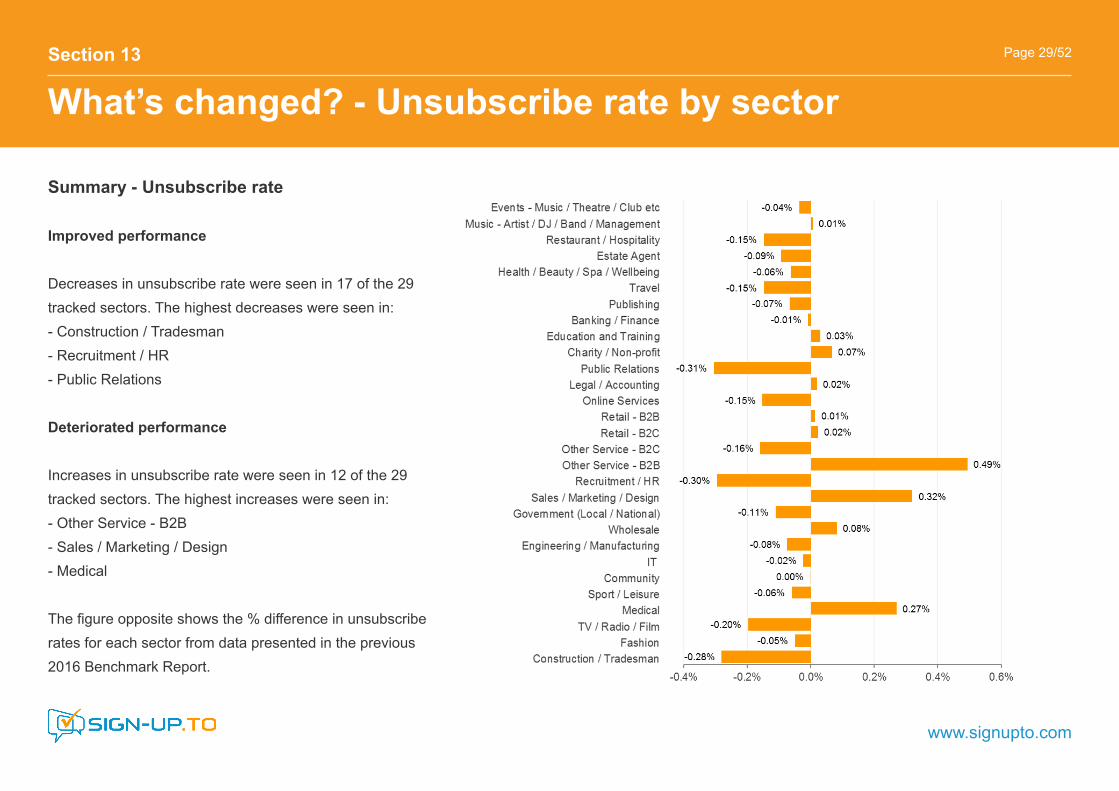
Improved performance Decreases in unsubscribe rate were seen in 17 of the 29 tracked sectors. The highest decreases were seen in: - Construction / Tradesman - Recruitment / HR - Public Relations Deteriorated performance Increases in unsubscribe rate were seen in 12 of the 29 tracked sectors. The highest increases were seen in: - Other Service - B2B - Sales / Marketing / Design - Medical
The figure opposite shows the % difference in unsubscribe rates for each sector from data presented in the previous 2016 Benchmark Report.
www.signupto.com
Page 29/52

Section 13
What’s changed? - CTO rate by sector
www.signupto.com
Page 30/52
Summary - Click-to-open (CTO) rate
Improved performance
Increases in click-to-open rate (CTO) were seen in 18 of the 29 tracked sectors. The highest increases were seen in: - TV / Radio / Film - Government (Local / National) - IT Deteriorated performance Decreases in CTO rate were seen in 11 of the 29 tracked sectors. The highest decreases were seen in: - Fashion - Other Service - B2C - Construction / Tradesman
The figure opposite shows the % difference in CTO rates for each sector from data presented in the previous 2016 Benchmark Report.

Section 13
What’s changed? - UTO rate by sector
Summary - Unsubscribe-to-open (UTO) rate
Improved performance Decreases in unsubscribe-to-open (UTO) rate were seen in 17 of the 29 tracked sectors. The highest decreases were seen in: - Public Relations - Recruitment / HR - Community Deteriorated performance Increases in UTO rate were seen in 12 of the 29 tracked sectors. The highest increases were seen in: - Sales / Marketing / Design - TV / Radio / Film - Music - Artist / DJ / Band / Management
The figure opposite shows the % difference in UTO rates for each sector from data presented in the previous 2016 Benchmark Report.
www.signupto.com
Page 31/52

Device opens
Consumption of emails on mobile devices continues to be a significant consideration. Knowing the most common device types (and operating systems) being used by your subscribers provides valuable information for optimising your design and delivery processes.
Figures show that email opens on mobile devices have risen from around 27% in 2011 to around 50% in recent years. Averaged across the open rates of all tracked sectors, although our latest data shows a small overall decrease in the proportion of opens on a mobile device, there is still a strong historical trend towards increased mobile consumption.
52.07% Desktop opens 47.93% Mobile opens
Section 14
Device type - Desktop vs mobile
Device opens on mobile - Historical trend
www.signupto.com
Page 32/52
2011
2015
2016
2017

Device type - Desktop vs mobileSection 14
www.signupto.com
Page 33/52
2. Sector averages
3. All emails
1. Above average open rate sectors
Device opens on mobile
Total versus average mobile opensAs in previous reports the mobile open rate (47.93%) has been calculated as the average from each sector. However, interpretating the data as a whole (irrespective of sector) shows a higher mobile open rate of 55.11%.
Top performing sectors by open rate Averaging across only those 11 sectors with above average overall open rate results in a mobile open rate of 51.41%.
Opens and click-throughs - Desktop vs Mobile
The overall click-through results on mobile device show significantly lower averages across all sectors than the equivalent open rates: 47.93% Opens (mobile) 63.83% Click-through (mobile)
Section 14
Desktop vs mobile - Opens
www.signupto.com
Page 34/52
Mobile device opens by sector
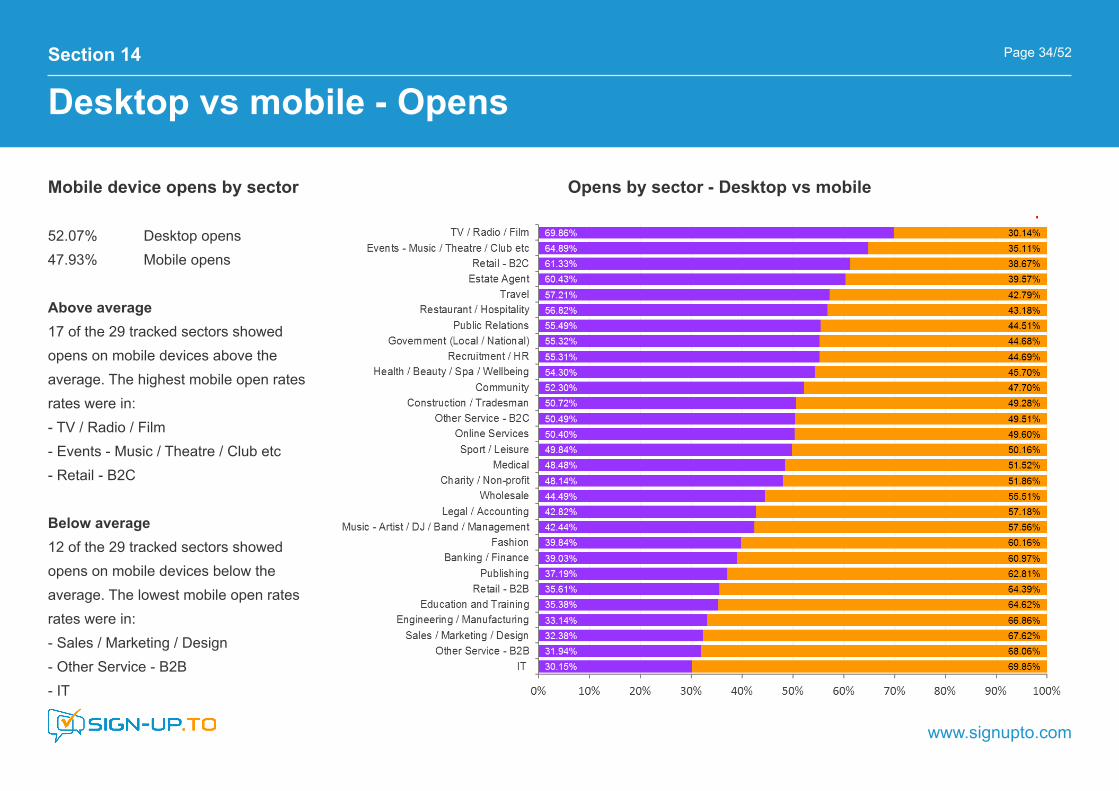
52.07% Desktop opens 47.93% Mobile opens
Above average 17 of the 29 tracked sectors showed opens on mobile devices above the average. The highest mobile open rates rates were in: - TV / Radio / Film - Events - Music / Theatre / Club etc - Retail - B2C
Below average 12 of the 29 tracked sectors showed opens on mobile devices below the average. The lowest mobile open rates rates were in: - Sales / Marketing / Design - Other Service - B2B - IT
Opens by sector - Desktop vs mobile
Section 14
Desktop vs mobile - Opens
www.signupto.com
Page 35/52
Mobile device opens by sector
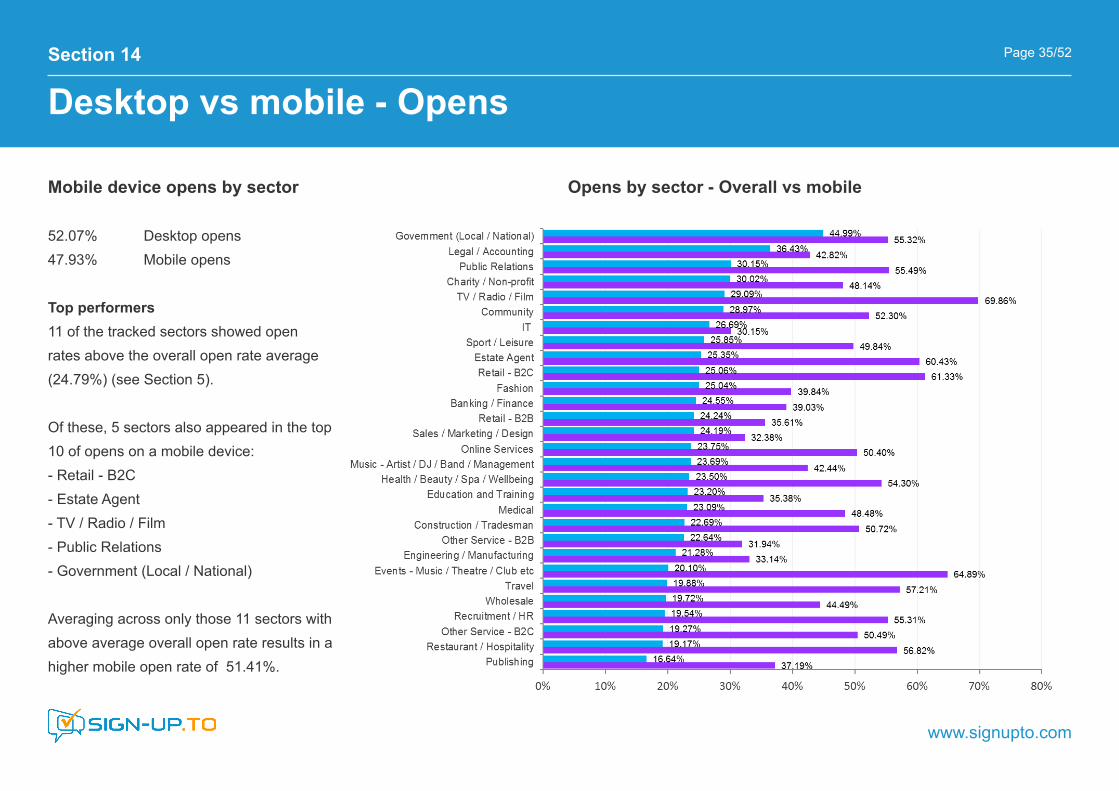
52.07% Desktop opens 47.93% Mobile opens
Top performers 11 of the tracked sectors showed open rates above the overall open rate average (24.79%) (see Section 5).
Of these, 5 sectors also appeared in the top 10 of opens on a mobile device:- Retail - B2C - Estate Agent - TV / Radio / Film- Public Relations - Government (Local / National)
Averaging across only those 11 sectors with above average overall open rate results in a higher mobile open rate of 51.41%.
Opens by sector - Overall vs mobile

Section 14
Desktop vs mobile - Click-through
www.signupto.com
Page 36/52
Click-through by sector - Desktop vs mobileMobile click-through by sector
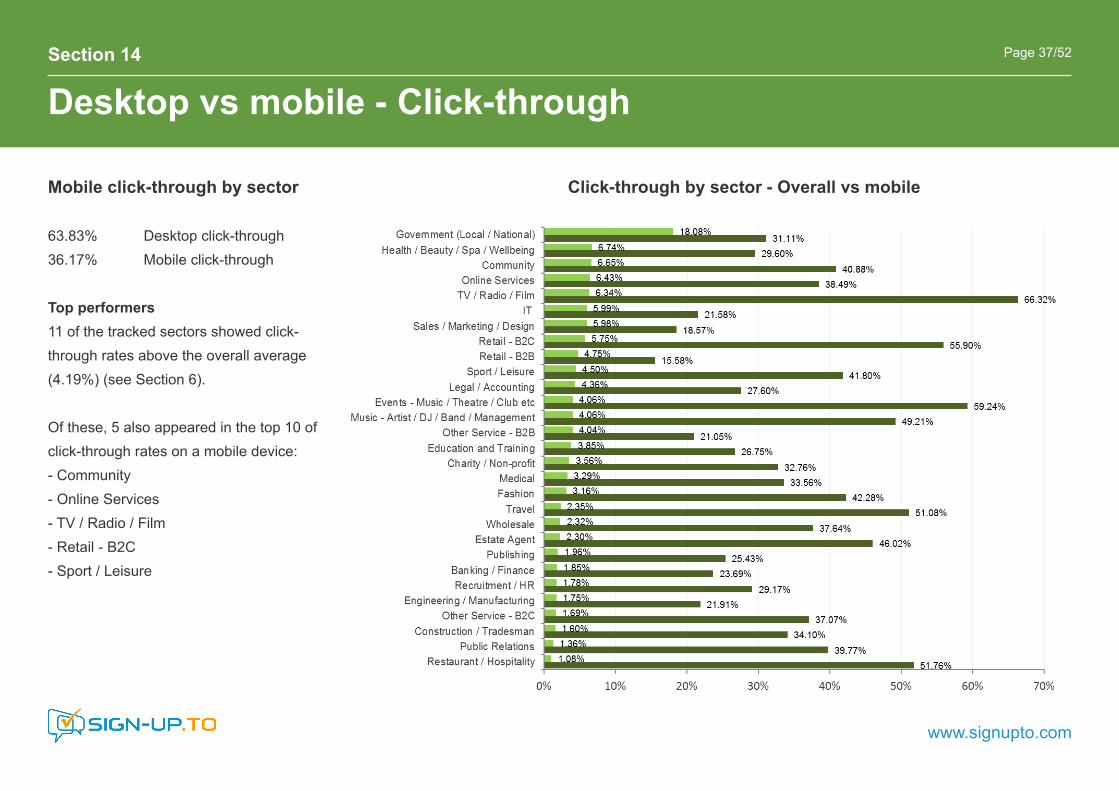
63.83% Desktop click-through 36.17% Mobile click-through
Above average 14 of the 29 tracked sectors showed clicks on mobile devices above the average. The highest mobile click rates rates were in: - TV / Radio / Film - Events - Music / Theatre / Club etc - Retail - B2C
Below average 15 of the 29 tracked sectors showed clicks on mobile devices below the average. The lowest mobile click rates rates were in: - Other Service - B2B - Sales / Marketing / Design - Retail - B2B
Mobile click-through by sector
63.83% Desktop click-through 36.17% Mobile click-through
Top performers 11 of the tracked sectors showed click-through rates above the overall average (4.19%) (see Section 6).
Of these, 5 also appeared in the top 10 of click-through rates on a mobile device:- Community - Online Services - TV / Radio / Film- Retail - B2C - Sport / Leisure
Section 14
Desktop vs mobile - Click-through
www.signupto.com
Page 37/52
Click-through by sector - Overall vs mobile

Section 15
Marketing automation
www.signupto.com
Page 38/52
Open and click-through - automated and non-automatedSummary
It’s commonly reported that automated campaigns (like welcome emails and confirmations) typically exhibit significantly higher levels of engagement than non-automated campaigns (like scheduled promotions and newsletters).
Averaging the open and click-through performance of all of the tracked sectors results in:
Overall24.79% Open rate 4.19% Click-through rate
Automated emails 60.43% Open rate 37.57% Click-through rate
Non-automated emails 15.17% Open rate 1.21% Click-through rate

Summary
The figure opposite shows open rate averages for automated (light blue) and non-automated (dark blue) email campaigns for each sector. The order is by overall open rate (highest to lowest).
Top performers18 of the 29 tracked sectors showed open rate performance for automated emails above the average. The highest rates of automated opens were seen in: - Medical - Music - Artist / DJ / Band / Management - Other Service - B2C - Public Relations- Recruitment / HR
Section 15
Marketing automation - Opens
www.signupto.com
Page 39/52
Open rate by sector - automated and non-automated

Section 15
Marketing automation - Click-through
www.signupto.com
Page 40/52
Click-through rate by sector - automated and non-automatedSummary
The figure opposite shows click-through rate averages for automated (light green) and non-automated (dar green) email campaigns for each sector. The order is by overall click-through rate (highest to lowest).
Top performers15 of the 29 tracked sectors showed click-through performance for automated emails above the average. The highest rates of automated click-through were seen in: - Medical - Other Service - B2C - Music - Artist / DJ / Band / Management - Public Relations- Engineering / Manufacturing
About marketing automation
Welcome emails, confirmations and upsell or abandoned basket campaigns are common examples of automated campaigns. High levels of engagement are typical since each message is responding with a personal, timely and targeted response to a particular subscriber action.
Planning an automated strategy? Some considerations...
Review your campaigns to see what can/can’t and should/shouldn’t be automated. It will depend on things like the frequency of the requirement, the expected volume of actions and whether or not suitable responses can be automatically generated.
Start simple - basic automation sequences need just 3 steps - a trigger, the response and the timing. Once in place more complex automation rules can be created by joining rules together.
Review performance - monitor the results regularly to review that everything is working correctly.
Section 15
Marketing automation
www.signupto.com
Page 41/52
Some considerations...
Personalise - don’t forget to personalise. Just because it’s automated (in fact because it’s automated) personalisation is just as important as in your regular campaigns.
Alternative - think about building a non-automated response into your process too. As humans, there are some who’ll always opt or prefer to respond outside of your automated process. Have a method that works for them too.
Some additional resources...
Automated emails. Robots do it better https://www.signupto.com/news/email-marketing-posts/automated-emails-robots-do-it-better/
Marketing Automation is great for event management https://www.signupto.com/news/inside-sign-upto/marketing-automation-is-great-for-event-management/

Section 16
Sends - Week of the year
www.signupto.com
Page 42/52
Sends by week of the year - All sectors
The figure below shows the proportion of the total annual emails sent per week by each sector - the average across all sectors is shown as the black trendline. As a relatively large sample taken over a range of B2C and B2B sectors, the average sends per week across all sectors shows only a minor weekly variation.
% of sends by week of the year - All sectors

Section 16
Sends - Week of the year
www.signupto.com
Page 43/52
Sends by week of the year - Sanples
The figures below show the proportion of total sends per week of the year for 4 specific sectors, each showing a higher degree of seasonal variation than the average. In each case the average weekly proportion for all sectors is shown in black as a comparison.
Average vs HR / Recruitment Average vs Retail B2C
Average vs TravelAverage vs Health / Wellbeing
Section 16
Sends - Day of the week
www.signupto.com
Page 44/52
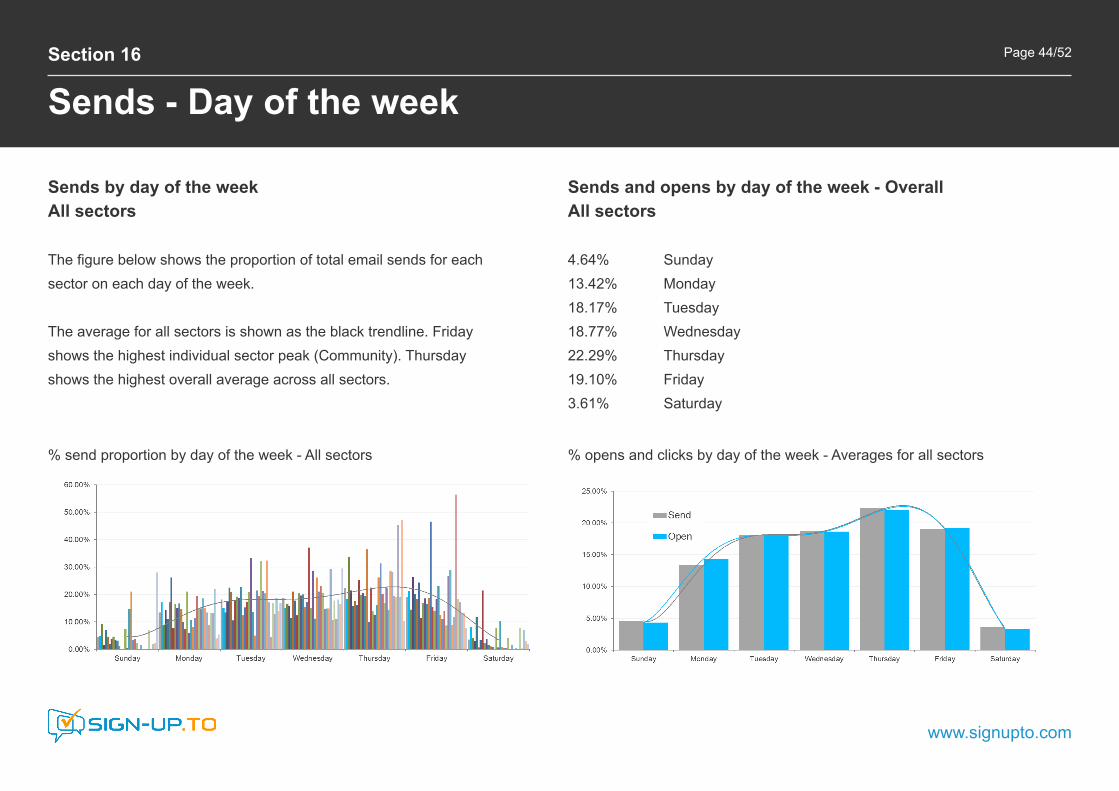
Sends by day of the week All sectors
The figure below shows the proportion of total email sends for each sector on each day of the week.
The average for all sectors is shown as the black trendline. Friday shows the highest individual sector peak (Community). Thursday shows the highest overall average across all sectors.
% send proportion by day of the week - All sectors % opens and clicks by day of the week - Averages for all sectors
Sends and opens by day of the week - Overall All sectors
4.64% Sunday 13.42% Monday 18.17% Tuesday 18.77% Wednesday 22.29% Thursday 19.10% Friday 3.61% Saturday

Section 16
Sends - Hour of the day
www.signupto.com
Page 45/52
Sends and opens by day of the week - Overall All sectors
The figure below shows the proportion of total email sends and opens averaged across all tracked sector for each hour of the day.
Peak traffic across all sectors is observed between 10-11am with a second smaller peak between 2-3pm.
Sends by hour of the day All sectors
The figure below shows the proportion of total email sends for each sector for each hour of the day.
The average for all sectors is shown as the black trendline. A midnight delivery shows the highest individual sector peak (Travel). 10-11am shows the highest overall average across all sectors.
% send proportion by hour of the day - All sectors % of opens and clicks by hour of the day - Averages for all sectors
Section 17
Engagement
www.signupto.com
Page 46/52
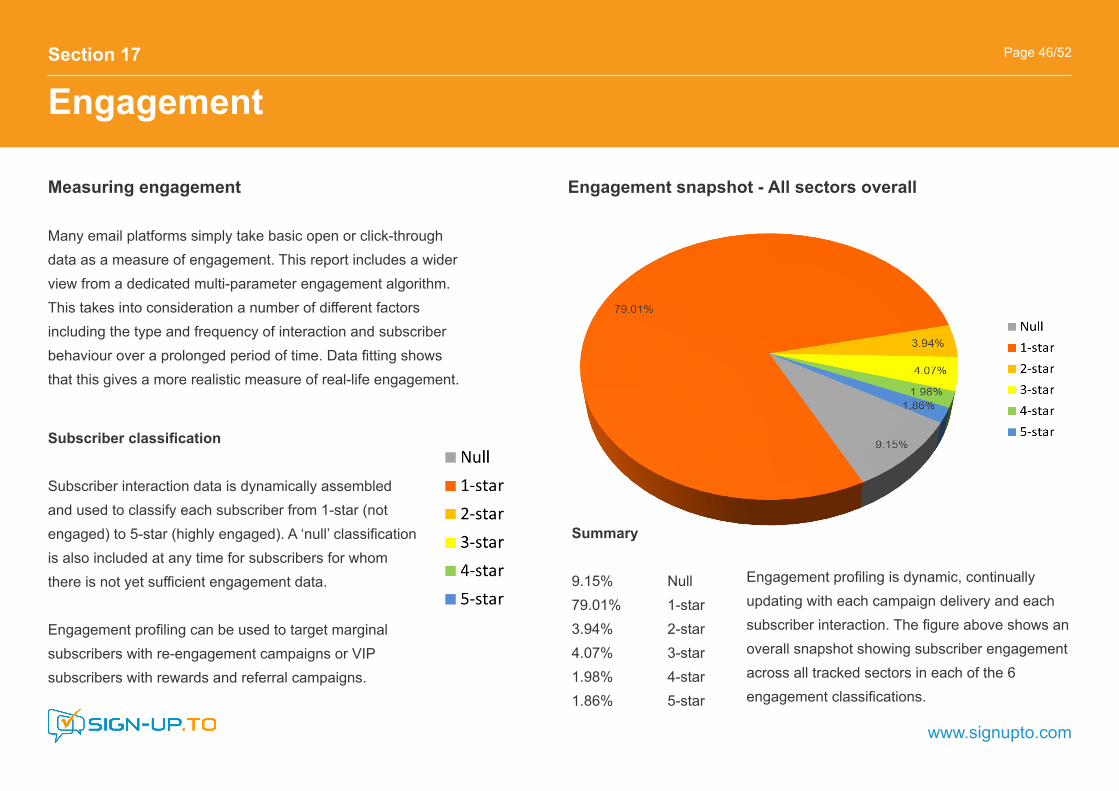
Measuring engagement
Many email platforms simply take basic open or click-through data as a measure of engagement. This report includes a wider view from a dedicated multi-parameter engagement algorithm. This takes into consideration a number of different factors including the type and frequency of interaction and subscriber behaviour over a prolonged period of time. Data fitting shows that this gives a more realistic measure of real-life engagement.
Engagement snapshot - All sectors overall
Summary 9.15% Null 79.01% 1-star 3.94% 2-star 4.07% 3-star 1.98% 4-star 1.86% 5-star
Subscriber classification
Subscriber interaction data is dynamically assembled and used to classify each subscriber from 1-star (not engaged) to 5-star (highly engaged). A ‘null’ classification is also included at any time for subscribers for whom there is not yet sufficient engagement data.
Engagement profiling can be used to target marginal subscribers with re-engagement campaigns or VIP subscribers with rewards and referral campaigns.
Engagement profiling is dynamic, continually updating with each campaign delivery and each subscriber interaction. The figure above shows an overall snapshot showing subscriber engagement across all tracked sectors in each of the 6 engagement classifications.
Section 17
Engagement
www.signupto.com
Page 47/52
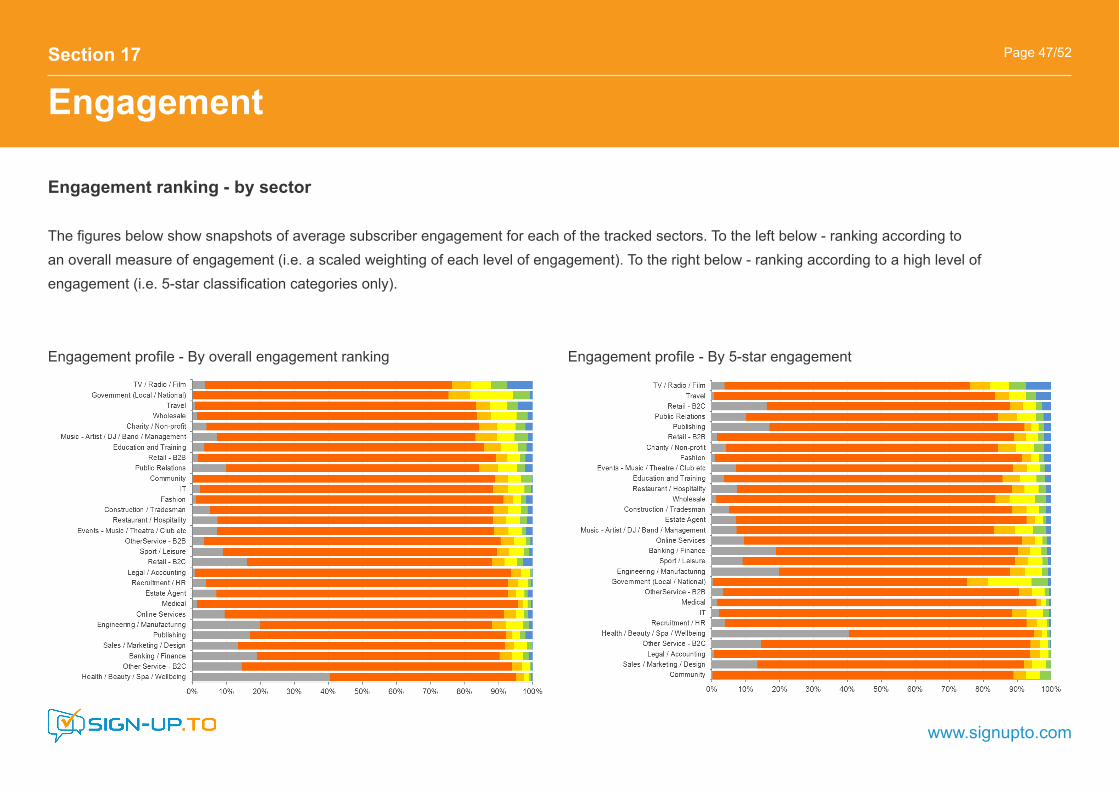
Engagement profile - By overall engagement ranking Engagement profile - By 5-star engagement
Engagement ranking - by sector
The figures below show snapshots of average subscriber engagement for each of the tracked sectors. To the left below - ranking according to an overall measure of engagement (i.e. a scaled weighting of each level of engagement). To the right below - ranking according to a high level of engagement (i.e. 5-star classification categories only).
Previous email marketing Benchmark Reports
The 2017 report is our 9th annual report. For reference, previous generations and archive compilations are available on our website: https://www.signupto.com/email-marketing-benchmarks/
Please contact us directly if you can’t find what you are looking for:Email: [email protected]
Individual benchmarking and data analysis
Some of the basic raw data is included in the Appendix of this report (page 50). However if you would like further detail on any of the aspects of this report please feel free to contact us. We’ll be happy to help. Email: [email protected]
Additional resources
www.signupto.com
Page 48/52
Email marketing guides
In addition to our annual Benchmark Report we also publish a number of other guides on various aspects of email marketing. A selection of the more popular guides are shown below. These and other guides from our library can be downloaded free from our website: https://www.signupto.com/resources/guides/
Section 18

Page 33/33
The Sign-Up.to blog
A regular forum for news and discussion related to email marketing. https://www.signupto.com/news/
Some recent posts that may be of interest:
Collect insights! Building a subscriber profile https://www.signupto.com/news/email-marketing-posts/collect-insights-building-a-subscriber-profile/Designing emails with Dynamic Content https://www.signupto.com/news/email-template-campaign-design/designing-emails-with-dynamic-content/Integrated email marketing – all in one place https://www.signupto.com/news/email-marketing-posts/integrated-email-marketing-all-in-one-place/All about email design. All in one place https://www.signupto.com/news/email-template-campaign-design/all-about-email-design-all-in-one-place/Beyond the click… Audience Insights https://www.signupto.com/news/email-marketing-posts/beyond-the-click-audience-insights/
Email marketing Discovery Mornings
An informal tour covering both essential and advanced best practice topics in email marketing. Held regularly in central London. Free to register. https://www.signupto.com/resources/events/discovery-mornings/
Additional resources
www.signupto.com
Email marketing webinar series
Regular bite-sized discussion on one aspect of email marketing – from designing the perfect email to maximising your chances of a successful campaign delivery. https://www.signupto.com/resources/events/webinars/
Page 49/52Section 18

Sector Open % Click % Unsub % CTO % UTO % Bounce % Delivery %Events - Music / Theatre / Club etc 20.10% 4.06% 0.24% 9.38% 1.87% 4.06% 95.94%Music - Artist / DJ / Band / Management 23.69% 4.06% 0.28% 14.56% 2.20% 3.71% 96.29%Restaurant / Hospitality 19.17% 1.08% 0.49% 5.65% 2.76% 3.27% 96.73%Estate Agent 25.35% 2.30% 0.67% 8.06% 2.54% 2.50% 97.50%Health / Beauty / Spa / Wellbeing 23.50% 6.74% 0.44% 17.30% 2.49% 3.76% 96.24%Travel 19.88% 2.35% 0.31% 9.33% 1.63% 3.00% 97.00%Publishing 16.64% 1.96% 0.19% 12.06% 1.29% 2.85% 97.15%Banking / Finance 24.55% 1.85% 0.51% 6.57% 2.38% 4.86% 95.14%Education and Training 23.20% 3.85% 0.51% 12.31% 3.39% 4.25% 95.75%Charity / Non-profit 30.02% 3.56% 0.33% 11.00% 1.78% 2.14% 97.86%Public Relations 30.15% 1.36% 0.10% 4.28% 0.31% 1.61% 98.39%Legal / Accounting 36.43% 4.36% 0.87% 11.30% 2.36% 4.42% 95.58%Online Services 23.75% 6.43% 0.36% 17.33% 3.03% 4.01% 95.99%Retail - B2B 24.24% 4.75% 0.52% 11.66% 3.62% 6.06% 93.94%Retail - B2C 25.06% 5.75% 0.58% 14.79% 2.61% 1.70% 98.30%Other Service - B2C 19.27% 1.69% 0.42% 8.97% 3.03% 2.99% 97.01%Other Service - B2B 22.64% 4.04% 1.08% 9.57% 3.52% 5.12% 94.88%Recruitment / HR 19.54% 1.78% 0.57% 8.53% 3.17% 5.78% 94.22%Sales / Marketing / Design 24.19% 5.98% 0.87% 14.83% 4.89% 8.35% 91.65%Government (Local / National) 44.99% 18.08% 0.12% 30.55% 0.42% 1.89% 98.11%Wholesale 19.72% 2.32% 0.32% 9.55% 2.18% 3.55% 96.45%Engineering / Manufacturing 21.28% 1.75% 0.43% 7.65% 2.30% 5.44% 94.56%IT 26.69% 5.99% 0.59% 14.06% 3.94% 7.77% 92.23%Community 28.97% 6.65% 0.36% 15.85% 1.47% 1.81% 98.19%Sport / Leisure 25.85% 4.50% 0.47% 11.24% 2.07% 3.48% 96.52%Medical 23.09% 3.29% 0.78% 13.75% 3.04% 5.04% 94.96%TV / Radio / Film 29.09% 6.34% 0.60% 15.98% 4.58% 5.04% 94.96%Fashion 25.04% 3.16% 0.37% 11.59% 2.41% 3.84% 96.16%Construction / Tradesman 22.69% 1.60% 0.69% 6.77% 3.93% 5.35% 94.65%
Raw dataAppendix 1 Page 50/52

Professional marketing software and services
Sign-Up.to is an email and SMS marketing provider for professional businesses. Based on an established and popular self-service platform we specialise in helping businesses design, implement and execute high performing email marketing strategies.
Alongside our easy to use self-service platform we offer a range of managed services, including bespoke platform set-up and integration, advanced feature customisation and professional campaign outsourcing.
We built Sign-Up.to because we saw the need for an easy to use software platform that allowed professional marketers to move beyond the more ‘standard’ email features. Mobile responsive emails, marketing automation and precision audience targeting are just some of reasons our customers choose Sign-Up.to as the next step in their email marketing journey.
Further information https://www.signupto.com/ Free platfform trial https://www.signupto.com/trial/
About Sign-Up.toPage 51/52

Contact Sign-Up.to
By telephone +44 (0) 20 3355 2631By email [email protected] www.signupto.com
Sign-Up.to St. Andrews House Woking Surrey GU21 6EB United Kingdom
www.signupto.com
© 2017 Sign-Up Technologies Ltd. (a member of HEG)
Current revision: January 2017
Page 52/52