EMA Foundation’s Institute of Postal Studies Presents...EMA Foundation’s . Institute of Postal...
19
EMA Foundation’s Institute of Postal Studies Presents: 1 Prepared by Cheryl Chapman, International Paper and EMA Foundation and Peter Johnson, PhD, Principal, mLightenment Research
Transcript of EMA Foundation’s Institute of Postal Studies Presents...EMA Foundation’s . Institute of Postal...

EMA Foundation’s Institute of Postal Studies Presents:
1
Prepared by Cheryl Chapman, International Paper and EMA Foundation
and Peter Johnson, PhD, Principal, mLightenment Research
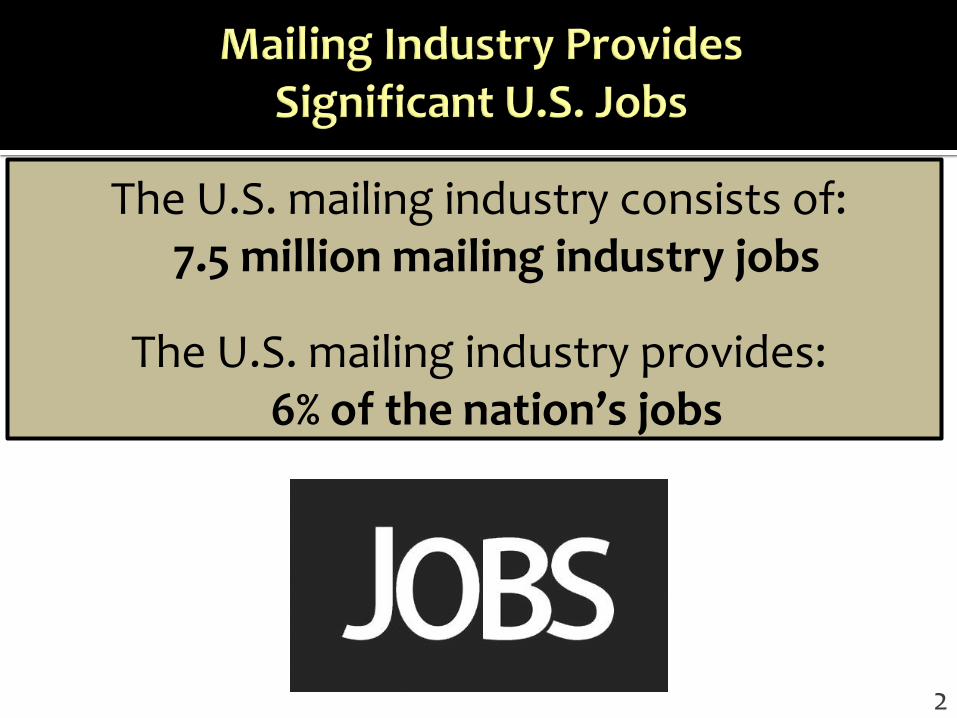
The U.S. mailing industry consists of: 7.5 million mailing industry jobs
The U.S. mailing industry provides: 6% of the nation’s jobs
2
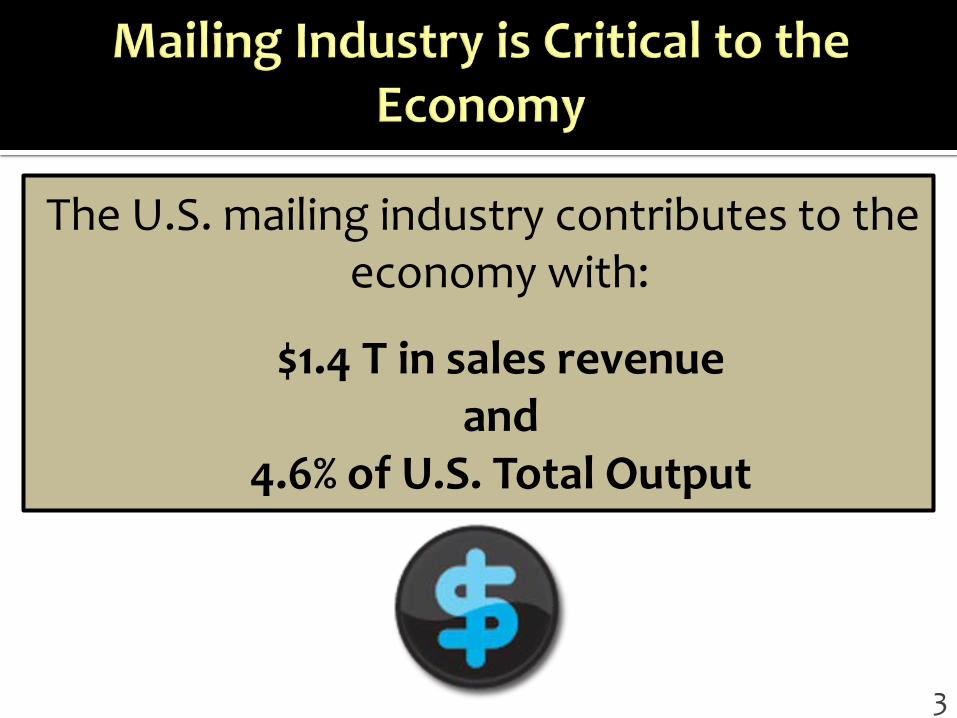
The U.S. mailing industry contributes to the economy with:
$1.4 T in sales revenue and
4.6% of U.S. Total Output
3
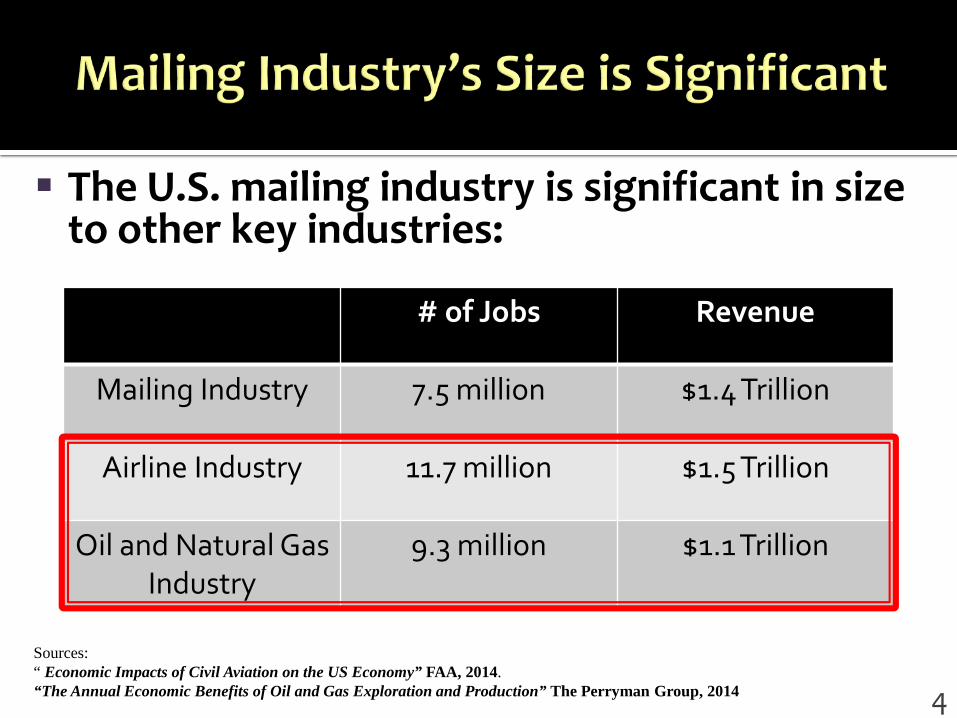
The U.S. mailing industry is significant in size to other key industries:
# of Jobs Revenue
Mailing Industry 7.5 million $1.4 Trillion
Airline Industry 11.7 million $1.5 Trillion
Oil and Natural Gas Industry
9.3 million $1.1 Trillion
Sources: “ Economic Impacts of Civil Aviation on the US Economy” FAA, 2014. “The Annual Economic Benefits of Oil and Gas Exploration and Production” The Perryman Group, 2014 4
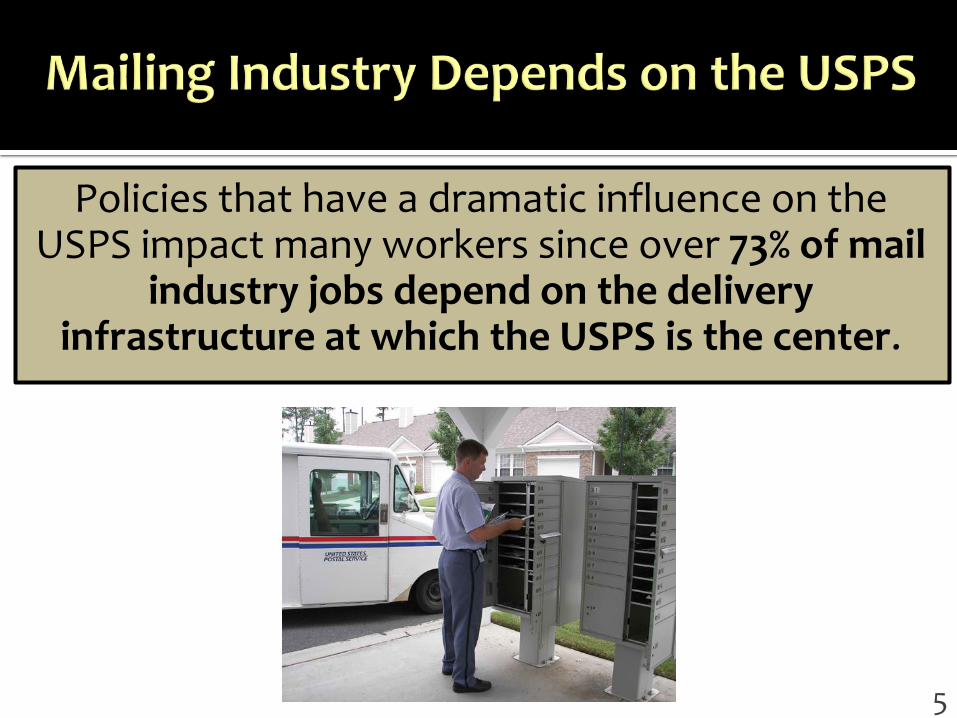
Policies that have a dramatic influence on the USPS impact many workers since over 73% of mail
industry jobs depend on the delivery infrastructure at which the USPS is the center.
5
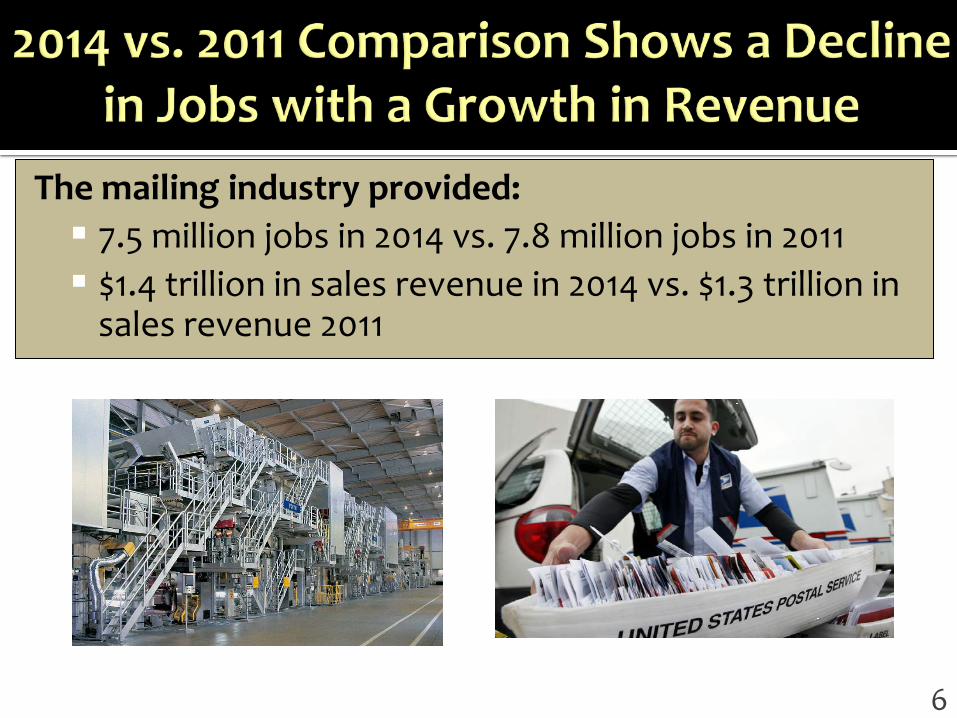
The mailing industry provided: 7.5 million jobs in 2014 vs. 7.8 million jobs in 2011 $1.4 trillion in sales revenue in 2014 vs. $1.3 trillion in
sales revenue 2011
6
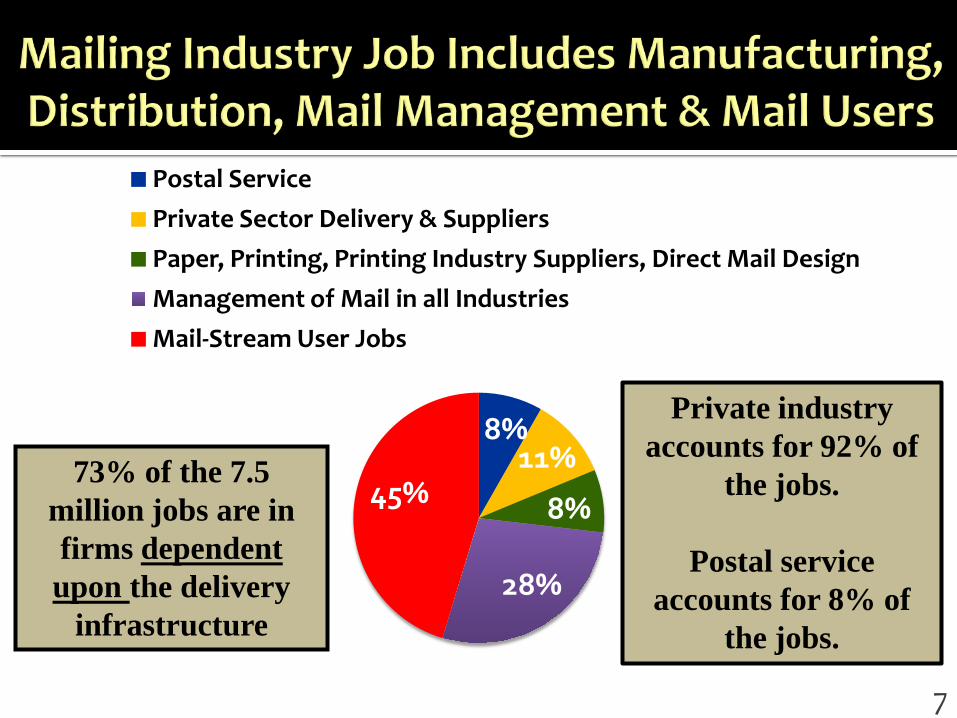
8% 11%
8%
28%
45%
Postal Service Private Sector Delivery & Suppliers Paper, Printing, Printing Industry Suppliers, Direct Mail Design Management of Mail in all Industries Mail-Stream User Jobs
Private industry accounts for 92% of
the jobs.
Postal service accounts for 8% of
the jobs.
73% of the 7.5 million jobs are in firms dependent upon the delivery
infrastructure
7
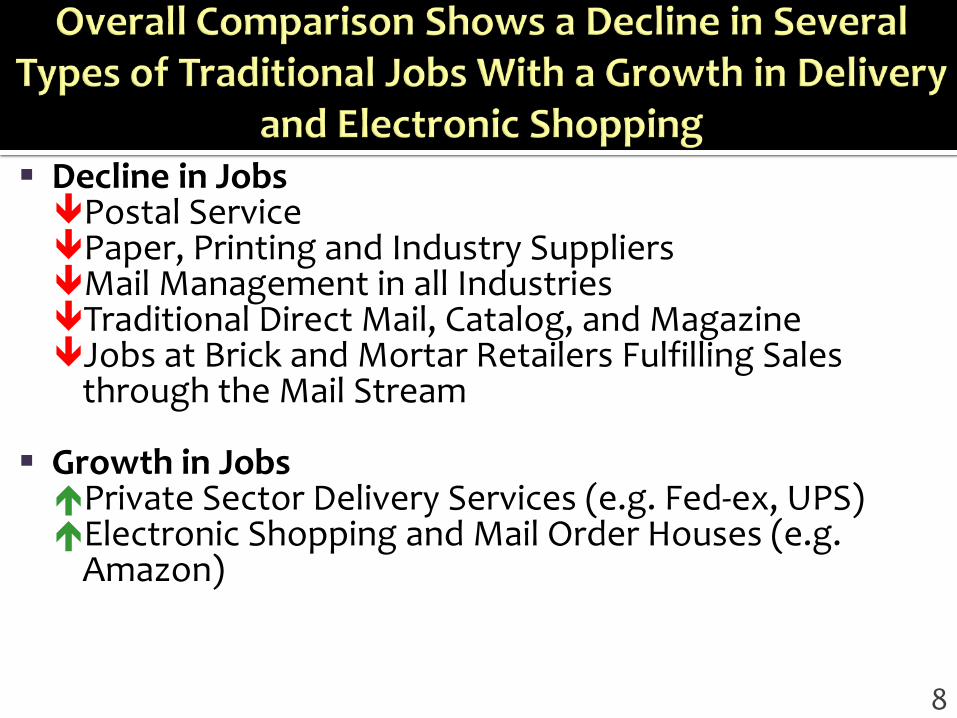
Decline in Jobs Postal Service Paper, Printing and Industry Suppliers Mail Management in all Industries Traditional Direct Mail, Catalog, and Magazine Jobs at Brick and Mortar Retailers Fulfilling Sales
through the Mail Stream
Growth in Jobs Private Sector Delivery Services (e.g. Fed-ex, UPS) Electronic Shopping and Mail Order Houses (e.g.
Amazon)
8
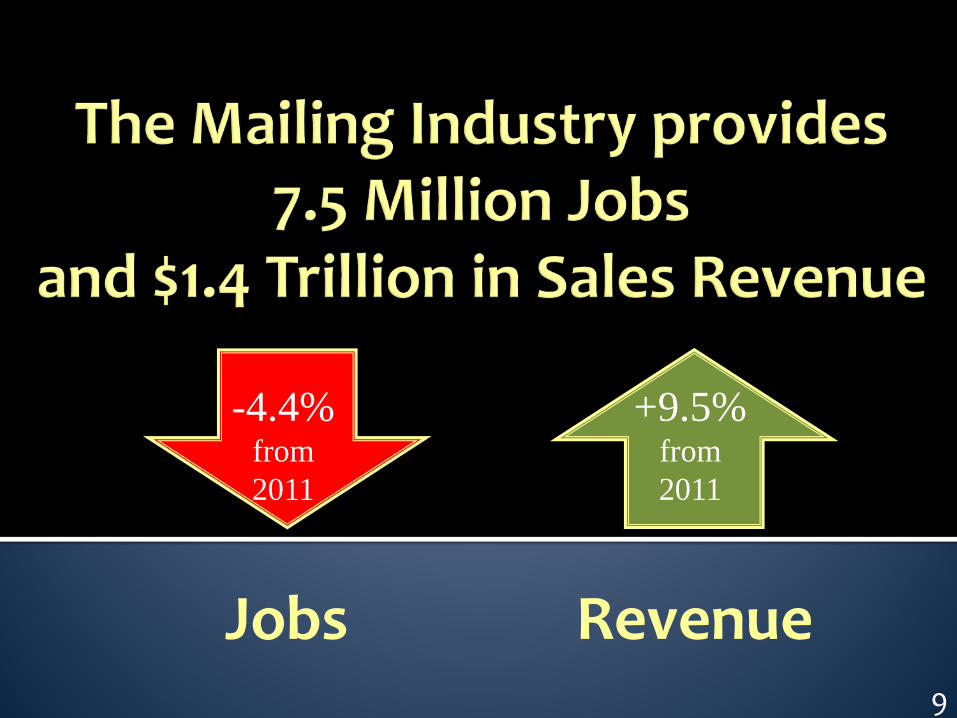
-4.4% from 2011
9
+9.5% from 2011
Jobs Revenue
10
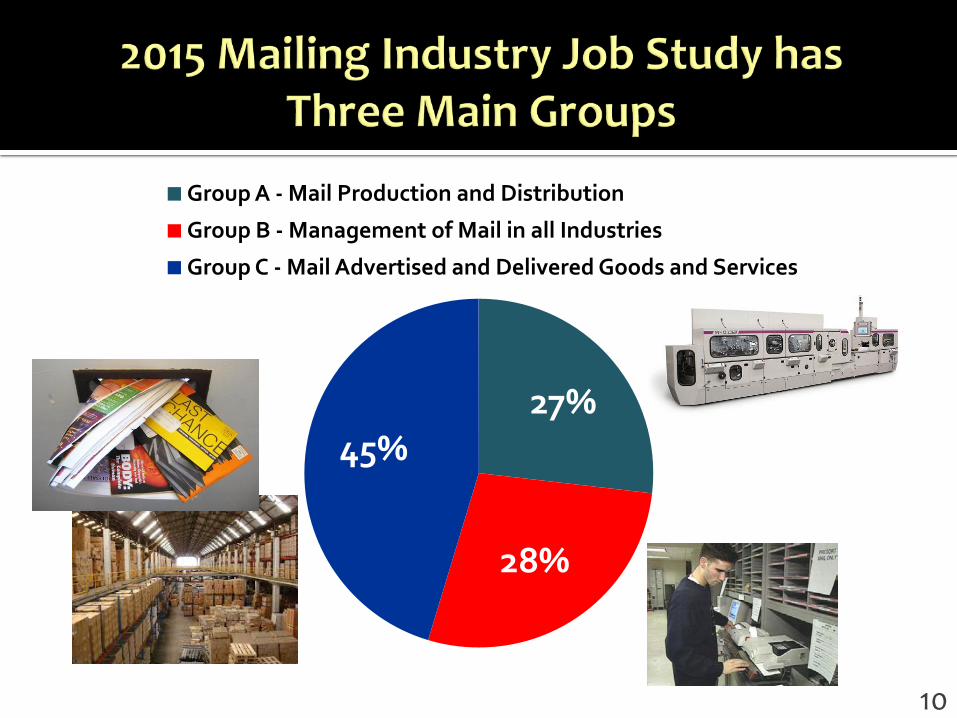
27%
28%
45%
Group A - Mail Production and Distribution
Group B - Management of Mail in all Industries
Group C - Mail Advertised and Delivered Goods and Services
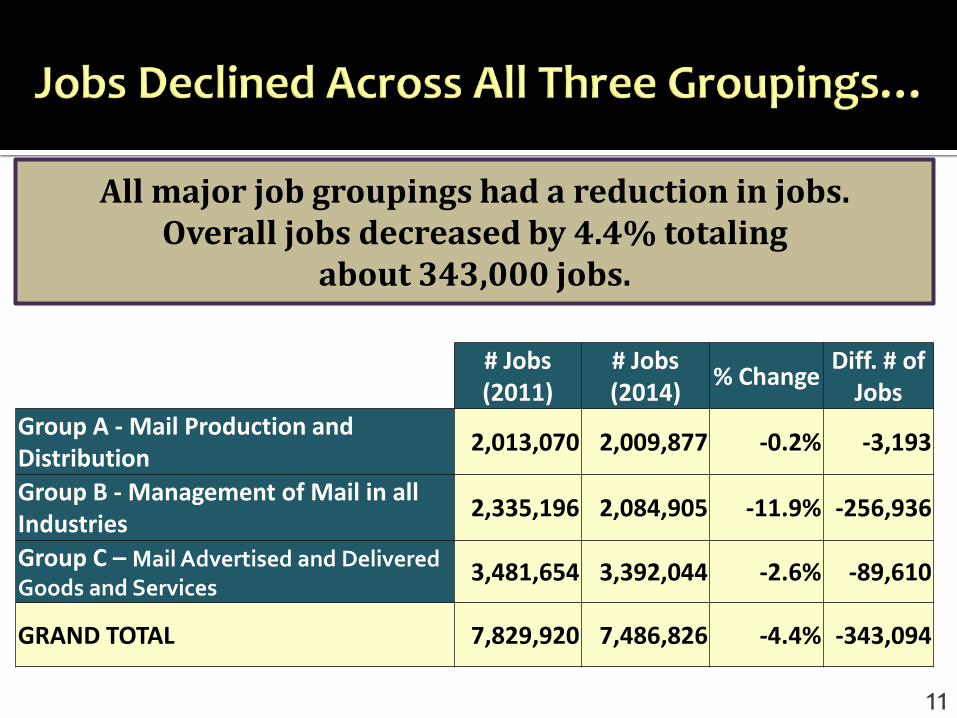
All major job groupings had a reduction in jobs. Overall jobs decreased by 4.4% totaling
about 343,000 jobs.
# Jobs (2011)
# Jobs (2014) % Change Diff. # of
Jobs Group A - Mail Production and Distribution 2,013,070 2,009,877 -0.2% -3,193
Group B - Management of Mail in all Industries 2,335,196 2,084,905 -11.9% -256,936
Group C – Mail Advertised and Delivered Goods and Services
3,481,654 3,392,044 -2.6% -89,610
GRAND TOTAL 7,829,920 7,486,826 -4.4% -343,094
11
12
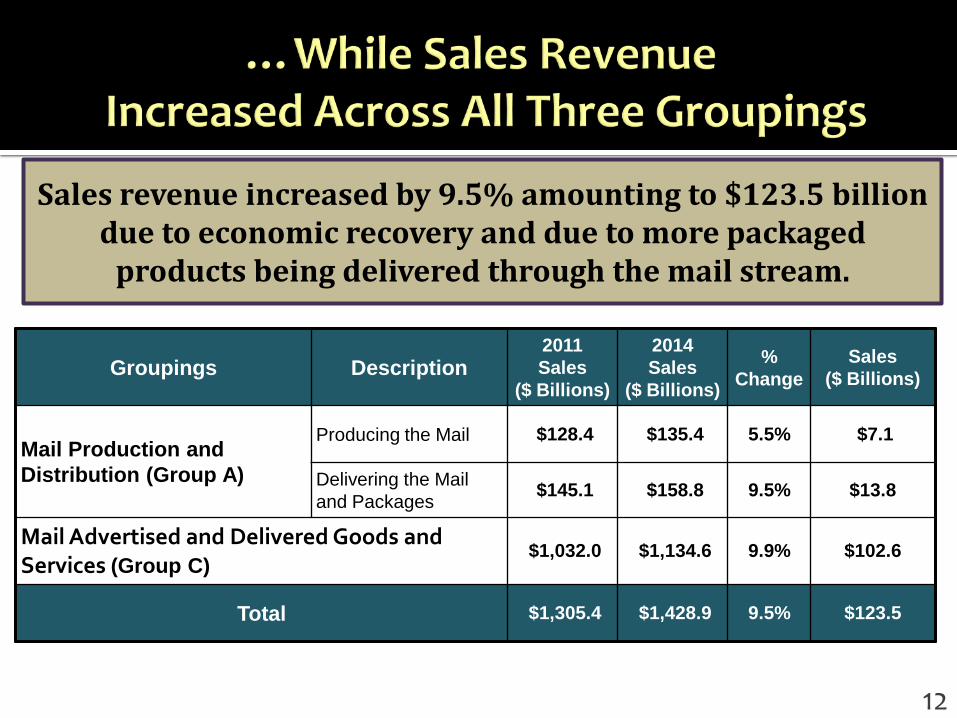
Groupings Description 2011 Sales
($ Billions)
2014 Sales
($ Billions)
% Change
Sales ($ Billions)
Mail Production and Distribution (Group A)
Producing the Mail $128.4 $135.4 5.5% $7.1
Delivering the Mail and Packages $145.1 $158.8 9.5% $13.8
Mail Advertised and Delivered Goods and Services (Group C)
$1,032.0 $1,134.6 9.9% $102.6
Total $1,305.4 $1,428.9 9.5% $123.5
Sales revenue increased by 9.5% amounting to $123.5 billion due to economic recovery and due to more packaged
products being delivered through the mail stream.
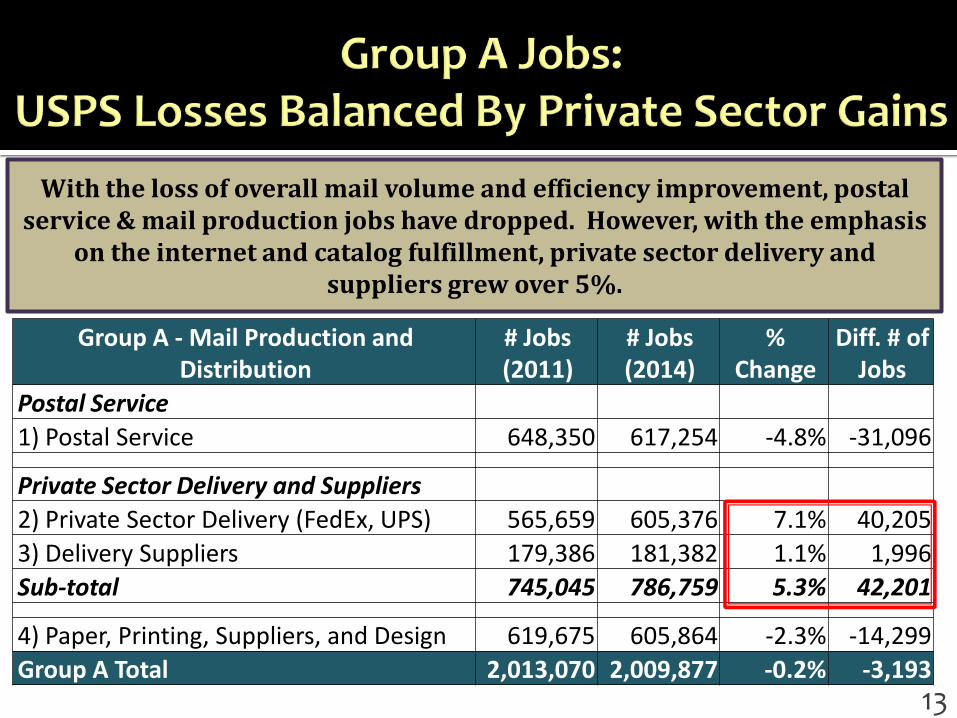
With the loss of overall mail volume and efficiency improvement, postal service & mail production jobs have dropped. However, with the emphasis
on the internet and catalog fulfillment, private sector delivery and suppliers grew over 5%.
Group A - Mail Production and Distribution
# Jobs (2011)
# Jobs (2014)
% Change
Diff. # of Jobs
Postal Service 1) Postal Service 648,350 617,254 -4.8% -31,096
Private Sector Delivery and Suppliers 2) Private Sector Delivery (FedEx, UPS) 565,659 605,376 7.1% 40,205 3) Delivery Suppliers 179,386 181,382 1.1% 1,996 Sub-total 745,045 786,759 5.3% 42,201
4) Paper, Printing, Suppliers, and Design 619,675 605,864 -2.3% -14,299 Group A Total 2,013,070 2,009,877 -0.2% -3,193
13
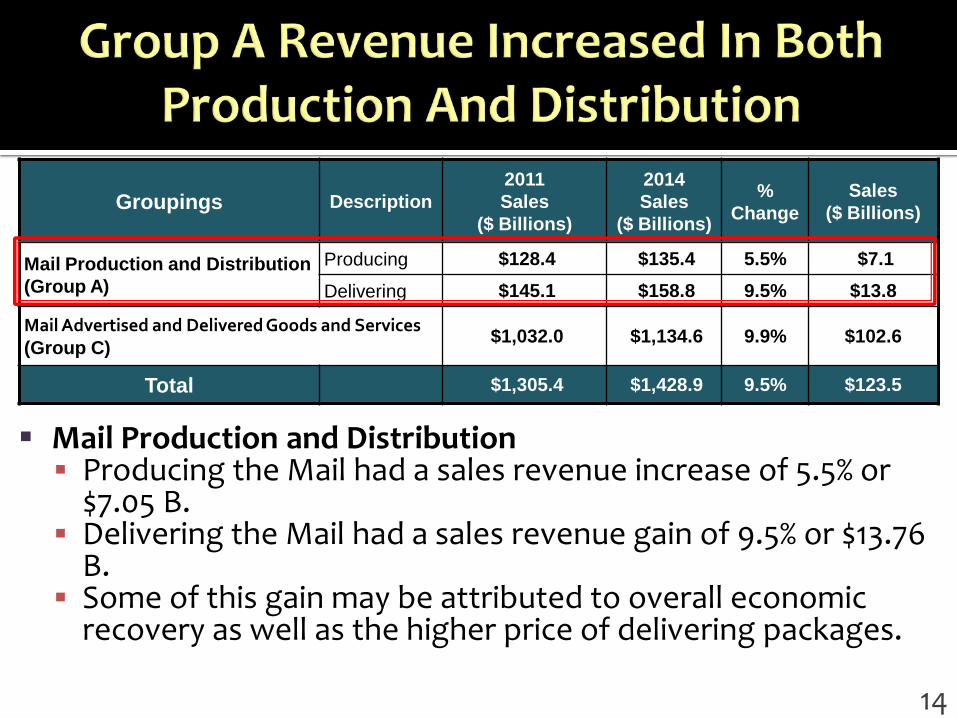
Mail Production and Distribution Producing the Mail had a sales revenue increase of 5.5% or
$7.05 B. Delivering the Mail had a sales revenue gain of 9.5% or $13.76
B. Some of this gain may be attributed to overall economic
recovery as well as the higher price of delivering packages.
14
Groupings Description 2011 Sales
($ Billions)
2014 Sales
($ Billions)
% Change
Sales ($ Billions)
Mail Production and Distribution (Group A)
Producing $128.4 $135.4 5.5% $7.1 Delivering $145.1 $158.8 9.5% $13.8
Mail Advertised and Delivered Goods and Services (Group C) $1,032.0 $1,134.6 9.9% $102.6
Total $1,305.4 $1,428.9 9.5% $123.5
15
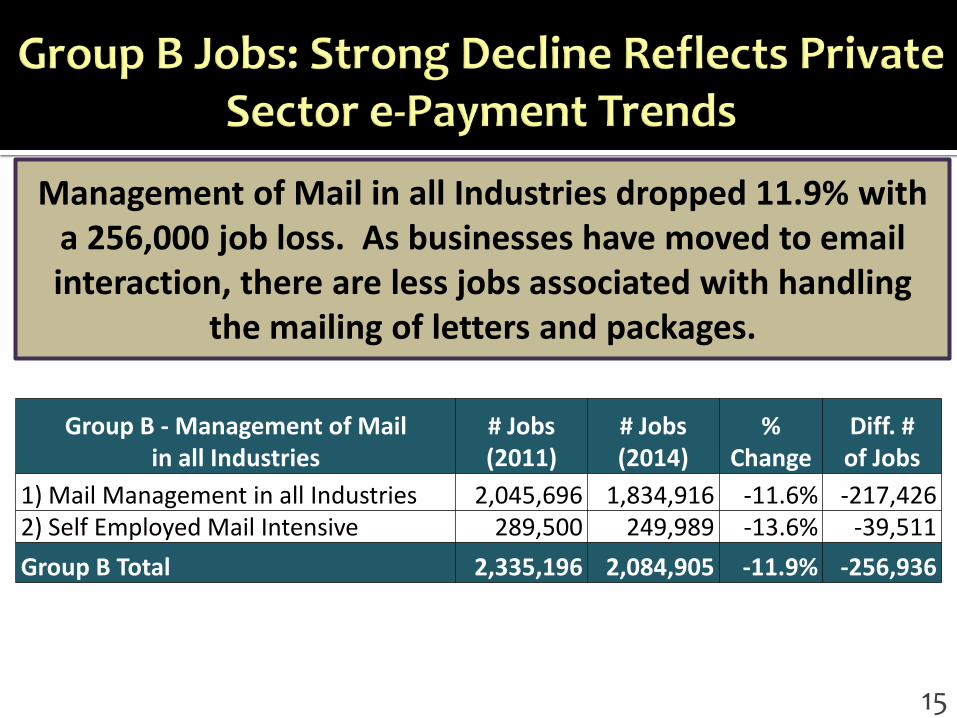
Management of Mail in all Industries dropped 11.9% with a 256,000 job loss. As businesses have moved to email interaction, there are less jobs associated with handling
the mailing of letters and packages.
Group B - Management of Mail in all Industries
# Jobs (2011)
# Jobs (2014)
% Change
Diff. # of Jobs
1) Mail Management in all Industries 2,045,696 1,834,916 -11.6% -217,426 2) Self Employed Mail Intensive 289,500 249,989 -13.6% -39,511 Group B Total 2,335,196 2,084,905 -11.9% -256,936
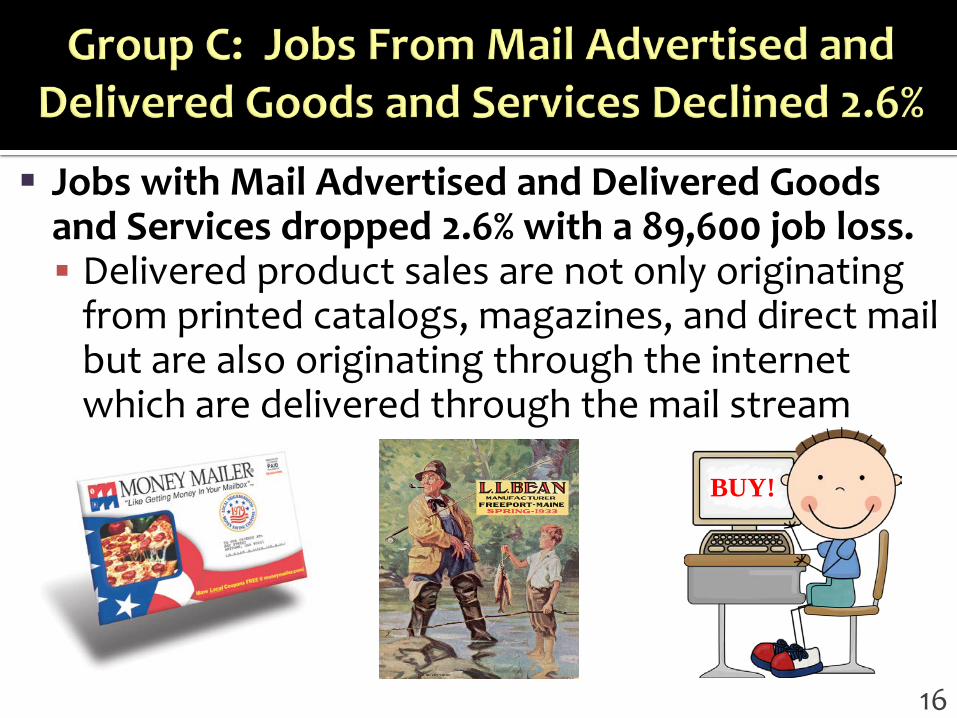
Jobs with Mail Advertised and Delivered Goods and Services dropped 2.6% with a 89,600 job loss. Delivered product sales are not only originating
from printed catalogs, magazines, and direct mail but are also originating through the internet which are delivered through the mail stream
16
BUY!
17
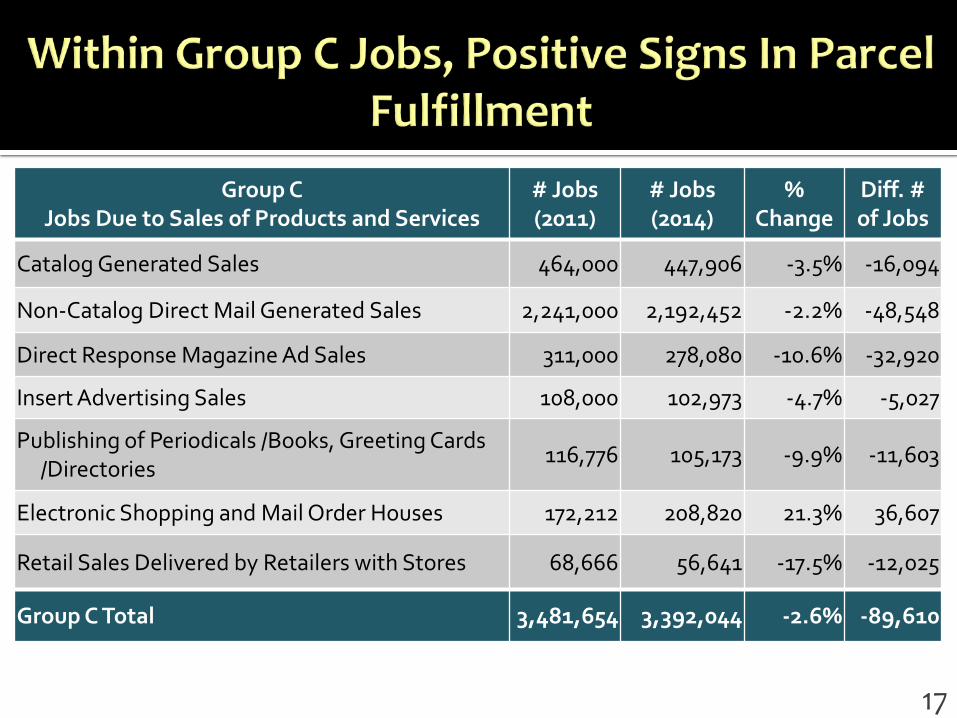
Group C Jobs Due to Sales of Products and Services
# Jobs (2011)
# Jobs (2014)
% Change
Diff. # of Jobs
Catalog Generated Sales 464,000 447,906 -3.5% -16,094
Non-Catalog Direct Mail Generated Sales 2,241,000 2,192,452 -2.2% -48,548
Direct Response Magazine Ad Sales 311,000 278,080 -10.6% -32,920
Insert Advertising Sales 108,000 102,973 -4.7% -5,027
Publishing of Periodicals /Books, Greeting Cards /Directories 116,776 105,173 -9.9% -11,603
Electronic Shopping and Mail Order Houses 172,212 208,820 21.3% 36,607
Retail Sales Delivered by Retailers with Stores 68,666 56,641 -17.5% -12,025
Group C Total 3,481,654 3,392,044 -2.6% -89,610
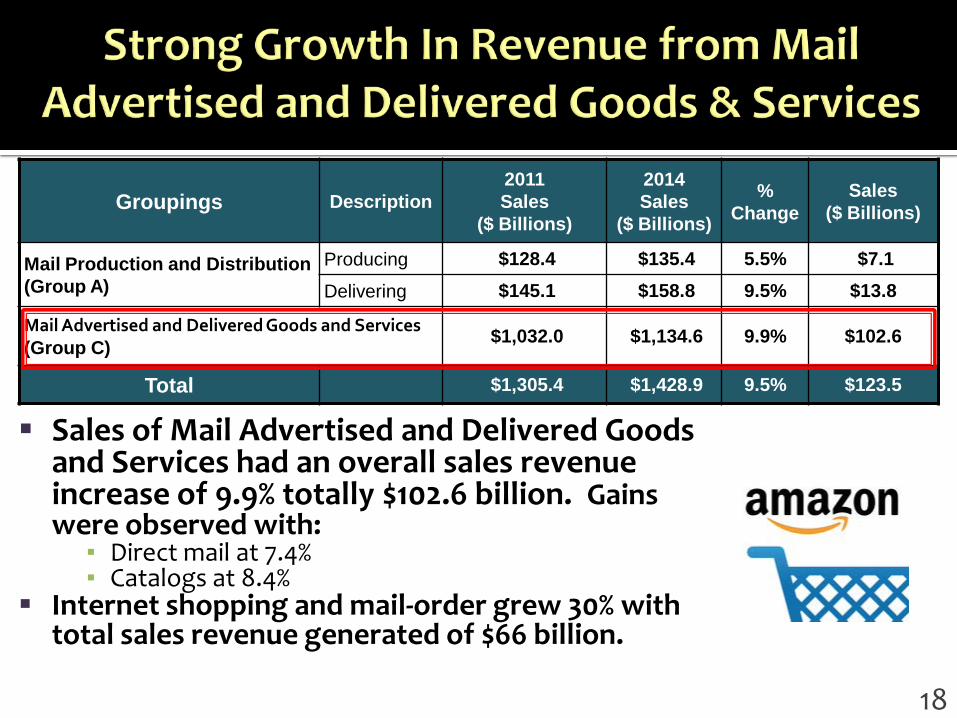
Groupings Description 2011 Sales
($ Billions)
2014 Sales
($ Billions)
% Change
Sales ($ Billions)
Mail Production and Distribution (Group A)
Producing $128.4 $135.4 5.5% $7.1 Delivering $145.1 $158.8 9.5% $13.8
Mail Advertised and Delivered Goods and Services (Group C) $1,032.0 $1,134.6 9.9% $102.6
Total $1,305.4 $1,428.9 9.5% $123.5
Sales of Mail Advertised and Delivered Goods and Services had an overall sales revenue increase of 9.9% totally $102.6 billion. Gains were observed with:
▪ Direct mail at 7.4% ▪ Catalogs at 8.4%
Internet shopping and mail-order grew 30% with total sales revenue generated of $66 billion.
18

19