Em321 lesson 08b solutions ch6 - mechanical properties of metals
33
Chapter 6.1-6.2, 6.6: Mechanical Properties of Metals EM321: Lesson 8b Before class, pass out photocopy of Stress-Strain plot
Transcript of Em321 lesson 08b solutions ch6 - mechanical properties of metals
Chapter 6.1-6.2, 6.6:
Mechanical Properties of Metals
EM321: Lesson 8b
Before class, pass out photocopy of Stress-Strain plot

• Stress and Strain: What are they and why are they used instead of load and deformation?
• Elastic behavior: When loads are small, how much deformation occurs? What materials deform least?
• Plastic behavior: At what point do dislocations cause permanent deformation? What materials are most resistant to permanent deformation?
• Toughness and ductility: What are they and how do we measure them?
Important Topics: Mechanical Properties
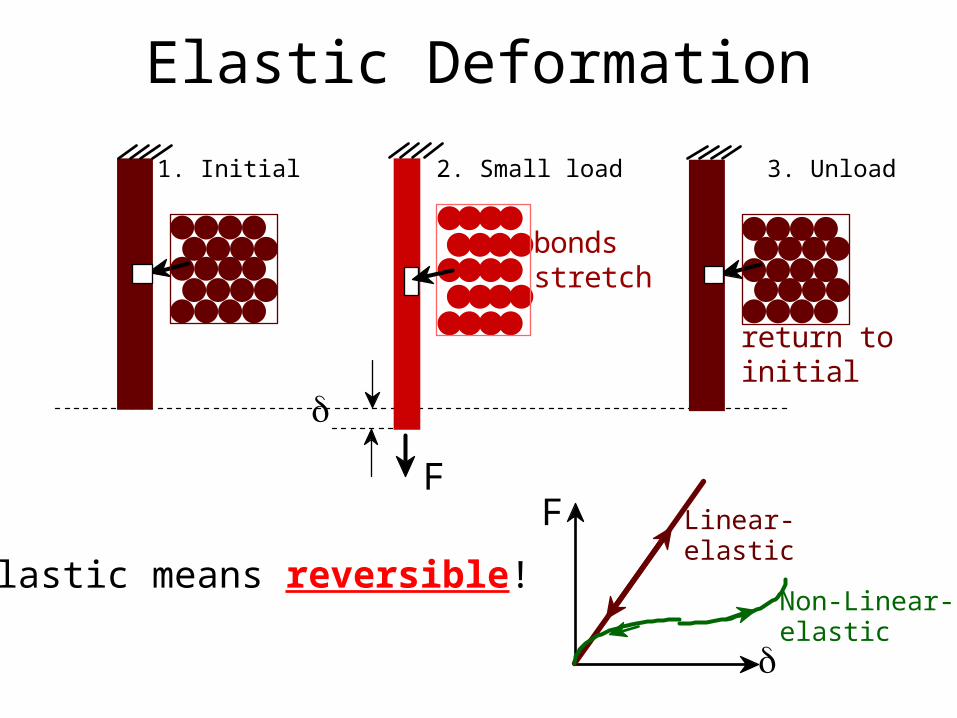
F
bonds stretch
return to initial
1. Initial 2. Small load 3. Unload
Elastic means reversible!
F
Linear- elastic
Non-Linear-elastic
Elastic Deformation
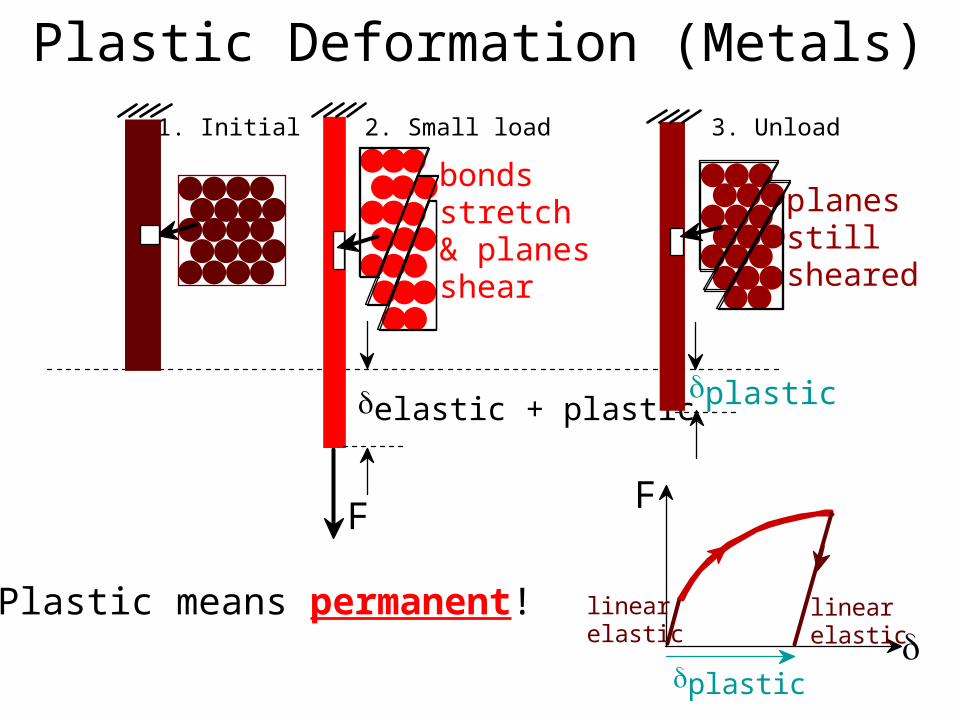
1. Initial 2. Small load 3. Unload
Plastic means permanent!
F
linear elastic
linear elastic
plastic
planes still sheared
F
elastic + plastic
bonds stretch & planes shear
plastic
Plastic Deformation (Metals)
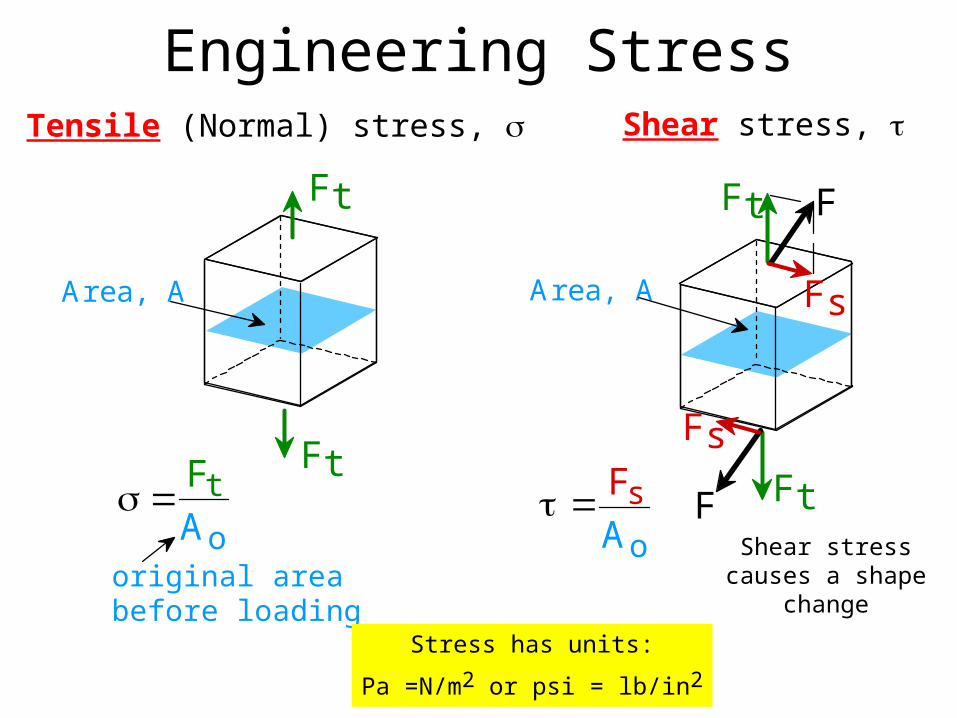
Tensile (Normal) stress, s Shear stress, t
Area, A
Ft
Ft
s FtAo
original area before loading
Area, A
Ft
Ft
Fs
F
F
Fs
t FsAo
Stress has units:
Pa =N/m2 or psi = lb/in2
Engineering Stress
Shear stress causes a shape
change
6
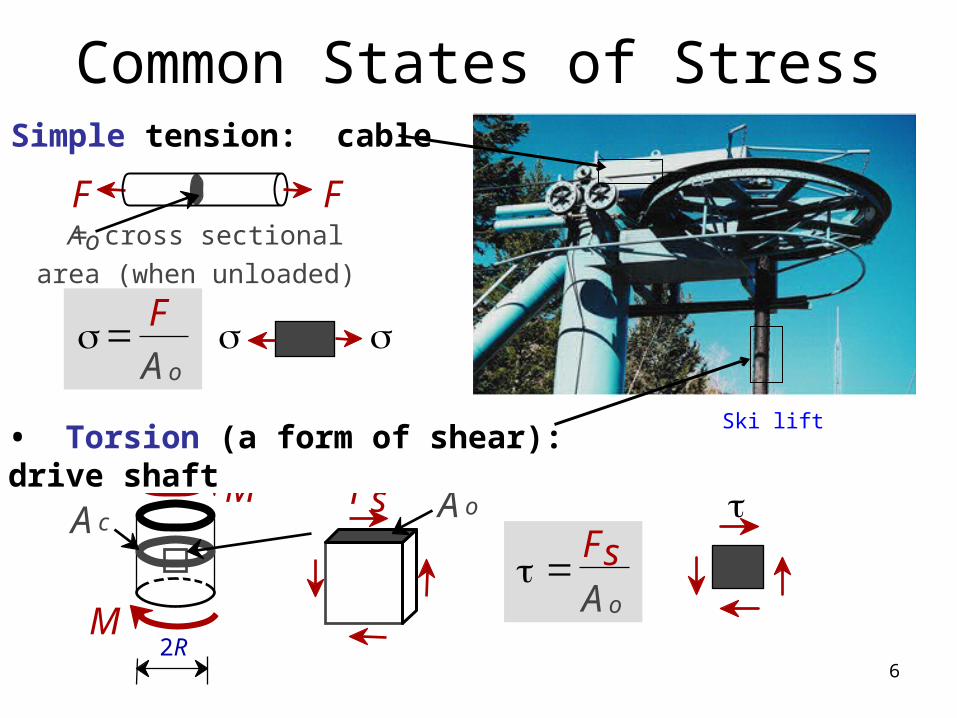
• Simple tension: cable
t
Common States of Stress
os F
A
ot
FsA
ss
M
M A o
2R
FsA c
• Torsion (a form of shear): drive shaftSki lift
Ao = cross sectional
area (when unloaded)
FF
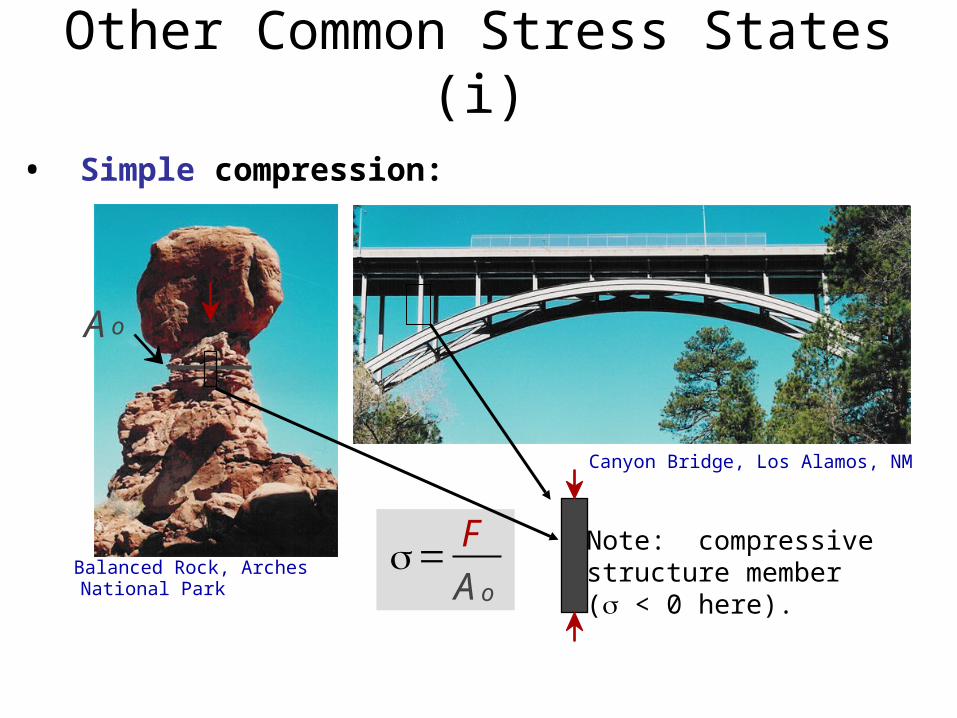
Canyon Bridge, Los Alamos, NM
os F
A
• Simple compression:
Note: compressivestructure member(s < 0 here).
A o
Balanced Rock, Arches National Park
Other Common Stress States (i)
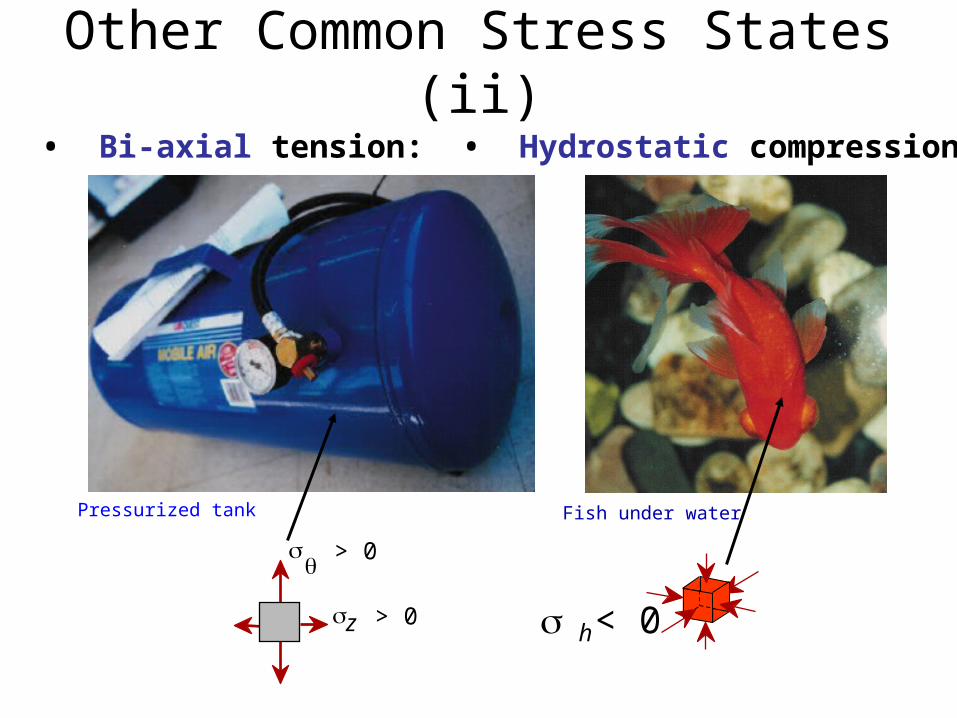
• Bi-axial tension: • Hydrostatic compression:
Pressurized tank
s < 0h
Other Common Stress States (ii)
Fish under water
sz > 0
sq
> 0
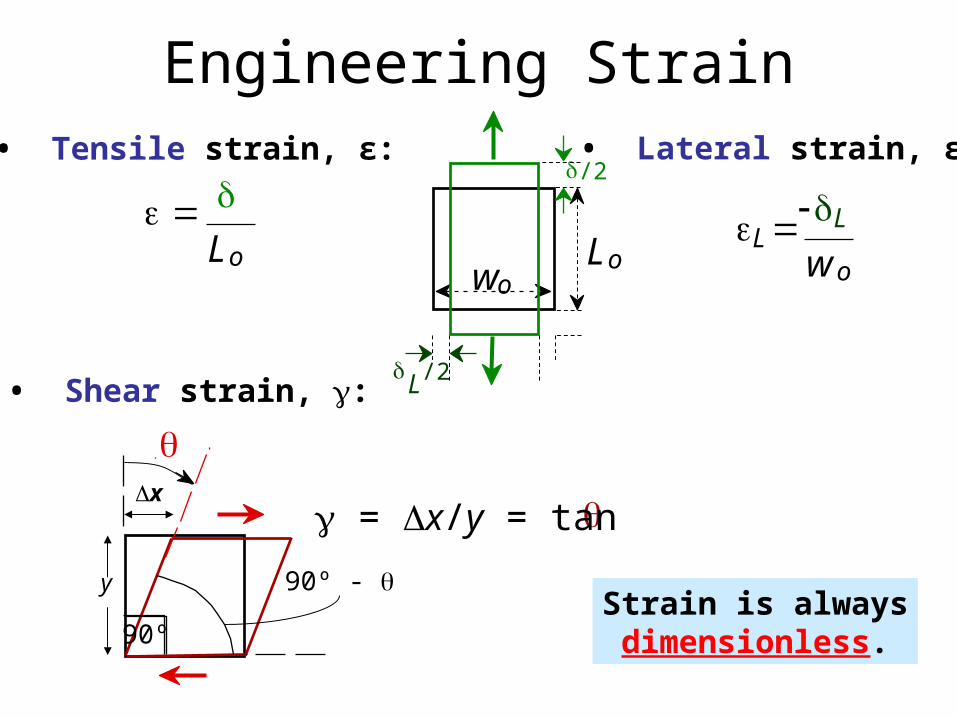
• Tensile strain, ε: • Lateral strain, εL:
Strain is alwaysdimensionless.
Engineering Strain
• Shear strain, g:
q
90º
90º - qy
xqg = D x/y = tan
e Lo
-eL L
wo
d /2
Lowo
dL /2
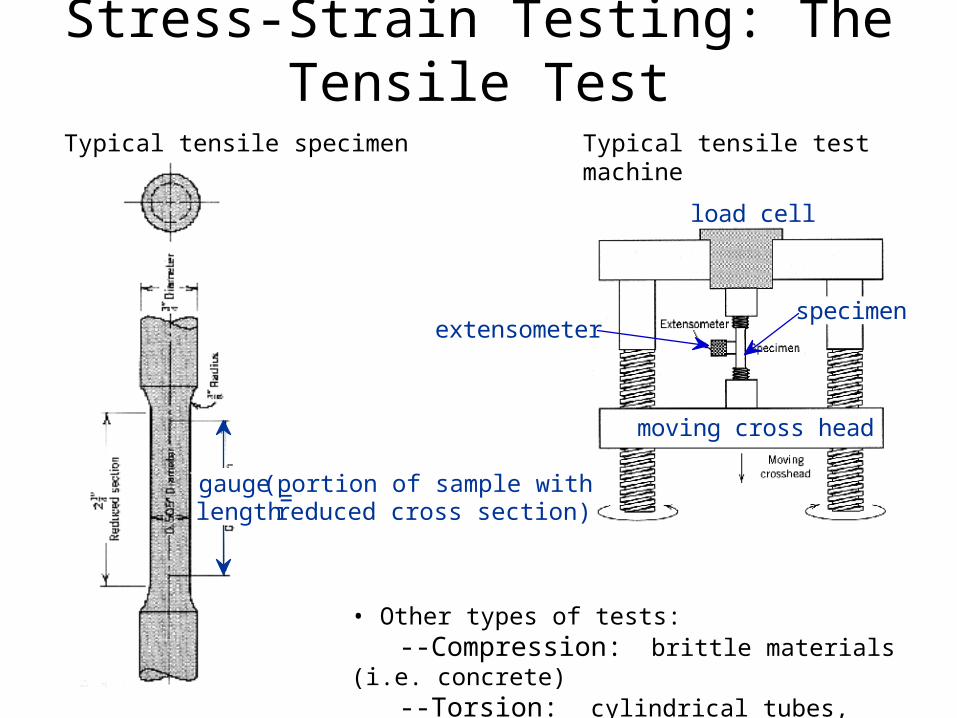
Typical tensile specimen
• Other types of tests: --Compression: brittle materials (i.e. concrete) --Torsion: cylindrical tubes, shafts.
Typical tensile test machine
load cell
extensometerspecimen
moving cross head
Stress-Strain Testing: The Tensile Test
gauge length
(portion of sample with reduced cross section)=
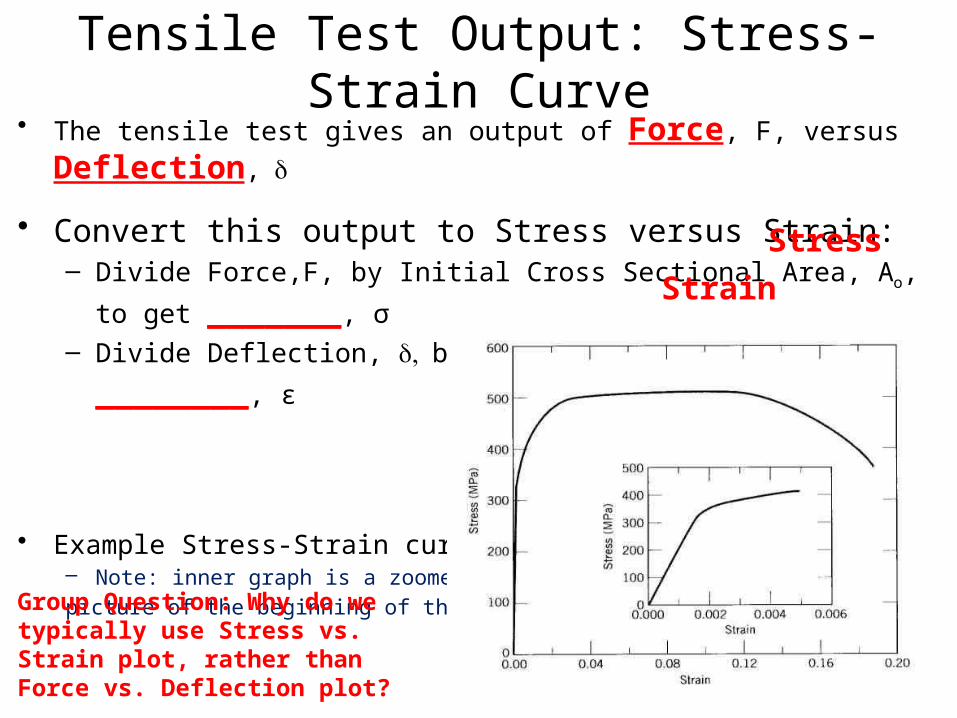
Tensile Test Output: Stress-Strain Curve• The tensile test gives an output of Force, F, versus Deflection, d
• Convert this output to Stress versus Strain:– Divide Force,F, by Initial Cross Sectional Area, Ao, to get _______, σ
– Divide Deflection, , d by Initial Length, Lo, to get ________, ε
• Example Stress-Strain curve:– Note: inner graph is a zoomed in
picture of the beginning of the curve
Group Question: Why do we typically use Stress vs. Strain plot, rather than Force vs. Deflection plot?
Stress
Strain

• Modulus of Elasticity, E: (also known as Young's modulus)
• Hooke's Law:
s = E e
• Poisson's ratio, n :
metals: n ~ 0.33 ceramics: ~0.25 polymers: ~0.40
en - Le
F
Fsimple tension test
Units:E: [GPa] or [psi]n: dimensionless
Linear Elastic Properties, E and n s
Linear-
elastic
Ee
eL
e-n
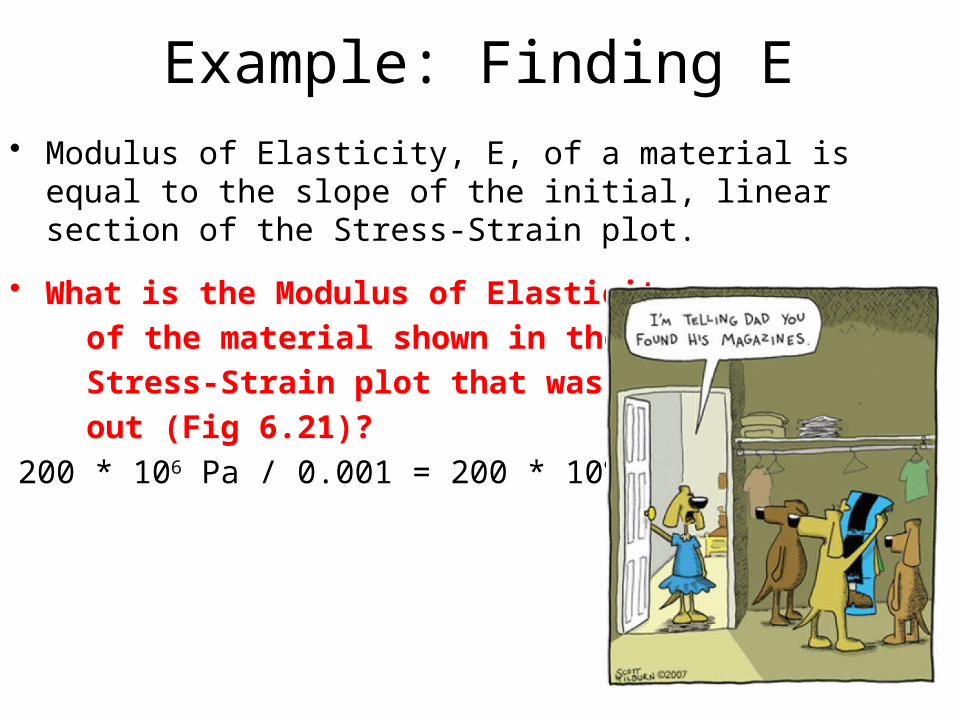
Example: Finding E• Modulus of Elasticity, E, of a material is equal to the slope of
the initial, linear section of the Stress-Strain plot.
• What is the Modulus of Elasticity
of the material shown in the
Stress-Strain plot that was handed
out (Fig 6.21)?
E ≈ 200 * 106 Pa / 0.001 = 200 * 109 Pa
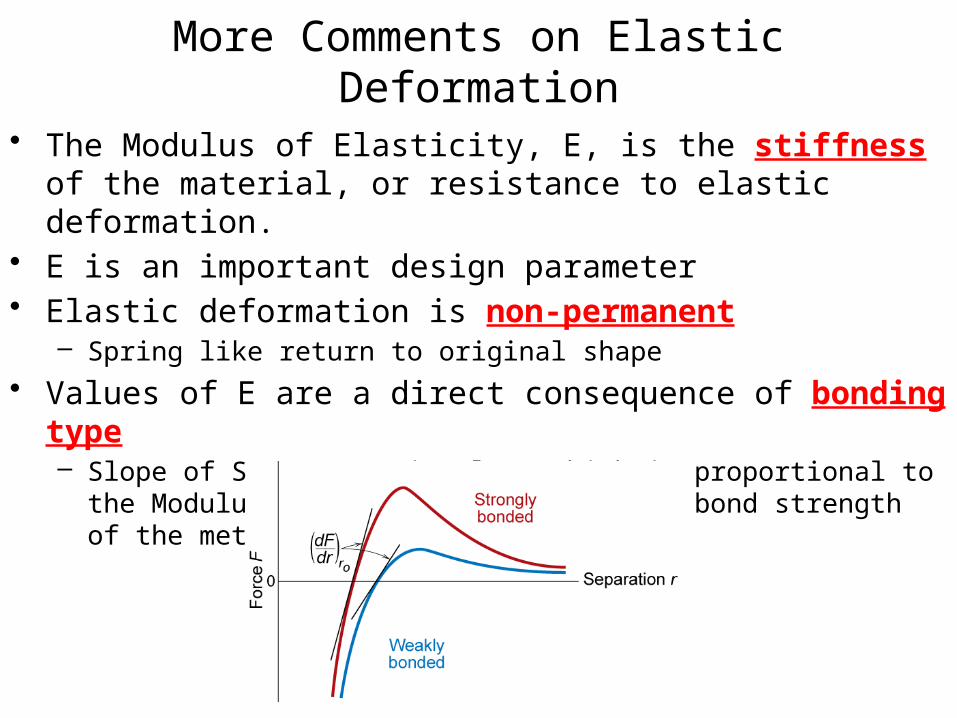
More Comments on Elastic Deformation
• The Modulus of Elasticity, E, is the stiffness of the material, or resistance to elastic deformation.
• E is an important design parameter• Elastic deformation is non-permanent
– Spring like return to original shape
• Values of E are a direct consequence of bonding type– Slope of Stress-Strain plot (which is proportional to the Modulus of
Elasticity) depends on bond strength of the metal

Even More Comments About Elasticity• It is assumed elastic deformation is
time independent• Also assumed that as load is released,
the strain is totally recovered.• In most engineering materials, there is
a time dependent elastic strain component. – Elastic deformation will continue after the
stress application, and upon release some time is required for complete recovery.
– Time dependent behavior is called “anelasticity”
– Usually negligible for metals, is significant for some polymers, where it is called “visco-elasticity”
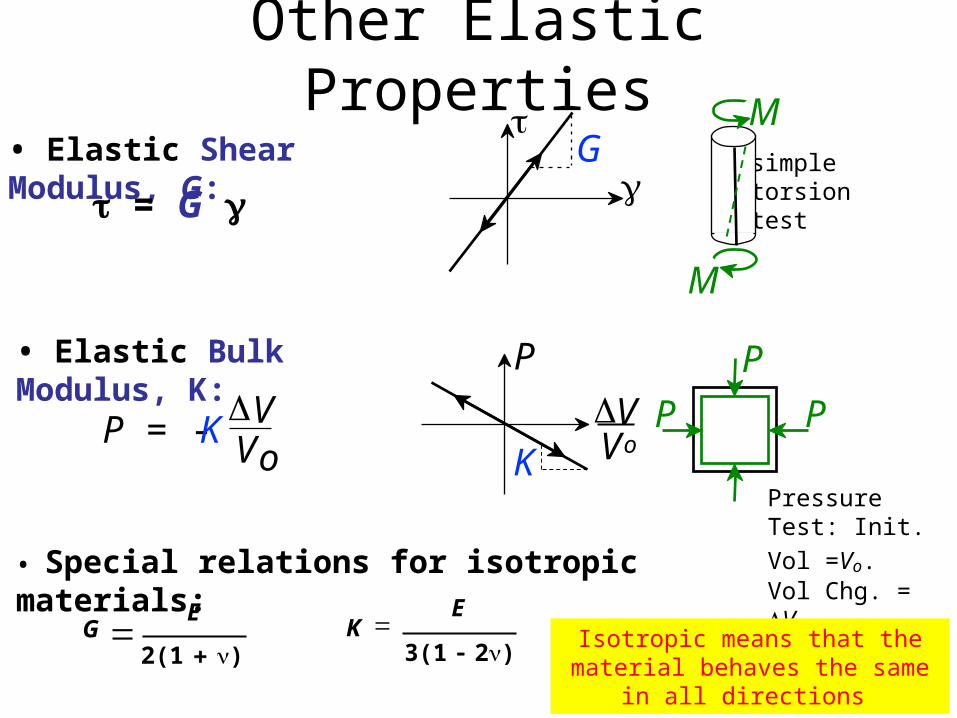
• Elastic Shear Modulus, G:t
Ggt = G g
Other Elastic Properties
simpletorsiontest
M
M
• Special relations for isotropic materials:
2(1 + n)
EG =
3(1 - 2n)
EK =
• Elastic Bulk Modulus, K:
Pressure Test:
Init. Vol =Vo. Vol Chg. = DV
P
P PP = -KDVVo
P
DVK Vo
Isotropic means that the material behaves the same in all directions
0.2
8
0.6
1
Magnesium,Aluminum
Platinum
Silver, Gold
Tantalum
Zinc, Ti
Steel, NiMolybdenum
Graphite
Si crystal
Glass-soda
Concrete
Si nitrideAl oxide
PC
Wood( grain)
AFRE( fibers)*
CFRE *
GFRE*
Glass fibers only
Carbon fibers only
Aramid fibers only
Epoxy only
0.4
0.8
2
46
10
20
406080
100
200
600800
10001200
400
Tin
Cu alloys
Tungsten
<100>
<111>
Si carbide
Diamond
PTFE
HDPE
LDPE
PP
Polyester
PSPET
CFRE( fibers)*
GFRE( fibers)*
GFRE(|| fibers)*
AFRE(|| fibers)*
CFRE(|| fibers)*
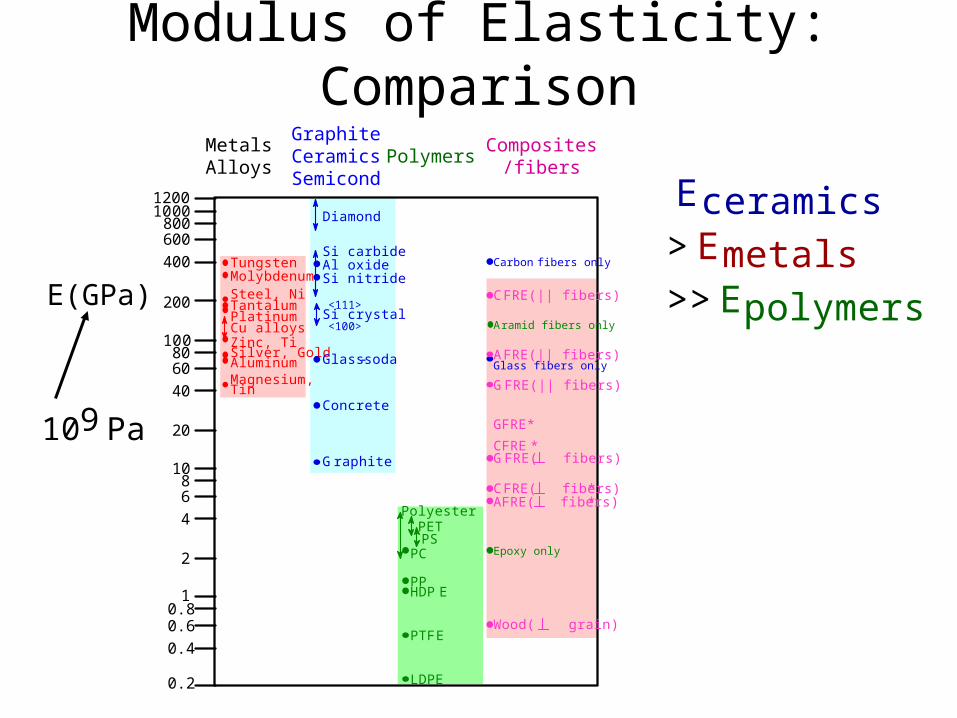
MetalsAlloys
GraphiteCeramicsSemicond
PolymersComposites
/fibers
E(GPa)
Eceramics > Emetals >> Epolymers
109 Pa
Modulus of Elasticity: Comparison
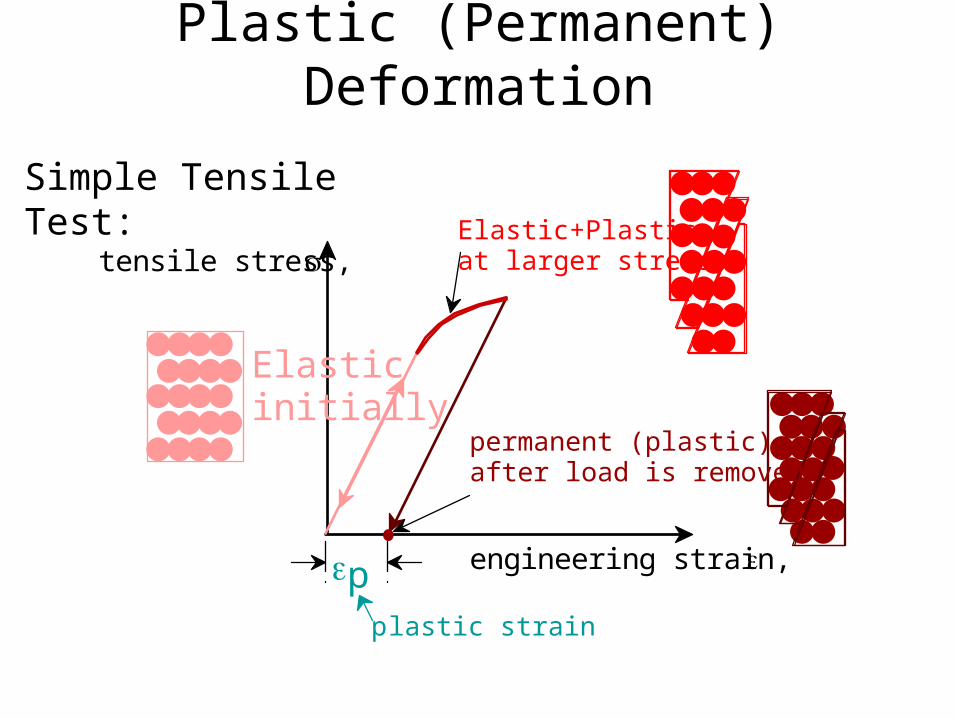
Simple Tensile Test:
tensile stress, s
engineering strain, e
Elastic initially
Elastic+Plastic at larger stress
permanent (plastic) after load is removed
epplastic strain
Plastic (Permanent) Deformation
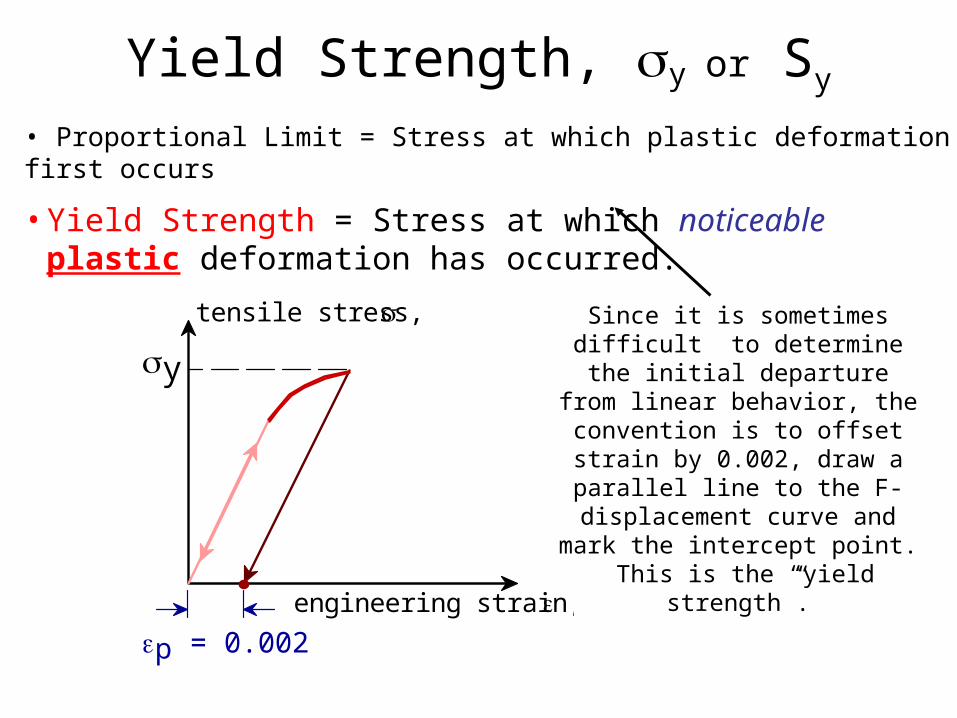
• Proportional Limit = Stress at which plastic deformation first occurs
• Yield Strength = Stress at which noticeable plastic deformation has occurred.
tensile stress, s
engineering strain, e
sy
ep = 0.002
Yield Strength, sy or Sy
Since it is sometimes difficult to determine the initial departure from linear behavior, the convention is to offset strain by 0.002, draw a
parallel line to the F-displacement curve and mark the intercept point.
This is the “yield strength”.
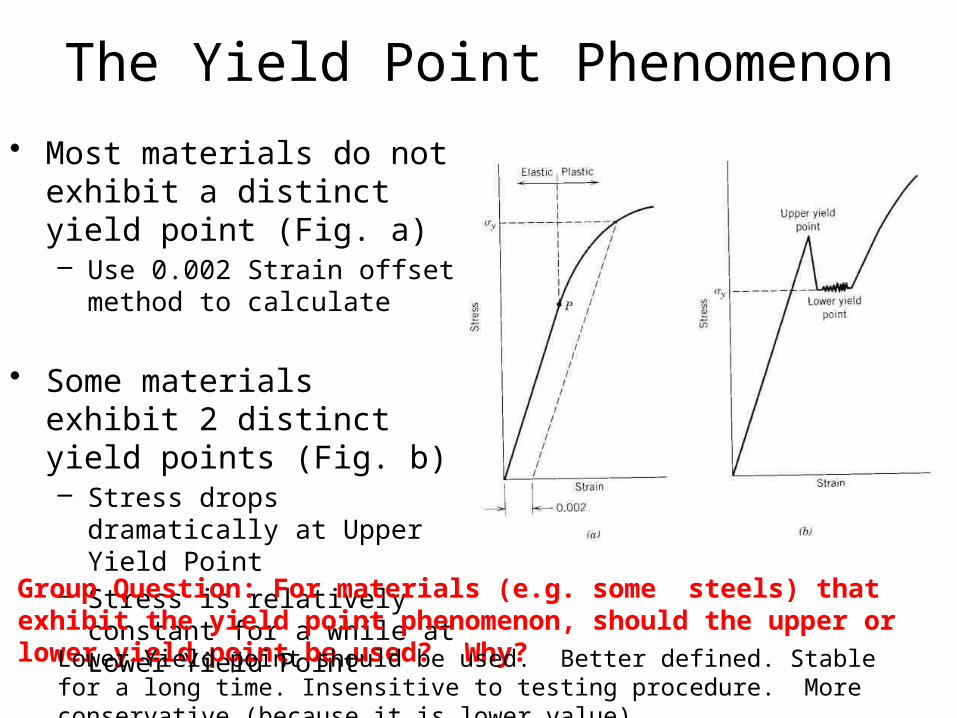
The Yield Point Phenomenon
• Most materials do not exhibit a distinct yield point (Fig. a)– Use 0.002 Strain offset method
to calculate
• Some materials exhibit 2 distinct yield points (Fig. b)– Stress drops dramatically at
Upper Yield Point– Stress is relatively constant for
a while at Lower Yield Point
Group Question: For materials (e.g. some steels) that exhibit the yield point phenomenon, should the upper or lower yield point be used? Why?
Lower Yield point should be used. Better defined. Stable for a long time. Insensitive to testing procedure. More conservative (because it is lower value).

Example: Finding Yield Strength
• Use the 0.002 Strain offset method to find the Yield Strength of the material shown in the Stress-Strain plot that was handed out (Fig 6.21)?
Sy ≈ 400 MPa
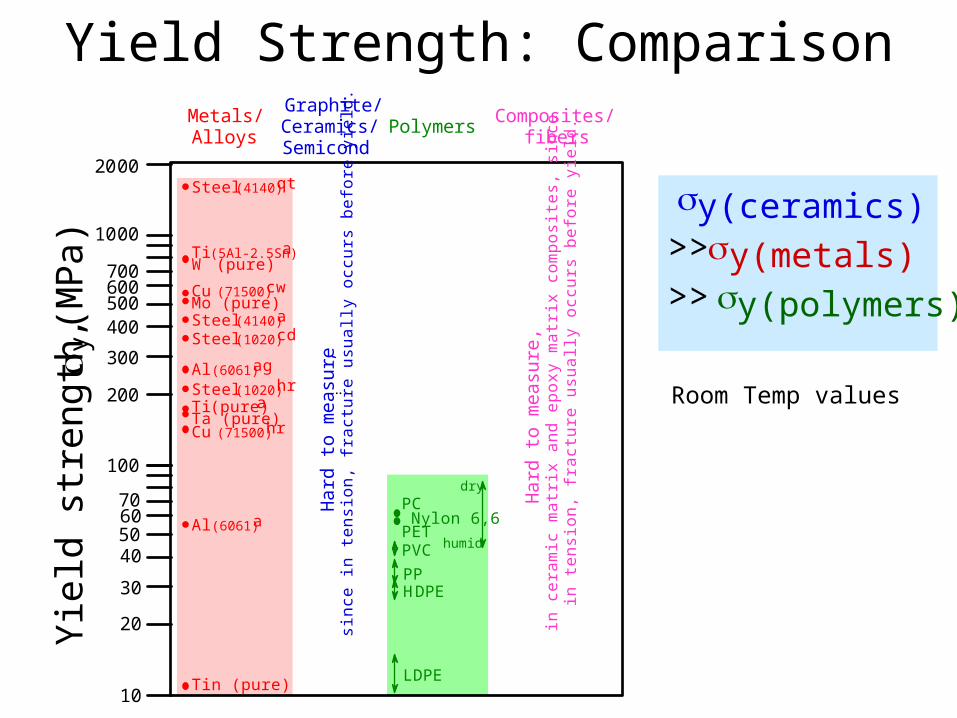
Graphite/ Ceramics/ Semicond
Metals/ Alloys
Composites/ fibersPolymers
Yield
str
ength
, sy (M
Pa)
PVC
Ha
rd t
o m
ea
sure,
si
nce
in t
ensi
on, fr
act
ure
usu
ally
occ
urs
befo
re y
ield
.
Nylon 6,6
LDPE
70
20
40
6050
100
10
30
200
300
400500600700
1000
2000
Tin (pure)
Al (6061)a
Al (6061)ag
Cu (71500)hrTa (pure)Ti (pure)aSteel (1020)hr
Steel (1020)cdSteel (4140)a
Steel (4140)qt
Ti (5Al-2.5Sn)aW (pure)
Mo (pure)Cu (71500)cw
Ha
rd t
o m
ea
sure
, in
cera
mic
matr
ix a
nd e
pox
y m
atr
ix c
om
posi
tes,
sin
ce in
tensi
on, fr
act
ure
usu
ally
occ
urs
befo
re y
ield
.HDPEPP
humid
dryPC
PET
¨ Room Temp values
y(ceramics) >> y(metals) >> y(polymers)
Yield Strength: Comparison
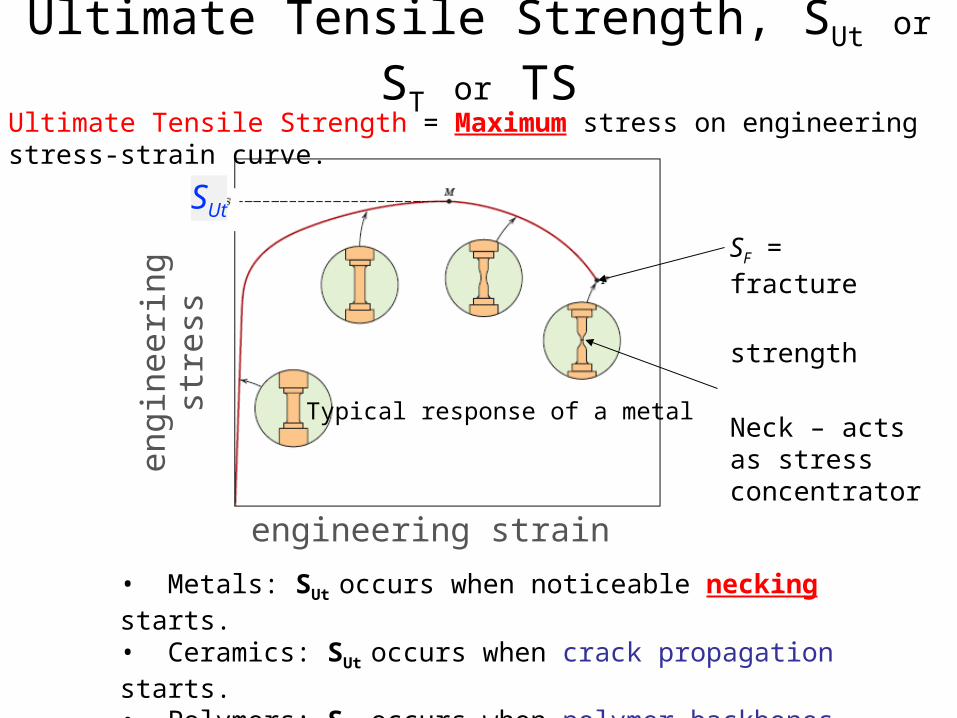
Ultimate Tensile Strength, SUt or ST or TS
y
strain
Typical response of a metal
SF = fracture
strength
Neck – acts as stress concentrator
eng
inee
ring
SUt s
tres
s
engineering strain
Ultimate Tensile Strength = Maximum stress on engineering stress-strain curve.
• Metals: SUt occurs when noticeable necking starts.• Ceramics: SUt occurs when crack propagation starts.• Polymers: SUt occurs when polymer backbones are aligned and about to break.
Typical response of a metal

Example: Finding Ultimate Tensile Strength
• Find the Ultimate Tensile Strength of the material shown in the Stress-Strain plot that was handed out (Fig 6.21)?
SUt ≈ 500 MPa
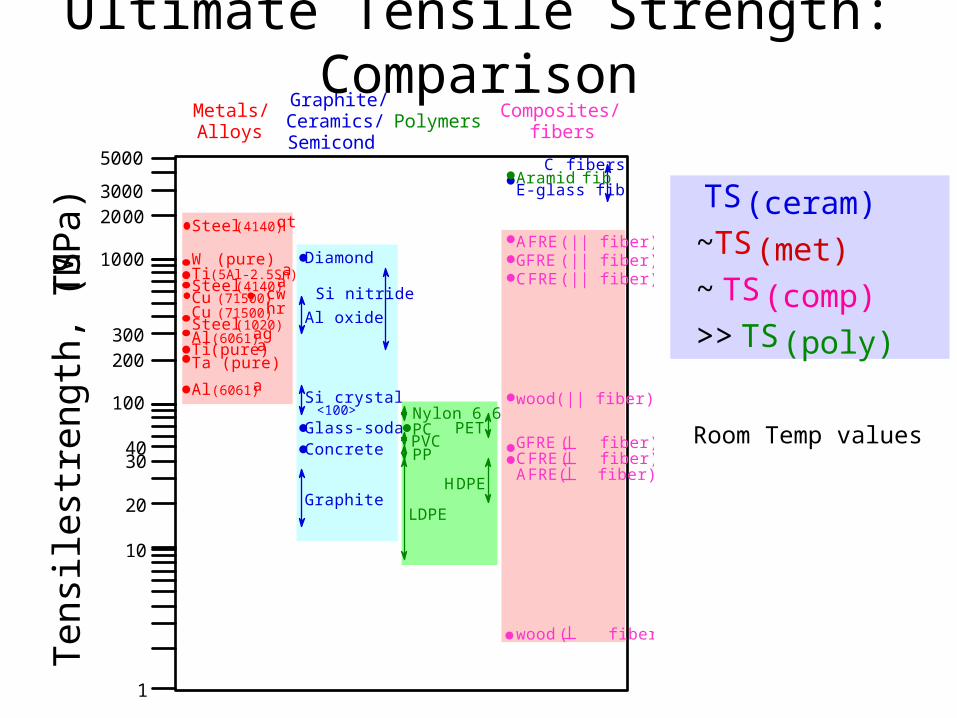
Room Temp values
Si crystal<100>
Graphite/ Ceramics/ Semicond
Metals/ Alloys
Composites/ fibersPolymers
Tensi
le s
trength
, TS (M
Pa)
PVC
Nylon 6,6
10
100
200300
1000
Al (6061)a
Al (6061)agCu (71500)hr
Ta (pure)Ti (pure)aSteel (1020)
Steel (4140)a
Steel (4140)qt
Ti (5Al-2.5Sn)aW (pure)
Cu (71500)cw
LDPE
PP
PC PET
20
3040
20003000
5000
Graphite
Al oxide
Concrete
Diamond
Glass-soda
Si nitride
HDPE
wood( fiber)
wood(|| fiber)
1
GFRE(|| fiber)
GFRE( fiber)
CFRE(|| fiber)
CFRE( fiber)
AFRE(|| fiber)
AFRE( fiber)
E-glass fib
C fibersAramid fib
TS(ceram)
~TS(met)
~ TS(comp) >> TS(poly)
Ultimate Tensile Strength: Comparison
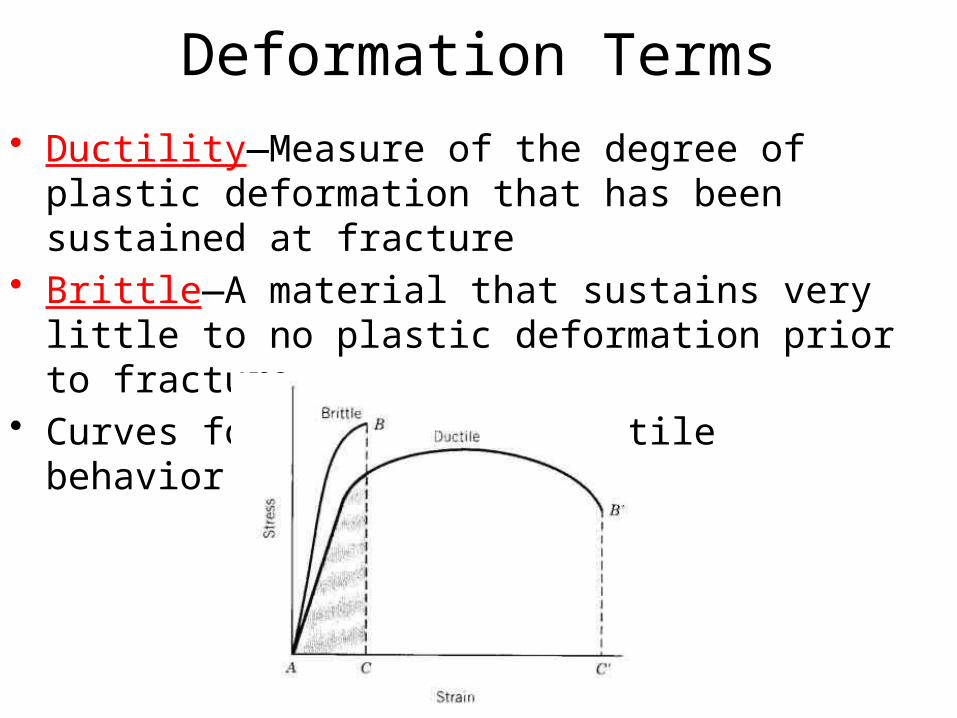
Deformation Terms• Ductility—Measure of the degree of plastic
deformation that has been sustained at fracture• Brittle—A material that sustains very little to no plastic
deformation prior to fracture• Curves for brittle and ductile behavior:
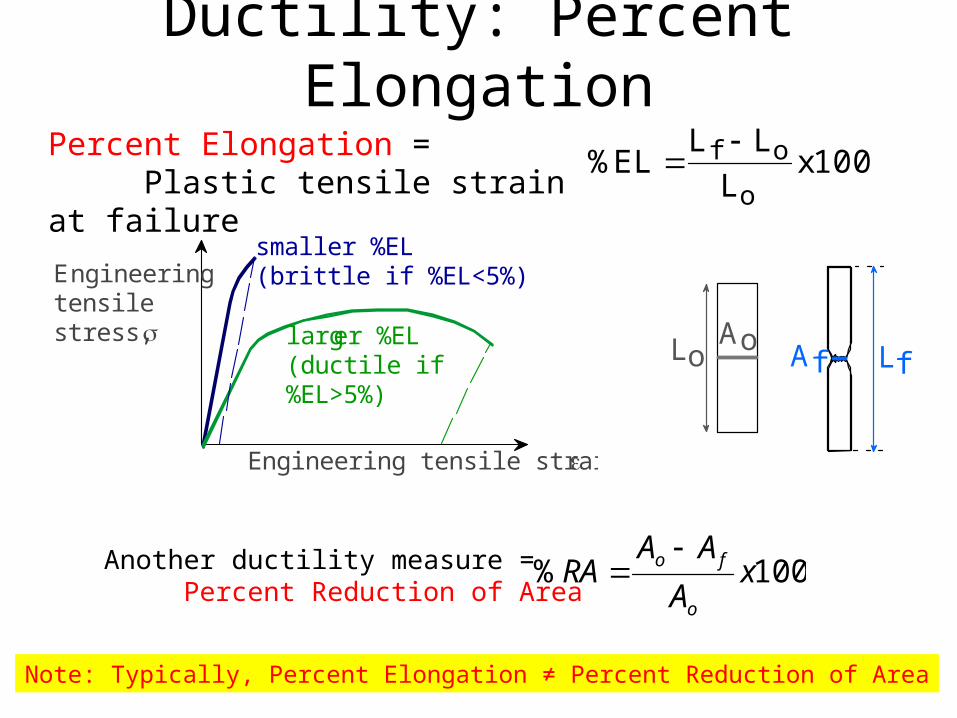
Percent Elongation = Plastic tensile strain at failure
Engineering tensile strain, e
Engineering tensile stress, s
smaller %EL (brittle if %EL<5%)
larger %EL (ductile if %EL>5%)
Another ductility measure = Percent Reduction of Area
100% xA
AARA
o
fo -
Lo LfAo Af
%EL
L f - LoLo
x100
Ductility: Percent Elongation
Note: Typically, Percent Elongation ≠ Percent Reduction of Area

Toughness = Energy to break a unit volume of material - Approximated by the area under the stress-strain curve.
Toughness
Brittle fracture: elastic energyDuctile fracture: elastic + plastic energy
very small toughness (unreinforced polymers)
Engineering tensile strain, e
Engineering tensile stress, s
small toughness (ceramics)
large toughness (metals)
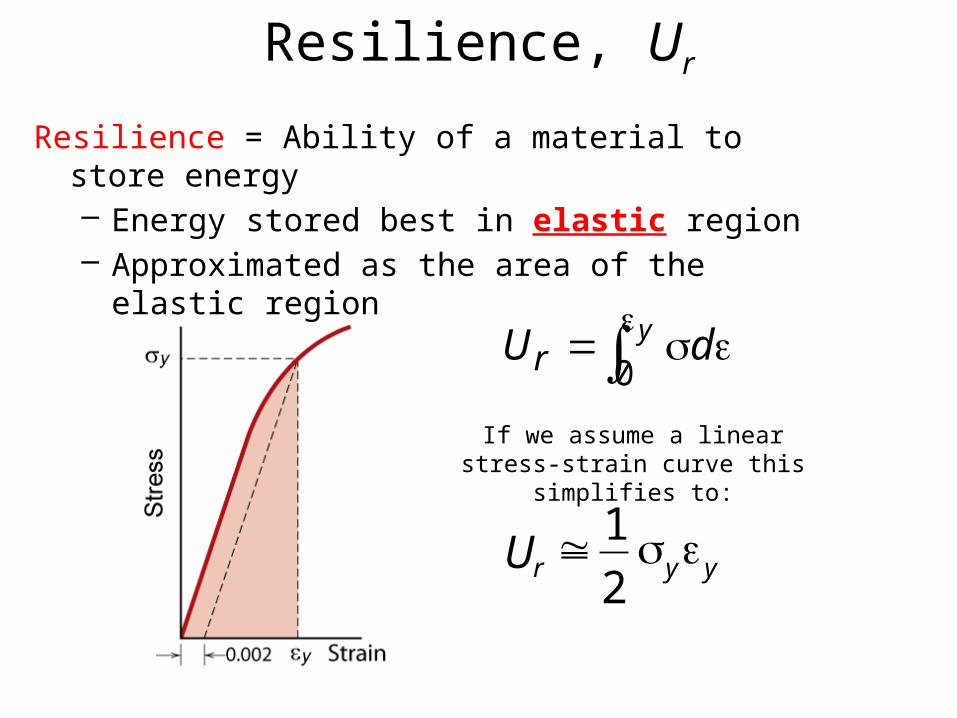
Resilience, Ur
Resilience = Ability of a material to store energy – Energy stored best in elastic region– Approximated as the area of the elastic region
If we assume a linear stress-strain curve this simplifies to:
yyr2
1U es@
e
es y dUr 0
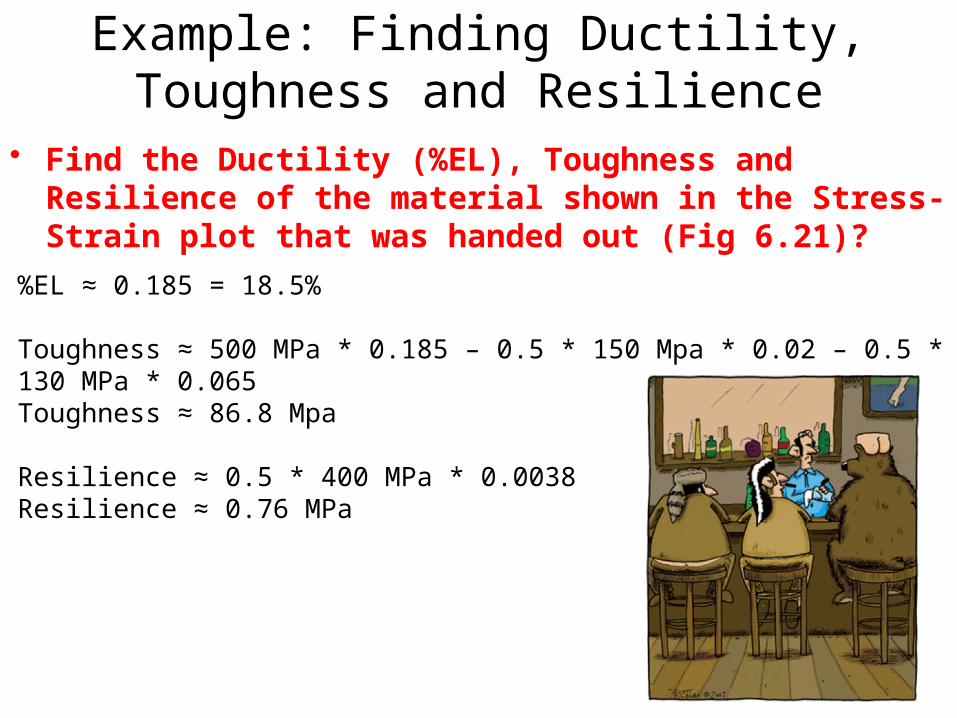
Example: Finding Ductility, Toughness and Resilience
• Find the Ductility (%EL), Toughness and Resilience of the material shown in the Stress-Strain plot that was handed out (Fig 6.21)?
%EL ≈ 0.185 = 18.5%
Toughness ≈ 500 MPa * 0.185 – 0.5 * 150 Mpa * 0.02 – 0.5 * 130 MPa * 0.065Toughness ≈ 86.8 Mpa
Resilience ≈ 0.5 * 400 MPa * 0.0038Resilience ≈ 0.76 MPa
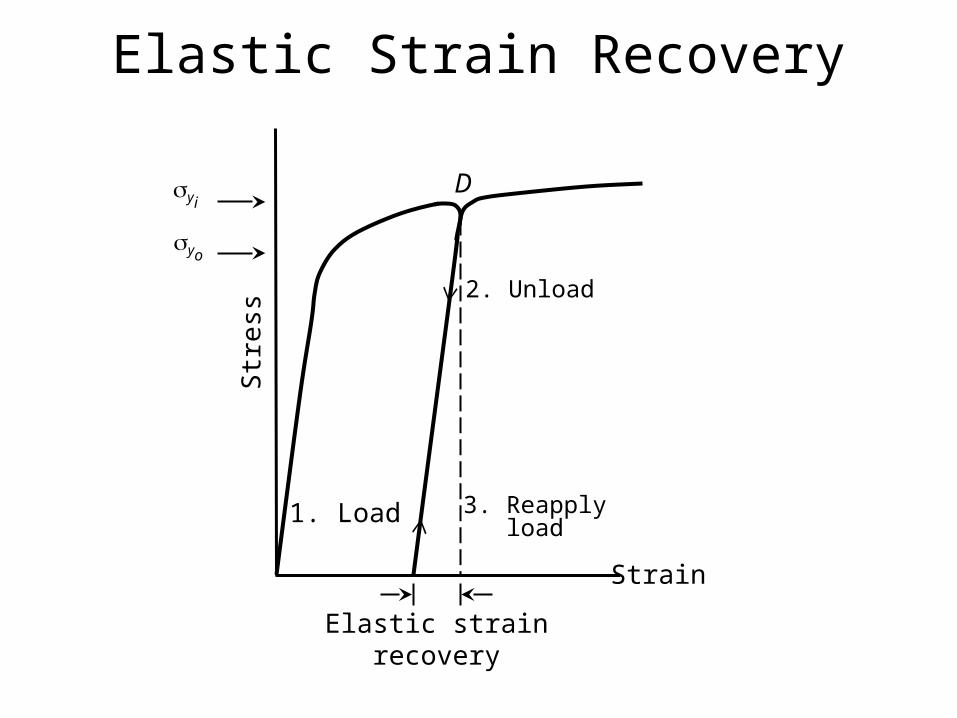
Elastic Strain Recovery
Str
ess
Strain
3. Reapplyload
2. Unload
D
Elastic strainrecovery
1. Load
syo
syi

Conclusion• Stress and Strain• Elastic and Plastic Behavior• Mechanical Properties found from Stress-Strain Curve
– Modulus of Elasticity– Yield Strength– Ultimate Tensile Strength– Ductility– Toughness– Resilience
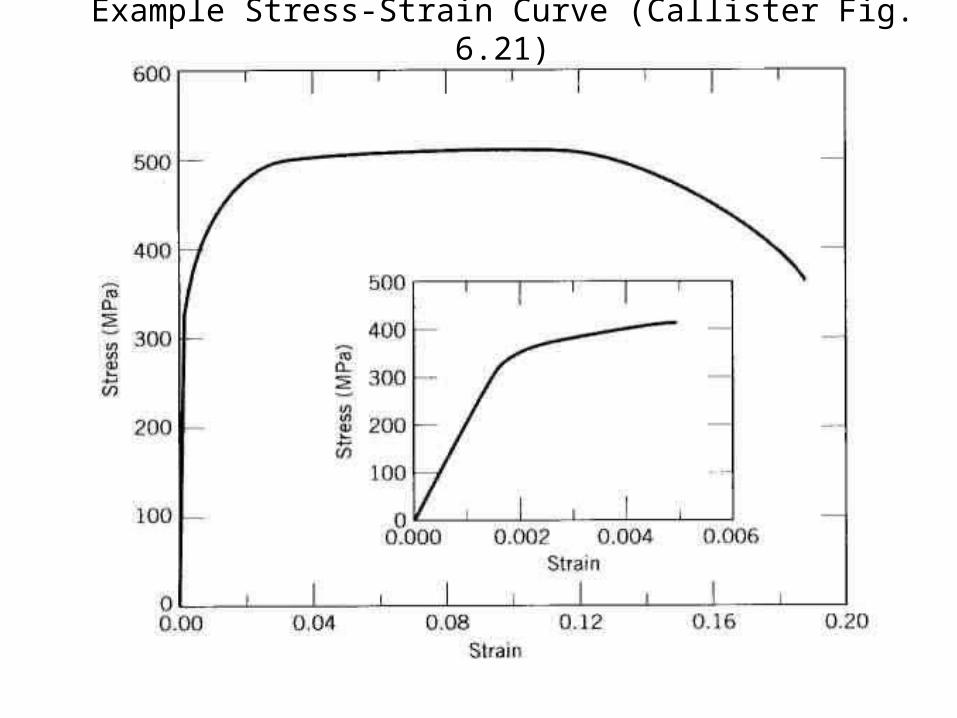
Example Stress-Strain Curve (Callister Fig. 6.21)