
EM Receiver - Geophysics & Exploration Instruments | Instrumentation GDD€¦ · ·...
26
860 boul. de la Chaudière, suite 200 Québec (Qc), Canada, G1X 4B7 Tel.: +1 (418) 877-4249 Fax: +1 (418) 877-4054 E-Mail: [email protected] Web site: www.gdd.ca NordicEM24 EM Receiver Instruction Manual
Transcript of EM Receiver - Geophysics & Exploration Instruments | Instrumentation GDD€¦ · ·...

860 boul. de la Chaudière, suite 200
Québec (Qc), Canada, G1X 4B7
Tel.: +1 (418) 877-4249
Fax: +1 (418) 877-4054
E-Mail: [email protected]
Web site: www.gdd.ca
NordicEM24 EM Receiver
Instruction Manual
Instrumentation GDD inc. 2016-01-20 Page 2
Contents
INTRODUCTION 4
SOFTWARE OVERVIEW 4
STATUS BAR 5
GRAPHIC CONTROLS 5
TOOLBARS 6
PANEL MENU 7
SETTINGS 8
SURVEY 8
TIMING 8
CHANNELS 9
FILE 10
PREFERENCES 10
WINDOWS 10 DEVICES STATUS 11
GETTING STARTED 12
BEFORE THE SURVEY 12
SURVEY SETTINGS 12
TAKING READINGS 12
ADVANCED SETTINGS 13
COMMON TASKS 13 SCOPE MODE 13 ACQUISITION MODE 13
ADVANCED FUNCTIONS 13 IMPORTING WINDOWS SCHEME (CSV OR XML) 13 OPEN AN EXISTING PROFILE 14 COPY THE DATA 14
HARDWARE 15
ACCESSORIES 15
COMPONENTS 15 POWER ON/OFF 16 LED INDICATORS 16 RELEASE LATCHES 16 AUXILIARY MOUSE 16 GPS ANTENNA 16 CONNECTORS 16
Instrumentation GDD inc. 2016-01-20 Page 3
TIPS WHEN USING COMMERCIAL TEM TRANSMITTERS AND SENSORS 18
COMBINATION TO OTHER TRANSMITTERS 18
SURFACE TEM SURVEYS 18
DOWNHOLE TEM SURVEYS 19
SPECIFICATIONS 22
PHYSICAL 22
NORDICEM24 SOFTWARE’S 22
ANALOG CONNECTOR PINOUT 23
TX CONTROL CONNECTOR PINOUT 23
TROUBLESHOOTING SECTION 24
RESETTING ALL PREFERENCES TO PROGRAM’S DEFAULT SETTINGS 24
RESETTING THE COMPUTER 24
BATTERIES ARE NOT CHARGING 24
THE UNIT WILL TURN ON ONLY IF THE CHARGER IS CONNECTED 24
GPS NOT AVAILABLE 24
DUMP .dat FILE FORMAT 25
Instrumentation GDD inc. 2016-01-20 Page 4
Introduction
The new leading-edge NordicEM24 has been developed by Instrumentation GDD inc. and successfully field tested by experienced geophysicists from a major Canadian company in different geological and meteorological conditions. Especially designed to be efficient in cold weather, the compact and environmentally sealed NordicEM24 including a detachable screen has been developed for mineral exploration as well as groundwater and environmental applications. The NordicEM24 receiver has an easy to use graphical user interface that will be further introduced in this document.
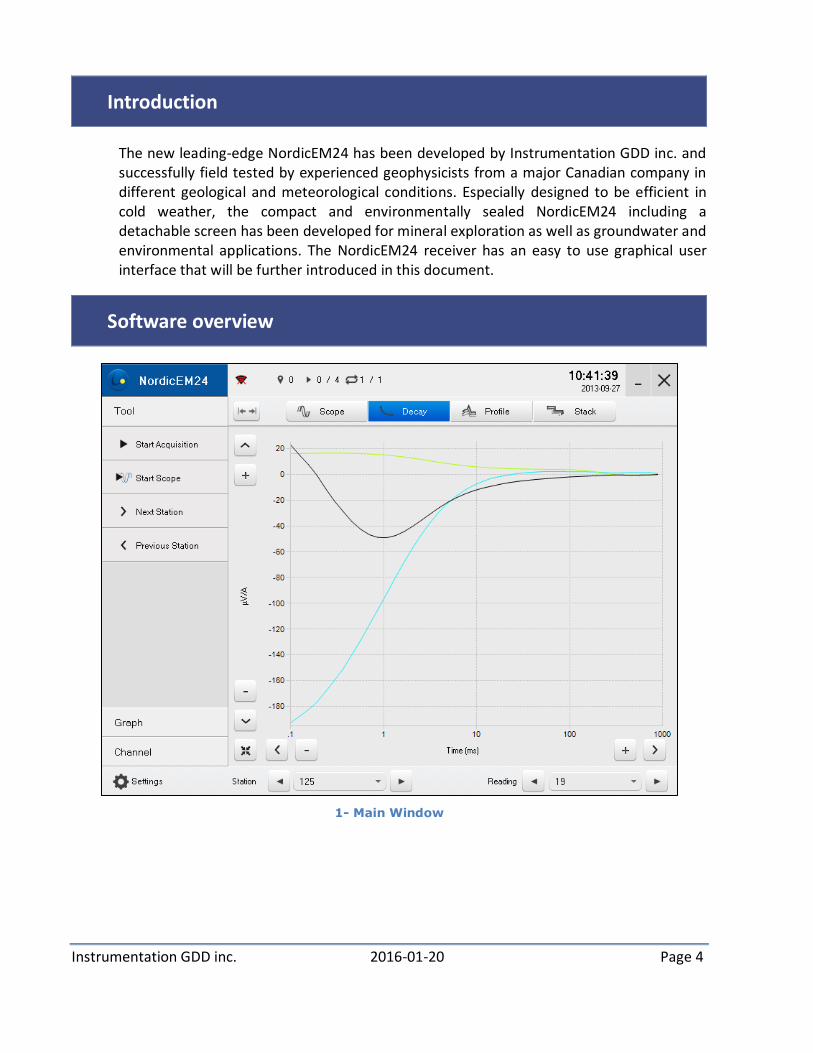
Software overview
1- Main Window
Instrumentation GDD inc. 2016-01-20 Page 5
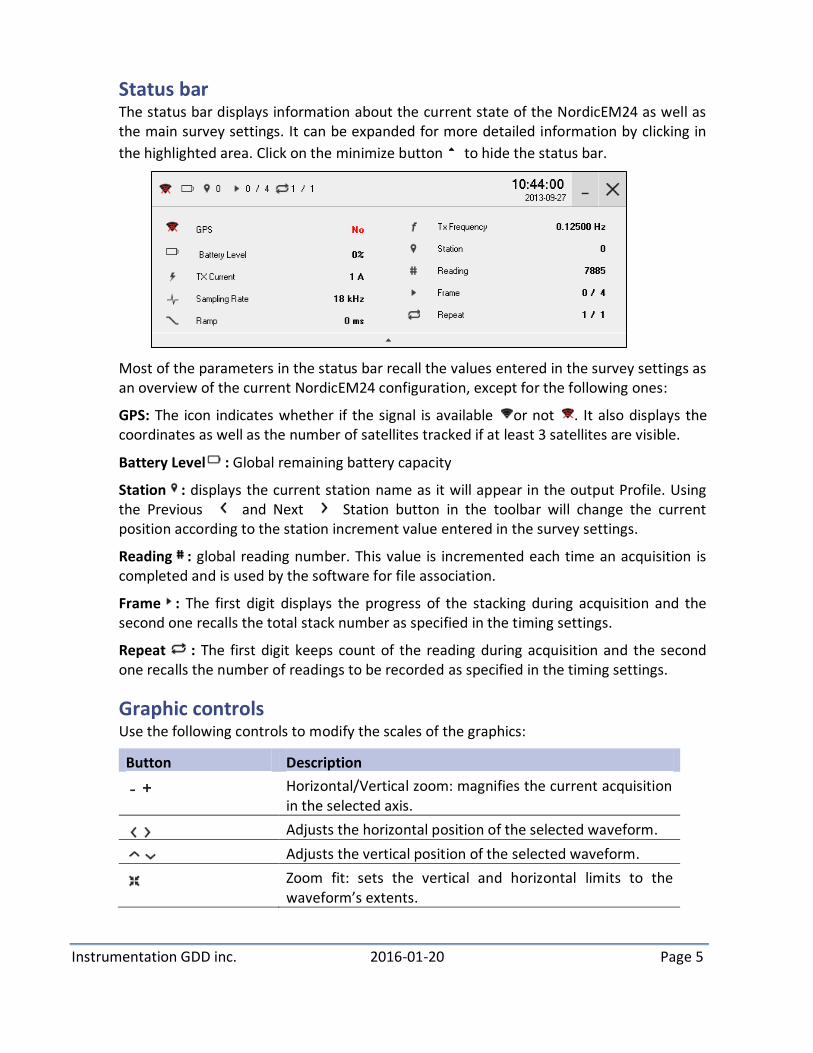
Status bar The status bar displays information about the current state of the NordicEM24 as well as the main survey settings. It can be expanded for more detailed information by clicking in
the highlighted area. Click on the minimize button to hide the status bar.
Most of the parameters in the status bar recall the values entered in the survey settings as an overview of the current NordicEM24 configuration, except for the following ones:
GPS: The icon indicates whether if the signal is available or not . It also displays the coordinates as well as the number of satellites tracked if at least 3 satellites are visible.
Battery Level : Global remaining battery capacity
Station : displays the current station name as it will appear in the output Profile. Using the Previous and Next Station button in the toolbar will change the current position according to the station increment value entered in the survey settings.
Reading : global reading number. This value is incremented each time an acquisition is completed and is used by the software for file association.
Frame : The first digit displays the progress of the stacking during acquisition and the second one recalls the total stack number as specified in the timing settings.
Repeat : The first digit keeps count of the reading during acquisition and the second one recalls the number of readings to be recorded as specified in the timing settings.
Graphic controls Use the following controls to modify the scales of the graphics:
Button Description
Horizontal/Vertical zoom: magnifies the current acquisition in the selected axis.
Adjusts the horizontal position of the selected waveform.
Adjusts the vertical position of the selected waveform.
Zoom fit: sets the vertical and horizontal limits to the waveform’s extents.
Instrumentation GDD inc. 2016-01-20 Page 6
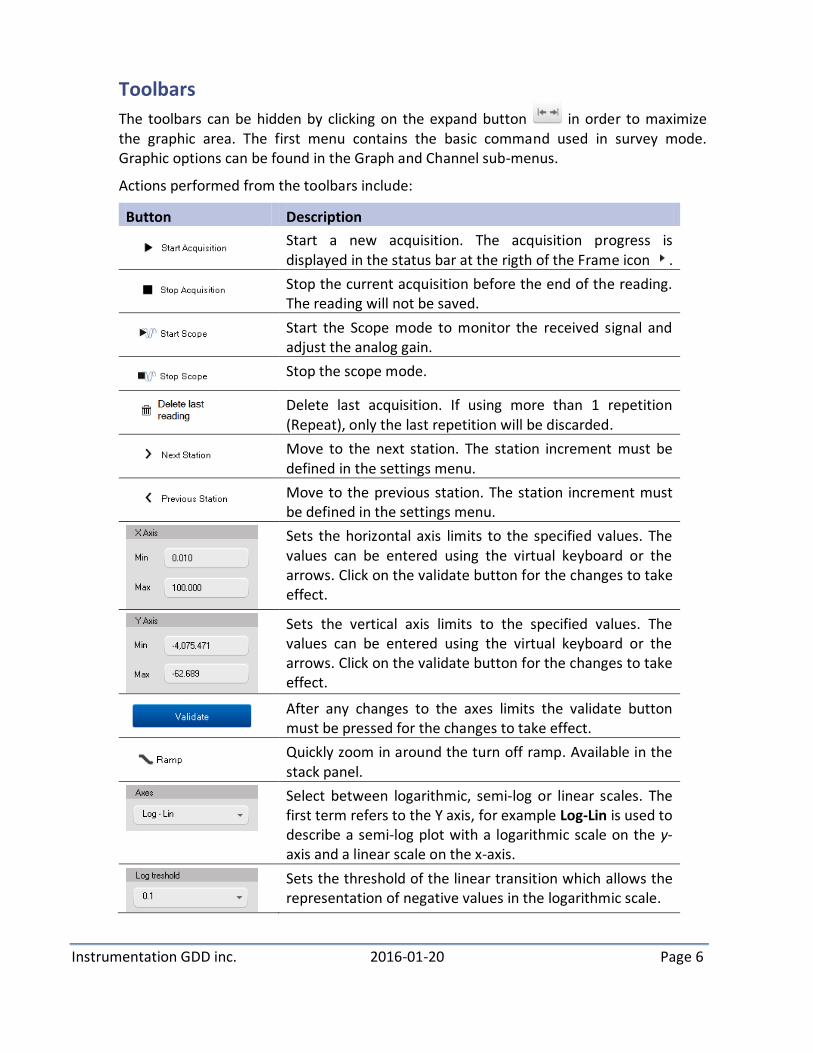
Toolbars
The toolbars can be hidden by clicking on the expand button in order to maximize the graphic area. The first menu contains the basic command used in survey mode. Graphic options can be found in the Graph and Channel sub-menus.
Actions performed from the toolbars include:
Button Description
Start a new acquisition. The acquisition progress is displayed in the status bar at the rigth of the Frame icon .
Stop the current acquisition before the end of the reading. The reading will not be saved.
Start the Scope mode to monitor the received signal and adjust the analog gain.
Stop the scope mode.
Delete last acquisition. If using more than 1 repetition (Repeat), only the last repetition will be discarded.
Move to the next station. The station increment must be defined in the settings menu.
Move to the previous station. The station increment must be defined in the settings menu.
Sets the horizontal axis limits to the specified values. The values can be entered using the virtual keyboard or the arrows. Click on the validate button for the changes to take effect.
Sets the vertical axis limits to the specified values. The values can be entered using the virtual keyboard or the arrows. Click on the validate button for the changes to take effect.
After any changes to the axes limits the validate button must be pressed for the changes to take effect.
Quickly zoom in around the turn off ramp. Available in the stack panel.
Select between logarithmic, semi-log or linear scales. The first term refers to the Y axis, for example Log-Lin is used to describe a semi-log plot with a logarithmic scale on the y-axis and a linear scale on the x-axis.
Sets the threshold of the linear transition which allows the representation of negative values in the logarithmic scale.

Instrumentation GDD inc. 2016-01-20 Page 7
Sets the horizontal axis limits of the profile to the specified values.
Specify the window range used to plot the profile.
Unfold the menu to set the analog gain of the selected channel while in scope mode.
The check box show or hide a component from the current graphic panel. This functionality has no effect on the recorded data.
Panel menu Use this menu to switch between the different visualization modes:
Scope panel : Displays raw data in scope mode. This mode is not synchronised with the transmitted waveform and doesn’t produce any output file. It can be useful to quickly check for a proper connection with the sensor, visualise the strength of the received signal or measure the ambient noise.
Decay panel : Displays the decay curve windowed with the selected window scheme in the settings menu. This panel recalls all the decays in the current line. You can navigate through the recorded data by changing the station and the reading number in the lower part of the graph.
Profile panel : Displays the profile from all the recorded readings in the current line.
Stack panel : Displays the full waveform of the last recorded staked data. Once a stack is recorded, this panel can be used to estimate the turn off time of the transmitter or other synchronisation delays.

Instrumentation GDD inc. 2016-01-20 Page 8
Settings The settings menu contains several submenus that set the survey parameters as well as the application preferences. If text values must be entered within any of the settings field, you can click in the text box and the on screen keyboard will automatically appear.
You can also open it by clicking on the keyboard icon .
Survey
This page contains the basics survey settings to be entered before taking the first reading.
Station name: Numerical value of the first station, typically recalled from the GPS coordinates.
Tx Current: Must be manually set according to the output current of the transmitter. As the recorded data are displayed in uV/A and therefore normalized by the primary current, this value must be updated before the acquisition if the transmitted current varies from one reading to another.
Loop #: This value is not involved in the data processing but is saved in the output file for data identification if more than one loop is used during the survey.
Line Name: Name or numerical value of the grid line, typically recalled from the GPS coordinates. The output data file will be named after the line name. To append the recorded decays at the end of an existing file, click on the browse button to select it.
Loop Side: Length of the transmitting loop side along the survey line. This value is not involved in the data processing but is saved in the output file for future reference.
Operator Name: This value is saved in the data file for future reference.
Station Increment: Enter here the separation between two adjacent stations along the survey line. The Previous and Next Station button in the toolbar will quickly decrement or increment the station number according to this value.
Survey Type: Choose from the drop-down menu the survey configuration. This value is saved in the data file for future reference.
Timing
Base Frequency: You must enter here the same base frequency than in the Transmitter Controller to have a properly synchronized recorded waveform. The base frequency should be selected by the following way to ensure a maximum power line noise rejection:
Neglecting to do so may greatly affect the power line noise filtering and in the worst case may leave it unaffected. A warning message will be inserted in this field if the Local Power Lines setting is not compatible with the selected base frequency.
Instrumentation GDD inc. 2016-01-20 Page 9
Sampling Rate: Defines at which rate, in number of samples per seconds, the analog signal is recorded.
Ramp: Defines the turn off ramp in ms. The time gates of the window scheme are shifted after the end of the ramp.
Delay: Sensor delay is in ms. Use this parameter to combine any other delays in order to adjust the synchronisation with the transmitted waveform. This value is normally very small and should reflect the time delay between the measured turn off time on the waveform and the real expected turn off time.
Stacks: Defines the number of stacks in half cycle count. A complete bipolar transmitter cycle includes two half cycles, i.e. if the base frequency is 1Hz then two (2) half cycles will be recorded to the stack in 1 sec.
Repeat: Defines the number of readings that will be recorded. Once a new acquisition is started, the NordicEM24 keeps count of the readings and automatically restarts a new acquisition until repeat value is reached.
Stacking Algorithm: You can either choose from a standard (mean) or a filtered (weighted mean) stacking algorithm. The weighted mean algorithm has a better noise rejection ratio in many situations but the standard algorithm may perform better in some environment depending of the surrounding noise sources. This parameter can later be modified in the post processing software but the Save Raw File option must be activated as the RAW files are mandatory to calculate a new Stack.
Transmitter Type: Choose from the drop-down menu the type of transmitter used. This parameter must be the same than in the Transmitter Controller to have a properly synchronized recorded signal.
TX Continuous: If unchecked, the transmitter will be enabled only during acquisition or in scope mode and will be shut down otherwise. Note: use this option only if the transmitter is triggered directly by the NordicEM24 receiver. This will have no effect if the TX Control Box is being used.
Local Power Lines: Power line frequency (50Hz or 60Hz). This value is not involved in the data processing but is saved in the data file for future reference. Transmitter’s base frequency should be chosen according to this value.
Channels
Activate the required channels and assign them a component name. The components will be plotted separately in the Profile. You can also set the analog gain for each channel in this page. The Low Pass Filter can be selected in this menu (valid only for FPGA versions ≥ 1.7). The High Res filter is the default value because it has the largest bandwidth. It is suggested to use the Smooth filter when using small Tx loops, surveying close to the Tx loop and\or surveying over very resistive environments. Note that once selected, there is no possibility to change the filter in post-process.
Leave the unused channel OFF to preserve battery life.

Instrumentation GDD inc. 2016-01-20 Page 10
File
Enter the project directory where you want the output files to be saved. You can also choose whether or not you want to keep the full raw waveforms.
Import Settings : Use this feature to quickly set the receiver’s settings with a previously created configuration file. Browse to the xml file and click open.
Export Settings : Creates a configuration file to save the environment settings for re-use. Various standard configuration files can be created with this feature for initial configuration.
The different output data files are:
RAW: This binary file contains the complete raw data of a single reading. In order to save disk space this file is not automatically saved: check the Save Fullwave box if you want to keep this file for future reference or post processing. You should keep this file if you want to change the following parameters in the post process software: change the stack number, discard a noisy stack, apply a spheric filter or change the stacking algorithm.
STK: This binary file contains the stacked raw data of a single reading.
DAT: This text file contains the processed data that can be imported in the post processing software for further examination or into a third party data interpretation software. The .dat file is named after the line name so a new file will be created for each survey lines. If the same line name is used more than once, the new recorded data will be added at the end of the existing file.
Preferences
You can set the preferred graphic axis scales of the Stack, Decay and Profile in this page. The settings of the Decay and Profile waveforms can also be modified in the Graph toolbar for quicker access. A linear transition around zero is created on logarithmic scales in order to plot both positive and negative values.
Acquisition Graph Setup: Defines which signal will be displayed during and after the acquisition process.
Allow comments: If the check box is marked, prompts the operator to enter a comment on the reading after the acquisition is completed. This will be saved in the data files for future reference.
Beep on completion: Toggle ON/OFF the audio beep that marks the end of the acquisition.
Windows
This page describes the window scheme that is used to compute the Profile and the decay curves. You can either choose from the standard GDD window scheme or an existing pattern of another EM receiver for easier data comparison. Enter the Vpri window limits in the lower section. The sensor’s delay as well as the turn off ramp are taken into account to

Instrumentation GDD inc. 2016-01-20 Page 11
set the time gates’ origin. The points of reference are: the turn off time for the Vpri and the end of the ramp for the other windows.
New List : Creates a new user defined window scheme. Enter the new list name when prompted and specify each start/end times. Once completed, this newly created list should be saved for future use otherwise it will be erased when another one is selected.
Save List : Saves a user define window list to a .wnd file. The destination folder should remain unchanged so that the NordicEM24 software retrieves it properly in the available window scheme list.
Import List : Import a previously created window list in the WindowDef folder.
Devices Status
Battery: This page contains information that serves only to monitor batteries states.
GPS: Coordinates and satellites information. The GPS format can be changed using the drop-down menu. The displayed coordinates will be set according to this value as well as the EAST and NORTH column in the output .dat file. The earth is modelled by the WGS-84 ellipsoid.
Synchronisation: Status of the synchronisation module:
• Synchronised: Indicates whether the receiver is synchronised or not with the
Transmitter Controller. This field reflects the status of the SYNC led on the control
panel.
• Timing Module Status: Operating mode of the timing module. If the module is
synchronised, the status should be Phase Locking if the synchronisation source is
available or Auto Holdover if the synchronisation source was available during
synchronisation but is no longer detected. In Auto Holdover mode the internal crystal
maintains the synchronisation. Possible values are:
o System Warm-up (15 minutes crystal warming time at power up)
o Frequency locking (coarse initial frequency adjustment)
o Phase Aligning (coarse 1PPS phase alignment)
o Phase locking (continuous fine phase alignment)
o Auto Holdover (already synchronized but the source is no longer detected)
o Waiting for Reference (selected reference is not available).
o System Reset (when connected to the Tx Controller and Resetting the
synchronization)
• Source Selected: Displays which source of synchronisation is being used by the
timing module : GPS (default) or External
• GPS Source Detected/External Source Detected: Indicates whether the GPS and
External (cable) sources are detected or not.

Instrumentation GDD inc. 2016-01-20 Page 12
Getting started
Before the survey • Make sure that the batteries are fully charged.
• Power ON the crystal unit at least 30 min before starting the survey to make sure
that the crystal is stable. This will speed up the acquisition process and ensure a
smaller drift over time in case of GPS signal lost.
• It is recommended to fully start the computer only when ready to synchronize to
maximize battery life.
• Synchronise the NordicEM24 with the Transmitter Controller as explained in the user
manual. This step can be skipped if the transmitter is triggered locally by the
Receiver.
• Start the NordicEM24 software by clicking on this icon .
• Enter the survey parameters in the settings menu .
Survey settings • In the Survey page, enter the first Station Name, TX Current, Line Name and
Station Increment according to the survey parameters. Even though the other fields
will not affect the readings you should also properly sets them as they are saved in
the output file for future reference.
• Go in the timing page and enter the TX’s Base frequency and Transmitter type as
configured in the Transmitter Controller. Make sure that the Sampling Rate, Ramp,
Delay, Stack number and Stacking Algorithm recalled from the last session fits the
current survey needs.
• In the Channel page , make sure that the required channels are activated and that
their component names fit the sensor connection. Select the desired Lop Pass Filter.
• If this is a new project you may want to save the resulting files to a new destination.
This can be specified in the File page. Make sure to check the box Save fullwave if
you want to keep the RAW data for future reference or re-process.
• Select the proper window scheme in the Windows page.
Taking readings • Start the scope mode to monitor the received signal and adjust the analog gain.
Make sure that the sensor’s components are properly connected and that the
sensor’s offset is adjusted if applicable.
• Start the acquisition . You can monitor the recording process in the status bar.

Instrumentation GDD inc. 2016-01-20 Page 13
• When the reading is completed and processed, the final stack will be displayed.
• You can switch to the Decay or Profile panel to review the readings. At least two
stations must be recorded to plot a profile.
• When the current station has been recorded, press on the Previous or Next
Station button in the toolbar to move to the next one. The station number in the
status bar will be updated with the new value.
• If you do not wish to keep the last reading, discard the last reading by clicking on .
Advanced settings
Common tasks
Scope mode
Start the scope mode to monitor the received signal and adjust the analog gain. This mode is not synchronised with the transmitted waveform and doesn’t produce any output file. It can be useful to make sure that the sensor’s components are properly connected and that the sensor’s offset is adjusted if applicable.
Two dashed lines on the scope panel indicate the saturation threshold of the displayed components according to their analog gain. The background color will change to indicate that a channel is saturated and will revert to the default color if the signal drops back below the maximum level in scope mode.
Acquisition mode
Once all the settings are properly configured start the Acquisition mode to record the received signal. The binary Stack file and the text Data file containing the decays will be saved upon completion. If the Save Raw Data option is enabled, a binary raw file containing all the sampled points will also be saved. The sampled signal is displayed in the Scope panel while the acquisition is progressing. You can configure how the signal will be displayed in the Preferences menu.
If a channel is saturated, the background color will change to indicate a bad reading. The color will not revert to default even if the signal drops back below the maximum level in acquisition mode.
Advanced functions
Importing windows scheme (CSV or XML)
You can either choose from a standard list of Windows Scheme or create your own time gate definition. If you want to import an existing window file definition, open Settings -> windows and click on the Import button.
Instrumentation GDD inc. 2016-01-20 Page 14
The VPRI primary voltage is defined by its beginning and end time. In order to measure the primary voltage before the turn OFF ramp, the values entered must be negatives.
Open an existing profile
To plot a profile already recorded, open Settings -> Survey Setting -> Line … and click on the browse button to select the .dat file. Close the menu with Done and activate the Profile Panel to visualise the data.
Copy the data
To free up disk space or backup your data you can move your survey data to another directory or to a detachable USB drive. If you still want to display the previous decay and profile and append the new data to the existing .dat file you must leave a copy of this file in the working directory. Otherwise a new empty file will be created to save the new data and you will have to manually merge both files to display a continuous profile.
Note: A file named surveysettings.xml is created in the working folder. You should leave a copy of this file in the project directory to keep all the software’s settings. Otherwise you will have to re-enter the survey and timing parameters and make sure to enter the same line name to append the new data to the existing profile.

Instrumentation GDD inc. 2016-01-20 Page 15
Hardware
Accessories When receiving a GDD NordicEM24, ensure that it contains the following elements:
• One (1) NordicEM24
• One (1) Detachable display
• One (1) Power supply
• One (1) Power cord NEMA/IEC
• One (1) kit of international adaptors
• One (1) GDD blue carrying case
• One (1) GDD Quick Start Guide
• One (1) Optional custom cable compatible with your own sensor
• One (1) External display cable
Components The NordicEM24 components are described in this section.
VGA port
Synchronization/ TX control (local)
USB 2.0 ports
Release latches
Charger Analog input
Touch screen LCD Display
ON crystal / unit
OFF / Reset
Auxiliary mouse
LED indicators
External display GPS Antenna

Instrumentation GDD inc. 2016-01-20 Page 16
Power ON/OFF
Power ON: Press the ON button once to power ON only the crystal unit. This will heat the crystal to its stable temperature and allow faster synchronization. Press it twice to power ON the unit.
Power OFF / Reset: Press and hold the OFF button for 2 seconds to reset the unit, 4 seconds to turn OFF the unit.
LED indicators
CRYSTAL: Crystal is powered on and heating
ON: Power ON state
CHARGING: Charge in progress
SYNC: Synchronization completed
DUTY CYCLE -: Transmitter ON time, negative polarity
DUTY CYCLE +: Transmitter ON time, positive polarity
Release latches
Open to detach the LCD screen and use it as an external monitor. You must use the provided external display cable and attach it to the external display port.
Auxiliary mouse
The auxiliary mouse can be used to navigate through the menus instead of using the touch screen monitor.
GPS antenna
Indicates the position of the built-in GPS antenna. In case of poor GPS signal reception caused by a bad orientation of the antenna or reflection of nearby objects try to tilt or rotate the receiver in order to align the antenna with a clear sky view.
Connectors
SYNC/TX CTRL: Connect the SYNC cable between the Transmitter Controller and the Receiver to synchronize in external synchronization mode only. If the GPS synchronization is selected the cable is not necessary. This connector can also serve to connect the TX CTRL cable to the transmitter in order to control the transmitter locally.
CHARGER: Connect the power supply between the NordicEM24 and a power outlet to charge the batteries. The CHARGING indicator will light during the charge cycle which may takes up to 6 hours to complete.
Analog: Inputs of the acquisition channels.
Instrumentation GDD inc. 2016-01-20 Page 17
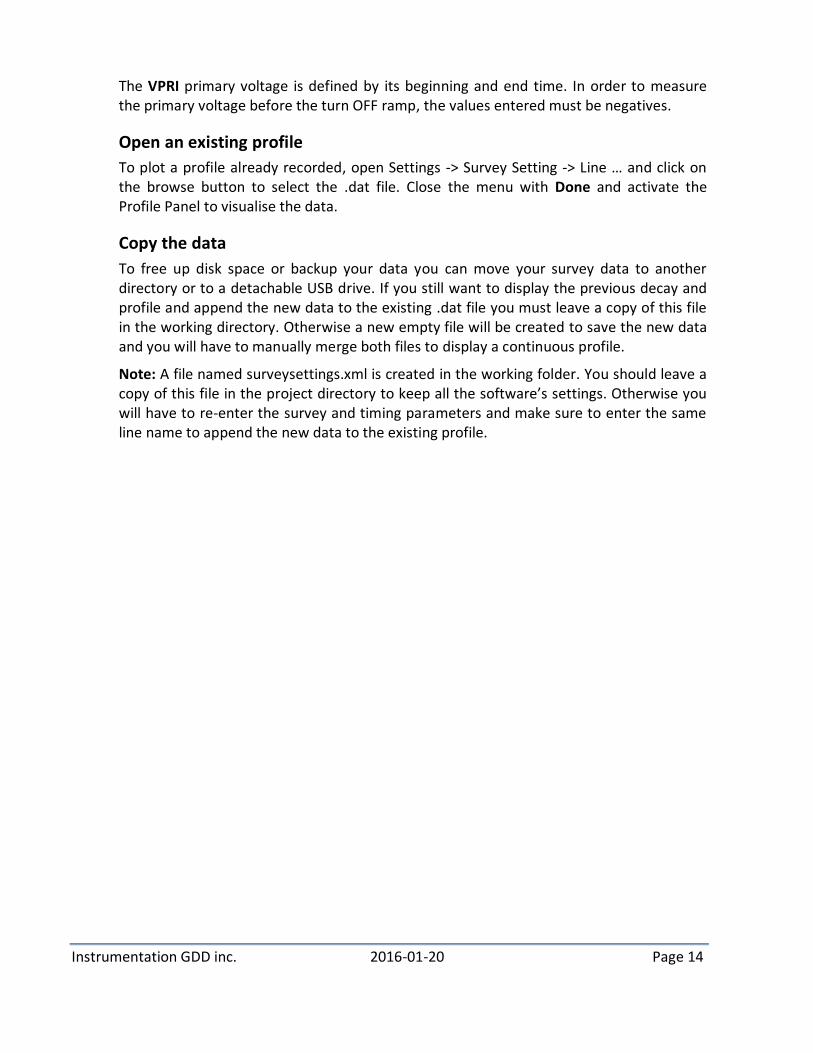
USB: Provided to easily transfer survey data via a USB drive using Windows file explorer. You can also use these ports for connecting a peripheral to the internal computer as needed.
VGA: Video output connector for an external auxiliary monitor.
External Display: Touch screen LCD connector for the detachable LCD monitor.
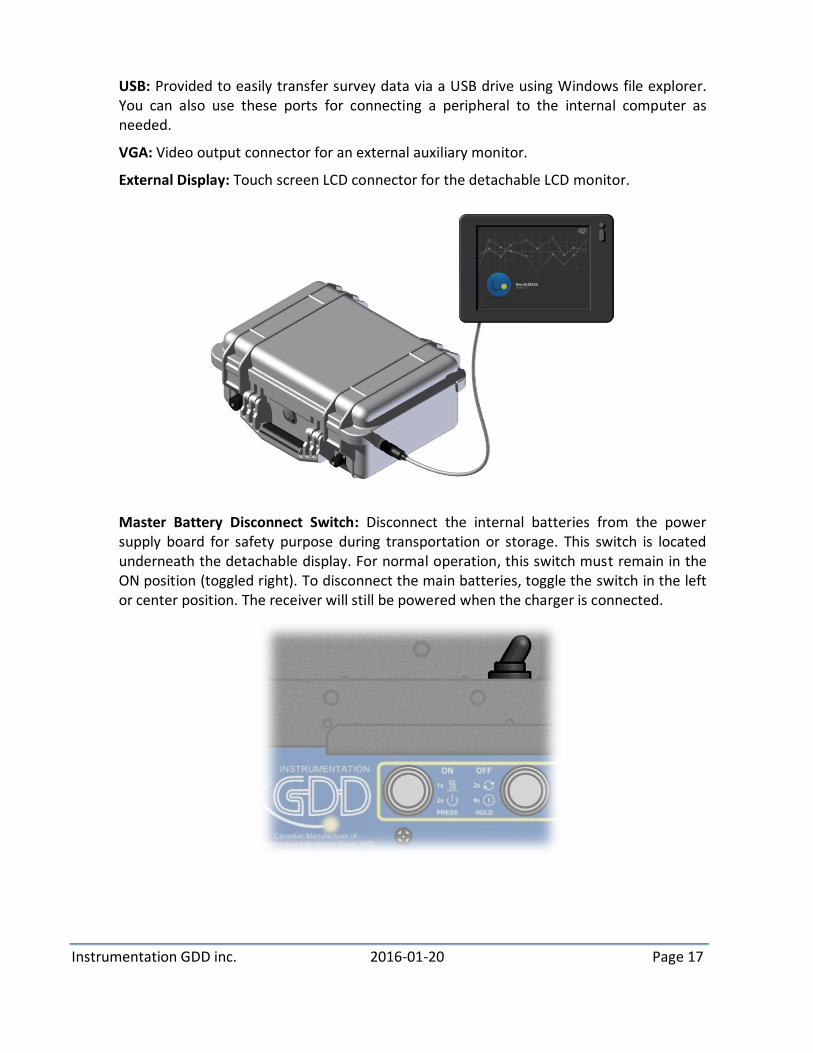
Master Battery Disconnect Switch: Disconnect the internal batteries from the power supply board for safety purpose during transportation or storage. This switch is located underneath the detachable display. For normal operation, this switch must remain in the ON position (toggled right). To disconnect the main batteries, toggle the switch in the left or center position. The receiver will still be powered when the charger is connected.

Instrumentation GDD inc. 2016-01-20 Page 18
Tips when using Commercial TEM Transmitters and Sensors
Combination to other Transmitters
The NordicEM24 Tx Controller and Receiver can control the following commercial transmitters. Note that a “blunt cut cable” is provided with the NordicEM24 and customers can adapt it to their transmitter at will.
MANUFACTURER OPTIONAL GDD CABLES
Geonics Ltd. Tx.CTLR.B4 cable (use “Duty cycle” end)
Zonge International Tx.Zonge.M
Phoenix Geophysics Tx.CTLR.Phoenix.M
Surface TEM Surveys
The NordicEM24 receiver is compatible with a wide variety of TEM ground sensors. The following Table presents the actual list of optional cables offered by Instrumentation GDD. Note that a “blunt cut cable” is provided with the NordicEM24 and customers can adapt it to their sensors at will.
MANUFACTURER SENSOR OPTIONAL GDD CABLES
Geonics Ltd. HF coils (1D & 3D) LF coils (1D & 3D) Fluxgate (3D-3M)
Rx.Geonics.M cable (ch.1 = X, ch.2 = Y, ch.3 = Z)
Crone Geophysics & Exploration Ltd.
1D coil Rx.Crone.1ch.M cable
LandTEM HT SQUID (3 ch) Rx.LandTEM-SQUID.3ch.M cable
(ch.1 = Z, ch.2 = X, ch.3 = Y)
Supracon HT SQUID (3 ch)
LT SQUID (3 ch)
LT SQUID (6 ch)
Rx.HT-SQUID.3ch.M2 cable (ch.1 = X, ch.2 = Y, ch.3 = Z)
Rx.HT-SQUID.3ch.B cable (ch.1 = XZ ch.2 = X, ch.3 = Y)
Rx.HT-SQUID.6ch.M cable
(ch.1 = Xlo, ch.2 = Ylo, ch.3 = Zlo, ch.4 = Xhi, ch.5 = Yhi, ch.6 = Zhi)
Zonge International TEM\3 coil Rx.4CHbox.B
Note that an attenuator cable “Rx.ATN4” is available to measure voltage beyond ±3.25V over 4 channels. When using this optional cable, all NordicEM24 files (.dat, .stk, .raw) must be multiplied by a scale factor of 4 (easily manageable using the “Sensor conversions” of the NordicEM post-Process software.
Instrumentation GDD inc. 2016-01-20 Page 19
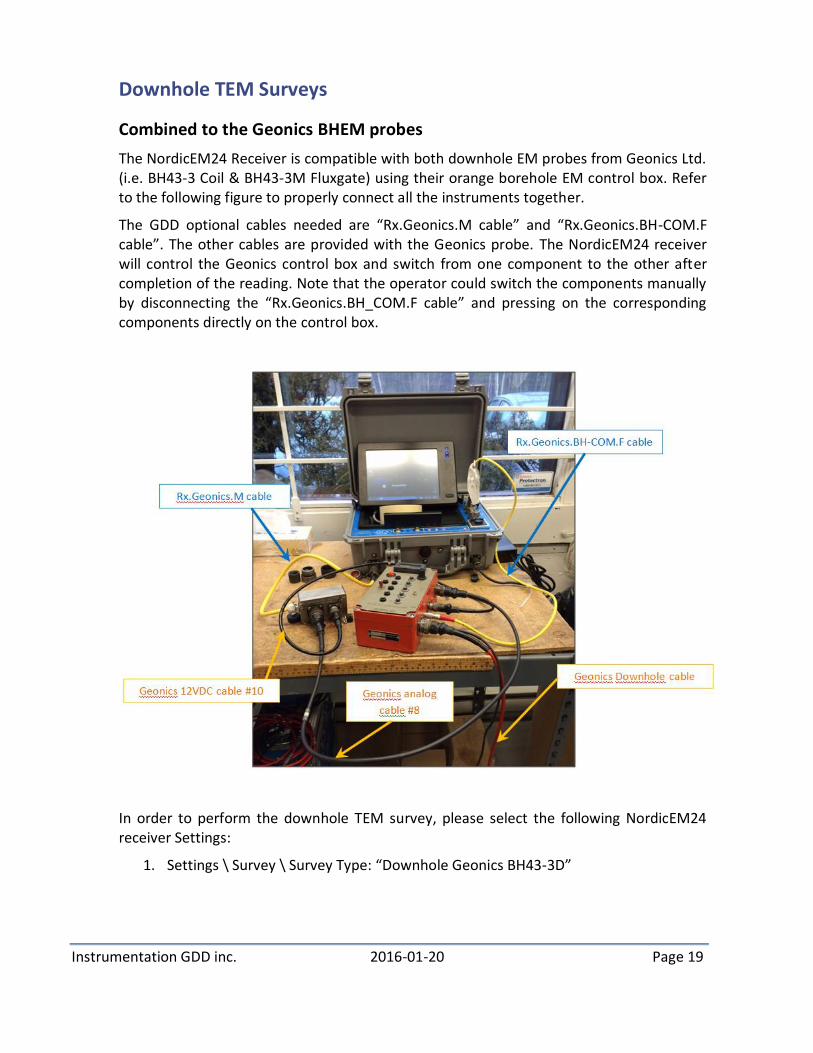
Downhole TEM Surveys
Combined to the Geonics BHEM probes
The NordicEM24 Receiver is compatible with both downhole EM probes from Geonics Ltd. (i.e. BH43-3 Coil & BH43-3M Fluxgate) using their orange borehole EM control box. Refer to the following figure to properly connect all the instruments together.
The GDD optional cables needed are “Rx.Geonics.M cable” and “Rx.Geonics.BH-COM.F cable”. The other cables are provided with the Geonics probe. The NordicEM24 receiver will control the Geonics control box and switch from one component to the other after completion of the reading. Note that the operator could switch the components manually by disconnecting the “Rx.Geonics.BH_COM.F cable” and pressing on the corresponding components directly on the control box.
In order to perform the downhole TEM survey, please select the following NordicEM24 receiver Settings:
1. Settings \ Survey \ Survey Type: “Downhole Geonics BH43-3D”

Instrumentation GDD inc. 2016-01-20 Page 20
2. Settings \ Channels ---> Only one channel will be available. You must active it (check) and adjust the Gain and Low Pass filter (if applicable). The same Gain value will be applied to all components. The Name will be adjusted in the output files.
3. In the .dat file, readings will be organized as followed. Note that X and Y are the rotated un-processed EM while and X1 and Y1 are the final Lateral EM components (de-rotated) that should be used for interpretation.

Instrumentation GDD inc. 2016-01-20 Page 21
Also note that at the end of each data line, the “dip” and “rotation” of the surveyed drillhole is computed from the Geonics probe Tiltmeter values:
Please note that the RAW and STACKED files are not rotated, only the Windowed data is (and thus only the Decay and Profile views at the Rx).
Instrumentation GDD inc. 2016-01-20 Page 22
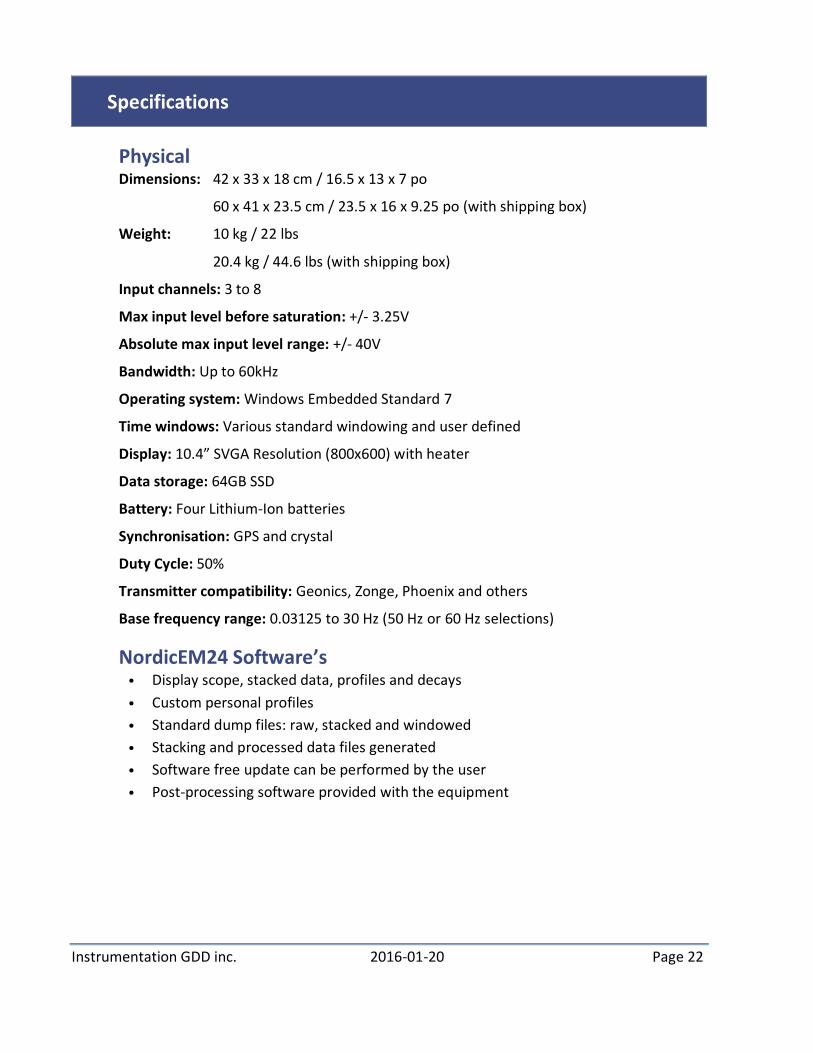
Specifications
Physical Dimensions: 42 x 33 x 18 cm / 16.5 x 13 x 7 po
60 x 41 x 23.5 cm / 23.5 x 16 x 9.25 po (with shipping box)
Weight: 10 kg / 22 lbs
20.4 kg / 44.6 lbs (with shipping box)
Input channels: 3 to 8
Max input level before saturation: +/- 3.25V
Absolute max input level range: +/- 40V
Bandwidth: Up to 60kHz
Operating system: Windows Embedded Standard 7
Time windows: Various standard windowing and user defined
Display: 10.4” SVGA Resolution (800x600) with heater
Data storage: 64GB SSD
Battery: Four Lithium-Ion batteries
Synchronisation: GPS and crystal
Duty Cycle: 50%
Transmitter compatibility: Geonics, Zonge, Phoenix and others
Base frequency range: 0.03125 to 30 Hz (50 Hz or 60 Hz selections)
NordicEM24 Software’s • Display scope, stacked data, profiles and decays
• Custom personal profiles
• Standard dump files: raw, stacked and windowed
• Stacking and processed data files generated
• Software free update can be performed by the user
• Post-processing software provided with the equipment

Instrumentation GDD inc. 2016-01-20 Page 23
Analog Connector Pinout The following table contains the pin description that can be used to build a custom analog cable to fit the sensor.
Function PT06E-14-19P(SR)
CH1 - A
-12V B
+12V C
CH8- D
CH7- E
CH6- F
CH6+ G
CH5- H
CH4- J
CH3- K
CH3+ L
CH2+ M
CH2- N
CH1+ P
CH8+ R
CH7+ S
CH5+ T
CH4+ U
GND V
TX Control Connector Pinout The following table contains the pin description that can be used to build a custom control cable to fit the transmitter.
Function PT06A-12-14P(SR)
DUTY CYCLE H
GND L
POLARITY M

Instrumentation GDD inc. 2016-01-20 Page 24
Troubleshooting section
Resetting all preferences to program’s default settings All the survey settings and custom parameters are saved in a file so they can be applied for the next session. If for any reason the NordicEM24 software’s parameters become corrupted or are no longer valid, it may prevent it from starting normally. In such a case you can start over with the default settings by removing the preferences files. To reset user preferences to the default values you have to manually remove the preferences file surveySettings.xml from the current project directory. The default project directory is D:\data but this can be changed by the user in the settings menu.
This will not affect any collected data but when you next reopen NordicEM24 software, it will rebuild the surveySettings.xml file from program defaults. You will then have to re-enter the survey parameters, i.e. time base, sampling rate, channels, etc.
Resetting the computer If the NordicEM24 software or the operating system itself is not responding, the computer can be reset by holding the OFF button for 2 sec. Do not press it longer as if it is pressed for 4 sec the whole unit will be powered down which will reset the synchronization module.
Batteries are not charging If the batteries are too cold, they might not charge when the power supply is connected. Allow the batteries to warm up above 0°C to re-enable the charging circuit. In addition, the charger will not start charging a battery when its capacity exceeds 95%.
The unit will turn ON only if the charger is connected Make sure that the Master Battery Disconnect Switch is toggled ON. This switch is located underneath the detachable display. For normal operation, this switch must remain in the ON position (toggled right).
GPS not available In case of poor GPS signal reception caused by a bad orientation of the antenna or reflection of nearby objects try to tilt or rotate the receiver in order to align the antenna with a clear sky view.

Instrumentation GDD inc. 2016-01-20 Page 25
Dump .dat File Format
NordicEM24 TEM data file version:00.00.00.00.02.01_03.01_01.01_03.00_04 - created Wed Jul 03 09:15:45 2013
LINE:100 DATATYPE:TEM RECEIVER:NordicEM24 UNITS:(uV/A) CONFIG:In-Loop POWERLINE:60_Hz /TIMESSTART(ms)=0.08,0.096,0.115,0.138,0.166,0.199,0.239,0.287,0.344,0.413,0.495,0.594,0.713,0.856,1.027,1.233,1.479, … /TIMESSTART(ms 0.1,0.12,0.144,0.173,0.207,0.249,0.299,0.358,0.43,0.516,0.619,0.743,0.892,1.07,1.284,1.541,1.849,2.219, …
STN LOOP RDNG ADC COMP NADC EAST NORTH LONG LAT ELEV UTM_ZONE TIME
0 1 7739 1 Z 3 -71.3454700ー 46.7723500ー W71.3454700ー N46.7723500ー 23.69 19 2013070309.15
0 1 7739 2 X 3 -71.3454700ー 46.7723500ー W71.3454700ー N46.7723500ー 23.69 19 2013070309.15
0 1 7739 3 Y 3 -71.3454700ー 46.7723500ー W71.3454700ー N46.7723500ー 23.69 19 2013070309.15
WINDOWS:GDD SENSOR:* SERIAL_NUM:RXEM1004 TRANSMITTER:GDD
OPERATOR FREQ CURR SAMP_RATE GAIN NSTACKS SFTHRES RAMP DELAY NOISE NCH VPRI CH1 … MISC
John 5 1 120000 8 64 0 0.5 0.03 0 35 125309 6.98751
John 5 1 120000 8 64 0 0.5 0.03 0 35 48676.7 76.4678
John 5 1 120000 8 64 0 0.5 0.03 0 35 48714.3 76.0773
First section - File header:
Version: Versions of the NordicEM24 program and firmware installed Created: File creation date (Computer date)
Second section:
LINE: Line number DATATYPE: Type of Data record RECEIVER: Serial number of the receiver UNITS: Data units CONFIG: Survey type configuration POWERLINE: Local power lines frequency
Third section:
/TIMESSTART(ms): Current windows scheme’s start and end time /TIMESSTART(ms):
The DAT file is divided in 4 sections. The fourth one contains the data.
Sections 2 and 3 will be repeated within the same file following a parameter change.
Undefined values are represented by an asterisk (*).
Values in section 4 are delimited by tabulations or spaces. The import software must treat consecutive delimiters as one.
Each line in section 4 has an equal number of columns, determined by the reading with the most entries. If fewer windows are defined for a selected entry, the unused columns will be padded with *.
The example file is truncated on the right side omitting column CH02 to CHn

Instrumentation GDD inc. 2016-01-20 Page 26
Section 4 Column headers: STN Survey station LOOP Tx Loop ID RDNG Reading number (sequential) ADC Corresponding Channel COMP Corresponding Component name NADC Total number of active Channel for this acquisition EAST UTM Easting in meters or Longitude in degrees (with active GPS) NORTH UTM Northing in meters or Latitude in degrees (with active GPS) LONG Longitude in degrees DDD.dddd (with active GPS) LAT Latitude in degrees DDD.dddd (with active GPS) ELEV Elevation above Ellipsoid in meters (with active GPS) UTM_ZONE Current UTM Zone TIME Time and date, format YYYYMMDDHH.SS (Computer time) OPERATOR Operator name FREQ Transmitter’s base frequency CURR Current transmitted in the Tx loop (for data normalisation) SAMP_RATE Sampling rate GAIN Gain NSTACKS Number of stacks (one stack equals one half-cycle) SFTHRES Not implemented in the current version RAMP Turn-off time at Tx DELAY Sensor delay NOISE Noise level (Not implemented in the current version) NCH Number of time windows VPRI Primary field intensity CH1-n Decay windows, measured at CHn times MISC Additional information (sync, saturation, GPS status, Low Pass filter, etc.) ** Date and Hour are those of the Computer.