
Elucidation of Latent Risk of Navigation Using an Actual ... · Elucidation of Latent Risk of...
10
Journal of Traffic and Transportation Engineering 4 (2016) 131-140 doi: 10.17265/2328-2142/2016.03.002 Elucidation of Latent Risk of Navigation Using an Actual Ship Behavior Analysis Xinjia Gao 1 , Hidenari Makino 2 and Masao Furusho 1 1. Graduate School of Maritime Sciences, Kobe University, Hyogo 658-0022, Japan 2. Naval Architecture & Ocean Engineering, Osaka University, Osaka 565-0871, Japan Abstract: In recent years, maritime transportation has played an important role in global economy development. As a result, ship traffic has become more congested. Moreover, ship navigation is susceptible to weather and environmental conditions, and in some cases, it may become dangerous. Therefore, vessels are subjected to high-risk navigation conditions. To understand the latent risk of ship navigation, this study focused on the actual ship behavior. Thus, an analysis of ship behavior was carried out using historical ship navigation based on automatic identification system data. Consequently, a dynamic analysis of the speed and encounter situation was performed. One of the main results of this work was the understanding of the latent risk involved in ships navigating the Seto Inland Sea, which is one of the most congested routes in Japan. Moreover, the risk areas were obtained, and visualized using a geographical information system. The obtained results can be applied to ensure safe navigation and the development of a safe and efficient navigation model. Key words: Maritime traffic, latent risk, ship behavior analysis, AIS (automatic identification system) data, navigation model. 1. Introduction Sea transport is responsible for 90% of goods and materials transportation in the world [1]. However, ship navigation involves high-risk scenarios as maritime transportation has intensified. In particular, in recent years, with the rapid development of the global economy, ships are increasing in number and size [2]. Consequently, most of the main traffic routes and coastal areas are experiencing congestion. Therefore, ships navigate under risk conditions, and thus maritime accidents have occurred frequently. On the other hand, the characteristic of the ship is the one main reason that makes navigation even more dangerous. Ship navigation is different with respect to the maneuvering of other vehicles. For instance, in cars, brakes can be applied to stop the vehicle when an obstacle is found. Unfortunately, brake systems do not exist for ships. In contrast, ships avoid obstacles by deceleration and veering, using a propeller. Therefore, Corresponding author: Hidenari Makino, Ph.D., research fields: maritime traffic engineering and maritime sciences. the maneuvers of avoidance and returning to original route are time consuming and in high risk. In addition, they have the negative influence in the efficiency and fuel costs. Navigation with large ships is thus more difficult. Furthermore, ship navigation is sensitive to external forces such as wind and currents, as well as the visibility conditions and traffic situation. Weather conditions can be checked before the voyage. However, it is difficult to reliably predict the traffic situation. For these reasons, many latent risks are present during navigation. This study focused on the actual ship behavior to understand the characteristic of ship navigation and the maritime traffic situation, especially considering the latent risk in ship navigation. The purpose is to develop a sensible and appropriate traffic model for the safety and efficiency ship navigation. Related studies to this research have shown that the application of behavior analyses to land transport vehicles is possible [3-5]. Precisely, these studies analyzed the vehicle behavior to understand the driving features of the drivers and the effect of road D DAVID PUBLISHING
Transcript of Elucidation of Latent Risk of Navigation Using an Actual ... · Elucidation of Latent Risk of...

Journal of Traffic and Transportation Engineering 4 (2016) 131-140 doi: 10.17265/2328-2142/2016.03.002
Elucidation of Latent Risk of Navigation Using an Actual
Ship Behavior Analysis
Xinjia Gao1, Hidenari Makino2 and Masao Furusho1
1. Graduate School of Maritime Sciences, Kobe University, Hyogo 658-0022, Japan
2. Naval Architecture & Ocean Engineering, Osaka University, Osaka 565-0871, Japan
Abstract: In recent years, maritime transportation has played an important role in global economy development. As a result, ship traffic has become more congested. Moreover, ship navigation is susceptible to weather and environmental conditions, and in some cases, it may become dangerous. Therefore, vessels are subjected to high-risk navigation conditions. To understand the latent risk of ship navigation, this study focused on the actual ship behavior. Thus, an analysis of ship behavior was carried out using historical ship navigation based on automatic identification system data. Consequently, a dynamic analysis of the speed and encounter situation was performed. One of the main results of this work was the understanding of the latent risk involved in ships navigating the Seto Inland Sea, which is one of the most congested routes in Japan. Moreover, the risk areas were obtained, and visualized using a geographical information system. The obtained results can be applied to ensure safe navigation and the development of a safe and efficient navigation model. Key words: Maritime traffic, latent risk, ship behavior analysis, AIS (automatic identification system) data, navigation model.
1. Introduction
Sea transport is responsible for 90% of goods and
materials transportation in the world [1]. However,
ship navigation involves high-risk scenarios as
maritime transportation has intensified. In particular,
in recent years, with the rapid development of the
global economy, ships are increasing in number and
size [2]. Consequently, most of the main traffic routes
and coastal areas are experiencing congestion.
Therefore, ships navigate under risk conditions, and
thus maritime accidents have occurred frequently. On
the other hand, the characteristic of the ship is the one
main reason that makes navigation even more
dangerous. Ship navigation is different with respect to
the maneuvering of other vehicles. For instance, in
cars, brakes can be applied to stop the vehicle when an
obstacle is found. Unfortunately, brake systems do not
exist for ships. In contrast, ships avoid obstacles by
deceleration and veering, using a propeller. Therefore,
Corresponding author: Hidenari Makino, Ph.D., research
fields: maritime traffic engineering and maritime sciences.
the maneuvers of avoidance and returning to original
route are time consuming and in high risk. In addition,
they have the negative influence in the efficiency and
fuel costs. Navigation with large ships is thus more
difficult. Furthermore, ship navigation is sensitive to
external forces such as wind and currents, as well as
the visibility conditions and traffic situation. Weather
conditions can be checked before the voyage.
However, it is difficult to reliably predict the traffic
situation. For these reasons, many latent risks are
present during navigation.
This study focused on the actual ship behavior to
understand the characteristic of ship navigation and
the maritime traffic situation, especially considering
the latent risk in ship navigation. The purpose is to
develop a sensible and appropriate traffic model for
the safety and efficiency ship navigation.
Related studies to this research have shown that the
application of behavior analyses to land transport
vehicles is possible [3-5]. Precisely, these studies
analyzed the vehicle behavior to understand the
driving features of the drivers and the effect of road
D DAVID PUBLISHING

Elucidation of Latent Risk of Navigation Using an Actual Ship Behavior Analysis
132
infrastructures. For instance, Yokoyama et al. [6] used
recorded data from drivers to analyze the real driving
behavior to reduce the number of traffic accidents in
the future. In the maritime transport field, most studies
on ship behavior analysis have been carried out with
simulation models [7-9]. Although these models can
describe the dynamic motion of the ship, most of them
can be only applied to a few specific ships.
The AIS (automatic identification system) is ship
navigation equipment that provides extensive
navigational information of ships. Therefore, AIS data
has been used in maritime research to understand the
actual ship behavior [10, 11]. These studies have
shown that the analysis of historical ship navigation
using AIS data is possible so as to unveil the
characteristics of real ship movement. These studies
were good use of the actual ship navigational data.
In this study, the characteristics of ship behavior
were analyzed based on the speed and encounter
situation obtained from AIS data. A dynamic analysis
based on real ship movement data was carried out in
this study, and the latent risks in navigation were
extracted. Moreover, the risk areas were analyzed and
presented using the GIS (geographic information
system) techniques. The results of this study can be
applied to develop an appropriate traffic model and
help the operators understand the navigational
situation before their voyage.
2. Ship Traffic Based on AIS Data
2.1 AIS Data
So far, the ships navigation features has been
analyzed by the varied data. Most of the data analysis
has focused on the individual ship. In order to analyze
a group of ship and the traffic situation in a wide
ocean area, this study used the AIS data. AIS
technology automatically provides information about
the ship to other ships and coastal authorities, using
VHF (very high frequency) radio waves. Indeed, it is
possible to obtain navigation information of ships
using AIS in an accurate and quantitative manner.
This information includes dynamic, static and
voyage-related data. The information supplied by AIS
data is detailed in Table 1.
There are two classes of shipboard equipment:
Class A (mainly used by commercial vessels);
Class B (mainly used by small ships such as
fishing vessels and pleasure boats).
Information transmission with Class B equipment is
simpler. AIS Class A is compulsively installed aboard
all international voyaging ships larger than 300 GT
(gross tonnage), all non-international voyaging ships
larger than 500 GT, and all passenger ships.
2.2 Investigation of Ship Traffic
In this study, the research area was Seto Inland Sea
(from 134°53′25″ E, 34°44′10” N to 135°27′52″ E,
34°15′30″ N), which is located in the western part of
Japan. A map of the research area is shown in Fig. 1.
The research period was between March 1st and 7th,
2012. According to the statistics of ship numbers
using the MMSI numbers, it was found that the total
number of ships traversing the research area was
2,589 in such a research period. There were more than
1,000 ships navigating every day [12]. The Seto
Inland Sea route is a primary traffic route in the area
for the transportation between Japan and China, and
South Korea, it is used by ships navigating between
the east and west. The route connects the traffic exits
in the Kamon Straits (on the westernmost side of
Japan) and the Osaka Bay (in the center of Japan).
This area also harbors two main ports, Kobe and Osaka.
Table 1 Contents of AIS data
Dynamic data Ship position, coordinated universal time, SOG (speed over ground), COG (course over ground), heading, navigational status, etc.
Static data Vessel’s MMSI (maritime mobile service identity) number, IMO (International Maritime Organization) number, ship’s name, type of ship, length and breadth, etc.
Voyage-related data Draught, destination, estimated time of arrival, etc.
Elucidation of Latent Risk of Navigation Using an Actual Ship Behavior Analysis
133
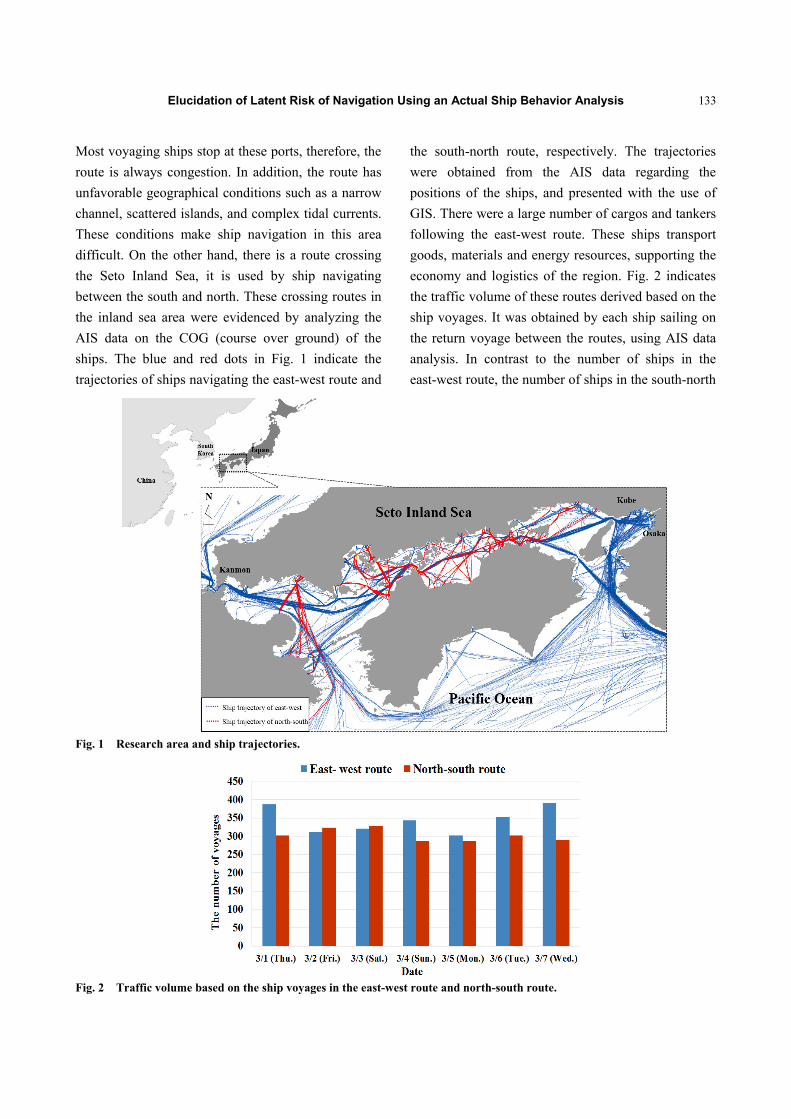
Most voyaging ships stop at these ports, therefore, the
route is always congestion. In addition, the route has
unfavorable geographical conditions such as a narrow
channel, scattered islands, and complex tidal currents.
These conditions make ship navigation in this area
difficult. On the other hand, there is a route crossing
the Seto Inland Sea, it is used by ship navigating
between the south and north. These crossing routes in
the inland sea area were evidenced by analyzing the
AIS data on the COG (course over ground) of the
ships. The blue and red dots in Fig. 1 indicate the
trajectories of ships navigating the east-west route and
the south-north route, respectively. The trajectories
were obtained from the AIS data regarding the
positions of the ships, and presented with the use of
GIS. There were a large number of cargos and tankers
following the east-west route. These ships transport
goods, materials and energy resources, supporting the
economy and logistics of the region. Fig. 2 indicates
the traffic volume of these routes derived based on the
ship voyages. It was obtained by each ship sailing on
the return voyage between the routes, using AIS data
analysis. In contrast to the number of ships in the
east-west route, the number of ships in the south-north
Fig. 1 Research area and ship trajectories.
Fig. 2 Traffic volume based on the ship voyages in the east-west route and north-south route.

Elucidation of Latent Risk of Navigation Using an Actual Ship Behavior Analysis
134
route was lower, but the traffic was very busy. Most
of these ships were ferries, which frequently sail
across the Seto Inland Sea route. These ships are
responsible for the local transportation of people
moving between the islands. Thus, the number of
ships crossing is high, and as a result, the traffic
situation is complex, showing the latent risk of
navigation in this inland area.
3. Analysis of Ship Behavior Based on Speed
In this study, the ship navigation speed was used to
analyze the ship behavior. The analysis of speed is a
conventional method used to evaluate safety and
economic aspects of ship navigation [13].
The position and destination of vessels transiting
the east-west route, without stopping at any port, were
extracted. Using their MMSI numbers, it was possible
to identify 106 ships passing across the inland sea
during the research campaign. The authors examined
the case of a ferry ship, and used this as case study to
make a qualitative analysis of the results, and thus to
understand the characteristics of the ships navigating
the inland sea. A dynamic analysis approach was
followed, which involved tracking the position and
navigational situation of this ship across different time
series. In this way, it is possible to understand the
behavior of the ship in a detailed and accurate manner.
The total length of the ferry ship was 160 m, and
the sea speed (i.e., the maximum speed when the ship
is sailing with cargo) was 22.9 kns. During the
research period, this ship sailed the inland sea route
six times, departing at 17:00 and arriving at 5:30 the
next day, and cruising between the Moji and Osaka
Ports every day. In this work, it was discussed three
cruising cases from Moji to Osaka. According to the
data provided by the Japan Meteorological Agency,
during the investigation period, the weather conditions
were zero visibility, low rainfall and low wind speed.
Therefore, wind had less influence on the navigation
speed.
The research area was divided into seven zones,
accounting for the straits in the Seto Inland Sea, to
compare the characteristics of the ship behavior in
each area and identify their changes throughout the
inland sea. The defined zones are shown in Fig. 3. The
Kurushima Strait, Bisan Seto and Akashi Strait
correspond to Zones 2, 4 and 6, respectively. The red
dots in the Fig. 3 show the trajectories of the ship in
these three cases. During the voyages, it took
approximately 12.5 h to complete 245 nautical miles.
Figs. 4-6 show the time series of the changes in the
ship speed for Cruisings 1, 2 and 3, respectively. The
zones in which this ship navigated each strait is
indicated with blue strips in Figs. 4-6. The traveling
time and the speed according to each zones are listed
in Table 2.
Fig. 3 Zone areas and trajectories of the ferry ship.

Elucidation of Latent Risk of Navigation Using an Actual Ship Behavior Analysis
135
Fig. 4 Speed of Cruising 1 in the Seto Inland Sea route.
Fig. 5 Speed of Cruising 2 in the Seto Inland Sea route.
Fig. 6 Speed of Cruising 3 in the Seto Inland Sea route.
From the speed distributions and the analysis results
in Table 2, it was found that most of the ship was
approximately 20 kns, although in some zones such as
Zones 1, 2 and 3, the speed reached up to 22.9 kns
(sea speed of the ship) at some instants. Moreover, the
change in speed was frequently checked, as shown in
Zones 2, 4, and 6. According to the information of tidal
currents, in the Kurushima Strait (Zone 2), it was north
when the ship navigated during Cruisings 1, 2 and 3.
The slackest current was between 1 and 2 kns during
Cruising 1, and the strongest one was over 4 kns during
Cruising 2. Thus, the speed decreased due to
the upstream current. The tidal current in the Akashi
Strait (Zone 6) was the slackest during Cruising 3,
Elucidation of Latent Risk of Navigation Using an Actual Ship Behavior Analysis
136
Table 2 Cruising time and speed for Cases 1, 2 and 3.
Item Zone 1 Zone 2 Zone 3 Zone 4 Zone 5 Zone 6 Zone 7
Cruising 1
Navigational time 17:00~22:11 22:11~22:47 22:47~00:17 00:17~02:19 02:19~04:13 04:13~04:25 04:25~05:36Traveling hour (hours, minutes)
5 h 11 min 36 min 1 h 30 min 2 h 2 min 1 h 54 min 12 min 1 h 11 min
Max. speed (kns) 22.0 21.9 22.0 21.1 22.2 22.6 21.8
Mean of speed (knots) 20.7 19.5 21.1 16.5 21.0 20.3 19.4
SD (standard deviation) of speed
1.52 0.61 0.47 2.97 0.42 0.95 3.78
Cruising 2
Navigational time 17:00~22:27 22:27~23:02 23:02~00:32 00:32~02:31 02:31~04:23 04:23~04:36 04:36~05:46Traveling hour (hours, minutes)
5 h 26 min 36 min 1 h 30 min 1 h 59 min 1 h 52 min 13 min 1 h 10 min
Max. speed (kns) 22.0 20.5 22.1 22.3 22.0 20.6 22.2 Mean of speed (knots) 20.5 14.8 21.1 17.1 21.3 19.3 20.1 SD (standard deviation) of speed
1.81 3.26 0.53 2.71 0.49 0.39 3.51
Cruising 3
Navigational time 17:00~22:20 22:20~22:56 22:56~00:27 00:27~02:21 02:21~04:08 04:08~04:26 04:26~05:36
Traveling hour (hours, minutes)
5 h 20 min 36 min 1 h 31 min 1 h 54 min 1 h 47 min 18 min 1 h 10 min
Max. speed (kns) 20.9 15.5 21.0 17.8 22.4 14.9 19.1 Mean of speed (knots) 22.5 22.0 22.0 23.0 23 22.5 22.6
SD (standard deviation) of speed
2.68 3.11 0.43 2.19 0.22 2.12 2.95
but the speed rapidly decreased when passing across
this strait. This is considered to be the other
influencing factor on the speed. The ship decelerated
when crossing Zone 4, mainly due to the Bisan Seto
route speed restrictions that does not allow navigating
at speeds greater than 12 kns. The navigational time
and traveling schedule were recorded when the ship
crossed the lines of each zone. The collected data was
used to obtain the maximum, mean and SD of speed,
and are used to observe the navigation situation of the
ship in every voyage. In these cases, an average speed
of 19.6 kns was used to calculate the SD speed in
every zone areas, which obtained from the
navigational distance and time. The SD is a measure
of the variability in the speed of the ship, and it is
particularly prominent when crossing the straits. Due
to the type of service this ship provides, she must sail
regularly to arrive the destination on time in spite of
the weather conditions and traffic situation every day.
It can be seen that the traveling times were similar in
each cruising.
The latent risks of the ship navigation by the
analysis of speed and travel time are summarized as
follows:
The ship is changed frequently and slowed down
when passing through both straits. It must be
remarked that there is a large influence of the currents
and route restrictions as well. However, the behavior
was not good to the navigation safety and efficiency;
The ship was able to rapidly increase the speed after
a slowdown, in order to catch the destination on time.
Moreover, the navigation speed was decreased close to
12 kns in restricted route, never less than this speed.
However, these conditions along with traffic
congestion may lead to maritime accidents. For this
reason, these are considered as high-risk conditions.
4. Risk Analysis Based on Encounter Situation
4.1 Analysis of Encountering Ships and Approaching
Distance
To understand in detail the reasons for ship
deceleration and the subjacent latent risk during
navigation, the authors analyzed the encounter

Elucidation of Latent Risk of Navigation Using an Actual Ship Behavior Analysis
137
situation and the approaching distance between the
ships. The AIS data transmission interval depends on
the navigational status. Therefore, the transmitted data
is irregular such as the speed of the ship. The position
was interpolated at a rate of one second to calculate
the distance between ships. According to the dynamic
calculation and analysis, the navigation situation was
understood on the basis of the closest distance and the
encounter situation with an approaching ship. These
factors are often used to evaluate the collision
risk [14]. Generally, a sailing ship performs an
evading action when a target ship within two nautical
miles ahead is detected. Thus, if a ship enters the
domain of one nautical mile, there is a high risk of
collision. In this work, the authors developed a
program that counts the number of ships approaching
within a radius of one nautical mile and the distance
between these ships.
The types of encounter situations were based on the
Prevention of Collision at Sea Act (1972), which
specifies three types according to the angle between
the two ships. These ship encounter situations are
illustrated in Fig. 7. The analysis results of encounter
situation in the cases are indicated in Table 3.
The number of ships in overtaking and head-on
positions were larger than those in crossing positions.
Since the inland sea is narrow and the speed of ferry
ships is greater than that of any other types of ships,
the authors focused on discussing the encounter
situation of crossing.
4.2 Risk Areas
The results obtained from the analysis were used to
evaluate the navigation risk, and GIS techniques were
used for this purpose. The applied method was the
analysis of the density distribution of risk using a
KDE (kernel density estimation) approach, which is
one of the most popular methods for analyzing the
properties of a partial point event distribution [15], as
it is simple to understand and implement. The point
event in the analysis used risk labels related to the
encounter situation and approaching distance. The
catalog of risk labels are listed in Table 4, with n
taken as the number of ships in a given situation.
Crossings were considered as high-risk situations and
the risk label depended on the approaching distance,
being the most dangerous situation when entering
within 0.5 nautical miles.
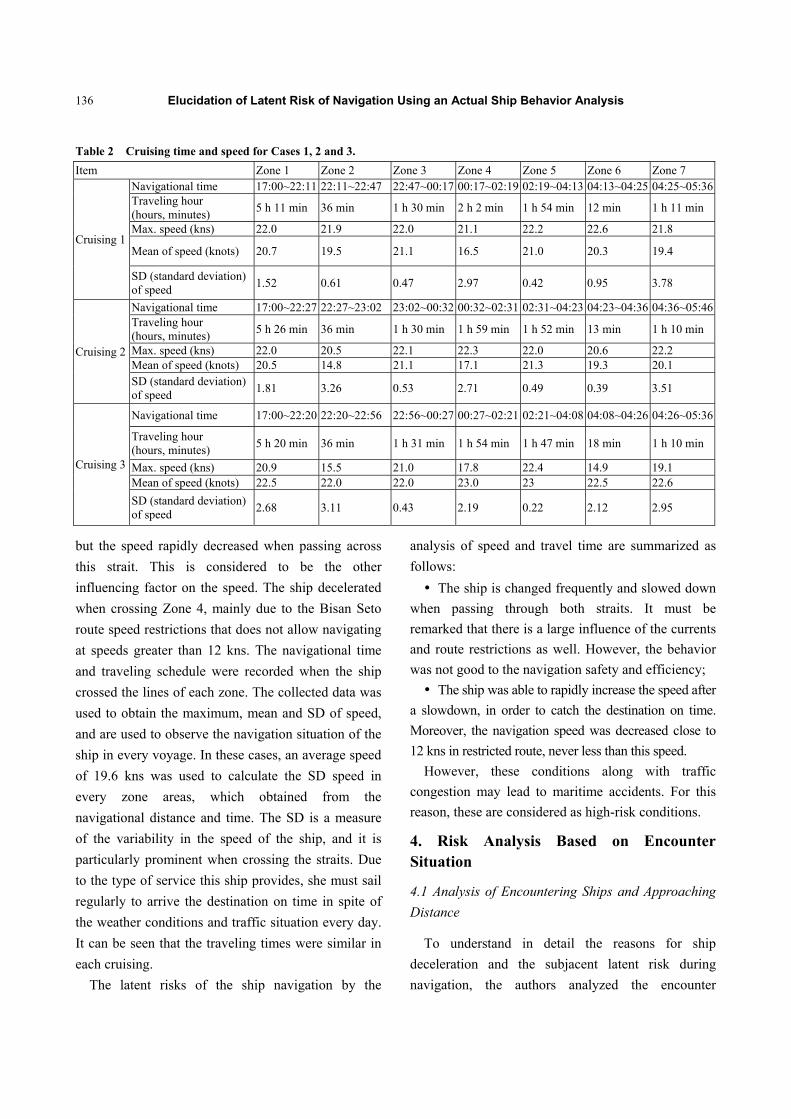
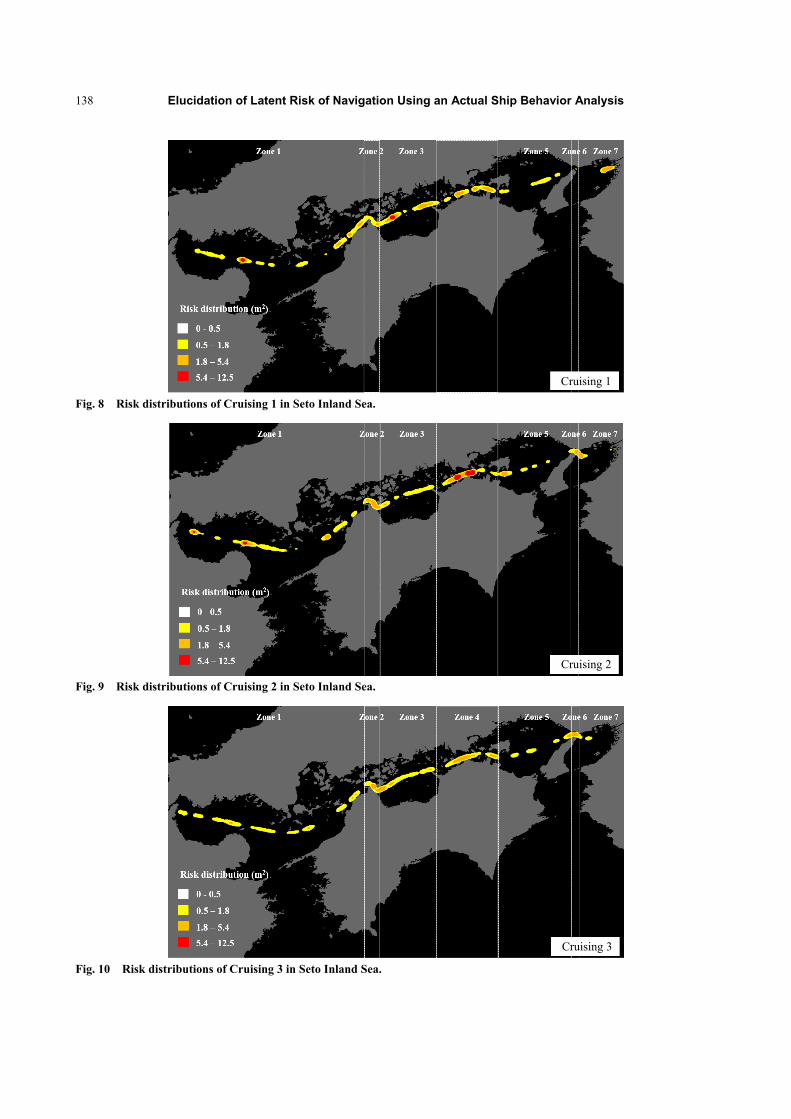
Figs. 8-10 show the distribution of ship navigation
risks. High and low densities are colored in red and
yellow, respectively. From the results, it is possible to
determine the risk areas for each zone, in particular
for Zones 1, 3 and 4. As explained above, the ship
experiences different traveling times across Zone 1.
The risk distribution demonstrates this ship sailed
Zone 1 in a complex traffic situation, and thus the risk
of collision was high. As the strength and direction of
Fig. 7 Ship domain and encounter situation.
Table 3 The encounter situation of Cruisings 1, 2, and 3.
Study cases Overtaking Head-on Crossing
(The number of ships)
Cruising 1 39 73 7
Cruising 2 43 62 13
Cruising 3 34 77 5
Table 4 Risk labels depending on the encounter situation.
Risk label Encounter situation
Overtaking Head-on Crossing d > 0.5 n.m. and d < 1 n.m.
n × 1 n × 1 n × 5
d < 0.5 n.m. n × 1 n × 1 n × 10
r = 1 nm
Elucidation of Latent Risk of Navigation Using an Actual Ship Behavior Analysis
138
Fig. 8 Risk distributions of Cruising 1 in Seto Inland Sea.
Fig. 9 Risk distributions of Cruising 2 in Seto Inland Sea.
Fig. 10 Risk distributions of Cruising 3 in Seto Inland Sea.
Cruising 1
Cruising 2
Cruising 3

Elucidation of Latent Risk of Navigation Using an Actual Ship Behavior Analysis
139
currents change with time in the Kurushima Strait, the
route demands a rare and unique rule. To fit the
current and meet the rules of the route, many ships
change their course before entering the route.
Therefore, a high-risk area in Zone 3 is present due to
a sudden change in the course of the other ships,
leading to multiple ship crossings. Zone 4 corresponds
to Besen Seto. In this zone, a large number of ship
crossings take place. This zone should be carefully
sailed. Finally, the results from this analysis can be
used to avoid collision accidents.
5. Discussion
This study presents a method for the analysis of
actual ship navigation. Moreover, a dynamic analysis
was performed to understand the real behavior of ships
in detail. Therefore, it can be considered as an
innovative study in the sense that provides insights into
ship traffic and unveils the latent risk in ship
navigation. Although the results presented in the paper
are for a particular ferry ship, the analysis can be
applied to any regular ship to better understand the
traffic situation within the research area. Future work
will be devoted to the analysis of the navigational
behavior of the other types of ships. Certainly, a
quantitative and detail analysis of the actual ships
behavior will result in a sensible and appropriate
simulation traffic model for the safety and efficiency
of ship navigation.
6. Conclusions
This paper presents an analysis on ship behavior
using the real ship movement from AIS data.
According to the analysis, ship behavior can be
understood following a dynamic analysis. The main
results are the following:
Traffic volume through the north-south and
east-west routes was obtained. It was observed that a
larger number of ships crossing the main route
(east-west routes). The traffic situation is complex,
showing the latent risk of navigation in this sea area.
Changes in the speed were frequent but diminished
when the ship passed through both straits, and the ship
rapidly increased the speed after a slowdown. Thus,
these are considered as high-risk conditions.
The encounter situation and approaching distance
of ships navigating the entire voyage was described.
The results obtained from the analysis provided the
risk areas.
Acknowledgment
The research was financially supported by the
Sasakawa Scientific Research Grant from the Japan
Science Society. Research number is 28-707.
References
[1] Dolivo, R. 2007. “The IBM Secure Trade Lane Solution.” ERCIM (European Research Consortium for Informatics and Mathematics) News 68: 45-47.
[2] WSC (World Shipping Council). 2015. Some Observations on Port Congestion, Vessel Size and Vessel Sharing Agreements. Washington, D.C.: WSC.
[3] Higgs, B., and Abbas, M. 2013. “A Two-Step Segmentation Algorithm for Behavioral Clustering of Naturalistic Driving Styles.” In Proceedings of IEEE 16th Conference on Intelligent Transportation Systems (ITSC), 857-62.
[4] Dang, R. N., Zhang, F., Wang, J. Q., Yi, S. C., and Li, K. Q. 2013. “Analysis of Chinese Driver’s Lane Change Characteristic Based on Real Vehicle Tests in Highway.” In Proceedings of IEEE 16th Conference on Intelligent Transportation Systems (ITSC), 1917-22.
[5] Nakamura, T., Nakayama, T., Uno, N., and Yamamura, K. 2016. “A Vehicle Behavioral Analysis of the Signal Pre-warning Information Provided to the Driver.” Journal of Traffic and Transportation Engineering 4 (1): 11-7.
[6] Yokoyama, D., and Toyoda, M. 2015. “A Large Scale Examination of Vehicle Recorder Data to Understand Relationship between Drivers’ Behaviors and Their Past Driving Histories.” In Proceedings of 2015 IEEE International Conference on Big Data, 2877-9.
[7] Goerlandt, F., and Kujala, P. 2011. “Traffic Simulation Based Ship Collision Probability Modeling.” Reliability Engineering & System Safety 96 (1): 91-107.
[8] Montewka, J., Hinz, T., Kujala, P., and Matusiak, J. 2010. “Probability Modelling of Vessel Collisions.” Reliability
Elucidation of Latent Risk of Navigation Using an Actual Ship Behavior Analysis
140
Engineering & System Safety 95 (5): 573-89. [9] Statheros, T., Howells, G., and McDonald-Maier, K.
2008. “Autonomous Ship Collision Avoidance Navigation Concepts, Technologies and Techniques.” Journal of Navigation 61 (1): 129-42.
[10] Gao, X., Makino, H., and Furusho, M. 2015. “Analysis of Actual Situation of Waiting Ship Using AIS Data.” In Proceedings of the 25th International Ocean and Polar Engineering Conference, 883-8.
[11] Makino, H. 2013. “Verification of the Time Tsunami Attacked Coasting Ships Using AIS—Case of the 2011 East Japan Tsunami.” Journal of Earth Science and Engineering 2: 125-9.
[12] Gao, X., Makino, H., and Furusho, M. 2015. “Research
on the Real Movement of Container Ship between Japan, China, and South Korea using AIS data.” In Proceedings of 11th International Conference on Marine Navigation and Safety of Sea Transportation, 135-41.
[13] Yamada, K., Arimura, N., and Tanaka, K. 1985. “The Travelling-Time Distribution of Vessels for Evaluation of Maritime Traffic (1).” National Maritime Research Institute 22 (4): 311-7.
[14] Colley, B. A., Curtis, R. G., and Stockel, C. T. 1984. “A Maritime Traffic Flow and Collision Avoidance Computer Simulation.” Journal of Navigation 37 (2): 232-50.
[15] Bailey, T. C., and Gatrell, A. C. 1995. Interactive Spatial Data Analysis. Essex: Longman.