ELSA 9M17 Eng Ver 2 - Elnusa · The return of those blocks to Pertamina are expected to...
16
www.elnusa.co.id Analyst Meeting PT Elnusa Tbk November 2017
Transcript of ELSA 9M17 Eng Ver 2 - Elnusa · The return of those blocks to Pertamina are expected to...
www.elnusa.co.id
Analyst MeetingPT Elnusa Tbk
November 2017

2
9M‐17 Financial Highlight
(Rp Bn)
INCOME STATEMENT 9M16 9M17 % Change
Revenue 2.524 100% 3.321 100% 31,6%
Cost of Revenue 2.094 83% 2.987 90% 42,6%
Gross Profit 430 17% 335 10% (22,1%)
Operating Profit 281 11% 154 5% (45,3%)
EBITDA 505 20% 433 13% (14,4%)
Net Profit 178 7% 86 3% (51,9%)
BALANCE SHEET FY16 9M17 % Change
Cash & Equivalents 744 18% 734 16% (1,4%)
Account Receivables 714 17% 985 22% 38,0%Total Assets 4.191 100% 4.469 100% 6,6%Account Payables & Accruals 638 15% 888 20% 39,1%Short Term Bank Loan 516 12% 597 13% 15,8%Long Term Bank Loan 34 1% 12 0% (64,4%)Total Liabilities 1.313 13% 1.572 35% 19,7%Total Equity 2.878 69% 2.897 65% 0,7%
3
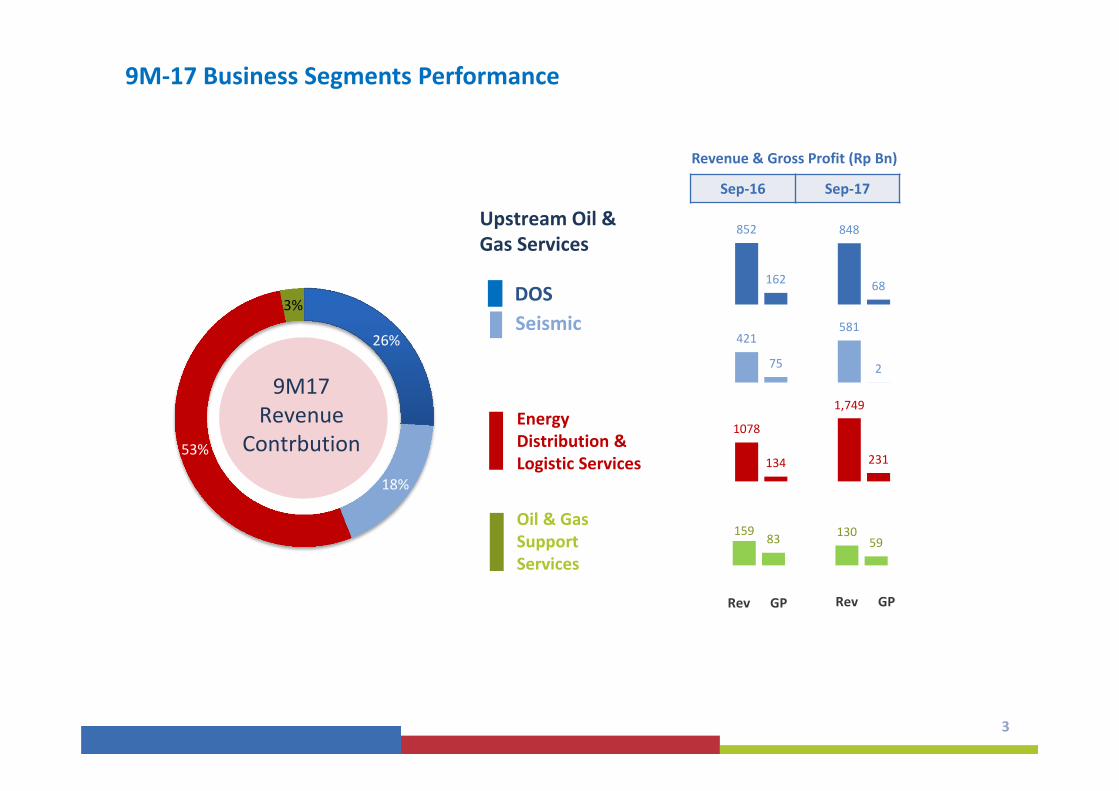
9M‐17 Business Segments Performance
26%
18%
53%
3%
DOS GSC EPN Others
9M17Revenue
Contrbution
DOSSeismic
Upstream Oil & Gas Services
Oil & Gas Support Services
Energy Distribution & Logistic Services
852 848
162 68
421581
75 2
1078
1,749
134 231
159 13083 59
Revenue & Gross Profit (Rp Bn)
Sep‐16 Sep‐17
Rev GP Rev GP

4
2017 Operating Game Project (Non Asset Based)strategy
Seismic & DOS major significant projectshad just started in the second half 2017.
Lower contribution in upstream segmentEspecially From 3 of Elnusa’s major contributorOil & gas blocks
Decreasing numbers of projects and activities in upstream industry as the impact of low oil price.
Factors that Affect Elnusa’s 2017 Performance :

5
Global Oil Price Has Been Going Down Since 2015
Pergerakan dan Proyeksi Harga Minyak Mentah Dunia (West Texas Intermediate /WTI)
Source : US Energy Information Association

6
Indonesia Upstream Investment (USD Mn)
Low Oil Price Also Affecting Domestic Upstream Slow Activities
4,08
3
3,29
5
10,247
1,773
6,905 6,566
2015A 2016A 2017P
Seismic ‐ 2D (km)
Seismic ‐ 3D (sqkm)
35 43 25
541
227 223
2015A 2016A 2017P
Exploration Drilling (# of well)
Development Drilling (# of well)
1,320 1,012 907
31,578
38,827
57,512
2015A 2016A 2017P
Workover (# of activities)Well Services (# of activities)
Source : SKK Migas & PTM

7
ELNUSA has been working for more than 25 years in East Kalimantan (especially in Total Mahakam) Those area generated around 45%‐65% (USD 40‐65 mn) of revenue contribution in Drilling & Oilfield
Services business each year. For the last 3 years, revenue contribution from East Kalimantan area has been declining (nearly
about 60% or amounting to USD38 mn) because the Blocks Operator/Owner lower their activitiestowards Blocks transition to Pertamina.
The return of those blocks to Pertamina are expected to stimulate the blocks activities and also ELNUSA operational side.
1. Mahakam (Total EP – exp. 2018 )2. Sanga Sanga (VICO – exp. 2018)3. Attaka (Chevron – exp.2017/2018)
Transition Period
05
10152025
303540
2014 2015 2016 2017 F 2018 <
DOS Revenue Contribution (USD Mn)
Total Mahakam
Chevron
Vico Sanga‐Sanga
‐48%
‐93%‐52%
8
4
6
3
4
3
‐ 1 2
2018 2019 2020 2021 2022 2023 2024 2025 2026
Expired Blocks Expired Block Migas di Indonesia
Lower Contribution due to Impact of Indonesia Expired Blocks
8

8
Significant Ongoing Project 2017 : Land & Marine Seismic
3D Land Seismic Klamosossa, West Papua
3D Marine Seismic Andaman, Aceh
Indonesian Flag Seismic Marine Vessel.Efficient survey seismic utilization with 3D seismic capacity complemented with 10 seismic streamers
Client : Talisman Andaman. Total seismic area : 2500 km2. Periode : Aug – Nov 2017
Client: Pertamina EP. Total seismic area: 500 Km2. Shoot points : 40.900. Period : 2017‐2018.

9
Significant Ongoing Project 2017 : Drilling & Oilfield Services
Operation &Maintenance Projects
Drilling, East Kalimantan
Client : Pertamina EP Drilling of 3 Brajanata exploration wells East
Kalimantan Using Electric Modular Rig 1600HP Period : Jun – Des 2017
Papua Client : BP Tangguh. Jobs : Mechanical & Electrical OM. Period : 5 tahun (2017 ‐ 2022).
Sumatera Selatan Client : Conoco Phillips
Jobs : Construction Maintenance (2017). Clients : Pertamina Aset 2
Jobs : TAPSPD 3 tahun (2016 – 2019).

10
Business Portfolio Expansion to Maintain Revenue Stability
Upstream Oil & Gas ServicesEnergy Distribution & Logistic ServicesOil & Gas Support Services
55%38%
8%
1H2016
39%
56%
5%
1H2017
58%33%
9%
48%43%
9%
2015 2016
Pendapatan Konsolidasi
4%21%
27%
48%
14%
27%
18%
41%
13%
34%
17%
36%
22%
25%
16%
37%1H2016
1H2017
2015 2016
Non Asset Based Services (OM)Asset : Hydraulic Workover ServicesAsset : Electric Wireline Logging ServicesAsset : Other Asset Based Services
Pendapatan DOS
Distribution & Logistic Services Operating Game Project (Non Asset Based)

11
Recovery Action 2017
1,672
3,736
0
500
1,000
1,500
2,000
2,500
3,000
3,500
4,000
Jan Feb Mar Apr May Jun Jul Aug Sep Oct Nov Dec
Rp bn
Actual Projection
Drilling Pertamina Aset 5 & CoPi Kuala Kurun.
Subsea Pertamina Aset 4
Workover Pertamina aset
2,3, 4 & 5.
Marine Seismic PHE & Conrad.
Addition ofTransportastion &
Depo / DPPU
Addition of 6 Pertamina KSO management.
3D Seismik Klamasossa & 3D Marine Seismic
Talisman Andaman3.321
To win remaining Marine Seismic Project. Maintain the productivity of Land &
Marine Seismic projects. Optimizing the performance of
Operation & Maintenance projects . Improving the productivity of contracts
and asset utilization in Drilling & Oilfield Services.
Increasing numbers of transportation& Depo management.
1. Menjaga Kinerja Existing Business

12
Current Order Book (1H17)
Business Total Contract 2017 Value Carried Forward Value
Seismic Services 1,430 930 500
Drilling & Oilfield Services 3,073 1,080 1,993
Total 4,503 2,010 2,493
Significant Contract of Seismic Services• Land Seismic in West Papua & Sumatera (Pertamina)•Marine Seismic in Laut Jawa, Aceh & Maluku (PHE, Repsol & ESDM)
Significant Contract of Drilling & Oilfield Services• Drilling exploration of Pertamina in East Kalimantan• Workover in Pertamina aset 3 & 4.
Business Total Contract 2017 Value Carried Forward Value
Transportation & Logistic 2,039 1,848 191
Transportation & Logistic Services Contract• Transportation contract extension and also 2017 new project amounting to Rp995 bn• Depot Management business add new contracts from KSO and private companies.
Rp bn
Rp bn
13
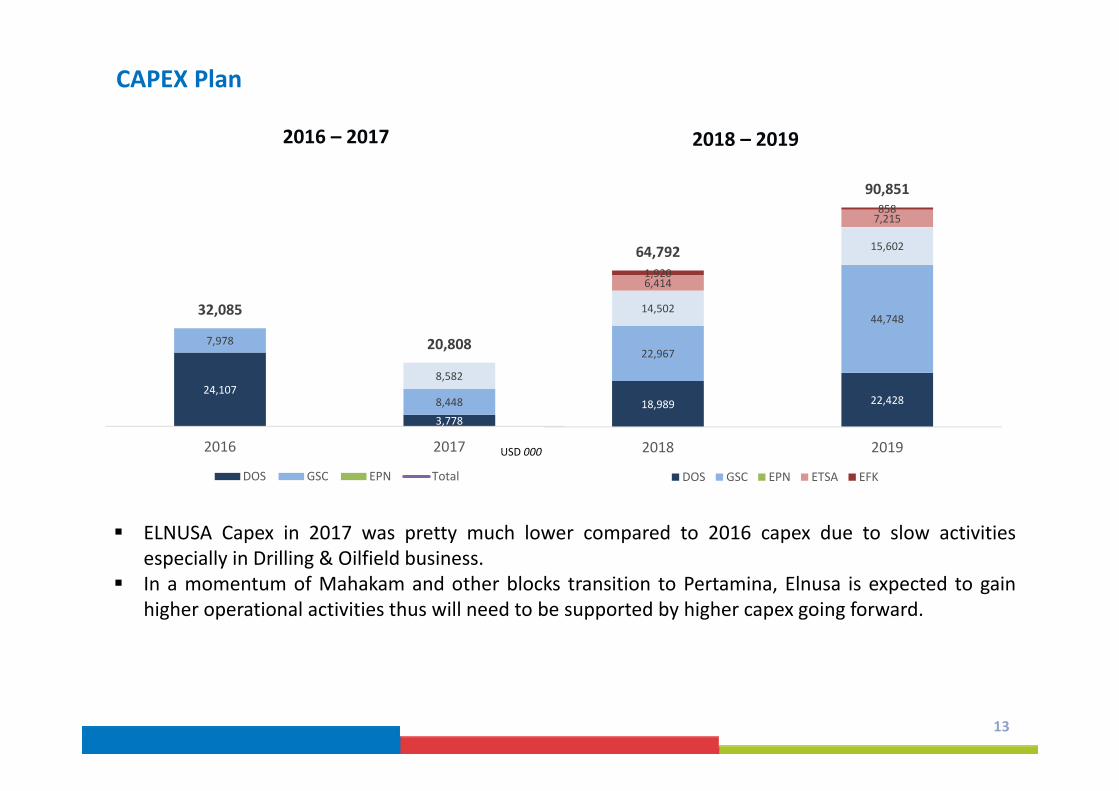
CAPEX Plan
USD 000
2016 – 2017 2018 – 2019
18,989 22,428
22,967
44,74814,502
15,602
6,414
7,215
1,920
858
64,792
90,851
2018 2019
DOS GSC EPN ETSA EFK
ELNUSA Capex in 2017 was pretty much lower compared to 2016 capex due to slow activitiesespecially in Drilling & Oilfield business.
In a momentum of Mahakam and other blocks transition to Pertamina, Elnusa is expected to gainhigher operational activities thus will need to be supported by higher capex going forward.
24,107
3,778
7,978
8,448
8,582
32,085
20,808
2016 2017
DOS GSC EPN Total

14
2. New Busines Expansion to Increase Revenue
Jasa Klien
Electric Submersible Pump PertaminaAsset 3 dan Asset 4
Flare Gas Pertamina Asset 5 Sanga‐ Sanga
Review Cost Structure• In line with the market demand, costefficiency have to be conductedcontinuously by reducing activities thatis not providing added value.
• Efficiency obtained among others fromthe reduction of subcontractor costs,direct material, direct labor, rent dantravel expense.
3. Cost Efficiency to Maintain Profitability
Perbaikan Proses Bisnis
Asset Integrity
Pembuatan Standar Project Management
Penguatan implementasi Budaya Perusahaan

15
Corporate Strategy : Direction Stability :
Strenghten Position Growth :
Increase Business Sustainability
Corporate Strategy : Portfolio Optimization,
integration & differentiation.
Focus on energy in core business and selective in adjacent energy.
Corporate Strategy : Parenting Financial Control to
Strategic Control. Optimize Parent
Value Added.
Penajaman Visi Perusahaan : From “Trusted Energy Services” to “Reputable Energy Services Company by Providing Total Solution”

©Juli 2017
PT Elnusa Tbk.Graha ElnusaJl. T.B. Simatupang Kav. 1BJakarta 12560, IndonesiaTel: +62 21‐788308050 Fax: +62 21‐78830907www.elnusa.co.id
The following presentation has been prepared by PT Elnusa Tbk. (the “Company”) and contains certain projections, plans, business strategies, policies of the Company and industry data in which the Company operates in, which could be treated as forward‐looking statements within the meaning of applicable law. Such forward‐looking statements, by their nature, involve risks and uncertainties that could prove to be incorrect and cause actual results to differ materially from those expressed or implied in these statements. The Company does not guarantee that any action, which may have been taken in reliance on this document will bring specific results as expected. The Company disclaims any obligation to revise forward‐looking statements to reflect future events or circumstances.