Elliott Jobs Profile 2014 - Northern Territory · Elliott Elliott is located about 250 kilometres...
35
ELLIOTT 2014 JOBS PROFILE
Transcript of Elliott Jobs Profile 2014 - Northern Territory · Elliott Elliott is located about 250 kilometres...
1
2014 Jobs Profile ELLIOTT
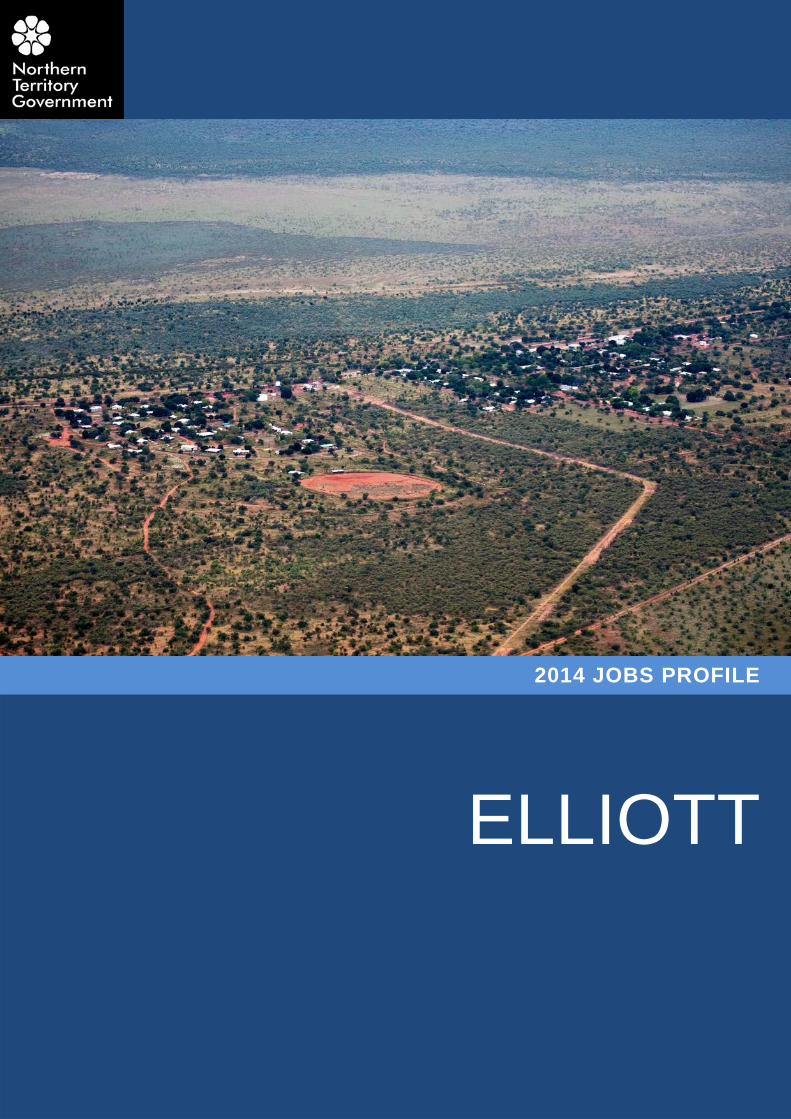
ELLIOTT
2014 JOBS PROFILE
2
© Northern Territory of Australia 2014
Preferred Reference: Department of Business, 2014 Jobs Profiles, Northern Territory Government, November 2014, Darwin.
Disclaimer The data in this publication were predominantly collected by conducting a face-to-face survey of businesses within town boundaries during mid-2014. The collection methodology was created in accordance with Australian Bureau of Statistics data quality framework principles. Data in this publication are only reflective of those businesses reported on as operating in the town at the time of data collection (see Table 30 for list of businesses reported on).
To comply with privacy legislation or where appropriate, some data in this publication may have been adjusted and will not reflect the actual data reported by businesses. As a result of this, combined with certain data not being reported by some businesses, some components may not add to totals and changes over time may be partially reflective of business’ change in propensity to report on certain data items rather than actual changes over time. Total figures have generally not been adjusted.
Caution is advised when interpreting the comparisons made to the earlier 2011 publication as the businesses identified and reported on and the corresponding jobs may differ between publications.
Notes for each table and chart are alphabetically ordered and listed at the end of the publication.
Any use of this report for commercial purposes is not endorsed by the Department of Business.
3
2014 Jobs Profile ELLIOTT
Table of Contents
Elliott ...................................................................................................................................... 4
Publication Summary ............................................................................................................. 5
Jobs Overview ....................................................................................................................... 6
Jobs by Indigenous Status ..................................................................................................... 7
Jobs by Sector ....................................................................................................................... 8
Job Permanency .................................................................................................................. 12
Job Vacancies ...................................................................................................................... 14
Jobs by Industry ................................................................................................................... 15
Jobs by Occupation .............................................................................................................. 18
Jobs by Industry by Occupation ........................................................................................... 20
Jobs by Gender .................................................................................................................... 21
Jobs by Age ......................................................................................................................... 24
Vocational Education and Training ....................................................................................... 27
Remote Jobs and Communities Program (RJCP) ................................................................ 31
Population ............................................................................................................................ 31
Businesses .......................................................................................................................... 32
Notes ................................................................................................................................... 33
Abbreviations and Acronyms ................................................................................................ 34
4
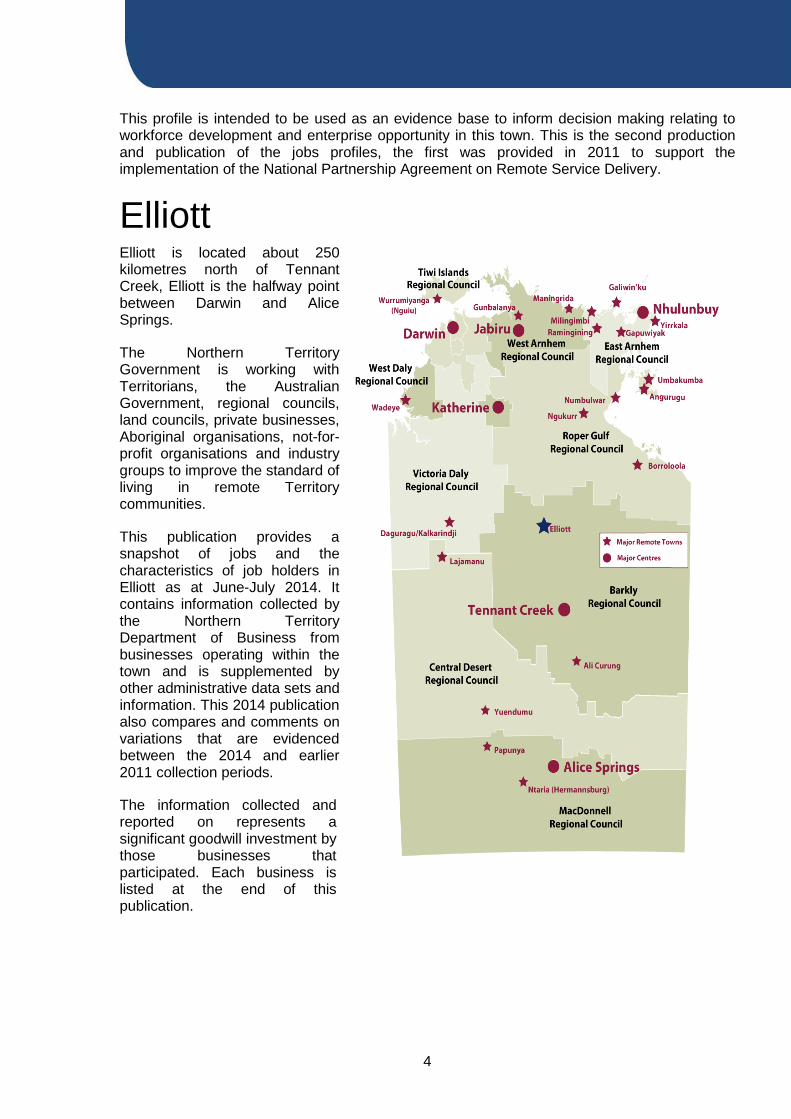
This profile is intended to be used as an evidence base to inform decision making relating to workforce development and enterprise opportunity in this town. This is the second production and publication of the jobs profiles, the first was provided in 2011 to support the implementation of the National Partnership Agreement on Remote Service Delivery.
ElliottElliott is located about 250 kilometres north of Tennant Creek, Elliott is the halfway point between Darwin and Alice Springs.
The Northern Territory Government is working with Territorians, the Australian Government, regional councils, land councils, private businesses, Aboriginal organisations, not-for-profit organisations and industry groups to improve the standard of living in remote Territory communities.
This publication provides a snapshot of jobs and the characteristics of job holders in Elliott as at June-July 2014. It contains information collected by the Northern Territory Department of Business from businesses operating within the town and is supplemented by other administrative data sets and information. This 2014 publication also compares and comments on variations that are evidenced between the 2014 and earlier 2011 collection periods.
The information collected and reported on represents a significant goodwill investment by those businesses that participated. Each business is listed at the end of this publication.
5
2014 Jobs Profile ELLIOTT
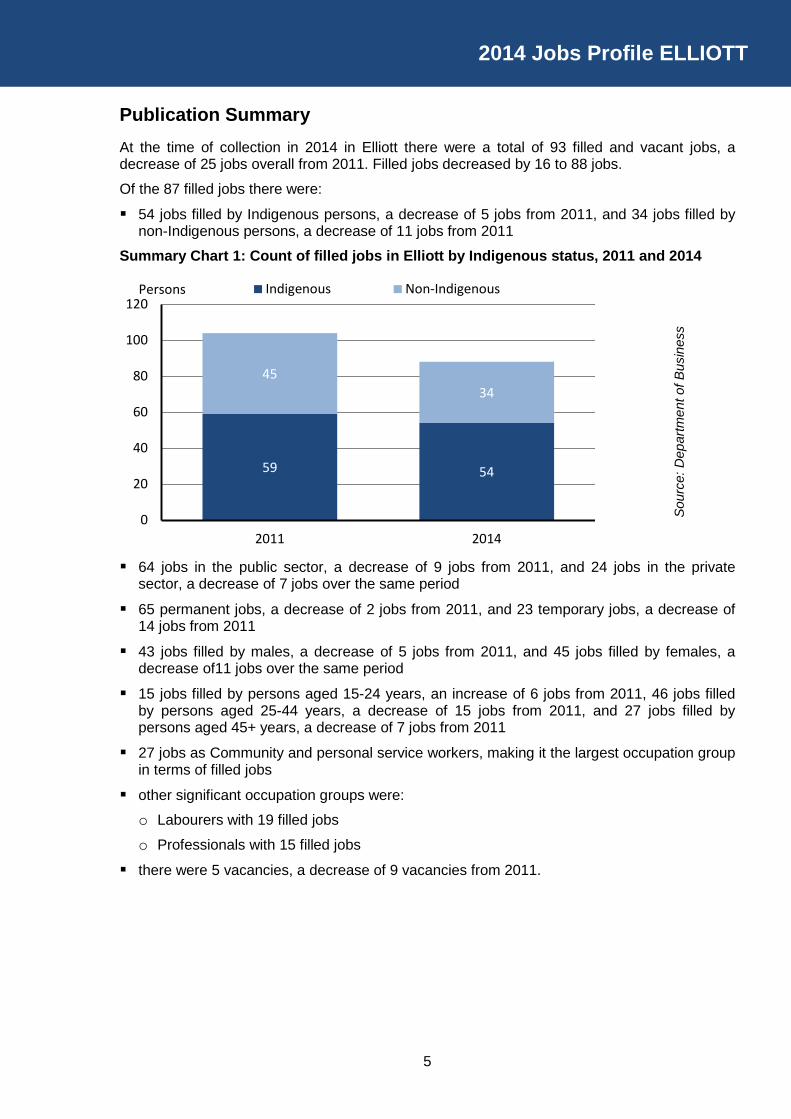
Publication Summary At the time of collection in 2014 in Elliott there were a total of 93 filled and vacant jobs, a decrease of 25 jobs overall from 2011. Filled jobs decreased by 16 to 88 jobs.
Of the 87 filled jobs there were:
54 jobs filled by Indigenous persons, a decrease of 5 jobs from 2011, and 34 jobs filled by non-Indigenous persons, a decrease of 11 jobs from 2011
Summary Chart 1: Count of filled jobs in Elliott by Indigenous status, 2011 and 2014
64 jobs in the public sector, a decrease of 9 jobs from 2011, and 24 jobs in the private
sector, a decrease of 7 jobs over the same period
65 permanent jobs, a decrease of 2 jobs from 2011, and 23 temporary jobs, a decrease of 14 jobs from 2011
43 jobs filled by males, a decrease of 5 jobs from 2011, and 45 jobs filled by females, a decrease of11 jobs over the same period
15 jobs filled by persons aged 15-24 years, an increase of 6 jobs from 2011, 46 jobs filled by persons aged 25-44 years, a decrease of 15 jobs from 2011, and 27 jobs filled by persons aged 45+ years, a decrease of 7 jobs from 2011
27 jobs as Community and personal service workers, making it the largest occupation group in terms of filled jobs
other significant occupation groups were:
o Labourers with 19 filled jobs
o Professionals with 15 filled jobs
there were 5 vacancies, a decrease of 9 vacancies from 2011.
59 54
4534
0
20
40
60
80
100
120
2011 2014
Indigenous Non-IndigenousPersons
Sou
rce:
Dep
artm
ent o
f Bus
ines
s
6
Jobs Overview
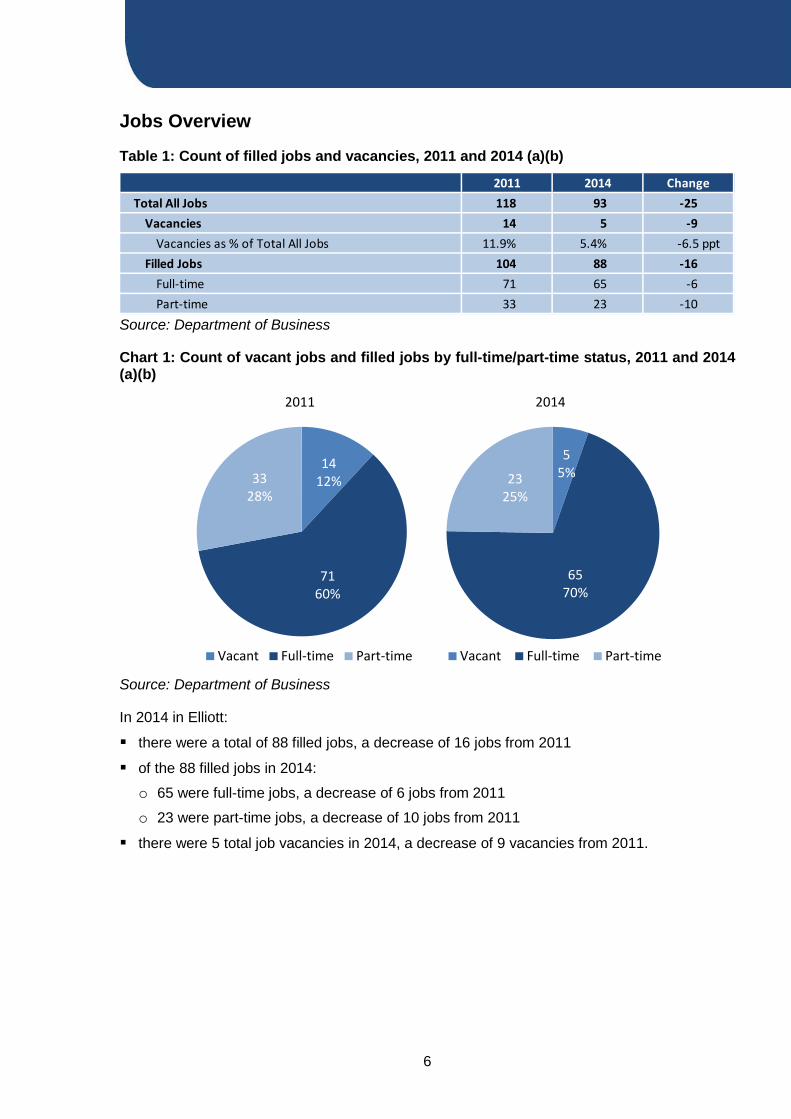
Table 1: Count of filled jobs and vacancies, 2011 and 2014 (a)(b)
Source: Department of Business
Chart 1: Count of vacant jobs and filled jobs by full-time/part-time status, 2011 and 2014 (a)(b)
Source: Department of Business
In 2014 in Elliott:
there were a total of 88 filled jobs, a decrease of 16 jobs from 2011
of the 88 filled jobs in 2014:
o 65 were full-time jobs, a decrease of 6 jobs from 2011
o 23 were part-time jobs, a decrease of 10 jobs from 2011
there were 5 total job vacancies in 2014, a decrease of 9 vacancies from 2011.
2011 2014 ChangeTotal All Jobs 118 93 -25
Vacancies 14 5 -9Vacancies as % of Total All Jobs 11.9% 5.4% -6.5 ppt
Filled Jobs 104 88 -16Full-time 71 65 -6Part-time 33 23 -10
1412%
7160%
3328%
2011
Vacant Full-time Part-time
55%
6570%
2325%
2014
Vacant Full-time Part-time
7
2014 Jobs Profile ELLIOTT
Jobs by Indigenous Status
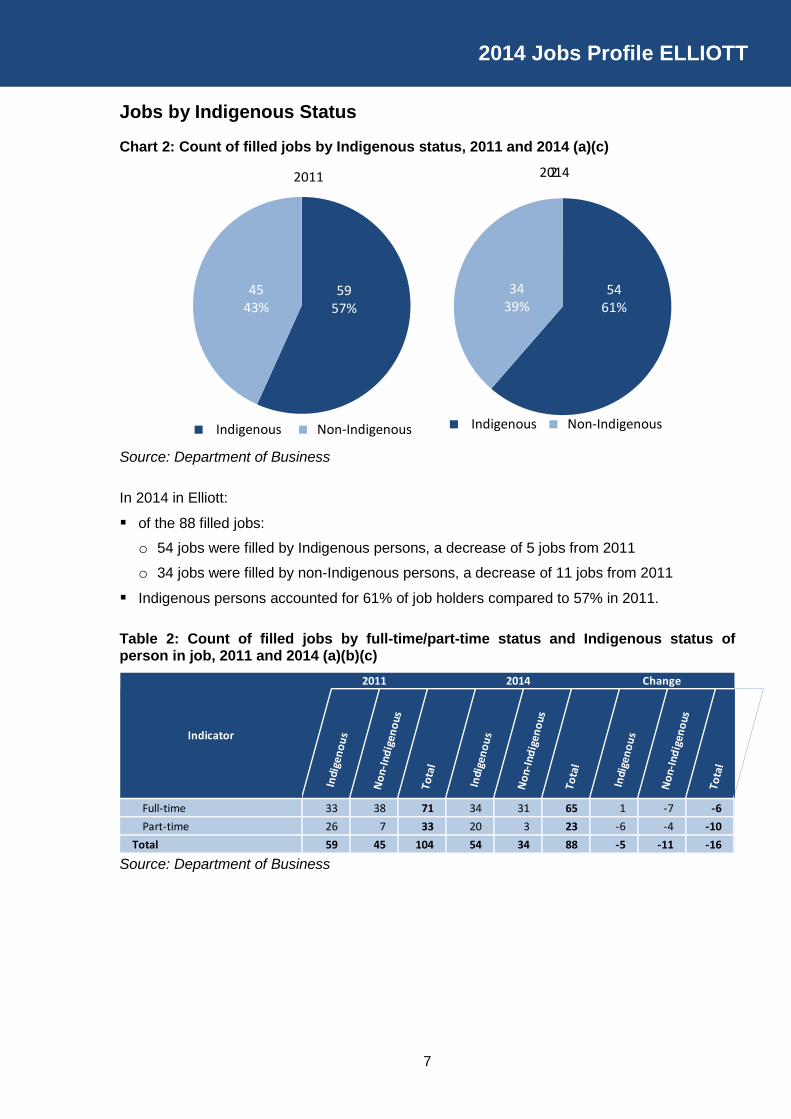
Chart 2: Count of filled jobs by Indigenous status, 2011 and 2014 (a)(c)
Source: Department of Business
In 2014 in Elliott:
of the 88 filled jobs:
o 54 jobs were filled by Indigenous persons, a decrease of 5 jobs from 2011
o 34 jobs were filled by non-Indigenous persons, a decrease of 11 jobs from 2011
Indigenous persons accounted for 61% of job holders compared to 57% in 2011.
Table 2: Count of filled jobs by full-time/part-time status and Indigenous status of person in job, 2011 and 2014 (a)(b)(c)
Source: Department of Business
5957%
4543%
Indigenous Non-Indigenous
2011
5461%
3439%
Indigenous Non-Indigenous
22014
Indicator
2011 2014 Change
In
dige
nous
Non
-Indi
geno
us
Tot
al
In
dige
nous
Non
-Indi
geno
us
Tot
al
In
dige
nous
Non
-Indi
geno
us
Tot
alIndicator
Full-time 33 38 71 34 31 65 1 -7 -6Part-time 26 7 33 20 3 23 -6 -4 -10
Total 59 45 104 54 34 88 -5 -11 -16
8
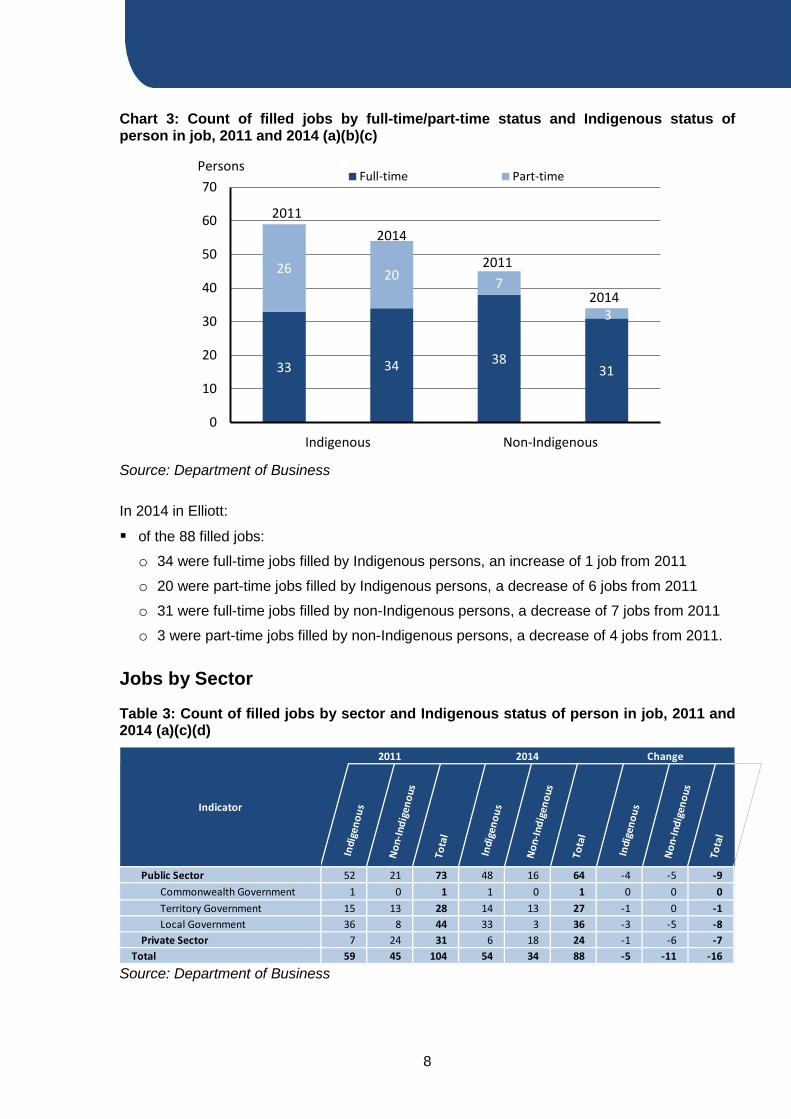
Chart 3: Count of filled jobs by full-time/part-time status and Indigenous status of person in job, 2011 and 2014 (a)(b)(c)
Source: Department of Business
In 2014 in Elliott:
of the 88 filled jobs:
o 34 were full-time jobs filled by Indigenous persons, an increase of 1 job from 2011
o 20 were part-time jobs filled by Indigenous persons, a decrease of 6 jobs from 2011
o 31 were full-time jobs filled by non-Indigenous persons, a decrease of 7 jobs from 2011
o 3 were part-time jobs filled by non-Indigenous persons, a decrease of 4 jobs from 2011.
Jobs by Sector
Table 3: Count of filled jobs by sector and Indigenous status of person in job, 2011 and 2014 (a)(c)(d)
Source: Department of Business
33 34 3831
26 20 7
3
0
10
20
30
40
50
60
70Full-time Part-time
Persons
Indigenous Non-Indigenous
2011
2011
2014
2014
2011
Indicator
2014 Change
In
dige
nous
Non
-Indi
geno
us
Tot
al
In
dige
nous
Non
-Indi
geno
us
Tot
al
In
dige
nous
Non
-Indi
geno
us
Tot
al
Indicator
Public Sector 52 21 73 48 16 64 -4 -5 -9Commonwealth Government 1 0 1 1 0 1 0 0 0Territory Government 15 13 28 14 13 27 -1 0 -1Local Government 36 8 44 33 3 36 -3 -5 -8
Private Sector 7 24 31 6 18 24 -1 -6 -7Total 59 45 104 54 34 88 -5 -11 -16
9
2014 Jobs Profile ELLIOTT
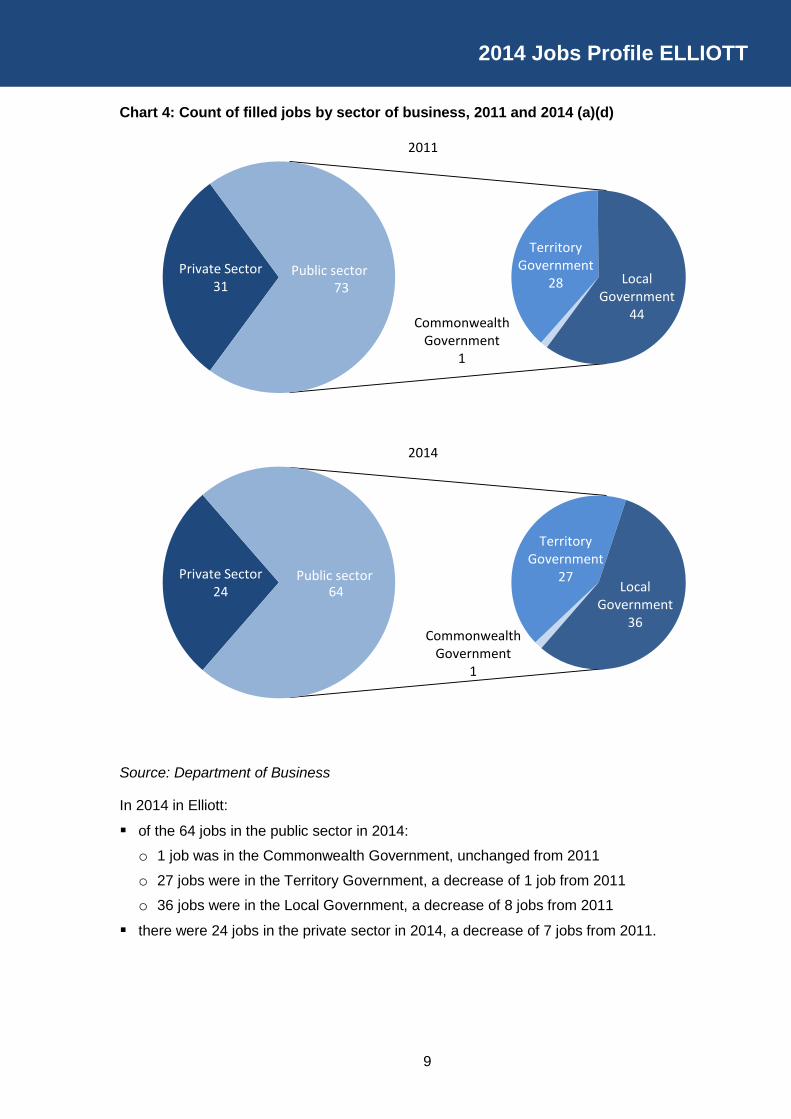
Chart 4: Count of filled jobs by sector of business, 2011 and 2014 (a)(d)
Source: Department of Business
In 2014 in Elliott:
of the 64 jobs in the public sector in 2014:
o 1 job was in the Commonwealth Government, unchanged from 2011
o 27 jobs were in the Territory Government, a decrease of 1 job from 2011
o 36 jobs were in the Local Government, a decrease of 8 jobs from 2011
there were 24 jobs in the private sector in 2014, a decrease of 7 jobs from 2011.
Private Sector31
Commonwealth Government
1
Territory Government
28 Local Government
44
73
2011
Public sector
Private Sector24
Commonwealth Government
1
Territory Government
27Local
Government36
64
2014
Public sector

10
Chart 5: Count of filled jobs by sector and Indigenous status of person in job, 2011 and 2014 (a)(c)(d)
Source: Department of Business
In 2014 in Elliott:
of the 64 jobs in the public sector in 2014:
o 48 jobs were filled by Indigenous persons, a decrease of 4 jobs from 2011
o 16 jobs were filled by non-Indigenous persons, a decrease of 5 jobs from 2011
of the 24 jobs in the private sector in 2014:
o 6 jobs were filled by Indigenous persons, a decrease of 1 job from 2011
o 18 jobs were filled by non-Indigenous persons, a decrease of 6 jobs from 2011.
Chart 6: Count of filled jobs by sector and full-time/part-time status of person in job, 2011 and 2014 (a)(b)(d)
Source: Department of Business
52 48
7 6
2116
2418
0
10
20
30
40
50
60
70
80Indigenous Non-Indigenous
2014
Public Sector
2011
2011
2014
Private Sector
Persons
51 47
20 18
22
17
116
0
10
20
30
40
50
60
70
80Full-time Part-timePersons
Public Sector Private Sector
2011
2011
2014
2014
11
2014 Jobs Profile ELLIOTT
In 2014 in Elliott:
of the 64 jobs in the public sector:
o 47 were full-time jobs, a decrease of 4 jobs from 2011
o 17 were part-time jobs, a decrease of 5 jobs from 2011
of the 24 jobs in the private sector:
o 18 were full-time jobs, a decrease of 2 jobs from 2011
o 6 were part-time jobs, a decrease of 5 jobs from 2011.
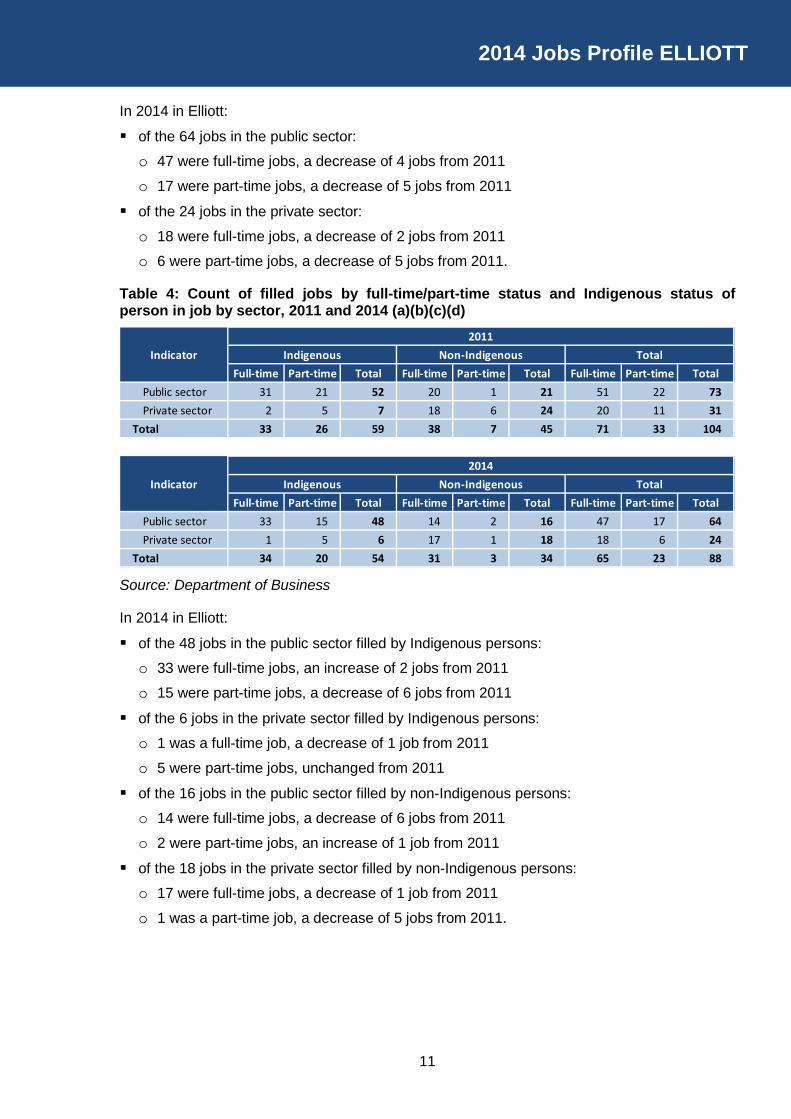
Table 4: Count of filled jobs by full-time/part-time status and Indigenous status of person in job by sector, 2011 and 2014 (a)(b)(c)(d)
Source: Department of Business
In 2014 in Elliott:
of the 48 jobs in the public sector filled by Indigenous persons:
o 33 were full-time jobs, an increase of 2 jobs from 2011
o 15 were part-time jobs, a decrease of 6 jobs from 2011
of the 6 jobs in the private sector filled by Indigenous persons:
o 1 was a full-time job, a decrease of 1 job from 2011
o 5 were part-time jobs, unchanged from 2011
of the 16 jobs in the public sector filled by non-Indigenous persons:
o 14 were full-time jobs, a decrease of 6 jobs from 2011
o 2 were part-time jobs, an increase of 1 job from 2011
of the 18 jobs in the private sector filled by non-Indigenous persons:
o 17 were full-time jobs, a decrease of 1 job from 2011
o 1 was a part-time job, a decrease of 5 jobs from 2011.
Full-time Part-time Total Full-time Part-time Total Full-time Part-time TotalPublic sector 31 21 52 20 1 21 51 22 73Private sector 2 5 7 18 6 24 20 11 31
Total 33 26 59 38 7 45 71 33 104
Full-time Part-time Total Full-time Part-time Total Full-time Part-time TotalPublic sector 33 15 48 14 2 16 47 17 64Private sector 1 5 6 17 1 18 18 6 24
Total 34 20 54 31 3 34 65 23 88
2011Total
Indicator
Indicator
2014
Indigenous Non-Indigenous
Indigenous Non-Indigenous Total
12
Job Permanency
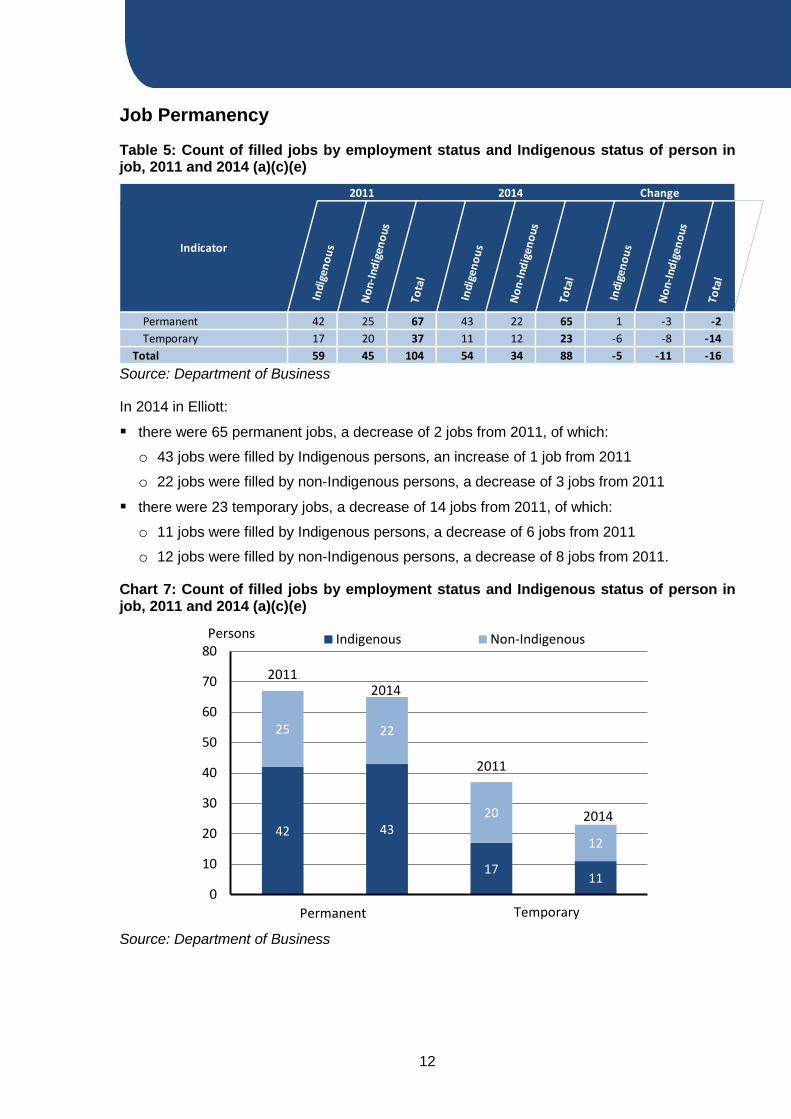
Table 5: Count of filled jobs by employment status and Indigenous status of person in job, 2011 and 2014 (a)(c)(e)
Source: Department of Business
In 2014 in Elliott:
there were 65 permanent jobs, a decrease of 2 jobs from 2011, of which:
o 43 jobs were filled by Indigenous persons, an increase of 1 job from 2011
o 22 jobs were filled by non-Indigenous persons, a decrease of 3 jobs from 2011
there were 23 temporary jobs, a decrease of 14 jobs from 2011, of which:
o 11 jobs were filled by Indigenous persons, a decrease of 6 jobs from 2011
o 12 jobs were filled by non-Indigenous persons, a decrease of 8 jobs from 2011.
Chart 7: Count of filled jobs by employment status and Indigenous status of person in job, 2011 and 2014 (a)(c)(e)
Source: Department of Business
Indicator
2014 Change2011
In
dige
nous
Non
-Indi
geno
us
Tot
al
In
dige
nous
Non
-Indi
geno
us
Tot
al
In
dige
nous
Non
-Indi
geno
us
Tot
al
Indicator
Permanent 42 25 67 43 22 65 1 -3 -2Temporary 17 20 37 11 12 23 -6 -8 -14
Total 59 45 104 54 34 88 -5 -11 -16
42 43
1711
25 22
20
12
0
10
20
30
40
50
60
70
80Indigenous Non-Indigenous
2014
Permanent Temporary
2011
2011 2014
Persons
13
2014 Jobs Profile ELLIOTT
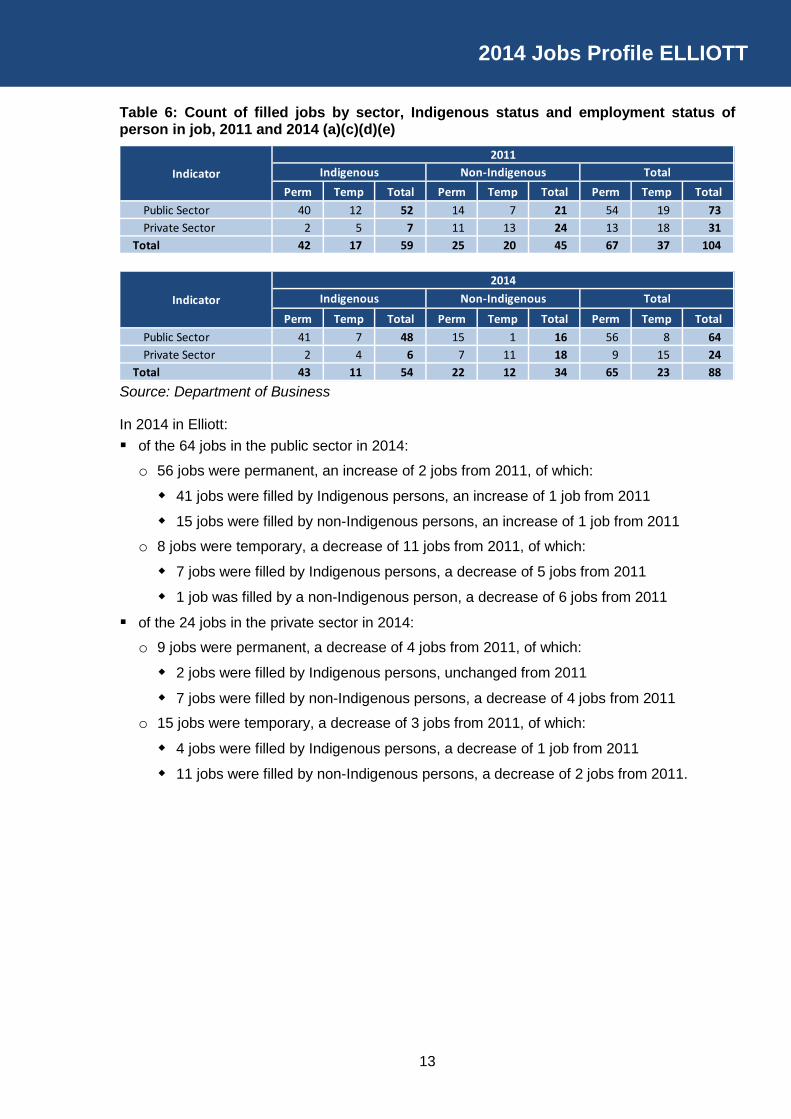
Table 6: Count of filled jobs by sector, Indigenous status and employment status of person in job, 2011 and 2014 (a)(c)(d)(e)
Source: Department of Business
In 2014 in Elliott: of the 64 jobs in the public sector in 2014:
o 56 jobs were permanent, an increase of 2 jobs from 2011, of which:
41 jobs were filled by Indigenous persons, an increase of 1 job from 2011
15 jobs were filled by non-Indigenous persons, an increase of 1 job from 2011
o 8 jobs were temporary, a decrease of 11 jobs from 2011, of which:
7 jobs were filled by Indigenous persons, a decrease of 5 jobs from 2011
1 job was filled by a non-Indigenous person, a decrease of 6 jobs from 2011
of the 24 jobs in the private sector in 2014:
o 9 jobs were permanent, a decrease of 4 jobs from 2011, of which:
2 jobs were filled by Indigenous persons, unchanged from 2011
7 jobs were filled by non-Indigenous persons, a decrease of 4 jobs from 2011
o 15 jobs were temporary, a decrease of 3 jobs from 2011, of which:
4 jobs were filled by Indigenous persons, a decrease of 1 job from 2011
11 jobs were filled by non-Indigenous persons, a decrease of 2 jobs from 2011.
Perm Temp Total Perm Temp Total Perm Temp TotalPublic Sector 40 12 52 14 7 21 54 19 73Private Sector 2 5 7 11 13 24 13 18 31
Total 42 17 59 25 20 45 67 37 104
Perm Temp Total Perm Temp Total Perm Temp TotalPublic Sector 41 7 48 15 1 16 56 8 64Private Sector 2 4 6 7 11 18 9 15 24
Total 43 11 54 22 12 34 65 23 88
Indicator2014
Indigenous TotalNon-Indigenous
Indigenous Total2011
Non-IndigenousIndicator

14
Job Vacancies
Table 7: Job vacancies, 2011 and 2014
Source: Department of Business
Table 8: Job vacancies by occupation, 2011 and 2014 (f)(g)
Source: Department of Business
Table 9: Job vacancies by job title, June-July 2014 (f)
Source: Department of Business
In 2014 in Elliott:
there were 5 vacancies reported, a decrease of 9 vacancies from 2011
of the 5 reported vacancies, the largest requirements were for:
o 2 Community and personal service workers, e.g. School nutrition officer, Police sergeant
o 1 Labourer, e.g. Municipal worker
o 1 Sales worker, e.g. Retail assistant
o 1 Professional, e.g. Public relations trainee.
Indicator 2011 2014 ChangeJob vacancies 14 5 -9
Occupation (ANZSCO major group) 2011 2014 ChangeClerical and Administrative Workers 1 0 -1Community and Personal Service Workers 6 2 -4Labourers 6 1 -5Professionals 0 1 1Sales Workers 0 1 1Other occupations 1 0 -1
Total 14 5 -9
Job Vacancy No.Municipal Worker 1Police Sergeant 1Public Relations Trainee 1Retail Assistant 1School Nutrition Officer 1
Total 5
15
2014 Jobs Profile ELLIOTT
Jobs by Industry
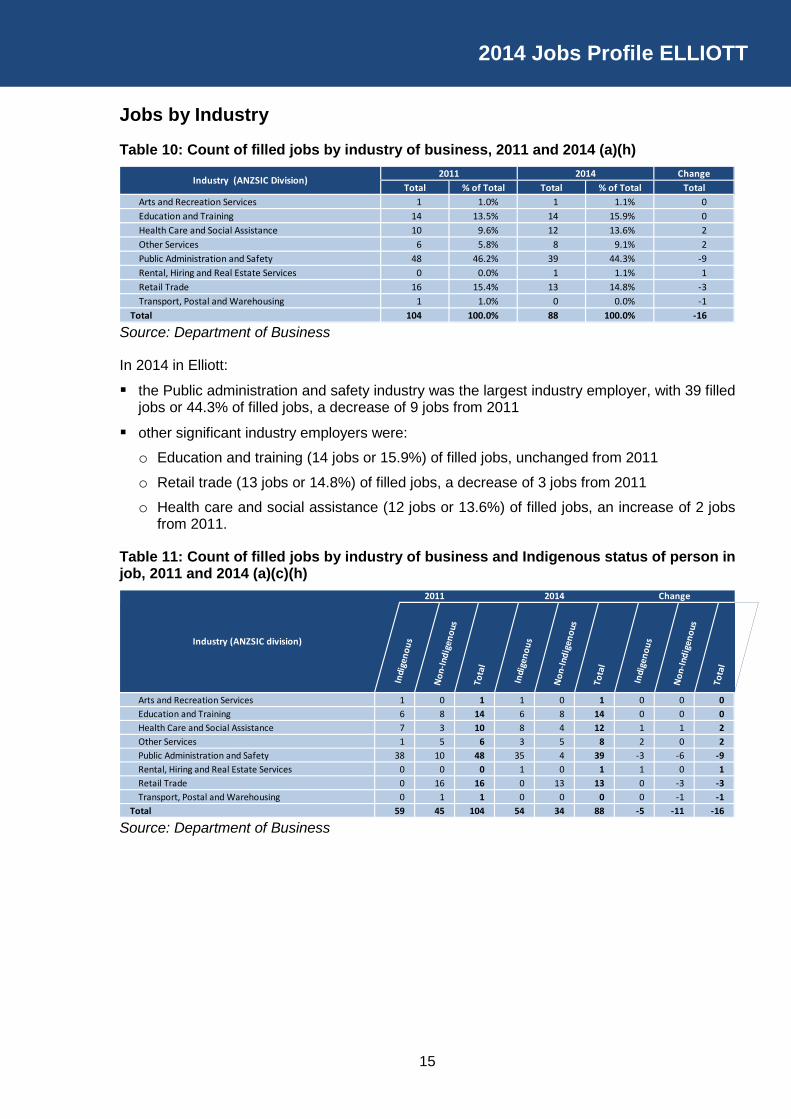
Table 10: Count of filled jobs by industry of business, 2011 and 2014 (a)(h)
Source: Department of Business
In 2014 in Elliott:
the Public administration and safety industry was the largest industry employer, with 39 filled jobs or 44.3% of filled jobs, a decrease of 9 jobs from 2011
other significant industry employers were:
o Education and training (14 jobs or 15.9%) of filled jobs, unchanged from 2011
o Retail trade (13 jobs or 14.8%) of filled jobs, a decrease of 3 jobs from 2011
o Health care and social assistance (12 jobs or 13.6%) of filled jobs, an increase of 2 jobs from 2011.
Table 11: Count of filled jobs by industry of business and Indigenous status of person in job, 2011 and 2014 (a)(c)(h)
Source: Department of Business
ChangeTotal % of Total Total % of Total Total
Arts and Recreation Services 1 1.0% 1 1.1% 0Education and Training 14 13.5% 14 15.9% 0Health Care and Social Assistance 10 9.6% 12 13.6% 2Other Services 6 5.8% 8 9.1% 2Public Administration and Safety 48 46.2% 39 44.3% -9Rental, Hiring and Real Estate Services 0 0.0% 1 1.1% 1Retail Trade 16 15.4% 13 14.8% -3Transport, Postal and Warehousing 1 1.0% 0 0.0% -1
Total 104 100.0% 88 100.0% -16
2011 2014Industry (ANZSIC Division)
2014 Change
Industry (ANZSIC division)
2011
In
dige
nous
Non
-Indi
geno
us
Tot
al
In
dige
nous
Non
-Indi
geno
us
Tot
al
In
dige
nous
Non
-Indi
geno
us
Tot
al
Industry (ANZSIC division)
Arts and Recreation Services 1 0 1 1 0 1 0 0 0Education and Training 6 8 14 6 8 14 0 0 0Health Care and Social Assistance 7 3 10 8 4 12 1 1 2Other Services 1 5 6 3 5 8 2 0 2Public Administration and Safety 38 10 48 35 4 39 -3 -6 -9Rental, Hiring and Real Estate Services 0 0 0 1 0 1 1 0 1Retail Trade 0 16 16 0 13 13 0 -3 -3Transport, Postal and Warehousing 0 1 1 0 0 0 0 -1 -1
Total 59 45 104 54 34 88 -5 -11 -16
16
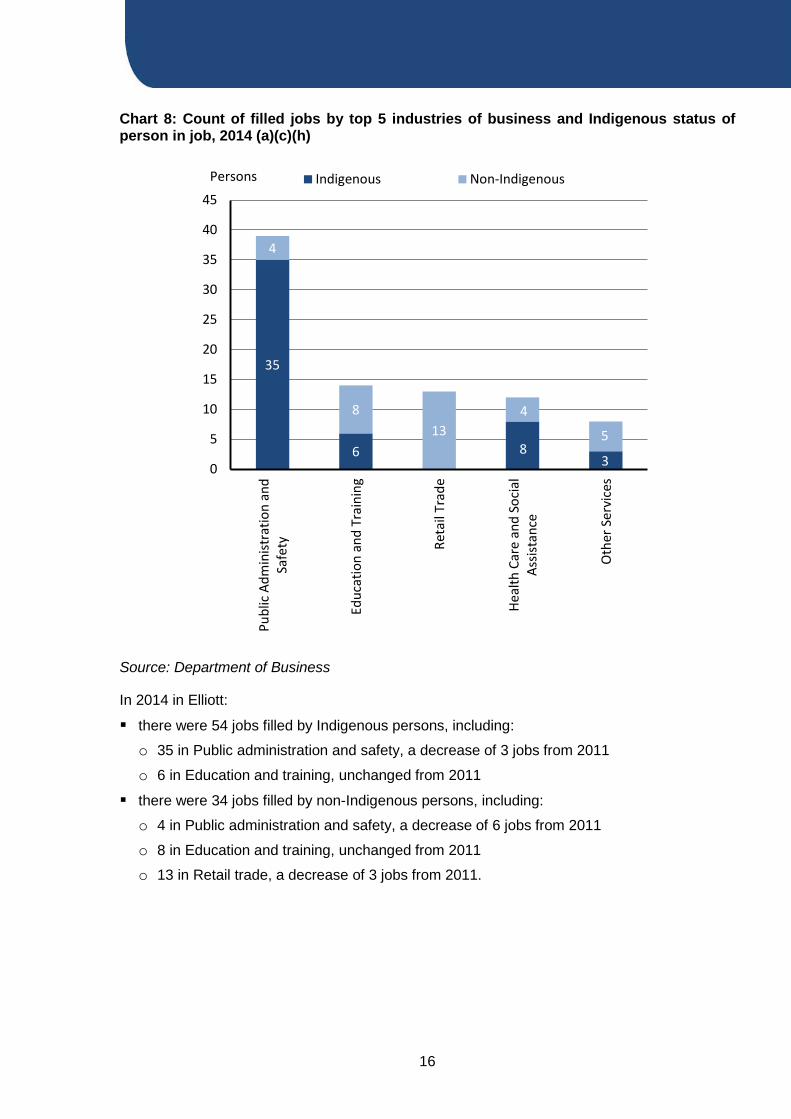
Chart 8: Count of filled jobs by top 5 industries of business and Indigenous status of person in job, 2014 (a)(c)(h)
Source: Department of Business
In 2014 in Elliott:
there were 54 jobs filled by Indigenous persons, including:
o 35 in Public administration and safety, a decrease of 3 jobs from 2011
o 6 in Education and training, unchanged from 2011
there were 34 jobs filled by non-Indigenous persons, including:
o 4 in Public administration and safety, a decrease of 6 jobs from 2011
o 8 in Education and training, unchanged from 2011
o 13 in Retail trade, a decrease of 3 jobs from 2011.
35
6 0 83
4
813
4
5
0
5
10
15
20
25
30
35
40
45
Publ
ic A
dmin
istra
tion
and
Safe
ty
Educ
atio
n an
d Tr
aini
ng
Reta
il Tr
ade
Heal
th C
are
and
Soci
alAs
sista
nce
Oth
er S
ervi
ces
Indigenous Non-IndigenousPersons
17
2014 Jobs Profile ELLIOTT
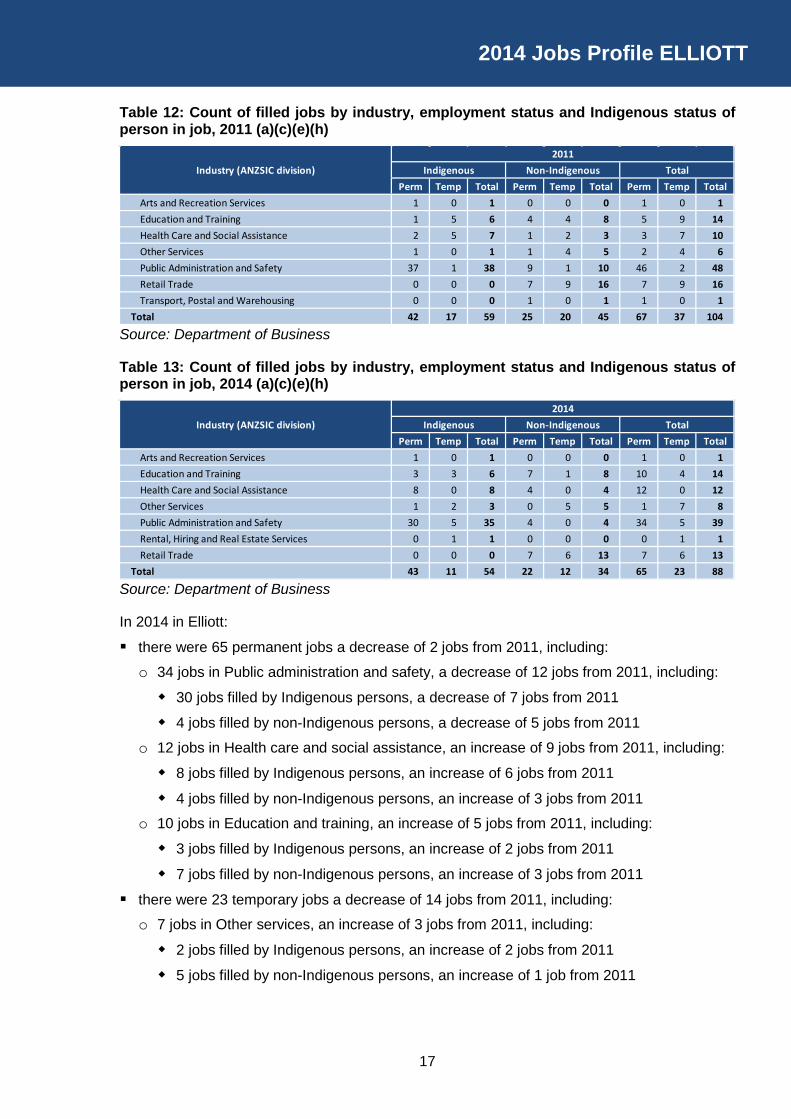
Table 12: Count of filled jobs by industry, employment status and Indigenous status of person in job, 2011 (a)(c)(e)(h)
Source: Department of Business
Table 13: Count of filled jobs by industry, employment status and Indigenous status of person in job, 2014 (a)(c)(e)(h)
Source: Department of Business
In 2014 in Elliott:
there were 65 permanent jobs a decrease of 2 jobs from 2011, including:
o 34 jobs in Public administration and safety, a decrease of 12 jobs from 2011, including:
30 jobs filled by Indigenous persons, a decrease of 7 jobs from 2011
4 jobs filled by non-Indigenous persons, a decrease of 5 jobs from 2011
o 12 jobs in Health care and social assistance, an increase of 9 jobs from 2011, including:
8 jobs filled by Indigenous persons, an increase of 6 jobs from 2011
4 jobs filled by non-Indigenous persons, an increase of 3 jobs from 2011
o 10 jobs in Education and training, an increase of 5 jobs from 2011, including:
3 jobs filled by Indigenous persons, an increase of 2 jobs from 2011
7 jobs filled by non-Indigenous persons, an increase of 3 jobs from 2011
there were 23 temporary jobs a decrease of 14 jobs from 2011, including:
o 7 jobs in Other services, an increase of 3 jobs from 2011, including:
2 jobs filled by Indigenous persons, an increase of 2 jobs from 2011
5 jobs filled by non-Indigenous persons, an increase of 1 job from 2011
Perm Temp Total Perm Temp Total Perm Temp TotalArts and Recreation Services 1 0 1 0 0 0 1 0 1Education and Training 1 5 6 4 4 8 5 9 14Health Care and Social Assistance 2 5 7 1 2 3 3 7 10Other Services 1 0 1 1 4 5 2 4 6Public Administration and Safety 37 1 38 9 1 10 46 2 48Retail Trade 0 0 0 7 9 16 7 9 16Transport, Postal and Warehousing 0 0 0 1 0 1 1 0 1
Total 42 17 59 25 20 45 67 37 104
2011Industry (ANZSIC division) Indigenous Non-Indigenous Total
Perm Temp Total Perm Temp Total Perm Temp TotalArts and Recreation Services 1 0 1 0 0 0 1 0 1Education and Training 3 3 6 7 1 8 10 4 14Health Care and Social Assistance 8 0 8 4 0 4 12 0 12Other Services 1 2 3 0 5 5 1 7 8Public Administration and Safety 30 5 35 4 0 4 34 5 39Rental, Hiring and Real Estate Services 0 1 1 0 0 0 0 1 1Retail Trade 0 0 0 7 6 13 7 6 13
Total 43 11 54 22 12 34 65 23 88
Industry (ANZSIC division)2014
Indigenous Non-Indigenous Total
18
o 6 jobs in Retail trade, a decrease of 3 jobs from 2011, including:
6 jobs filled by non-Indigenous persons, a decrease of 3 jobs from 2011
no jobs filled by Indigenous persons in 2014 or 2011
o 5 jobs in Public administration and safety, an increase of 3 jobs from 2011, including:
5 jobs filled by Indigenous persons, an increase of 4 jobs from 2011
no jobs filled by non-Indigenous persons, a decrease of 1 job from 2011.
Jobs by Occupation
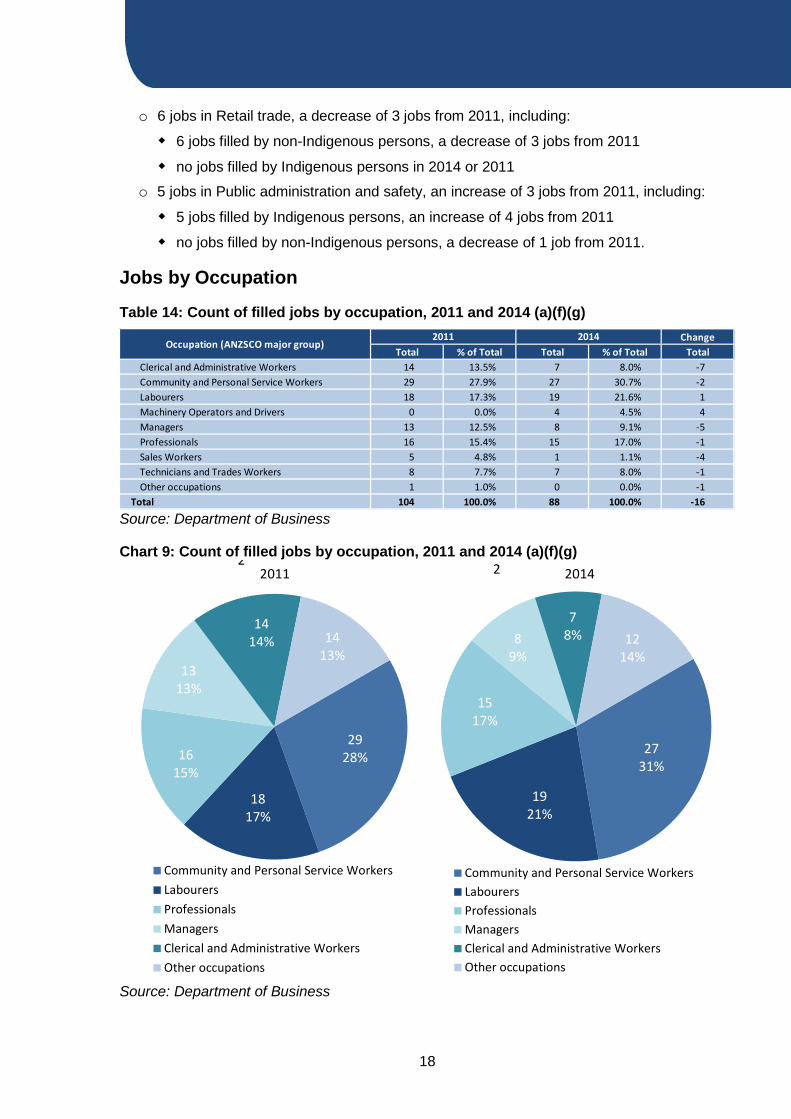
Table 14: Count of filled jobs by occupation, 2011 and 2014 (a)(f)(g)
Source: Department of Business
Chart 9: Count of filled jobs by occupation, 2011 and 2014 (a)(f)(g)
Source: Department of Business
ChangeTotal % of Total Total % of Total Total
Clerical and Administrative Workers 14 13.5% 7 8.0% -7Community and Personal Service Workers 29 27.9% 27 30.7% -2Labourers 18 17.3% 19 21.6% 1Machinery Operators and Drivers 0 0.0% 4 4.5% 4Managers 13 12.5% 8 9.1% -5Professionals 16 15.4% 15 17.0% -1Sales Workers 5 4.8% 1 1.1% -4Technicians and Trades Workers 8 7.7% 7 8.0% -1Other occupations 1 1.0% 0 0.0% -1
Total 104 100.0% 88 100.0% -16
Occupation (ANZSCO major group)2011 2014
2731%
1921%
1517%
89%
78% 12
14%
Community and Personal Service WorkersLabourersProfessionalsManagersClerical and Administrative WorkersOther occupations
2 2014
2928%
1817%
1615%
1313%
1414% 14
13%
Community and Personal Service WorkersLabourersProfessionalsManagersClerical and Administrative WorkersOther occupations
22011
19
2014 Jobs Profile ELLIOTT
In 2014 in Elliott:
Community and personal service workers was the largest occupation classification in terms of filled jobs, accounting for 27 jobs (30.7% of total filled jobs), a decrease of 2 jobs from 2011
other significant occupation classifications were:
o Labourers (19 jobs or 21.6%) an increase of 1 job from 2011
o Professionals (15 jobs or 17.0%) a decrease of 1 job from 2011
o Managers (8 jobs or 9.1%) a decrease of 5 jobs from 2011.
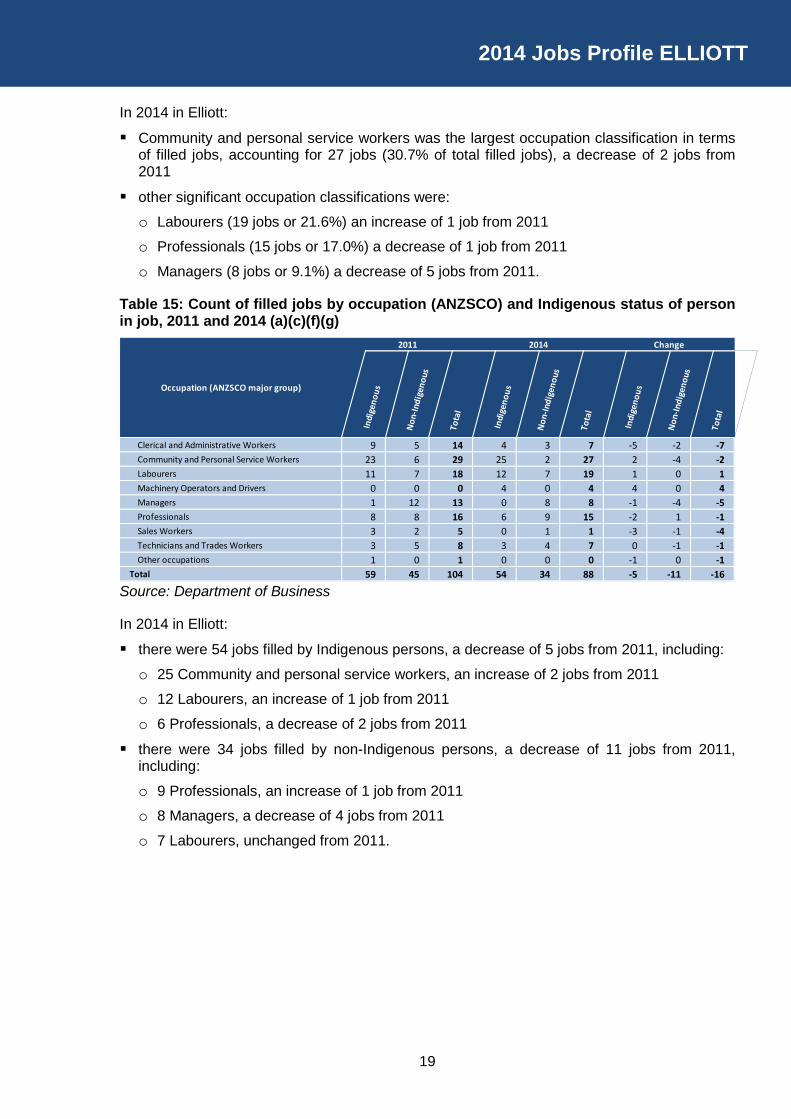
Table 15: Count of filled jobs by occupation (ANZSCO) and Indigenous status of person in job, 2011 and 2014 (a)(c)(f)(g)
Source: Department of Business
In 2014 in Elliott:
there were 54 jobs filled by Indigenous persons, a decrease of 5 jobs from 2011, including:
o 25 Community and personal service workers, an increase of 2 jobs from 2011
o 12 Labourers, an increase of 1 job from 2011
o 6 Professionals, a decrease of 2 jobs from 2011
there were 34 jobs filled by non-Indigenous persons, a decrease of 11 jobs from 2011, including:
o 9 Professionals, an increase of 1 job from 2011
o 8 Managers, a decrease of 4 jobs from 2011
o 7 Labourers, unchanged from 2011.
2011
Occupation (ANZSCO major group)
Change2014
In
dige
nous
Non
-Indi
geno
us
Tot
al
In
dige
nous
Non
-Indi
geno
us
Tot
al
In
dige
nous
Non
-Indi
geno
us
Tot
al
Occupation (ANZSCO major group)
Clerical and Administrative Workers 9 5 14 4 3 7 -5 -2 -7Community and Personal Service Workers 23 6 29 25 2 27 2 -4 -2Labourers 11 7 18 12 7 19 1 0 1Machinery Operators and Drivers 0 0 0 4 0 4 4 0 4Managers 1 12 13 0 8 8 -1 -4 -5Professionals 8 8 16 6 9 15 -2 1 -1Sales Workers 3 2 5 0 1 1 -3 -1 -4Technicians and Trades Workers 3 5 8 3 4 7 0 -1 -1Other occupations 1 0 1 0 0 0 -1 0 -1
Total 59 45 104 54 34 88 -5 -11 -16
20
Jobs by Industry by Occupation
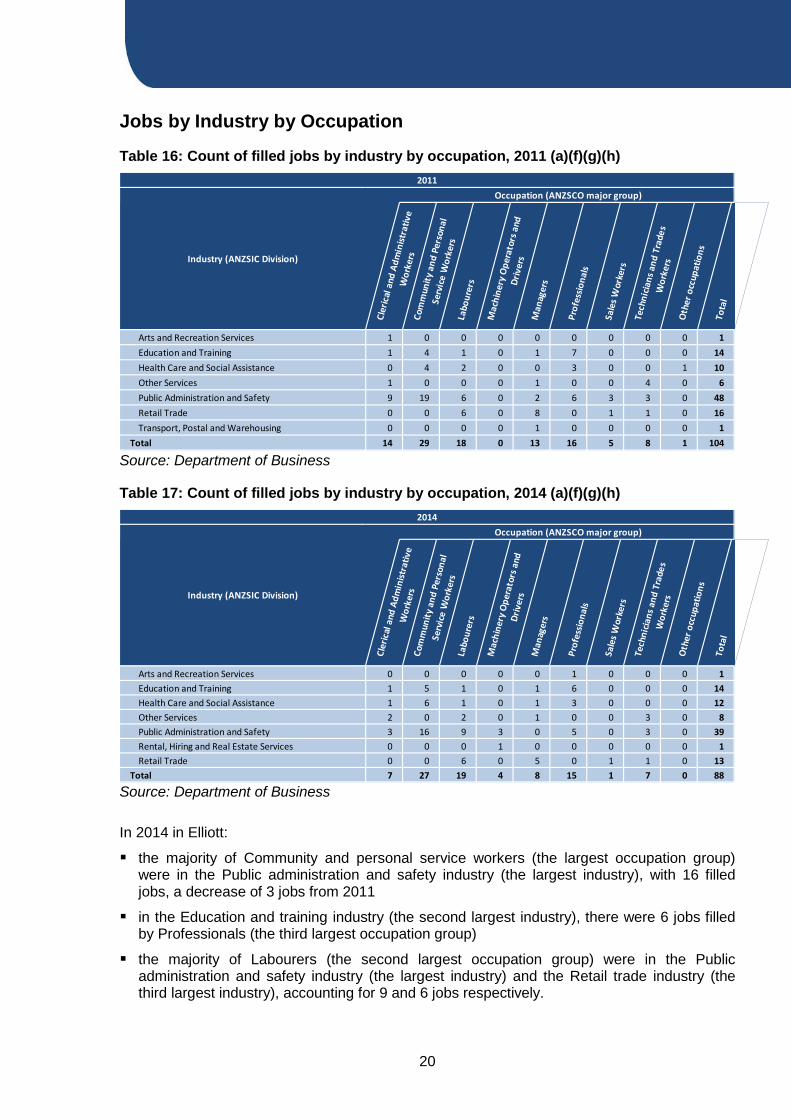
Table 16: Count of filled jobs by industry by occupation, 2011 (a)(f)(g)(h)
Source: Department of Business
Table 17: Count of filled jobs by industry by occupation, 2014 (a)(f)(g)(h)
Source: Department of Business
In 2014 in Elliott:
the majority of Community and personal service workers (the largest occupation group) were in the Public administration and safety industry (the largest industry), with 16 filled jobs, a decrease of 3 jobs from 2011
in the Education and training industry (the second largest industry), there were 6 jobs filled by Professionals (the third largest occupation group)
the majority of Labourers (the second largest occupation group) were in the Public administration and safety industry (the largest industry) and the Retail trade industry (the third largest industry), accounting for 9 and 6 jobs respectively.
2011
Industry (ANZSIC Division)
Occupation (ANZSCO major group)
Cl
eric
al a
nd A
dmin
istra
tive
Wor
kers
Co
mm
unity
and
Per
sona
l Se
rvic
e W
orke
rs
Labo
urer
s
M
achi
nery
Ope
rato
rs a
nd
Driv
ers
M
anag
ers
Pr
ofes
siona
ls
Sa
les W
orke
rs
Tech
nicia
ns a
nd T
rade
s W
orke
rs
Oth
er o
ccup
atio
ns
To
tal
Industry (ANZSIC Division)
Arts and Recreation Services 1 0 0 0 0 0 0 0 0 1Education and Training 1 4 1 0 1 7 0 0 0 14Health Care and Social Assistance 0 4 2 0 0 3 0 0 1 10Other Services 1 0 0 0 1 0 0 4 0 6Public Administration and Safety 9 19 6 0 2 6 3 3 0 48Retail Trade 0 0 6 0 8 0 1 1 0 16Transport, Postal and Warehousing 0 0 0 0 1 0 0 0 0 1
Total 14 29 18 0 13 16 5 8 1 104
Occupation (ANZSCO major group)2014
Industry (ANZSIC Division)
Cl
eric
al a
nd A
dmin
istra
tive
Wor
kers
Co
mm
unity
and
Per
sona
l Se
rvic
e W
orke
rs
Labo
urer
s
M
achi
nery
Ope
rato
rs a
nd
Driv
ers
M
anag
ers
Pr
ofes
siona
ls
Sa
les W
orke
rs
Tech
nicia
ns a
nd T
rade
s W
orke
rs
Oth
er o
ccup
atio
ns
To
tal
Industry (ANZSIC Division)
Arts and Recreation Services 0 0 0 0 0 1 0 0 0 1Education and Training 1 5 1 0 1 6 0 0 0 14Health Care and Social Assistance 1 6 1 0 1 3 0 0 0 12Other Services 2 0 2 0 1 0 0 3 0 8Public Administration and Safety 3 16 9 3 0 5 0 3 0 39Rental, Hiring and Real Estate Services 0 0 0 1 0 0 0 0 0 1Retail Trade 0 0 6 0 5 0 1 1 0 13
Total 7 27 19 4 8 15 1 7 0 88
21
2014 Jobs Profile ELLIOTT
Jobs by Gender
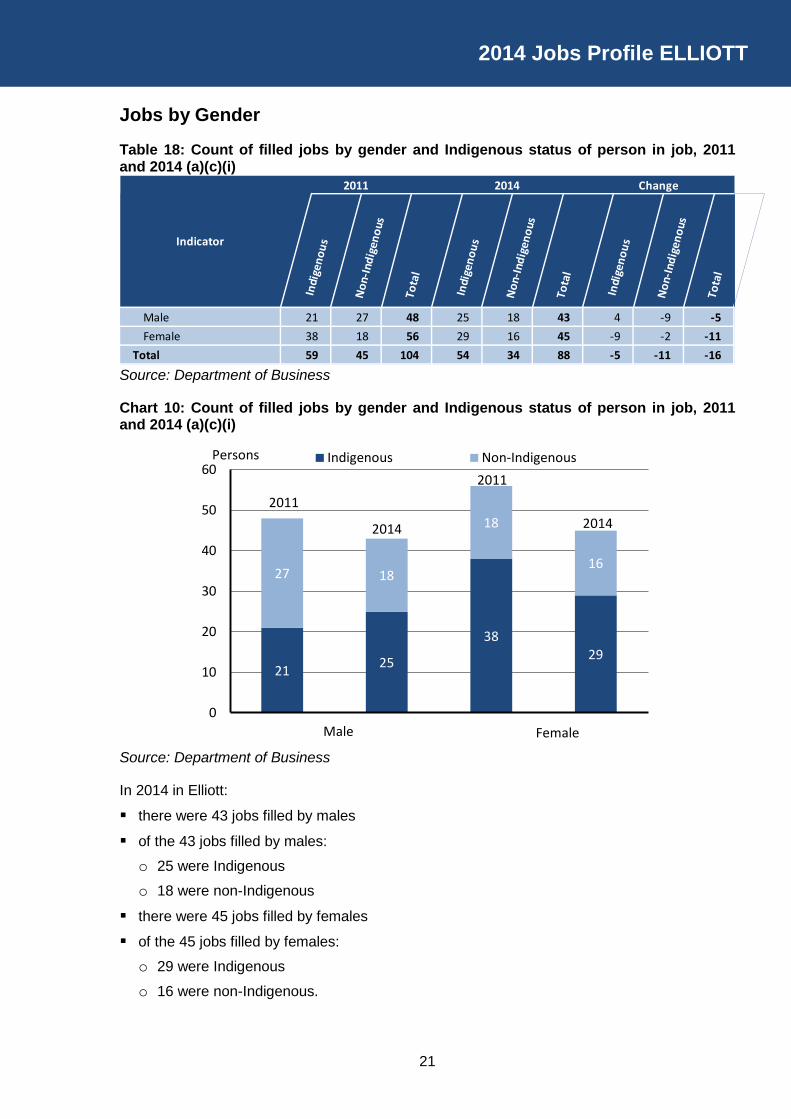
Table 18: Count of filled jobs by gender and Indigenous status of person in job, 2011 and 2014 (a)(c)(i)
Source: Department of Business
Chart 10: Count of filled jobs by gender and Indigenous status of person in job, 2011 and 2014 (a)(c)(i)
Source: Department of Business
In 2014 in Elliott:
there were 43 jobs filled by males
of the 43 jobs filled by males:
o 25 were Indigenous
o 18 were non-Indigenous
there were 45 jobs filled by females
of the 45 jobs filled by females:
o 29 were Indigenous
o 16 were non-Indigenous.
Indicator
2011 2014 Change
In
dige
nous
Non
-Indi
geno
us
Tot
al
In
dige
nous
Non
-Indi
geno
us
Tot
al
In
dige
nous
Non
-Indi
geno
us
Tot
al
Indicator
Male 21 27 48 25 18 43 4 -9 -5Female 38 18 56 29 16 45 -9 -2 -11
Total 59 45 104 54 34 88 -5 -11 -16
21 25
3829
27 18
18
16
0
10
20
30
40
50
60Indigenous Non-Indigenous
2014
Female
2011 2011
2014
Male
Persons
22
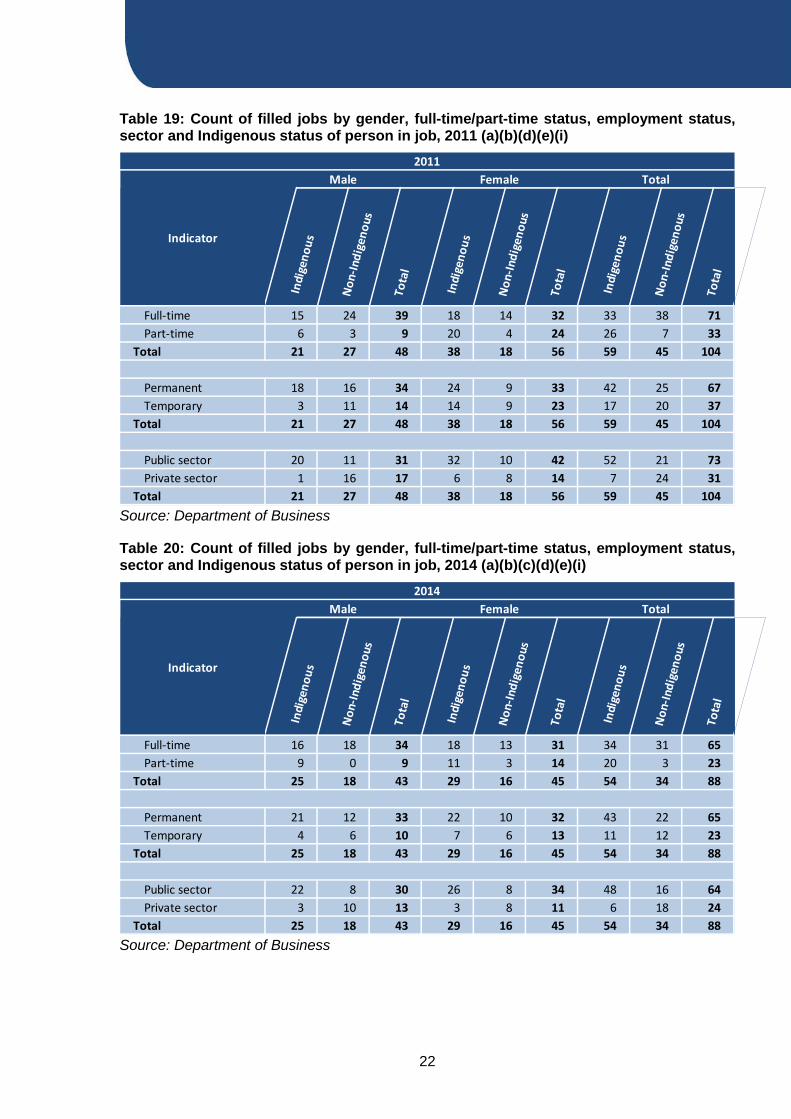
Table 19: Count of filled jobs by gender, full-time/part-time status, employment status, sector and Indigenous status of person in job, 2011 (a)(b)(d)(e)(i)
Source: Department of Business
Table 20: Count of filled jobs by gender, full-time/part-time status, employment status, sector and Indigenous status of person in job, 2014 (a)(b)(c)(d)(e)(i)
Source: Department of Business
Male Female Total2011
Indicator
In
dige
nous
Non
-Indi
geno
us
Tot
al
In
dige
nous
Non
-Indi
geno
us
Tot
al
In
dige
nous
Non
-Indi
geno
us
Tot
al
Indicator
Full-time 15 24 39 18 14 32 33 38 71Part-time 6 3 9 20 4 24 26 7 33
Total 21 27 48 38 18 56 59 45 104
Permanent 18 16 34 24 9 33 42 25 67Temporary 3 11 14 14 9 23 17 20 37
Total 21 27 48 38 18 56 59 45 104
Public sector 20 11 31 32 10 42 52 21 73Private sector 1 16 17 6 8 14 7 24 31
Total 21 27 48 38 18 56 59 45 104
2014
Indicator
Male Female Total
In
dige
nous
Non
-Indi
geno
us
Tot
al
In
dige
nous
Non
-Indi
geno
us
Tot
al
In
dige
nous
Non
-Indi
geno
us
Tot
al
Indicator
Full-time 16 18 34 18 13 31 34 31 65Part-time 9 0 9 11 3 14 20 3 23
Total 25 18 43 29 16 45 54 34 88
Permanent 21 12 33 22 10 32 43 22 65Temporary 4 6 10 7 6 13 11 12 23
Total 25 18 43 29 16 45 54 34 88
Public sector 22 8 30 26 8 34 48 16 64Private sector 3 10 13 3 8 11 6 18 24
Total 25 18 43 29 16 45 54 34 88
23
2014 Jobs Profile ELLIOTT
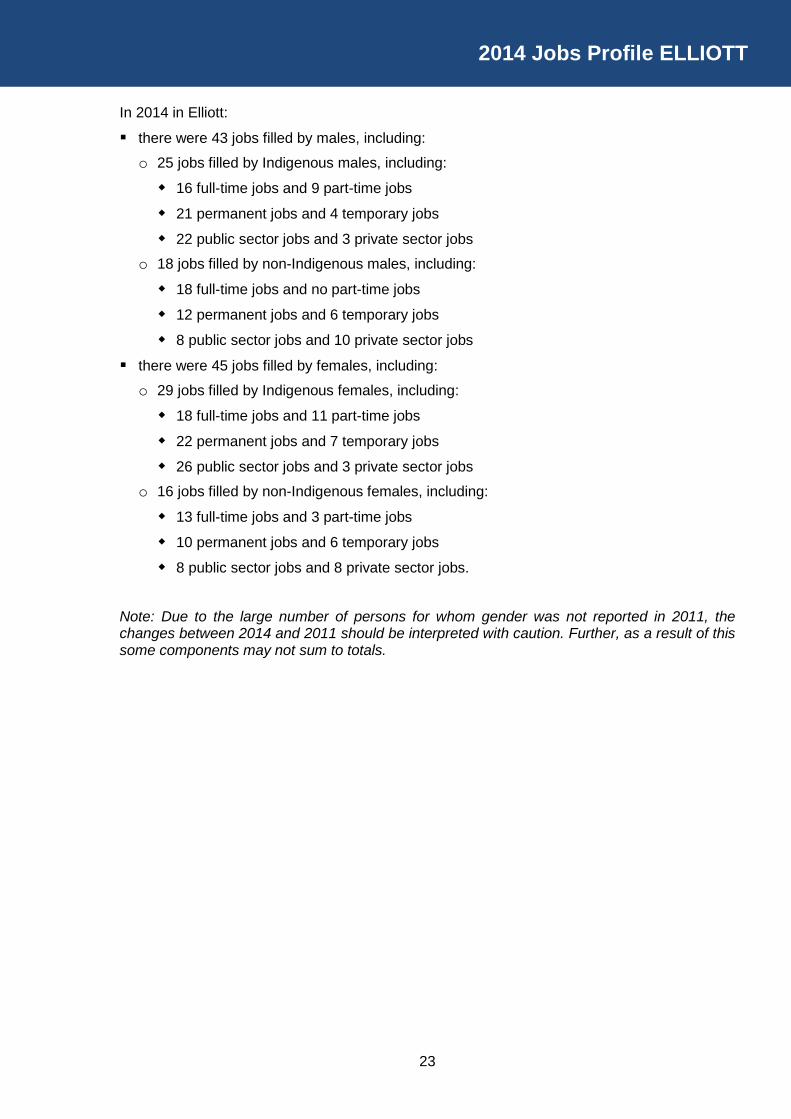
In 2014 in Elliott:
there were 43 jobs filled by males, including:
o 25 jobs filled by Indigenous males, including:
16 full-time jobs and 9 part-time jobs
21 permanent jobs and 4 temporary jobs
22 public sector jobs and 3 private sector jobs
o 18 jobs filled by non-Indigenous males, including:
18 full-time jobs and no part-time jobs
12 permanent jobs and 6 temporary jobs
8 public sector jobs and 10 private sector jobs
there were 45 jobs filled by females, including:
o 29 jobs filled by Indigenous females, including:
18 full-time jobs and 11 part-time jobs
22 permanent jobs and 7 temporary jobs
26 public sector jobs and 3 private sector jobs
o 16 jobs filled by non-Indigenous females, including:
13 full-time jobs and 3 part-time jobs
10 permanent jobs and 6 temporary jobs
8 public sector jobs and 8 private sector jobs.
Note: Due to the large number of persons for whom gender was not reported in 2011, the changes between 2014 and 2011 should be interpreted with caution. Further, as a result of this some components may not sum to totals.
24
Jobs by Age
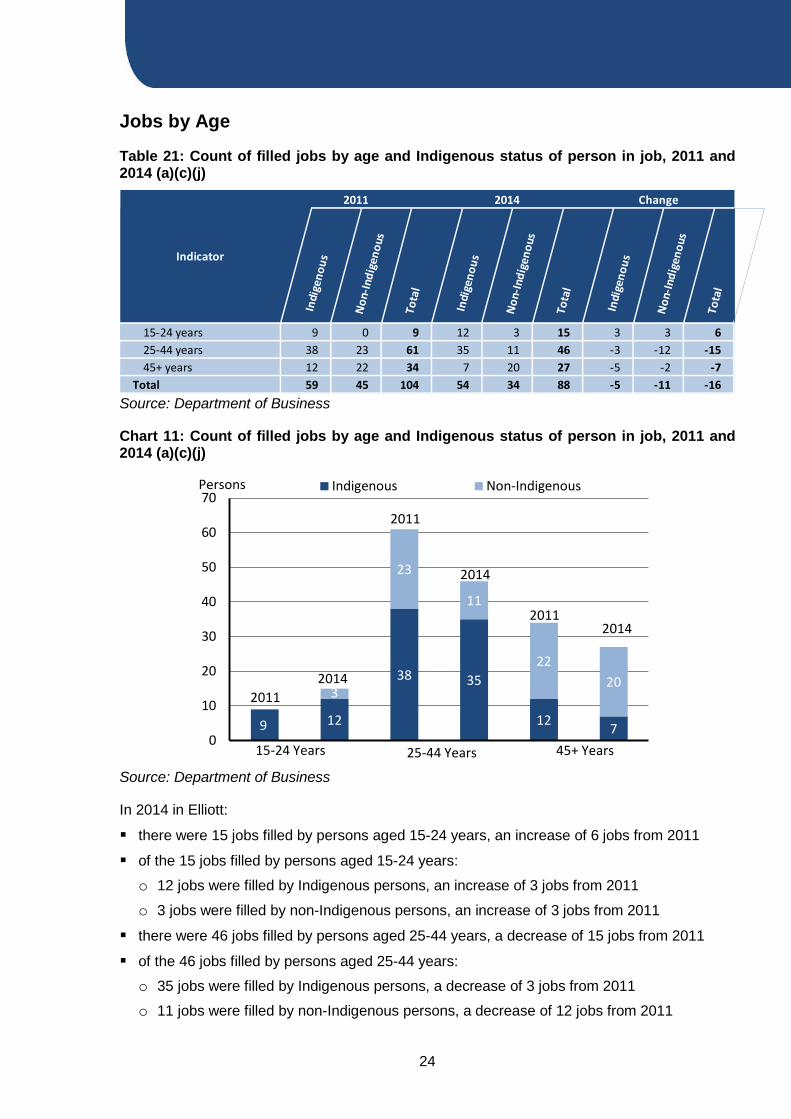
Table 21: Count of filled jobs by age and Indigenous status of person in job, 2011 and 2014 (a)(c)(j)
Source: Department of Business
Chart 11: Count of filled jobs by age and Indigenous status of person in job, 2011 and 2014 (a)(c)(j)
Source: Department of Business
In 2014 in Elliott:
there were 15 jobs filled by persons aged 15-24 years, an increase of 6 jobs from 2011
of the 15 jobs filled by persons aged 15-24 years:
o 12 jobs were filled by Indigenous persons, an increase of 3 jobs from 2011
o 3 jobs were filled by non-Indigenous persons, an increase of 3 jobs from 2011
there were 46 jobs filled by persons aged 25-44 years, a decrease of 15 jobs from 2011
of the 46 jobs filled by persons aged 25-44 years:
o 35 jobs were filled by Indigenous persons, a decrease of 3 jobs from 2011
o 11 jobs were filled by non-Indigenous persons, a decrease of 12 jobs from 2011
Indicator
2011 2014 Change
In
dige
nous
Non
-Indi
geno
us
Tot
al
In
dige
nous
Non
-Indi
geno
us
Tot
al
In
dige
nous
Non
-Indi
geno
us
Tot
al
Indicator
15-24 years 9 0 9 12 3 15 3 3 625-44 years 38 23 61 35 11 46 -3 -12 -1545+ years 12 22 34 7 20 27 -5 -2 -7
Total 59 45 104 54 34 88 -5 -11 -16
9 12
38 35
12 7
0 3
23
11
2220
0
10
20
30
40
50
60
70Indigenous Non-Indigenous
20142011
Persons
2011 2014
25-44 Years 45+ Years
2014
2011
15-24 Years
25
2014 Jobs Profile ELLIOTT
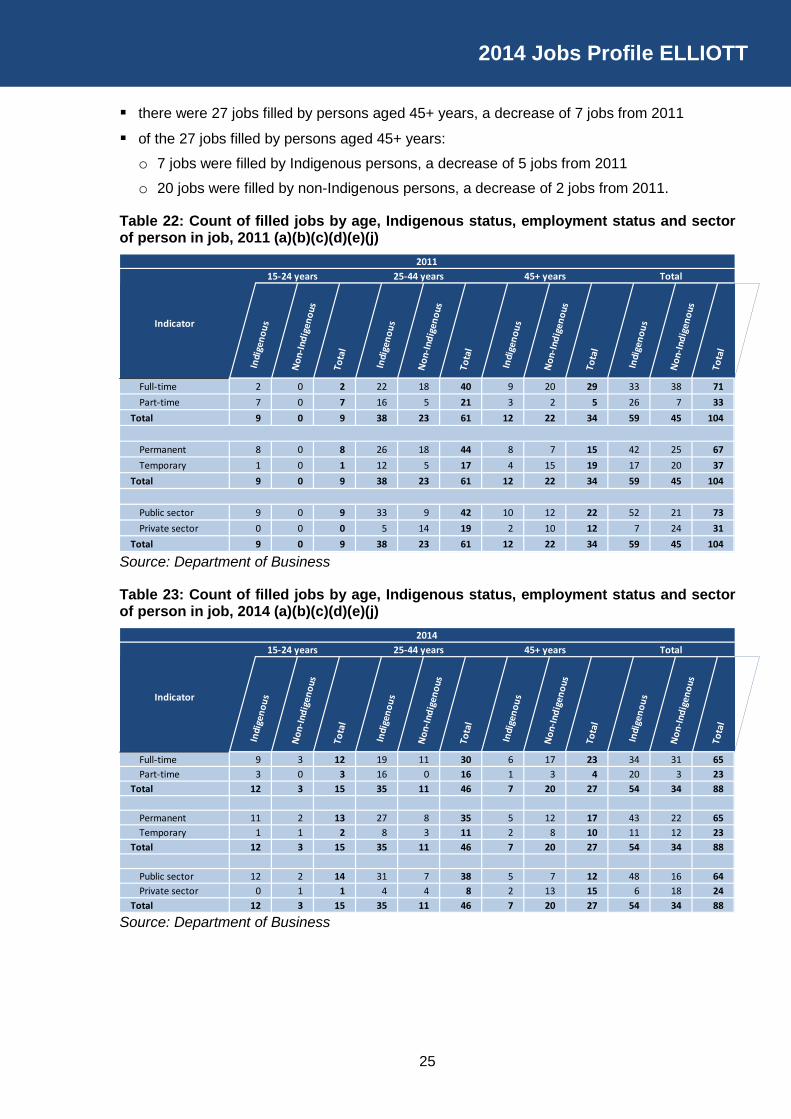
there were 27 jobs filled by persons aged 45+ years, a decrease of 7 jobs from 2011
of the 27 jobs filled by persons aged 45+ years:
o 7 jobs were filled by Indigenous persons, a decrease of 5 jobs from 2011
o 20 jobs were filled by non-Indigenous persons, a decrease of 2 jobs from 2011.
Table 22: Count of filled jobs by age, Indigenous status, employment status and sector of person in job, 2011 (a)(b)(c)(d)(e)(j)
Source: Department of Business
Table 23: Count of filled jobs by age, Indigenous status, employment status and sector of person in job, 2014 (a)(b)(c)(d)(e)(j)
Source: Department of Business
25-44 years 45+ years Total2011
Indicator
15-24 years
In
dige
nous
Non
-Indi
geno
us
Tot
al
In
dige
nous
Non
-Indi
geno
us
Tot
al
In
dige
nous
Non
-Indi
geno
us
Tot
al
In
dige
nous
Non
-Indi
geno
us
Tot
al
Indicator
Full-time 2 0 2 22 18 40 9 20 29 33 38 71Part-time 7 0 7 16 5 21 3 2 5 26 7 33
Total 9 0 9 38 23 61 12 22 34 59 45 104
Permanent 8 0 8 26 18 44 8 7 15 42 25 67Temporary 1 0 1 12 5 17 4 15 19 17 20 37
Total 9 0 9 38 23 61 12 22 34 59 45 104
Public sector 9 0 9 33 9 42 10 12 22 52 21 73Private sector 0 0 0 5 14 19 2 10 12 7 24 31
Total 9 0 9 38 23 61 12 22 34 59 45 104
2014
Indicator
15-24 years 25-44 years 45+ years Total
In
dige
nous
Non
-Indi
geno
us
Tot
al
In
dige
nous
Non
-Indi
geno
us
Tot
al
In
dige
nous
Non
-Indi
geno
us
Tot
al
In
dige
nous
Non
-Indi
geno
us
Tot
al
Indicator
Full-time 9 3 12 19 11 30 6 17 23 34 31 65Part-time 3 0 3 16 0 16 1 3 4 20 3 23
Total 12 3 15 35 11 46 7 20 27 54 34 88
Permanent 11 2 13 27 8 35 5 12 17 43 22 65Temporary 1 1 2 8 3 11 2 8 10 11 12 23
Total 12 3 15 35 11 46 7 20 27 54 34 88
Public sector 12 2 14 31 7 38 5 7 12 48 16 64Private sector 0 1 1 4 4 8 2 13 15 6 18 24
Total 12 3 15 35 11 46 7 20 27 54 34 88
26
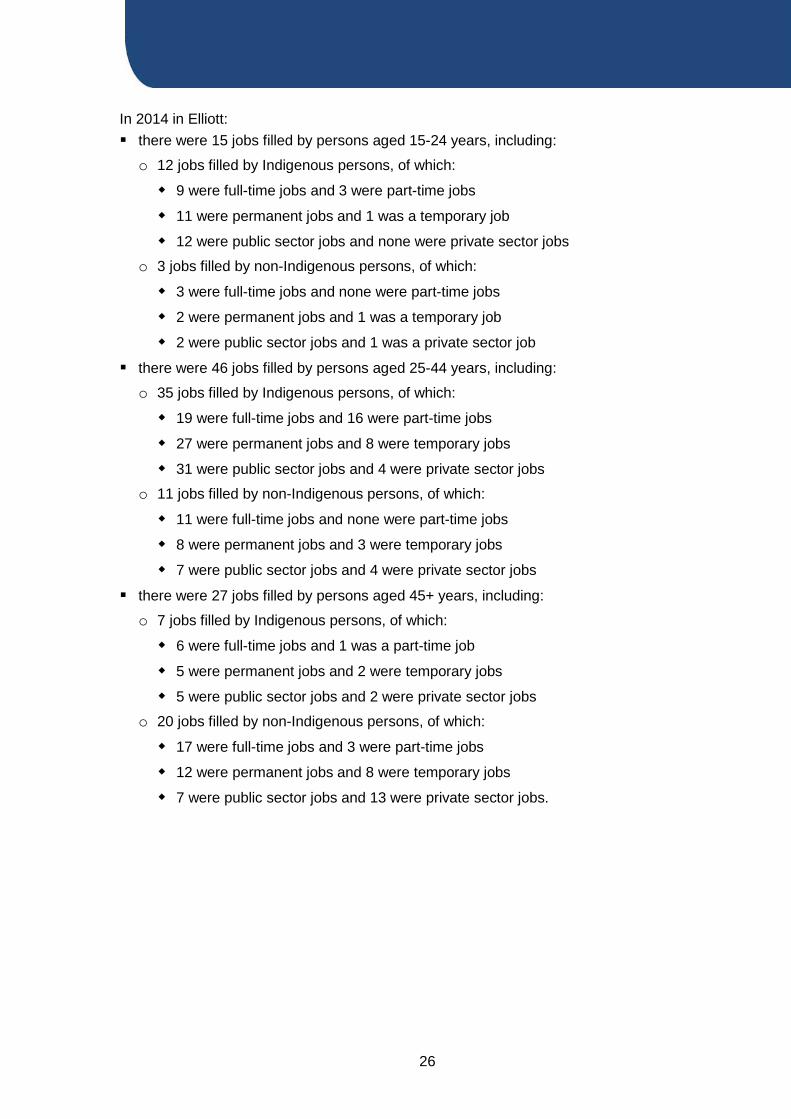
In 2014 in Elliott: there were 15 jobs filled by persons aged 15-24 years, including:
o 12 jobs filled by Indigenous persons, of which:
9 were full-time jobs and 3 were part-time jobs
11 were permanent jobs and 1 was a temporary job
12 were public sector jobs and none were private sector jobs
o 3 jobs filled by non-Indigenous persons, of which:
3 were full-time jobs and none were part-time jobs
2 were permanent jobs and 1 was a temporary job
2 were public sector jobs and 1 was a private sector job
there were 46 jobs filled by persons aged 25-44 years, including:
o 35 jobs filled by Indigenous persons, of which:
19 were full-time jobs and 16 were part-time jobs
27 were permanent jobs and 8 were temporary jobs
31 were public sector jobs and 4 were private sector jobs
o 11 jobs filled by non-Indigenous persons, of which:
11 were full-time jobs and none were part-time jobs
8 were permanent jobs and 3 were temporary jobs
7 were public sector jobs and 4 were private sector jobs
there were 27 jobs filled by persons aged 45+ years, including:
o 7 jobs filled by Indigenous persons, of which:
6 were full-time jobs and 1 was a part-time job
5 were permanent jobs and 2 were temporary jobs
5 were public sector jobs and 2 were private sector jobs
o 20 jobs filled by non-Indigenous persons, of which:
17 were full-time jobs and 3 were part-time jobs
12 were permanent jobs and 8 were temporary jobs
7 were public sector jobs and 13 were private sector jobs.
27
2014 Jobs Profile ELLIOTT
Vocational Education and Training
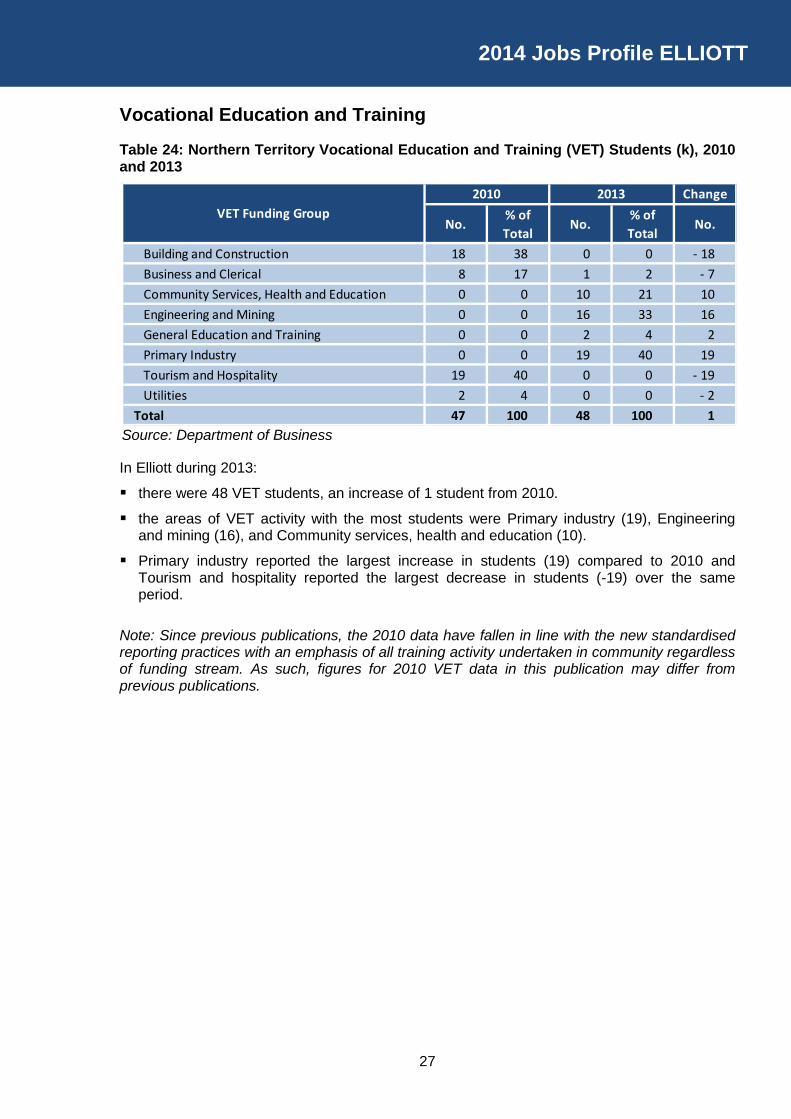
Table 24: Northern Territory Vocational Education and Training (VET) Students (k), 2010 and 2013
Source: Department of Business
In Elliott during 2013:
there were 48 VET students, an increase of 1 student from 2010.
the areas of VET activity with the most students were Primary industry (19), Engineering and mining (16), and Community services, health and education (10).
Primary industry reported the largest increase in students (19) compared to 2010 and Tourism and hospitality reported the largest decrease in students (-19) over the same period.
Note: Since previous publications, the 2010 data have fallen in line with the new standardised reporting practices with an emphasis of all training activity undertaken in community regardless of funding stream. As such, figures for 2010 VET data in this publication may differ from previous publications.
Change
No.% of Total
No.% of Total
No.
Building and Construction 18 38 0 0 - 18Business and Clerical 8 17 1 2 - 7Community Services, Health and Education 0 0 10 21 10Engineering and Mining 0 0 16 33 16General Education and Training 0 0 2 4 2Primary Industry 0 0 19 40 19Tourism and Hospitality 19 40 0 0 - 19Utilities 2 4 0 0 - 2
Total 47 100 48 100 1
VET Funding Group2010 2013
28
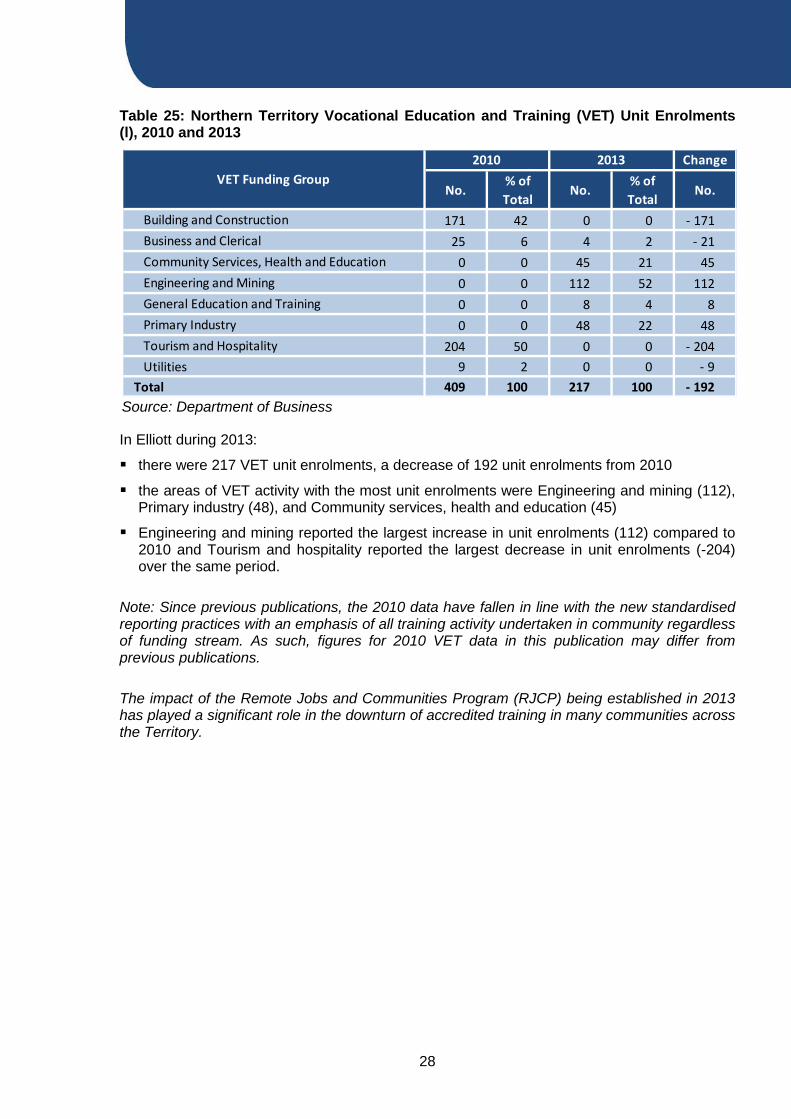
Table 25: Northern Territory Vocational Education and Training (VET) Unit Enrolments (l), 2010 and 2013
Source: Department of Business
In Elliott during 2013:
there were 217 VET unit enrolments, a decrease of 192 unit enrolments from 2010
the areas of VET activity with the most unit enrolments were Engineering and mining (112), Primary industry (48), and Community services, health and education (45)
Engineering and mining reported the largest increase in unit enrolments (112) compared to 2010 and Tourism and hospitality reported the largest decrease in unit enrolments (-204) over the same period.
Note: Since previous publications, the 2010 data have fallen in line with the new standardised reporting practices with an emphasis of all training activity undertaken in community regardless of funding stream. As such, figures for 2010 VET data in this publication may differ from previous publications.
The impact of the Remote Jobs and Communities Program (RJCP) being established in 2013 has played a significant role in the downturn of accredited training in many communities across the Territory.
Change
No.% of Total
No.% of Total
No.
Building and Construction 171 42 0 0 - 171Business and Clerical 25 6 4 2 - 21Community Services, Health and Education 0 0 45 21 45Engineering and Mining 0 0 112 52 112General Education and Training 0 0 8 4 8Primary Industry 0 0 48 22 48Tourism and Hospitality 204 50 0 0 - 204Utilities 9 2 0 0 - 9
Total 409 100 217 100 - 192
VET Funding Group2010 2013
29
2014 Jobs Profile ELLIOTT
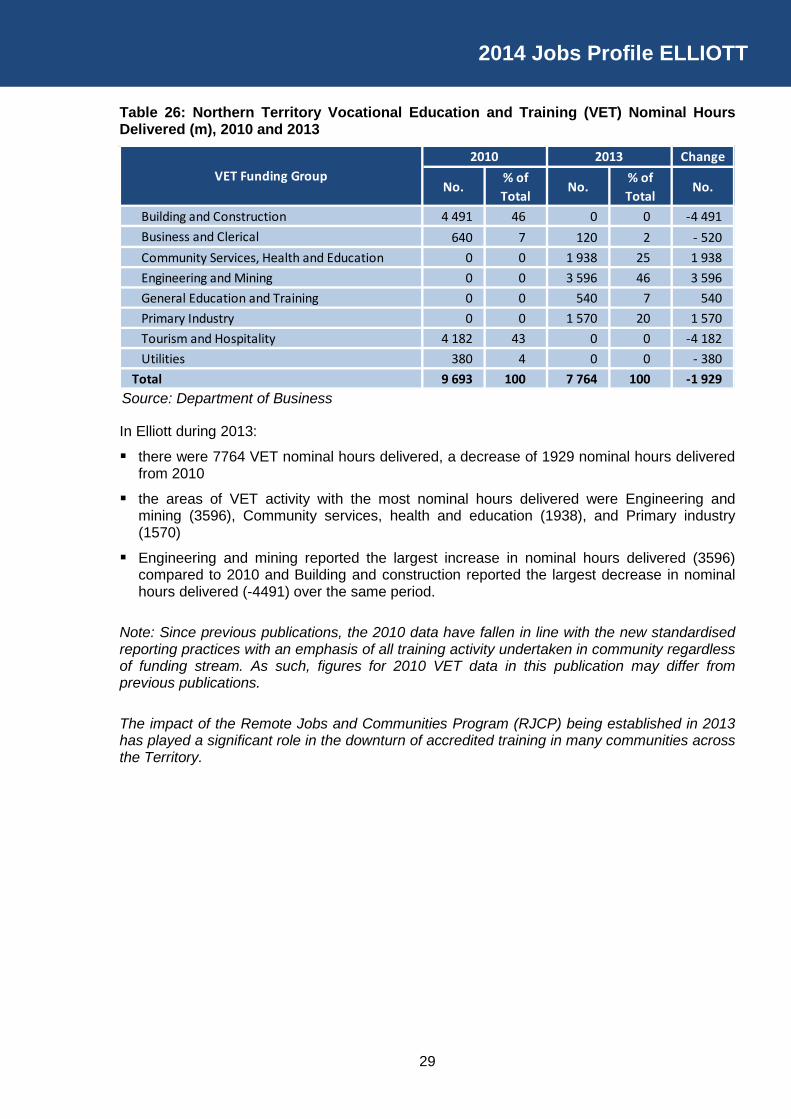
Table 26: Northern Territory Vocational Education and Training (VET) Nominal Hours Delivered (m), 2010 and 2013
Source: Department of Business
In Elliott during 2013:
there were 7764 VET nominal hours delivered, a decrease of 1929 nominal hours delivered from 2010
the areas of VET activity with the most nominal hours delivered were Engineering and mining (3596), Community services, health and education (1938), and Primary industry (1570)
Engineering and mining reported the largest increase in nominal hours delivered (3596) compared to 2010 and Building and construction reported the largest decrease in nominal hours delivered (-4491) over the same period.
Note: Since previous publications, the 2010 data have fallen in line with the new standardised reporting practices with an emphasis of all training activity undertaken in community regardless of funding stream. As such, figures for 2010 VET data in this publication may differ from previous publications.
The impact of the Remote Jobs and Communities Program (RJCP) being established in 2013 has played a significant role in the downturn of accredited training in many communities across the Territory.
Change
No.% of Total
No.% of Total
No.
Building and Construction 4 491 46 0 0 -4 491Business and Clerical 640 7 120 2 - 520Community Services, Health and Education 0 0 1 938 25 1 938Engineering and Mining 0 0 3 596 46 3 596General Education and Training 0 0 540 7 540Primary Industry 0 0 1 570 20 1 570Tourism and Hospitality 4 182 43 0 0 -4 182Utilities 380 4 0 0 - 380
Total 9 693 100 7 764 100 -1 929
VET Funding Group2010 2013

30
Table 27: Northern Territory Vocational Education and Training (VET) Unit Completions (n), 2010 and 2013
Source: Department of Business
In Elliott during 2013:
there were 153 VET unit completions, a decrease of 228 unit completions from 2010
the areas of VET activity with the most unit completions were Engineering and mining (68), Primary industry (46), and Community services, health and education (39)
Engineering and mining reported the largest increase in unit completions (68) compared to 2010 and Tourism and hospitality reported the largest decrease in unit completions (-204) over the same period.
Note: Since previous publications, the 2010 data have fallen in line with the new standardised reporting practices with an emphasis of all training activity undertaken in community regardless of funding stream. As such, figures for 2010 VET data in this publication may differ from previous publications.
The impact of the Remote Jobs and Communities Program (RJCP) being established in 2013 has played a significant role in the downturn of accredited training in many communities across the Territory.
Change
No.% of Total
No.% of Total
No.
Building and Construction 171 45 0 0 - 171Community Services, Health and Education 0 0 39 25 39Engineering and Mining 0 0 68 44 68Primary Industry 0 0 46 30 46Tourism and Hospitality 204 54 0 0 - 204Utilities 6 2 0 0 - 6
Total 381 100 153 100 - 228
VET Funding Group2010 2013

31
2014 Jobs Profile ELLIOTT
Remote Jobs and Communities Program (RJCP)
Table 28: Remote Jobs and Communities Program Indigenous Job Seekers, 30 June 2014 (o)(p)(q)(r)
Source: Department of the Prime Minister and Cabinet
As at 30 June 2014 in Elliott:
there were 23 RJCP Indigenous job seekers.
Note: Due to the low number of RJCP Indigenous Job Seekers in the MRT, a disaggregation by age and gender cannot be undertaken.
Population
Table 29: Indigenous population distribution, 2011 (s)
Source: Australian Bureau of Statistics 2011 Census of Population and Housing
No. %
19 and under <20 n.a.20-24 <20 n.a.25-44 <20 n.a.45+ <20 n.a.
Total 23 100.0
Male <20 n.a.Female <20 n.a.
Total 0 n.a.
7 Weeks <20 n.a.13 Weeks <20 n.a.26 Weeks <20 n.a.
Currently in Activities <20 n.a.
ElliottIndigenous
Age (years)
Gender
Employment Outcome
Indicator
No. %0-4 29 105-14 69 2415-64 178 6265+ 11 4
Total 287 100
Under 20 (0-19) 137 48Youth (15-24) 66 23Mature (50+) 32 11
Group
Age (years)Elliott2011

32
In 2011, there were an estimated 287 Indigenous persons in Elliott, 1.6% of the total
Indigenous population in the MRTs
Nearly three quarters (71%) of the Indigenous population in Elliott were aged 24 years or less.
Businesses
Table 30: Businesses in the community by sector (d)(t)
Source: Department of Business
In 2014 in Elliott:
there were 15 businesses reported on, of which:
o 5 businesses were from the public sector (33%)
o 10 businesses were from the private sector (67%)
5 businesses were reported on in 2011 but not in 2014 as they were not identified as operating in the town in 2014. The businesses were: Batchelor Institute of Indigenous Tertiary Education (BIITE); Centrelink Department of Human Services (DHS); Elliott School; Keogh Family (NT) Pty Ltd/Elliott Service Station/United Fuel; and Post Office.
all businesses identified were reported on.
Business Name SectorReported
on in 2011?Reported
on in 2014?Barkly Regional Council Public Yes YesBatchelor Institute of Indigenous Tertiary Education (BIITE) Private Yes NoCentrelink Department of Human Services (DHS) Public Yes NoDepartment of Education Public Yes YesDepartment of Health Public Yes YesDepartment of the Prime Minister and Cabinet Public No YesElliott School Public Yes NoFuchs, Gwendolyne trading as Sparkle Cleaning Private No YesFuchs, Lawrence Julian trading as Fuchs Motors Private Yes YesKeogh Family (NT) Pty Ltd/Elliott Service Station/United Fuel Private Yes NoKulimindini Arts trading as Barkly Regional Arts Private Yes YesMurlran Pty Ltd trading as Elliott Mechanical Private Yes YesNorthern Interests trading as The Elliot Store NT Private No YesNT Police, Fire and Emergency Services Public Yes YesPost Office Public Yes NoSTEPS Disability Qld Inc Private No YesThe Trustee for Mullan Family Trust & the Trustee for Smith Family Trustee trading as Elliott Hotel and Minishop
Private Yes Yes
The Trustee for VMJ Trading Trust trading as Midland Caravan Park Private Yes YesTriple P Contracting Pty Ltd Private No YesWilliams, Neil Edward Private No Yes
33
2014 Jobs Profile ELLIOTT
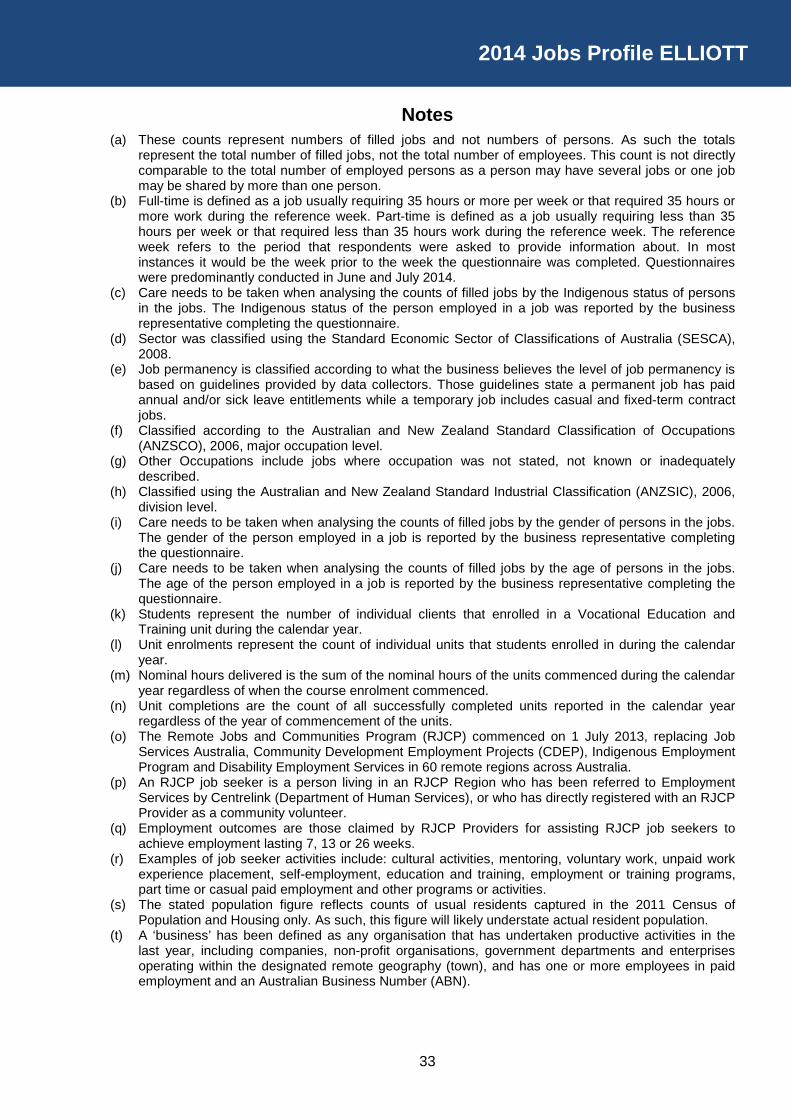
Notes
(a) These counts represent numbers of filled jobs and not numbers of persons. As such the totals represent the total number of filled jobs, not the total number of employees. This count is not directly comparable to the total number of employed persons as a person may have several jobs or one job may be shared by more than one person.
(b) Full-time is defined as a job usually requiring 35 hours or more per week or that required 35 hours or more work during the reference week. Part-time is defined as a job usually requiring less than 35 hours per week or that required less than 35 hours work during the reference week. The reference week refers to the period that respondents were asked to provide information about. In most instances it would be the week prior to the week the questionnaire was completed. Questionnaires were predominantly conducted in June and July 2014.
(c) Care needs to be taken when analysing the counts of filled jobs by the Indigenous status of persons in the jobs. The Indigenous status of the person employed in a job was reported by the business representative completing the questionnaire.
(d) Sector was classified using the Standard Economic Sector of Classifications of Australia (SESCA), 2008.
(e) Job permanency is classified according to what the business believes the level of job permanency is based on guidelines provided by data collectors. Those guidelines state a permanent job has paid annual and/or sick leave entitlements while a temporary job includes casual and fixed-term contract jobs.
(f) Classified according to the Australian and New Zealand Standard Classification of Occupations (ANZSCO), 2006, major occupation level.
(g) Other Occupations include jobs where occupation was not stated, not known or inadequately described.
(h) Classified using the Australian and New Zealand Standard Industrial Classification (ANZSIC), 2006, division level.
(i) Care needs to be taken when analysing the counts of filled jobs by the gender of persons in the jobs. The gender of the person employed in a job is reported by the business representative completing the questionnaire.
(j) Care needs to be taken when analysing the counts of filled jobs by the age of persons in the jobs. The age of the person employed in a job is reported by the business representative completing the questionnaire.
(k) Students represent the number of individual clients that enrolled in a Vocational Education and Training unit during the calendar year.
(l) Unit enrolments represent the count of individual units that students enrolled in during the calendar year.
(m) Nominal hours delivered is the sum of the nominal hours of the units commenced during the calendar year regardless of when the course enrolment commenced.
(n) Unit completions are the count of all successfully completed units reported in the calendar year regardless of the year of commencement of the units.
(o) The Remote Jobs and Communities Program (RJCP) commenced on 1 July 2013, replacing Job Services Australia, Community Development Employment Projects (CDEP), Indigenous Employment Program and Disability Employment Services in 60 remote regions across Australia.
(p) An RJCP job seeker is a person living in an RJCP Region who has been referred to Employment Services by Centrelink (Department of Human Services), or who has directly registered with an RJCP Provider as a community volunteer.
(q) Employment outcomes are those claimed by RJCP Providers for assisting RJCP job seekers to achieve employment lasting 7, 13 or 26 weeks.
(r) Examples of job seeker activities include: cultural activities, mentoring, voluntary work, unpaid work experience placement, self-employment, education and training, employment or training programs, part time or casual paid employment and other programs or activities.
(s) The stated population figure reflects counts of usual residents captured in the 2011 Census of Population and Housing only. As such, this figure will likely understate actual resident population.
(t) A ‘business’ has been defined as any organisation that has undertaken productive activities in the last year, including companies, non-profit organisations, government departments and enterprises operating within the designated remote geography (town), and has one or more employees in paid employment and an Australian Business Number (ABN).
34
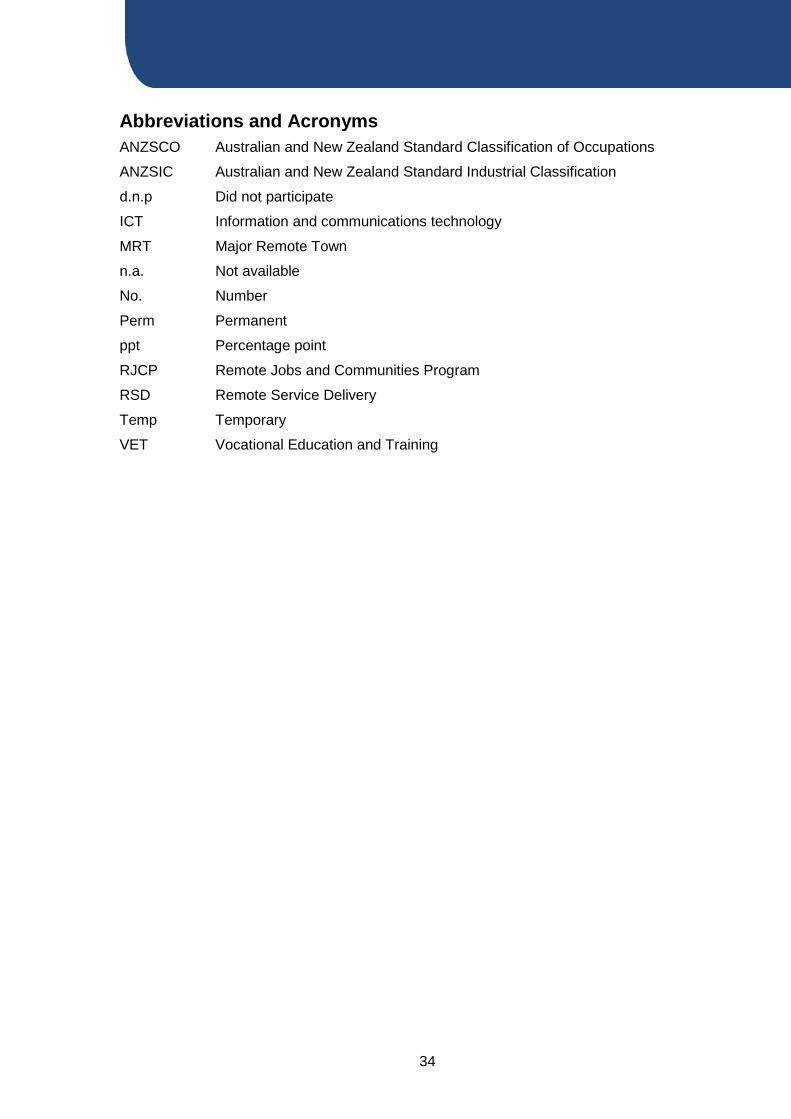
Abbreviations and Acronyms ANZSCO Australian and New Zealand Standard Classification of Occupations
ANZSIC Australian and New Zealand Standard Industrial Classification
d.n.p Did not participate
ICT Information and communications technology
MRT Major Remote Town
n.a. Not available
No. Number
Perm Permanent
ppt Percentage point
RJCP Remote Jobs and Communities Program
RSD Remote Service Delivery
Temp Temporary
VET Vocational Education and Training
For more information, please contact: Department of Business GPO Box 3200 Darwin NT 0801
Phone: 08 8982 1700 Fax: 08 8982 1725 Email: [email protected] Website: www.nt.gov.au/dob ACKNOWLEDGEMENTS: Department of the Prime Minister and Cabinet Barkly Regional Council Kieran Brockman and Joseph Kuhn Published by the Department of Business
© Northern Territory Government 2014
Apart from any use permitted under the Australian Copyright Act 1968 no part of this document may be reproduced without permission from the Northern Territory Government through the Department of Business.