Ellerston Australian Share Fund · The investment objective of the Ellerston Australian Share Fund...
12
Level 11, 179 Elizabeth Street Sydney NSW 2000 Tel: 02 9021 7797 Fax: 02 9261 0528 [email protected] www.ellerstoncapital.com Ellerston Capital Limited ABN 34 110 397 674 AFSL 283 000 APIR Code: ECL0005AU The investment objective of the Ellerston Australian Share Fund is to outperform the S&P/ASX 200 Accumulation Index (Benchmark). The Fund aims to achieve this by investing in a concentrated portfolio of no more than 25 Australian listed securities. Ellerston Australian Share Fund Performance to 31 March 2017 Gross Benchmark* Excess Net 1 Month 4.11% 3.32% 0.79% 4.02% 3 Months 2.44% 4.82% (2.38%) 2.16% FYTD 2017 17.51% 15.92% 1.59% 16.52% Rolling 12 Months 21.59% 20.49% 1.10% 20.27% 2 Years (p.a.) 7.85% 4.37% 3.48% 6.67% 3 Years (p.a.) 9.63% 7.53% 2.10% 8.45% 5 Years (p.a.) 11.98% 10.89% 1.09% 10.78% Since Inception (p.a.) 11.63% 10.94% 0.69% 10.43% Since Inception (CUM) 141.17% 129.47% 11.70% 121.10% Ellerston Australian Share Fund PERFORMANCE REPORT March 2017 The return figures are calculated using the redemption price for Class A Units and on the basis that distributions are reinvested. The Gross and Excess return figures are before fees and expenses whereas the Net return figures are net of fees and expenses for the Class A Units. Returns of the Fund may include audited and un-audited results. Past performance is not a reliable indicator of future performance. * The benchmark was changed from the S&P/ASX 200 Accumulation Ex REITS Index to the S&P/ASX 200 Accumulation Index on 1 July 2012.
-
Upload
nguyenkhue -
Category
Documents
-
view
216 -
download
0
Transcript of Ellerston Australian Share Fund · The investment objective of the Ellerston Australian Share Fund...

Level 11, 179 Elizabeth
Street Sydney NSW 2000
Tel: 02 9021 7797
Fax: 02 9261 0528
www.ellerstoncapital.com
Ellerston Capital Limited
ABN 34 110 397 674
AFSL 283 000
APIR Code: ECL0005AU
The investment objective of the Ellerston Australian Share Fund is to outperform the S&P/ASX 200 Accumulation Index (Benchmark). The Fund aims to achieve this by investing in a concentrated portfolio of no more than 25 Australian listed securities.
Ellerston Australian Share Fund Performance to 31 March 2017
Gross Benchmark* Excess Net
1 Month 4.11% 3.32% 0.79% 4.02%
3 Months 2.44% 4.82% (2.38%) 2.16%
FYTD 2017 17.51% 15.92% 1.59% 16.52%
Rolling 12 Months 21.59% 20.49% 1.10% 20.27%
2 Years (p.a.) 7.85% 4.37% 3.48% 6.67%
3 Years (p.a.) 9.63% 7.53% 2.10% 8.45%
5 Years (p.a.) 11.98% 10.89% 1.09% 10.78%
Since Inception (p.a.) 11.63% 10.94% 0.69% 10.43%
Since Inception (CUM) 141.17% 129.47% 11.70% 121.10%
Ellerston Australian Share Fund PERFORMANCE REPORT March 2017
The return figures are calculated using the redemption price for Class A Units and on the basis that distributions are reinvested. The Gross and Excess return figures are before fees and expenses whereas the Net return figures are net of fees and expenses for the Class A Units. Returns of the Fund may include audited and un-audited results.
Past performance is not a reliable indicator of future performance. * The benchmark was changed from the S&P/ASX 200 Accumulation Ex REITS Index to the S&P/ASX 200 Accumulation Index on 1 July 2012.

2
Market Commentary
Global share markets squeezed higher during March, with the MSCI World Index up 1.0%, but equities lost momentum towards month end, as the “Trump Trade” seemingly hit the skids. The Dow Jones Industrial Average broke through the critical 21,000 level for the first time in history, but could not hold the gains, closing at 20,663.
As expected on March 15, the Federal Reserve tightened US monetary policy by lifting official interest rates by 25 bps and with a dovish tone, announced:
“Information received since the Federal Open Market Committee met in February indicates that the labor market has continued to strengthen and that economic activity has continued to expand at a moderate pace. Job gains remained solid and the unemployment rate was little changed in recent months. Household spending has continued to rise moderately while business fixed investment appears to have firmed somewhat. Inflation has increased in recent quarters, moving close to the Committee's 2% longer-run objective; excluding energy and food prices, inflation was little changed and continued to run somewhat below 2%.” “In view of realized and expected labor market conditions and inflation, the Committee decided to raise the target range for the federal funds rate to 3/4 - 1 percent. The stance of monetary policy remains accommodative, thereby supporting some further strengthening in labor market conditions and a sustained return to 2% inflation.”
But the big surprise during the month was the collapse of the House Republican push to overhaul the Affordable Care Act (Obamacare). This highlighted that the ambitions of the Trump administration and Congressional leaders to “reform” the US tax code, face an even more challenging path in coming months than was previously assumed by market participants. At the same time, the administration saw the tax bill as a ‘must do’ initiative following the failure of Congress to repeal Obamacare. Market observers still see a good chance that Congress will approve some form of new tax legislation in 2017, but the focus might shift to individual tax cuts with grandfather clauses. That said, efforts to pass tax legislation still face many hurdles. The imbroglio over the health care bill shows Congressional Republicans, both moderates and archconservatives, are willing to stand up to President Trump. In the Eurozone, the Euro Stoxx 50 index outperformed its developed peers and posted a solid 5.5% rise. The political backdrop was relatively benign, with Mark Rutte fending off the populist anti-EU candidate in the Dutch elections. Across the continent, Prime Minister Theresa May invoked Article 50 of the Lisbon Treaty, effectively setting the time line for Britain’s divorce from the EU, which is expected to take place on March 31, 2019. A recent study found that Britain has a gross liability (for commitments such as pension liabilities for EU staff, EU loans and other programs) of €86.9 billion, pre any offsets. Despite the official commencement of Brexit, the FTSE 100 rose to 7,322.9 points (+0.8%), as the sustained drop in the pound and U.K. unemployment falling to lows of 4.7% helped support markets. In Asia, the MSCI Asia ex Japan index rallied 3.13%, with the “official” gauge of Chinese factory activity hitting a near five-year high in March, as government stimulus spending and rising prices for factory goods bolstered the world’s second-largest economy. The March manufacturing PMI edged up to 51.8, slightly above the median forecast of 51.7, while the government’s non-manufacturing PMI rose to 55.1 from 54.2 in February. China’s foreign reserves unexpectedly increased in February to $3.005 trillion, marking the first rise since June 2016. Overall, the CSI 300 index had an incredibly volatile month, but finished modestly higher. The Nikkei (-0.4%) was one of the worst performing major markets. Australia’s share market surged to its highest point in almost two years, with the S&P/ASX200 Accumulation Index posting a +3.3% return amid rising earnings estimates, increasing takeover activity and renewed confidence that the global economy will continue to recover, despite US President Donald Trump’s setback on his key healthcare reform.
The S&P/ASX 200 share index closed at 5,864.9 points, after hitting a 23-month intra-month high of 5,876 points on the back of widespread gains. The best performing sectors included Utilities (+6.3%), underpinned by strong performances from AGL (+9.3%) and APA (+5.9%), Health Care (+5.5%), Consumer Staples (+5.4%) and Consumer Discretionary (+5.0%). Big banks stepped up in the last week of March as they implemented out-of-cycle interest rate hikes, but despite this, Banks closed up 3.9%, modestly outperforming. As was the case globally, the worst performing sub-sector during the month was Resources (+0.7%), weighed down by commodity prices coming off the boil, particularly iron ore which fell 12.0%. Telecoms (+0.2%), also trailed. The top 5 stock contributions were from CBA (+0.41%), WBC (+0.3%), CSL (+0.25%), NAB (+0.24%) and ANZ (+0.18%). Domestically, the big news released on the last day of the month was by Australia’s banking regulator APRA, announcing further macro-prudential measures to mitigate risks in the east coast residential mortgage sector “in response to an environment of heightened risks”. The last time this occurred was in December 2014, which involved serviceability restrictions and a 10% cap on investor lending to cool excessive mortgage growth.

3
Authorized Deposit-Taking Institution’s are now immediately expected to:
Limit the amount of interest only loans to 30% of new residential lending (currently around 40% of total system approvals)
Within this, banks must place strict internal limits on the volumes of interest-only loans with LVRs above 80% Require justification for interest only loans above 90% Better management to ensure previously instated 10% investor lending caps are not breached Review loans to ensure serviceability measures are met and set at appropriate levels for current conditions Continue to restrain from lending in high risk areas e.g high loan to income and high LVR loans
Company Specific News
The Hits
Treasury Wine Estates (TWE +3.8%) TWE hosted its inaugural investor presentation in the US, highlighting the progress from its “Agricultural to Brand-led” strategy. Key presentations were espoused from all business heads laying out the platform to deliver multi-year growth, driven by its luxury and masstige brand portfolio. In a surprise move, the company also launched a new French portfolio with luxury wines from Bordeaux, Burgundy, Champagne and Provence to be sold in the North Asian market later this year. This capital light model (inventory investment only) could add another significant growth leg to the company. TPG Telecom (TPM +11.7%) TPM released its 1H17 results which beat expectations by ~5%, driven by cost control in its iiNet platform and lower depreciation and interest charges. The company also re-iterated its FY17 EBITDA guidance of $820m-$830m. After de-rating significantly over the last six months, a sense of stabilisation was enough to squeeze the significant short positions held in the company. Spotless Group (SPO +34.8%)/Downer (DOW -12.7%) We all know the game of snakes & ladders and this is a classic example. Downer totally surprised the market in a mid-month raid on cleaning and catering contractor Spotless Group, launching a takeover offer at $1.15/share (representing a 59% premium to last close of $0.725). SPO’s shareholders had endured a tough couple of years, with the share price falling from a high of $2.47 and the bid at least recovered a few rungs on the ladder. That said, DOW’s shareholders felt the full force of the snake’s fangs. The offer was funded through a heavily discounted fully underwritten $1,011m entitlement priced at $5.95 vs the previous close of $7.42. With DOW’s shares coming back on at the mid-$5 level, this represented a 20% hit. Ouch. Blackmores (BKL +11.2%)/A2 Milk (A2M +24.0%) Both Blackmores and A2M rose strongly as a result of the surprise favourable announcement by MOFCOM (the Ministry of Commerce of the People Republic of China) regarding regulations towards Cross Border E-Commerce (CBEC) after January 2018. In essence, the announcement was a relaxation of the tighter standards that had been announced in April 2016 and will allow products to continue to be imported freely via CBEC platforms. This appears (at least for the moment) to have removed a major risk for companies that are importing branded products into China and could trigger a re-stocking in the channels taking products such as vitamins and infant formula. South32 (S32 +12.8%) South32 has kept true to its goal of delivering surplus cash to shareholders with the announcement of a US$500m buy-back. Including the interim dividend, it represents more than 6% of the current market cap being distributed to shareholders. It is intended that the stock be bought back on-market over the next 12 months. Metcash (MTS +14.4%) Metcash hosted a tour of its home improvement assets including Mitre 10 and the recently acquired Home Timber and Hardware group. The synergies of putting two $1bn businesses together are being realised and MTS guided it will achieve towards the top-end of expectations at circa $20m. This will drive earnings growth over the next two years.
The Misses Navitas (NVT -10.1%) NVT announced that its contract to deliver the Adult English Migrant Program (AMEP) for the Department of Education & Training (DET) will not be renewed in most regions upon expiry, resulting in a permanent reduction in EBITDA of $12-14m from FY18 (~8% of group EBITDA). While the tendering process for AMEP had been flagged by NVT at its 1H result, the market had not expected any changes to be material at a group level, with NVT never having previously disclosed earnings from the contract. However, it is now apparent that AMEP is responsible for the majority of Professional and English earnings, resulting in a far higher concentration of contract risk than previously thought.

4
Fletcher Building (FBU -14.0%) How does this happen just 4 weeks after a result and guidance given to the market? New Guidance now stands at NZ$610m-NZ$650m vs previous guidance of NZ$720-760m and consensus at NZ$720m. Downgrades of 10-15% soon followed. The company announced that a review of its Buildings and Interiors unit identified a greater-than-expected loss on one major construction project. It also flagged further downside risk in a few other major projects. Reviews indicated significantly higher costs to complete the projects, reflecting complexity in design, subcontractor management and building program delivery. This led to an extension of project timelines and a large increase in project resource requirements and costs, relative to original budgets. The market was un-impressed and the shares fell sharply. Myer Group (MYR -0.9%). Myer released its 1H17 results which were broadly in-line with consensus. However it missed at the sales line, with LFL sales for 2Q17 falling back into negative territory. With the highly anticipated arrival of Amazon at some point in 2017, it was not a time to be misfiring at the top-line and further increases the risk of a sector already under structural and cyclical pressure. At the end of the month, Premier Investments (37% owned by Solomon Lew) swooped on the company buying a 10.77% stake in Myer. Premier stated that it is not currently interested in acquiring all of Myer, but clearly wants a seat at the table should any other suitor emerge for the troubled retailer. Harvey Norman (HVN -12.0%) We often talk to the importance of corporate governance as an integral part of our investment process. A strong reminder of its importance was evidenced by the troubles at Harvey Norman this month. HVN’s accounts, confusing at the best of times, have come under scrutiny from ASIC. However the real surprise came when the ASX issued the company with a share price query and the review by ASIC was firstly denied, then confirmed and then finally qualified.

5
Performance Pleasingly the Fund’s return of 4.11% compares favourably to the benchmark return of 3.32%, as we maintain our bottom-up, stock specific approach.
The key contributors for the month of March came from our overweight holdings in Nufarm (+9.6%), Primary Healthcare (+9.8%) and Caltex (+6.7%), as well as not owning any BHP (-1.7%) or Telstra (-0.1%) which underperformed.
Key detractors to performance were overweight positions in Rio Tinto (-2.4%), APN Outdoor (-1.7%) and Orica (-3.8%), as well as not owning any CSL (+7.1%) and CBA (+4.4%), which rallied.
Securities Held
Securities Not Held
Four straight positive quarters: The S&P/ASX 200 Accumulation Index returned 4.8% for the March quarter 2017, well above Q1 historical average of 3.2% (since 1950). Health Care (+15%), followed by Staples (+11%) and Utilities (+11%) were the best-performing sectors, whilst the Telecoms sector lagged. Financials (+226 bps) added the most value, through the Banks (+192 bps), with support from the Health Care (+94 bps) and Staples (+74 bps) sectors. At the stock level, CSL was a stand-out contributor, adding 80 bps, followed by CBA (+63 bps), WBC (+55 bps) and NAB (+48 bps). Of the detractors, value was lost through BXB (-31 bps), TLS (-23 bps) and BHP (-11 bps). Banks, Health Care and Staples have accounted for ~75% of the S&P/ASX200 Total Return in Q1 CY2017.
Source: Bloomberg, Morgan Stanley Research
-0.36%, RIO ███████████████████████████ ████████████████████████████████████████ NUF, 0.53%
-0.21%, APO ████████████████ ██████████████████████████████████████ PRY, 0.51%
-0.18%, ORI █████████████ ██████████████ CTX, 0.19%
-0.14%, GNC ███████████ ███████████ HGG, 0.14%
-0.06%, BLD █████ ████████ GWA, 0.10%
-0.13%, CSL ██████████ ████████████████████ BHP, 0.27%
-0.10%, CBA ███████ ██████████ TLS, 0.13%
-0.08%, S32 ██████ ██████ SCG, 0.08%
-0.08%, SYD ██████ ████ FMG, 0.05%
-0.06%, AGL █████ ███ SUN, 0.04%

6
Activity
Following the extraordinary rally in Computershare (CPU) and recovery in the share price of Boral (BLD) since both stocks were first introduced into the portfolio (CPU in August at $9.84 and BLD in December at $4.80), profits were taken and the holdings were significantly downsized. The proceeds were mainly used to strengthen the existing position in Dulux (DLX) and during the month, we also introduced The Star Entertainment Group (SGR) into the portfolio for the first time ever. The Star Entertainment Group (formerly known as Echo Entertainment Group) owns and operates The Star in Sydney, Treasury Casino and Hotel in Brisbane and Jupiters Gold Coast on the Gold Coast. A beneficiary of Chinese and SE Asian tourism. Despite the VIP decline, we believe that Star will be a beneficiary longer term of the ongoing growth in inbound Chinese and SE Asian tourism into Australia, driven in part by:
China’s rising middle class;
Australia's popularity with Asian tourists as a key holiday destination that has close proximity to Asia;
Increased airline flight capacity and frequency to and from Asia;
Favourable currency exchange for Chinese and SE Asian visitors relative to other competing tourist
destinations such as Europe and the US; and
The China-Australia Free Trade Agreement (ChAFTA) signed in 2015.
To date, Chinese and SE Asian inbound tourism growth trends have been strong, with short term arrivals to Australia more than doubling to 2.36m visitors in FY16, vs 1.14m in FY10 on a seasonally adjusted basis according to ABS data. This represents ~11% compound annual growth rate (CAGR) over this period.
Source: Citi Research
Star’s properties in Sydney, Brisbane and the Gold Coast should be key beneficiaries from this theme. According to Destination NSW, international visitors to Sydney from Mainland China accounted for the largest share of visitors at 18.6% for the YE Sep 2016. Likewise in Queensland, Asia was the largest source of holiday visitors, accounting for 49% of total visitation. Brisbane and Gold Coast were the two most popular destinations within Queensland, respectively. Recent de-rating leads to buying opportunity Notwithstanding these encouraging macro trends, The Star has recently experienced a significant de-rating (refer chart below) mainly driven by concerns around the VIP business, a recovery in mass market and the possible acquisition/merger of SkyCity (as reported in the press). In our view these concerns are overplayed by the market and furthermore we see solid growth prospects for Star, driven by its capital investment program and growth strategy.

7
Source: Morgan Stanley
Early signs of VIP stabilisation In October 2016, a number of Crown Resorts (CWN) employees were detained by Chinese authorities. At its AGM on 20 October 2016, Crown Resorts stated that there was no information at that stage as to the reasons for their detention. Importantly for Star, it has no offices in Mainland China and no employees have been questioned or detained as part of the investigation. As a consequence of the detentions, VIP turnover across the Australasian casino operators declined materially. In relation to SGR, turnover in November and December 2016 was down 27%, but down 4.2% in July-October 2016 on pcp. While the market appears to be factoring in a significant further decline in the VIP business, we note that Star has not seen a further deterioration in the early stages of 2H17, suggesting there may be some signs of stabilisation. Recent VIP gaming revenues in Macau have also shown some signs of growth, with the December quarter recording +12.7% growth yoy. Should this growth be sustained, it is reasonable to assume some business will flow back into Australia. Moreover, VIP is a lower margin business that accounted for 16% of SGR’s normalised EBITDA in FY16 and we estimate that 70-80% is originated out of North Asia. On our estimates, we believe the market is currently pricing in virtually zero value to SGR’s VIP business. Mass market improving Star reported normalised earnings of $107m in 1H17, which was ~9% below market expectations. While this headline number is prima facia disappointing, it was impacted by largely one-off factors, including significant capital works disruption. Our view is supported by the stronger than anticipated performance in the first 6 weeks of the second half as the business cycles through these factors. As capital works construction disruption has abated, gaming capacity has increased, the loyalty program has been relaunched, and hold rates are normalizing. The company stated that mass market revenues were up 11.4% in the first 6 weeks of 2H with gaming revenue growth slightly above this and non-gaming slightly below. The growth is broad based but higher at Sydney and the Gold Coast. While this growth rate is likely to have been assisted by Chinese New Year, we believe it has only had a slight positive impact on the numbers (+1-2%) and this is evidenced by the strong performance in the month of January, just prior to the commencement of Chinese New Year. Capex program underpinned by capital partnering strategy Looking to the medium term, Star’s earnings profile looks robust as it reaps benefits from its significant capital investment program. The key investments include:
Sydney – Sovereign Room expansion and a 400 key Ritz-Carlton hotel tower
Gold Coast – 6 star hotel, including Sovereign Private Gaming Rooms and VIP salons (2HFY18)
Brisbane – $2bn Integrated Resort comprising 1,100 premium hotel rooms over 5 brands, 50+ F&B offerings,
signature gaming facilities (CY2024 expected opening).

8
Despite Star embarking on an expansive capital program over the next few years, we are attracted to its capital partnering strategy whereby Star is teaming up with global real estate players Chow Tai Fook and Far East Consortium on big ticket capital projects. Star will contribute 50% of the capital in the Queen’s Wharf Integrated Resort project in Brisbane, but will benefit as the operator of the casino under a long dated management agreement.
Acquisition of SkyCity unlikely at this point Ongoing press speculation that The Star is contemplating acquiring SkyCity has also weighed on SGR sentiment. While we would never say never, with the two companies currently trading on similar multiples (SKC: 8.5x vs SGR 8.6x FY18E EBITDA) and assuming SkyCity shareholders would require a control premium, it implies that a potential deal is likely to negate any synergies and therefore would not make sense for SGR. We note that a large portion of operating costs (>50%) are related to casino venue labour and is unlikely to be a source of synergy saving. We see limited scope for significant synergies between the two companies, thus an acquisition would not make sense.
In summary, we believe the market has mispriced the fair value of The Star and as the above market fears dissipate, the stock should re-rate to its historical average. SGR is trading at an undemanding multiple (8.5x EBITDA and 16.6x PE FY18E) and at a significant discount (>1 standard deviation) to its historical PE relative multiple. The balance sheet is robust with net debt/EBITDA approximating 1.7x on our estimates.

9
Strategy and Outlook The bull market in global equities is now eight years in duration and over this period, investors have generally enjoyed solid returns. The S&P 500 has enjoyed a powerful recovery, having increased by ~250% since its low on March 9, 2009, generating an annualised return of 19.5% (including dividends). Global equities have rallied ~160% or 13% annualised over this period, while Europe’s Stoxx 600 has increased 140% (11.5% annualised). Interestingly, these gains have occurred with very little in the way of earnings growth. 10 year compound real profit growth globally is the lowest it has been in ~30 years. In fact, in Europe, the level of EPS remains 8% below its 2007 peak. Equity markets, like other financial assets, have experienced major PER multiple expansion over recent years and have been propelled by collapsing world interest rates and the expansionary impact of QE. The impact of reflationary policies has led to a cyclical uptick in world growth and interest rates and markets have been riding this wave for some time. That said, the key valuation components driving PER expansion in Australia could come under near term pressure, but against this, the upgrade cycle in resources and the typical bank share run-up into results and dividends have continued to buoy the Australian market.
The risk-free rate (the core ingredient for pricing all financial assets), has arguably already seen its historical low point and should continue to rise as inflationary pressures build. China is also likely to slow in 2018, constraining the resources upgrade cycle from this point on. Global macro risks are rising, brought about partly by a potential imbalance in world trade as US President Trump seeks better trade terms with other nations. A faster than expected pick-up in US wage inflation and a faster rate of interest rate hikes by the US Federal Reserve could also upset the apple cart.
The past eight years have clearly been characterised by global disinflation in the real economy against a backdrop of financial asset price inflation. The risk that this trend reverses is increasing, as accelerating input price led inflation further pushes up bond yields and as a result, this should moderate future asset price returns.
Asset and Real Economy price divergence in the last cycles Total Return performance since January 2009
As growth momentum slows and bond yields rise, there is an elevated risk of a market correction - it may well be that we are getting close to the peak in global growth momentum.

10
FY17 Consensus EPS growth now at 14.5%: Despite lagging the rally in March, materials continue to drive consensus
EPS growth higher, with FY17 now at 14.5% (from 13.7%) and FY18 at 7.1% (from 6.8%). However, FY19 EPSg forecasts
have drifted from 4.8% to 4.4%, given a lack of broader industrials growth conviction.
Valuations continue to look stretched: Industrials-ex-Financials are now trading at 19.4x (from 18.9x in Feb), while the
broader market (ASX 200) is trading towards its historical high of 15.9x.
Meanwhile, the earnings momentum in Resources has taken its P/E down from 24.8x in April 2016 to 13.3x currently,
marking an 8% discount to its long-term average of 14.4x.
Market stretched – with Industrials-ex-Financials at 19.4x, whilst the ASX 200 is now at 15.9x. In contrast,
Resources are now trading at an 8% discount to their long-term averages.
Source: RIMES, IBES, Morgan Stanley Research
Against this backdrop, we feel the portfolio has the right mix of reasonably priced growth stocks coupled with some deeply discounted cyclical/value oriented stocks at this critical juncture. We believe the Australian market may struggle to make serious headway from the current Index level and thus going forward, stock selection will be critical. Or alternatively, we might all be climbing the market wall of worry and the bull market music plays on……stay tuned and stay alert!
Warm Regards,
Chris Kourtis
Portfolio Manager

11
11
.9% 2
0.3
%
47
.2%
14
.5%
3.8
%
61
.2%
19
.8%
11
.7%
7.2
%
0.0
%
-49
.28
%
0.5
0%
35
.47
%
7.2
7%
3.7
9%
-50.0%
-40.0%
-30.0%
-20.0%
-10.0%
0.0%
10.0%
20.0%
30.0%
40.0%
50.0%
60.0%
70.0%
Top 20 Top 50 Top 100 Top 200 Ex 200
Portfolio ASX 200 Active
Top 10 Holdings
COMPUTERSHARE
DULUXGROUP
GRAINCORP
HEALTHSCOPE
LINK ADMINISTRATION HOLDINGS
NUFARM
PRIMARY HEALTH CARE
RIO TINTO
STAR ENTERTAINMENT GROUP
TREASURY WINE ESTATES
Active Sector Exposures*
Size Comparison Chart vs ASX 200
* Active sector exposures are determined by subtracting fund sector weights from benchmark weights. Positive percentages represent over-weight sector exposures relative to benchmark and negative percentages represent under-weight sector exposures relative to the benchmark.
(50%)
(40%)
(30%)
(20%)
(10%)
0%
10%
20%
Co
nsu
mer
Dis
cret
ion
ary
Co
nsu
mer
Sta
ple
s
Ener
gy
Fin
anci
als
Hea
lth
Car
e
Ind
ust
rial
s
Info
rmat
ion
Tec
hn
olo
gy
Mat
eri
als
Tele
com
mu
nic
atio
n S
ervi
ces
Uti
litie
s
Effe
ctiv
e C
ash
12
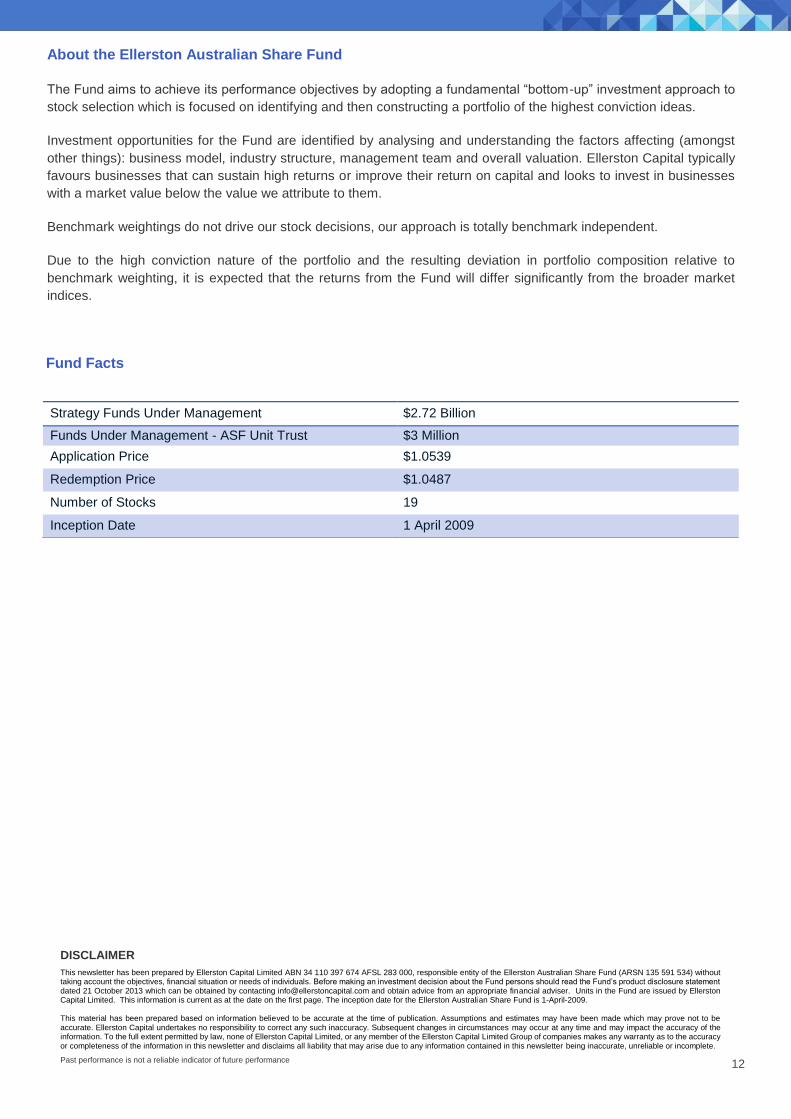
About the Ellerston Australian Share Fund
The Fund aims to achieve its performance objectives by adopting a fundamental “bottom-up” investment approach to
stock selection which is focused on identifying and then constructing a portfolio of the highest conviction ideas.
Investment opportunities for the Fund are identified by analysing and understanding the factors affecting (amongst
other things): business model, industry structure, management team and overall valuation. Ellerston Capital typically
favours businesses that can sustain high returns or improve their return on capital and looks to invest in businesses
with a market value below the value we attribute to them.
Benchmark weightings do not drive our stock decisions, our approach is totally benchmark independent.
Due to the high conviction nature of the portfolio and the resulting deviation in portfolio composition relative to
benchmark weighting, it is expected that the returns from the Fund will differ significantly from the broader market
indices.
Fund Facts
Strategy Funds Under Management $2.72 Billion
Funds Under Management - ASF Unit Trust $3 Million
Application Price $1.0539
Redemption Price $1.0487
Number of Stocks 19
Inception Date 1 April 2009
DISCLAIMER
This newsletter has been prepared by Ellerston Capital Limited ABN 34 110 397 674 AFSL 283 000, responsible entity of the Ellerston Australian Share Fund (ARSN 135 591 534) without taking account the objectives, financial situation or needs of individuals. Before making an investment decision about the Fund persons should read the Fund’s product disclosure statement dated 21 October 2013 which can be obtained by contacting [email protected] and obtain advice from an appropriate financial adviser. Units in the Fund are issued by Ellerston Capital Limited. This information is current as at the date on the first page. The inception date for the Ellerston Australian Share Fund is 1-April-2009. This material has been prepared based on information believed to be accurate at the time of publication. Assumptions and estimates may have been made which may prove not to be accurate. Ellerston Capital undertakes no responsibility to correct any such inaccuracy. Subsequent changes in circumstances may occur at any time and may impact the accuracy of the information. To the full extent permitted by law, none of Ellerston Capital Limited, or any member of the Ellerston Capital Limited Group of companies makes any warranty as to the accuracy or completeness of the information in this newsletter and disclaims all liability that may arise due to any information contained in this newsletter being inaccurate, unreliable or incomplete.
Past performance is not a reliable indicator of future performance