Elkhorn Slough TMRP: surface and subsurface and …Elkhorn Slough TMRP: surface and subsurface...
16
Subsurface properties and settlement potential at MHM 8/5/16 1 Elkhorn Slough TMRP: surface and subsurface properties and settlement potential at Minhoto and Hester Marsh Ivano W. Aiello Summary During the initial phase of the Elkhorn Slough Tidal Marsh Restoration Plan, about 45 acres of subsided marshes, intertidal mudflats and tidal channels at Minhoto and Hester Marsh (SA) will be restored to a ‘healthy’ elevation for marsh growth by sediment addition (the MHHW datum (1.76m or 5.8 ft NADV88). For the success of this restoration project it is essential that the final elevation (10+ years later) of the new marsh settle very close to the targeted elevation. However, adding sediments to an existing soil has mechanical and sedimentological implications that are dependent upon the thickness, extent and weight of sediment added, the relief of the area, the hydrology, and the geotechnical/physical characteristics and the thickness of compressible sediments that will be subjected to the increase in lithostatic stress caused by the overburden. Through a combination of field, analytical, and modeling exercises, this study addresses four main questions, which are critical to the success of the restoration project. Note that the values provided by the model are for the M2, M3 and H1 subareas (~27 acres fill area; ESA, 2014) of the MHM (~36.4 acres) and that the phase I restoration also includes M1 (an additional 9.5 acres): 1) What is the subsurface lithology/stratigraphy of MHM? Using a combination of sedimentological/physical properties analyses of core samples, field surveys using a modified dynamic cone penetrometer and available geotechnical reports and science literature, the subsurface of MHM can be described as a 4 layer system laying on a ‘basement’ which forms the bottom of the paleo-valley. From top to bottom: 1) a ‘slurry’ layer at the very top (~0-0.6m thick) that has high water content (>>~55%) and is above the Liquid Limit; this layer is thicker in lower relief habitats; 2) a ‘plastic’ layer (~0-0.6m thick) which is more cohesive and thicker in higher relief habitats; 3) a ‘stiff’ layer (~2m calculated thickness) which is the remnant of the previously dried marsh; 4) a normal consolidated layer which thickness is not known but was predicted using different modeling exercises. 2) What is the accommodation space currently occupied by the slurry? The MATLAB model created for this project calculates the volume of sediments needed to fill the elevation between the uppermost cohesive surface (top of the plastic layer) and the target elevation (MHHW) based on 136 sites surveyed with a modified penetrometer and a Terrestrial Laser Scanner and extrapolating the results to the SA. The total volume of accommodation space in SA, if the slurry layer was to be completely removed, is 23,375 m 3 (33,967 cy) (Table 1).
Transcript of Elkhorn Slough TMRP: surface and subsurface and …Elkhorn Slough TMRP: surface and subsurface...
Subsurface properties and settlement potential at MHM 8/5/16
1
Elkhorn Slough TMRP: surface and subsurface properties and settlement potential at Minhoto and Hester Marsh
Ivano W. Aiello
Summary
During the initial phase of the Elkhorn Slough Tidal Marsh Restoration Plan, about 45 acres of subsided marshes, intertidal mudflats and tidal channels at Minhoto and Hester Marsh (SA) will be restored to a ‘healthy’ elevation for marsh growth by sediment addition (the MHHW datum (1.76m or 5.8 ft NADV88). For the success of this restoration project it is essential that the final elevation (10+ years later) of the new marsh settle very close to the targeted elevation. However, adding sediments to an existing soil has mechanical and sedimentological implications that are dependent upon the thickness, extent and weight of sediment added, the relief of the area, the hydrology, and the geotechnical/physical characteristics and the thickness of compressible sediments that will be subjected to the increase in lithostatic stress caused by the overburden.
Through a combination of field, analytical, and modeling exercises, this study addresses four main questions, which are critical to the success of the restoration project. Note that the values provided by the model are for the M2, M3 and H1 subareas (~27 acres fill area; ESA, 2014) of the MHM (~36.4 acres) and that the phase I restoration also includes M1 (an additional 9.5 acres):
1) What is the subsurface lithology/stratigraphy of MHM?
Using a combination of sedimentological/physical properties analyses of core samples, field surveys using a modified dynamic cone penetrometer and available geotechnical reports and science literature, the subsurface of MHM can be described as a 4 layer system laying on a ‘basement’ which forms the bottom of the paleo-valley. From top to bottom: 1) a ‘slurry’ layer at the very top (~0-0.6m thick) that has high water content (>>~55%) and is above the Liquid Limit; this layer is thicker in lower relief habitats; 2) a ‘plastic’ layer (~0-0.6m thick) which is more cohesive and thicker in higher relief habitats; 3) a ‘stiff’ layer (~2m calculated thickness) which is the remnant of the previously dried marsh; 4) a normal consolidated layer which thickness is not known but was predicted using different modeling exercises.
2) What is the accommodation space currently occupied by the slurry?
The MATLAB model created for this project calculates the volume of sediments needed to fill the elevation between the uppermost cohesive surface (top of the plastic layer) and the target elevation (MHHW) based on 136 sites surveyed with a modified penetrometer and a Terrestrial Laser Scanner and extrapolating the results to the SA. The total volume of accommodation space in SA, if the slurry layer was to be completely removed, is 23,375 m3 (33,967 cy) (Table 1).
Subsurface properties and settlement potential at MHM 8/5/16
2
3) How much settlement will occur after the predicted volume of sediments is added?
The oedometric empirical calculations for the total settlement that will occur after the overburden layer is added depend on the geotechnical characteristics (e.g. Compressibility Index Cc, and the Initial void ratio e0) of the subsurface layers and their thickness. Note that for all the calculation done by the model the thickness of the overburden layer is calculated as the distance between the top of the plastic layer and the MHHW datum.
The geotechnical data available to calculate the settlement were limited and were based on the reports by ENGEO (2013) and Kleinfelder (2002) which analyzed boreholes at the nearby Parsons Bridge area. The Cc values reported by ENGEO were only for the uppermost layers and relative low, so the calculations for settlement presented in this memo are conservative (underestimates). Since the cores collected in the area are very shallow (max 4 m) the total thickness of compressible sediments above the ‘basement’ was modeled with MATLAB using and final target elevation of MHHW datum (1.76 m or 5.8 ft NADV88) and 3 different scenarios that describe different geometries: 1) ‘paleo-valley’, max thickness ~11m below the axis of the main channel; 2) ‘shallow bowl’, max thickness ~7.5 m below the axis of the main channel; 3) ‘shallow flat’, essentially a flat basement surface at a constant depth of 3m (Tables 1, 3 and 4). The average settlement of the 3 models is 21.15 cm and the average loss of volume for the SA is 15,170 m3 (19,720 cy).
What is the total volume of sediment that needs to be added to the surface to attain the target elevation.
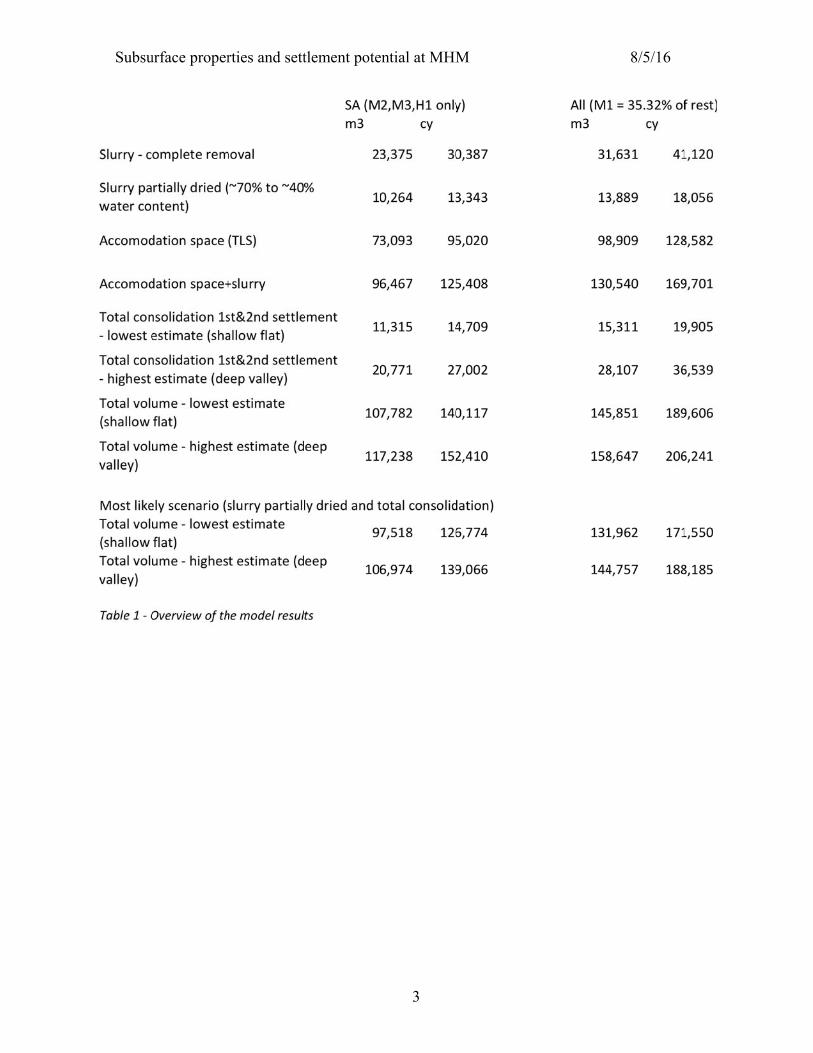
This is an iterative process, as the weight of additional overburden will cause additional consolidation of the underlying sediments. See Table 1 for the volume of sediment needed to reach a final target elevation of 1.76 m (5.8 ft) NAVD88 (including slurry and consolidation of underlying soils).
Adding the average settlement of the 3 models for the SA (15,170 m3 or 19,720 cy) to the volume of the slurry layer (23,375 m3) and the accommodation space between MHHW and the top of the slurry layer (73,093 m3) extrapolated from the TLS surveys we obtain a total of 111,638 m3 (145,129 cy), with values of 107,782 m3 (140,117 cy) and 117,238 m3 (152,410 cy) for the lowest and highest settlement estimate, respectively (Table 1).
The bottom of Table 1 also shows how the previous figures would change if the slurry layer is not removed and partially dried from ~70% to ~40% water content. Under this scenario, the slurry would turn into a more plastic layer with a volume of 10,264 m3 (13,424 cy) which can be then subtracted to the previous estimates.
Subsu
urface properrties and sett
tlement poteential at MHM
3
M 8/5/16
Subsu
Intro
This dsurface a(Figure 1modelingBridge si
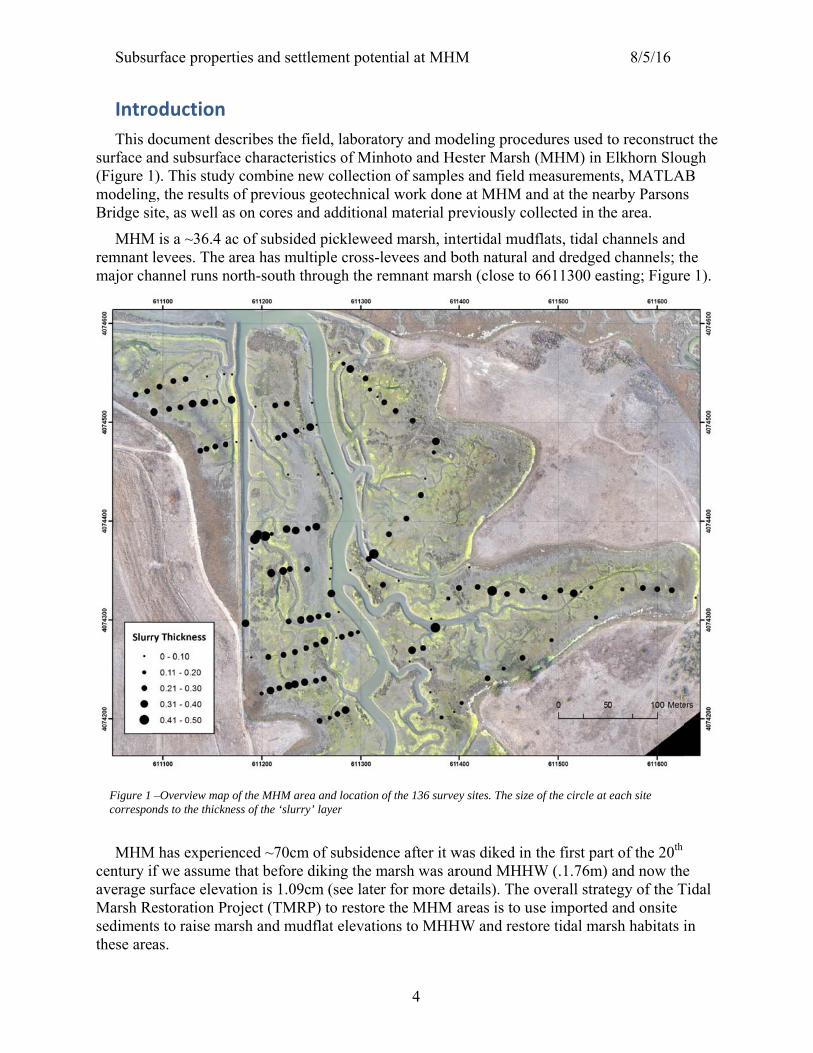
MHMremnant major ch
MHMcentury iaverage sMarsh Resedimentthese are
Figure 1 correspo
urface proper
oduction
document deand subsurfac1). This studyg, the resultsite, as well a
M is a ~36.4 alevees. The annel runs n
M has experief we assumesurface elevaestoration Prts to raise maas.
–Overview mapnds to the thickn
rties and sett
escribes the fce characteriy combine n
s of previousas on cores an
ac of subsidearea has mu
north-south th
enced ~70cme that before ation is 1.09roject (TMRarsh and mu
p of the MHM arness of the ‘slurr
tlement pote
field, laboratistics of Min
new collectios geotechnicand additiona
ed pickleweeultiple cross-lhrough the r
m of subsidendiking the mcm (see late
RP) to restoredflat elevati
rea and location ry’ layer
ential at MHM
4
tory and modnhoto and Heon of sampleal work doneal material pr
ed marsh, intlevees and bremnant mar
nce after it wmarsh was arr for more de the MHM ons to MHH
of the 136 surve
M
deling proceester Marsh
es and field me at MHM areviously co
ntertidal mudboth natural arsh (close to
was diked in round MHH
details). The areas is to u
HW and resto
ey sites. The size
edures used t(MHM) in E
measuremenand at the neaollected in th
dflats, tidal cand dredged6611300 ea
the first parHW (.1.76m)
overall stratuse imported ore tidal mar
e of the circle at
8/5/16
to reconstrucElkhorn Slou
nts, MATLAarby Parsons
he area.
channels andd channels; thasting; Figure
rt of the 20th
and now thetegy of the Tand onsite
rsh habitats i
each site
ct the ugh
AB s
d he e 1).
e Tidal
in
Subsu
For thnewly adan existinamount (geotechnsubjected
Subsu
The shusing dif(2013) fo
has virtuamore cohcharacterunderlaidlayer’ (Fibetween that compcolumn ‘unknownThe mod
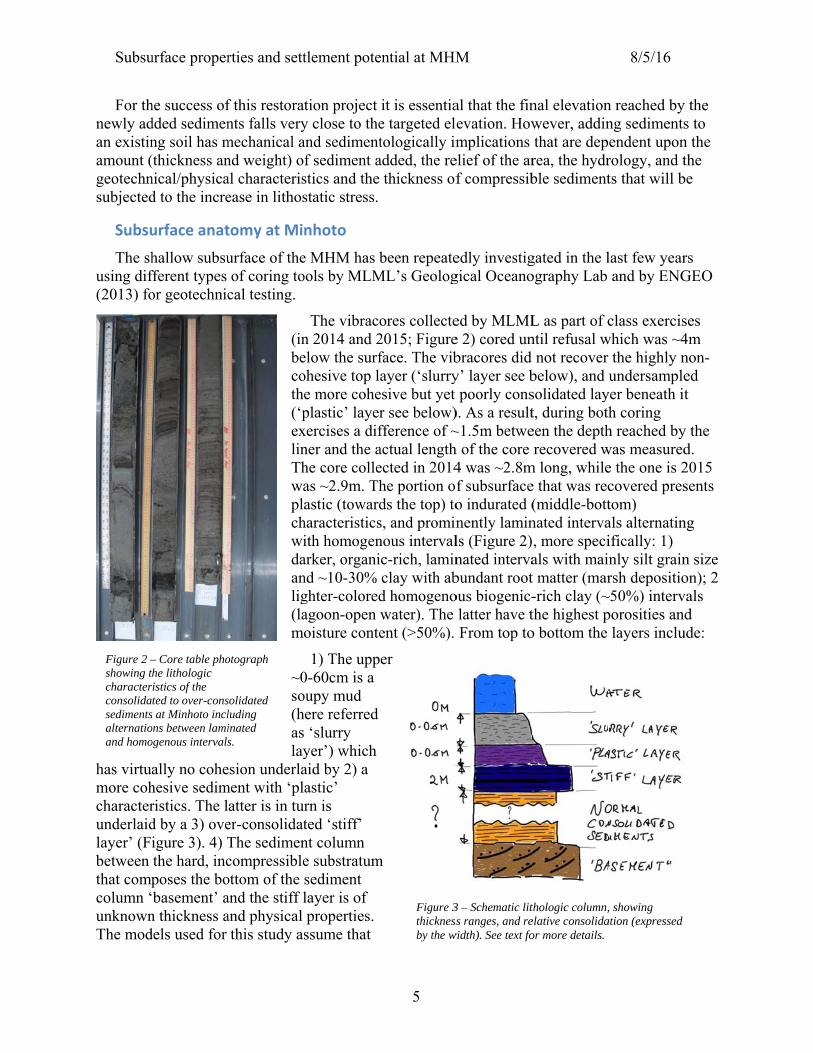
Figure 2 –showing thcharacterconsolidasedimentsalternatioand homo
urface proper
he success ofdded sedimenng soil has m(thickness annical/physicad to the incre
urface anat
hallow subsufferent types or geotechnic
ally no cohehesive sedimristics. The ld by a 3) oveigure 3). 4) Tthe hard, incposes the bobasement’ a
n thickness adels used for
– Core table phohe lithologic
ristics of the ted to over-cons
s at Minhoto inclons between lamiogenous intervals
rties and sett
f this restoratnts falls very
mechanical and weight) oal characterisease in lithos
tomy at Mi
urface of theof coring to
cal testing.
(inbecothe(‘pexlinThwaplachwidaanlig(lamo
~0so(haslay
esion underlament with ‘pl
atter is in turer-consolidatThe sedimencompressibleottom of the and the stiff land physical this study as
otograph
solidated luding inated s.
tlement pote
tion project y close to theand sedimentf sediment astics and the static stress.
nhoto
e MHM has bools by MLM
The vibracon 2014 and 2elow the surfohesive top le more coheplastic’ layerxercises a difner and the ahe core colleas ~2.9m. Thastic (toward
haracteristicsith homogenarker, organind ~10-30% ghter-coloredagoon-open woisture conte
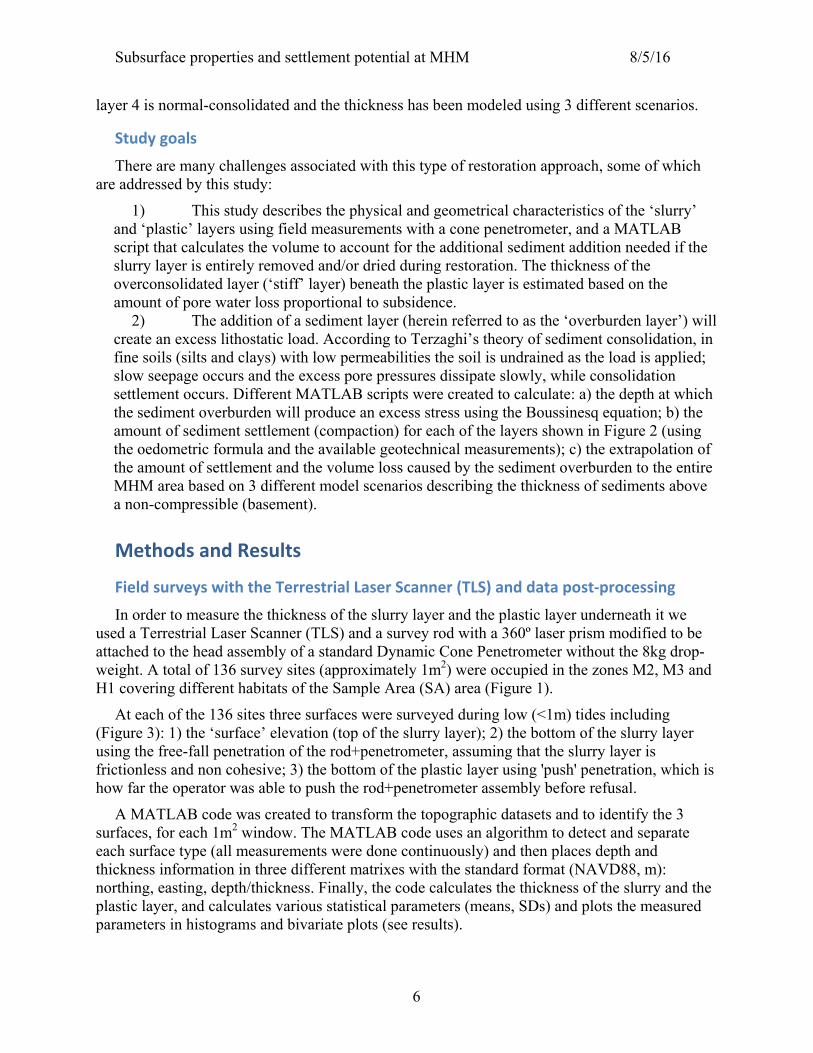
1) The upp0-60cm is a oupy mud here referred
‘slurry yer’) which aid by 2) a astic’ rn is ted ‘stiff’ nt column e substratumsediment layer is of properties. ssume that
ential at MHM
5
it is essentiae targeted eletologically imadded, the re
thickness of
been repeateML’s Geolog
ores collecte2015; Figureface. The vibayer (‘slurry
esive but yet r see below)fference of ~actual lengthected in 2014he portion ofds the top) tos, and prominnous intervalc-rich, laminclay with abd homogenowater). The ent (>50%).
er
m
Figure 3thicknessby the w
M
al that the finevation. Howmplications
elief of the arf compressib
edly investiggical Oceano
ed by MLMLe 2) cored unbracores did y’ layer see b
poorly cons). As a result~1.5m betweh of the core 4 was ~2.8mf subsurfaceo indurated (nently laminls (Figure 2)nated intervabundant rootous biogenic-
latter have tFrom top to
3 – Schematic lits ranges, and re
width). See text fo
nal elevationwever, addinthat are deprea, the hydrble sediment
gated in the lography Lab
L as part of cntil refusal w
not recover below), and solidated layt, during botheen the depthrecovered w
m long, whilee that was rec(middle-bottnated interva, more specials with mait matter (mar-rich clay (~the highest po bottom the
thologic column,elative consolidaor more details.
8/5/16
n reached byng sedimentsendent uponrology, and tts that will b
last few yearand by ENG
class exerciswhich was ~4
the highly nundersample
yer beneath ith coring h reached bywas measurede the one is 2covered prestom) als alternatinifically: 1) nly silt grainrsh depositio
~50%) intervporosities an
layers inclu
, showing ation (expressed
y the s to n the the
be
rs GEO
ses 4m non-ed t
y the d. 2015 sents
ng
n size on); 2 vals d
ude:
Subsurface properties and settlement potential at MHM 8/5/16
6
layer 4 is normal-consolidated and the thickness has been modeled using 3 different scenarios.
Study goals
There are many challenges associated with this type of restoration approach, some of which are addressed by this study:
1) This study describes the physical and geometrical characteristics of the ‘slurry’ and ‘plastic’ layers using field measurements with a cone penetrometer, and a MATLAB script that calculates the volume to account for the additional sediment addition needed if the slurry layer is entirely removed and/or dried during restoration. The thickness of the overconsolidated layer (‘stiff’ layer) beneath the plastic layer is estimated based on the amount of pore water loss proportional to subsidence.
2) The addition of a sediment layer (herein referred to as the ‘overburden layer’) will create an excess lithostatic load. According to Terzaghi’s theory of sediment consolidation, in fine soils (silts and clays) with low permeabilities the soil is undrained as the load is applied; slow seepage occurs and the excess pore pressures dissipate slowly, while consolidation settlement occurs. Different MATLAB scripts were created to calculate: a) the depth at which the sediment overburden will produce an excess stress using the Boussinesq equation; b) the amount of sediment settlement (compaction) for each of the layers shown in Figure 2 (using the oedometric formula and the available geotechnical measurements); c) the extrapolation of the amount of settlement and the volume loss caused by the sediment overburden to the entire MHM area based on 3 different model scenarios describing the thickness of sediments above a non-compressible (basement).
Methods and Results
Field surveys with the Terrestrial Laser Scanner (TLS) and data post‐processing
In order to measure the thickness of the slurry layer and the plastic layer underneath it we used a Terrestrial Laser Scanner (TLS) and a survey rod with a 360º laser prism modified to be attached to the head assembly of a standard Dynamic Cone Penetrometer without the 8kg drop-weight. A total of 136 survey sites (approximately 1m2) were occupied in the zones M2, M3 and H1 covering different habitats of the Sample Area (SA) area (Figure 1).
At each of the 136 sites three surfaces were surveyed during low (<1m) tides including (Figure 3): 1) the ‘surface’ elevation (top of the slurry layer); 2) the bottom of the slurry layer using the free-fall penetration of the rod+penetrometer, assuming that the slurry layer is frictionless and non cohesive; 3) the bottom of the plastic layer using 'push' penetration, which is how far the operator was able to push the rod+penetrometer assembly before refusal.
A MATLAB code was created to transform the topographic datasets and to identify the 3 surfaces, for each 1m2 window. The MATLAB code uses an algorithm to detect and separate each surface type (all measurements were done continuously) and then places depth and thickness information in three different matrixes with the standard format (NAVD88, m): northing, easting, depth/thickness. Finally, the code calculates the thickness of the slurry and the plastic layer, and calculates various statistical parameters (means, SDs) and plots the measured parameters in histograms and bivariate plots (see results).
Subsu
Sample
To obsurface (tsamples wsizes.
MoistMoist
are showand ~80%and ~60%
the PL ra
Hencesamples twhile the
Partic
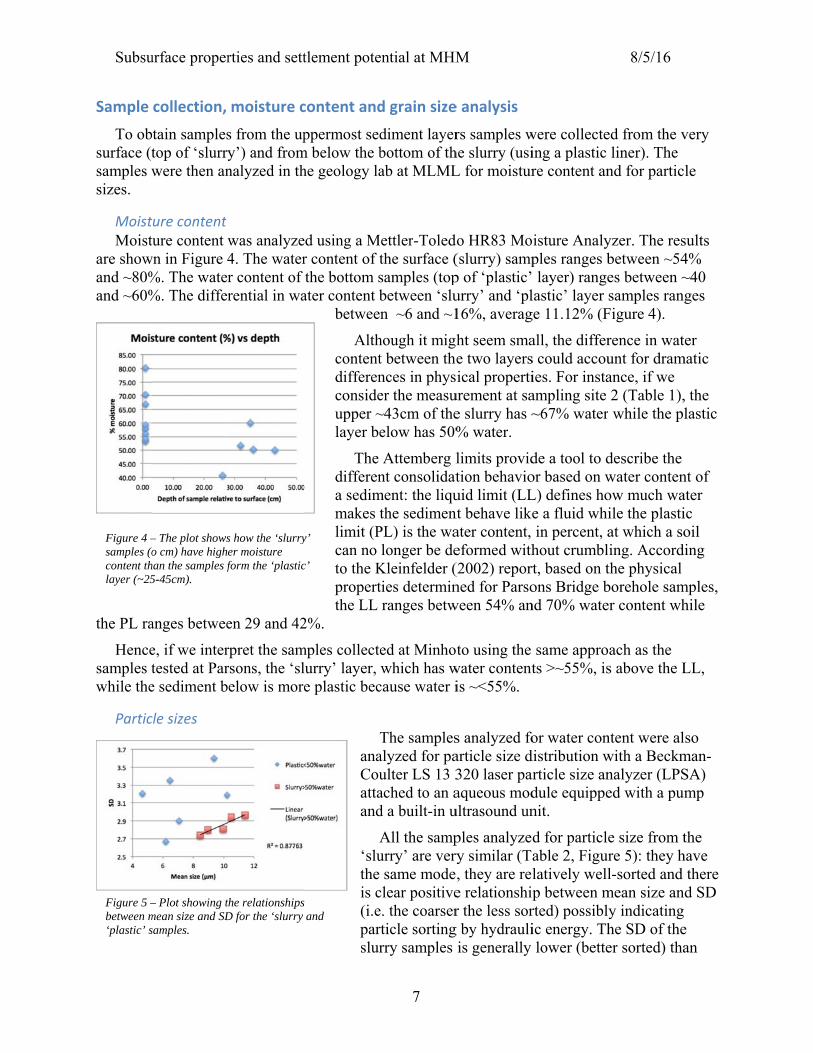
Figure 4 –samples (ocontent thlayer (~25
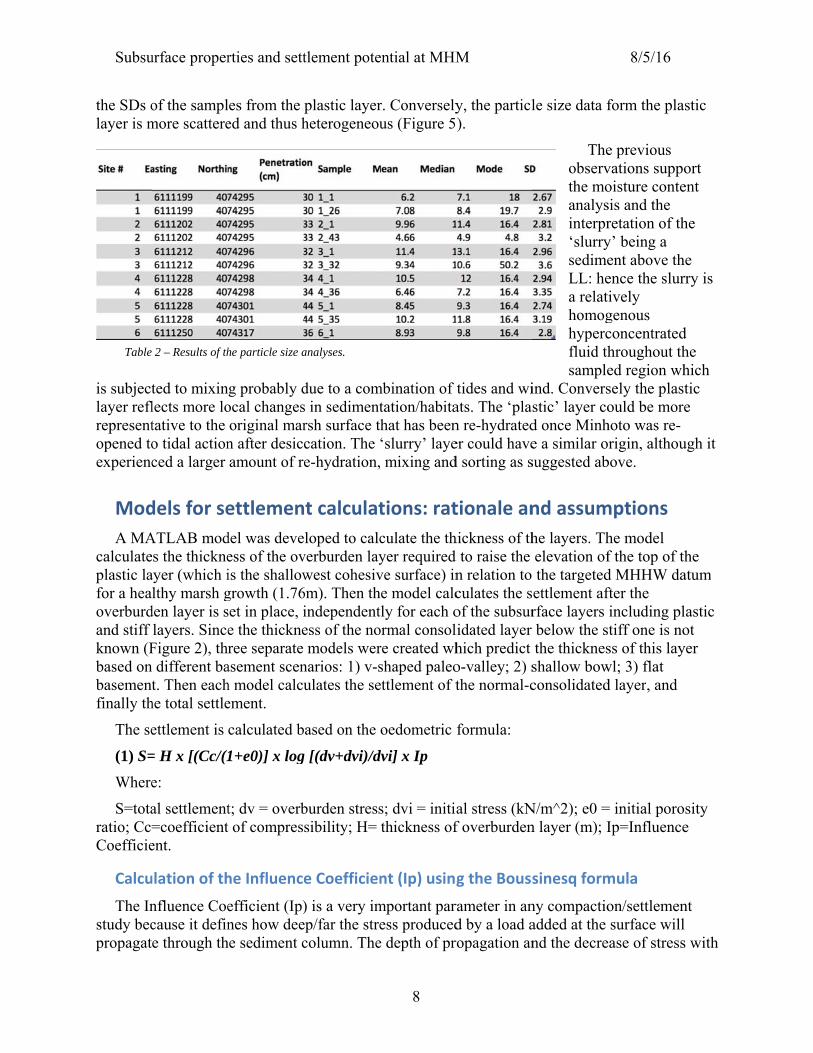
Figure 5 –between m‘plastic’ s
urface proper
collection,
tain samplestop of ‘slurrywere then an
ture content ture content w
wn in Figure 4%. The water%. The differ
anges betwee
e, if we intertested at Pare sediment b
cle sizes
– The plot shows(o cm) have highehan the samples f5-45cm).
– Plot showing tmean size and SDsamples.
rties and sett
moisture c
s from the upy’) and fromnalyzed in th
was analyze4. The waterr content of rential in wa
en 29 and 42
rpret the samrsons, the ‘slelow is more
s how the ‘slurryer moisture form the ‘plastic
the relationshipsD for the ‘slurry
tlement pote
content and
ppermost sedm below the bhe geology la
ed using a Mr content of tthe bottom s
ater content bbetwee
Althcontentdifferenconsideupper ~layer be
The differena sedimmakes tlimit (Pcan no to the Kpropertthe LL
2%.
mples collectelurry’ layer,e plastic bec
TanaCouattaand
A‘sluthe is c(i.eparslur
y’
c’
s and
ential at MHM
7
d grain size
diment layerbottom of thab at MLML
ettler-Toledthe surface (samples (topbetween ‘slun ~6 and ~1
hough it might between thences in physer the measu~43cm of theelow has 50%
Attemberg lnt consolidat
ment: the liquthe sedimen
PL) is the walonger be de
Kleinfelder (ties determinranges betw
ed at Minhowhich has w
cause water i
The samplesalyzed for paulter LS 13 3ached to an ad a built-in u
All the sampurry’ are verysame mode
clear positivee. the coarserrticle sorting rry samples
M
e analysis
rs samples whe slurry (usiL for moistur
do HR83 Mo(slurry) sampp of ‘plastic’urry’ and ‘pl16%, averag
ht seem smae two layersical properti
urement at sae slurry has ~% water.
limits providtion behaviouid limit (LL
nt behave likeater content, eformed with(2002) reportned for Parso
ween 54% an
to using the water contentis ~<55%.
s analyzed foarticle size d320 laser paraqueous modultrasound un
ples analyzery similar (Ta, they are rele relationshipr the less sor
g by hydrauliis generally
were collecteing a plastic re content an
isture Analyples ranges b layer) range
lastic’ layer ge 11.12% (F
all, the differs could accouies. For instaampling site ~67% water
de a tool to dor based on wL) defines hoe a fluid whiin percent, a
hout crumblrt, based on tons Bridge bnd 70% wate
same approts >~55%, is
or water condistribution warticle size andule equippenit.
d for particleable 2, Figurlatively wellp between mrted) possiblyic energy. Thlower (bette
8/5/16
ed from the vliner). The
nd for partic
yzer. The resbetween ~54es between ~samples rang
Figure 4).
rence in watunt for dramance, if we 2 (Table 1),
r while the pl
describe the water contenow much waile the plastiat which a soing. Accordthe physical borehole samer content wh
ach as the s above the L
ntent were alwith a Beckmnalyzer (LPSed with a pum
e size from tre 5): they hl-sorted and
mean size any indicating he SD of theer sorted) tha
very
le
sults 4% ~40 ges
er matic
, the lastic
nt of ater ic oil ing
mples, hile
LL,
so man-SA) mp
the have
there d SD
e an
Subsu
the SDs olayer is m
is subjectlayer reflrepresentopened toexperienc
Mod
A MAcalculateplastic lafor a heaoverburdand stiff known (Fbased onbasementfinally th
The se
(1) S=
Where
S=totaratio; Cc=Coefficie
Calcu
The Instudy becpropagat
Table
urface proper
of the samplmore scattere
ted to mixinlects more lotative to the o tidal actionced a larger
dels for se
ATLAB mods the thickne
ayer (which ilthy marsh g
den layer is slayers. Since
Figure 2), thr different bat. Then each
he total settle
ettlement is
= H x [(Cc/(1
e:
al settlement=coefficientent.
ulation of th
nfluence Coecause it define through th
2 – Results of th
rties and sett
les from the ed and thus h
g probably docal changesoriginal marn after desiccamount of re
ettlemen
del was deveess of the ovis the shallowgrowth (1.76set in place, ie the thickneree separate
asement scenh model calcuement.
calculated b
1+e0)] x log
t; dv = overbt of compres
he Influence
efficient (Ip)nes how dee
he sediment c
he particle size a
tlement pote
plastic layerheterogeneou
due to a coms in sedimentrsh surface tcation. The e-hydration,
t calculat
loped to calcverburden laywest cohesiv6m). Then thindependentess of the nomodels wer
narios: 1) v-sulates the se
ased on the
g [(dv+dvi)/d
burden stresssibility; H=
e Coefficien
) is a very imep/far the strecolumn. The
analyses.
ential at MHM
8
r. Converselyus (Figure 5
mbination of tation/habitahat has been‘slurry’ laye mixing and
tions: rat
culate the thyer required ve surface) inhe model calctly for each oormal consolre created whshaped paleoettlement of t
oedometric
dvi] x Ip
s; dvi = initiathickness of
nt (Ip) using
mportant paress produced
e depth of pr
M
y, the particl).
tides and wiats. The ‘plan re-hydrateder could haved sorting as s
tionale an
hickness of thd to raise the n relation to culates the sof the subsurlidated layer hich predict o-valley; 2) sthe normal-c
formula:
al stress (kNf overburden
g the Bouss
rameter in and by a load aropagation an
le size data f
Theobservthe moanalysinterpr‘slurrysedimeLL: hea relatihomoghypercfluid thsample
ind. Conversstic’ layer cod once Minhe a similar osuggested ab
nd assum
he layers. Thelevation of the targetedettlement afrface layers below the sthe thicknesshallow bowconsolidated
N/m^2); e0 =n layer (m); I
sinesq form
ny compactioadded at the nd the decre
8/5/16
form the pla
e previous vations suppooisture contesis and the retation of thy’ being a ent above thence the slurively genous concentratedhroughout thed region whsely the plastould be more
hoto was re-rigin, althou
bove.
mptions
he model f the top of thd MHHW dafter the including pltiff one is noss of this lay
wl; 3) flat d layer, and
= initial poroIp=Influence
mula
on/settlemensurface willase of stress
stic
ort ent
he
he rry is
d he hich tic e
ugh it
he atum
lastic ot
yer
sity e
nt l s with
Subsu
depth areshape of
Ip can
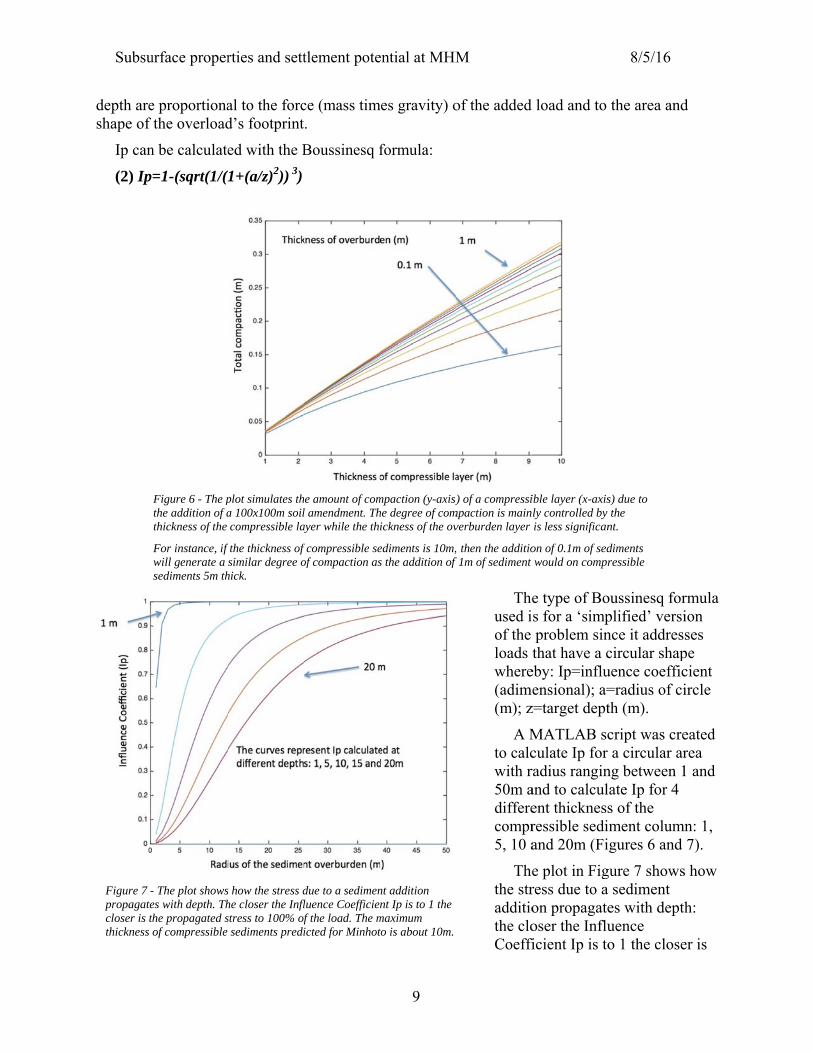
(2) Ip
Figure 7 -propagatecloser is tthickness
urface proper
e proportionathe overload
n be calculate
=1-(sqrt(1/(1
- The plot showses with depth. Ththe propagated sof compressible
Figure 6 - The pthe addition of athickness of the
For instance, if will generate a ssediments 5m th
rties and sett
al to the forcd’s footprint
ed with the B
(1+(a/z)2)) 3)
s how the stress dhe closer the Inflstress to 100% of
sediments predi
plot simulates tha 100x100m soilcompressible la
f the thickness of similar degree o
hick.
tlement pote
ce (mass tim.
Boussinesq f
due to a sedimenfluence Coefficienf the load. The micted for Minhot
e amount of coml amendment. Thayer while the thi
f compressible seof compaction as
ential at MHM
9
mes gravity) o
formula:
nt addition nt Ip is to 1 the
maximum to is about 10m.
mpaction (y-axis)he degree of comickness of the ov
ediments is 10m,s the addition of
M
of the added
Theused iof the loads twhere(adime(m); z
A Mto calcwith r50m adifferecompr5, 10 a
Thethe stradditiothe cloCoeffi
) of a compressimpaction is mainverburden layer
then the additiof 1m of sediment
load and to
e type of Bos for a ‘simpproblem sinthat have a c
eby: Ip=influensional); a=
z=target dept
MATLAB scculate Ip for radius ranginand to calculent thicknessressible sediand 20m (Fi
e plot in Figress due to a on propagateoser the Influ
ficient Ip is to
ible layer (x-axisly controlled by is less significan
on of 0.1m of sedwould on compr
8/5/16
the area and
oussinesq forplified’ versince it addrescircular shapuence coeffic=radius of cith (m).
cript was crea circular ar
ng between 1ate Ip for 4 s of the ment columgures 6 and
gure 7 showssediment
es with depthuence o 1 the close
s) due to the
nt.
diments ressible
d
rmula ion ses
pe cient ircle
eated rea 1 and
mn: 1, 7).
s how
h:
er is
Subsu
Coeff
The corepresentsedimente0, is the compressas pore wwill stay
The Cthe sampthe stiff lcombininKleinfeldbetween follow an
‘Slurrrather thaoedometrthe targetif the moand cohe
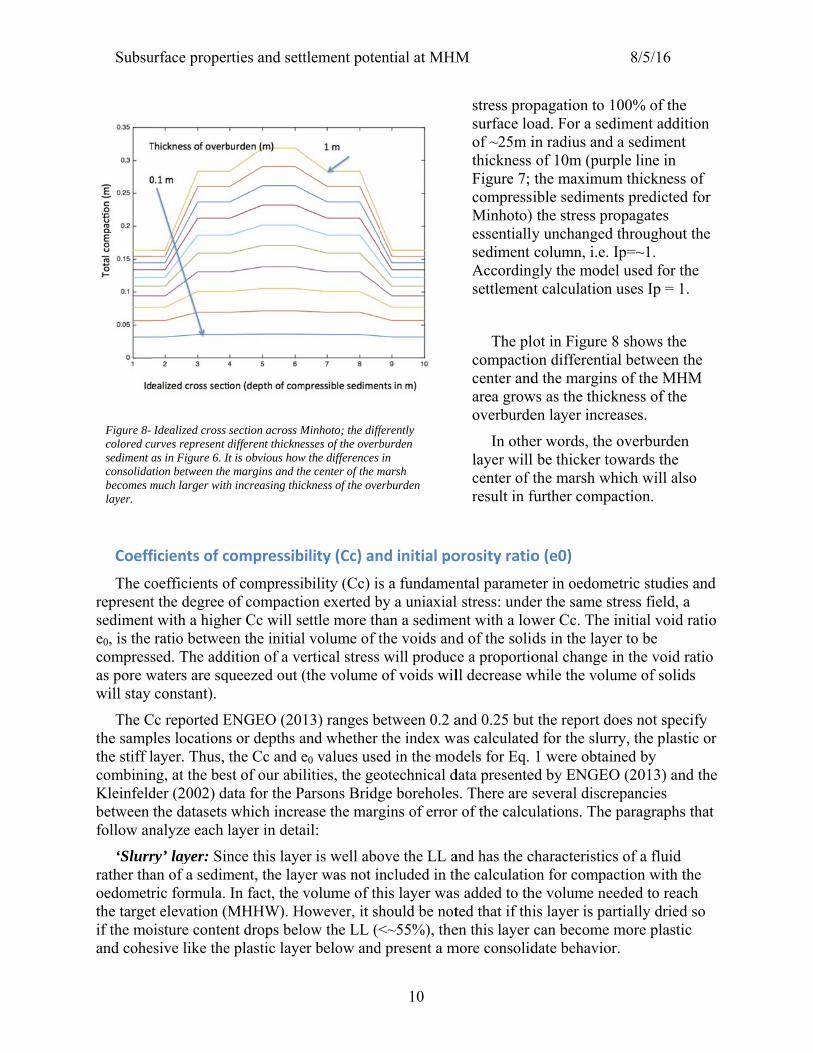
Figure 8- colored cusediment aconsolidabecomes mlayer.
urface proper
ficients of c
oefficients ot the degree t with a highratio betwee
sed. The addwaters are sq
constant).
Cc reported Eples locationslayer. Thus, ng, at the besder (2002) dathe datasets
nalyze each l
ry’ layer: Sinan of a sedimric formula. t elevation (M
oisture contenesive like the
Idealized cross urves represent das in Figure 6. Ition between themuch larger with
rties and sett
compressib
of compressibof compacti
her Cc will seen the initialdition of a vequeezed out (
ENGEO (201s or depths athe Cc and est of our abilata for the Pwhich increlayer in deta
nce this layement, the layIn fact, the vMHHW). Hnt drops belo
e plastic laye
section across Mdifferent thickne
It is obvious howe margins and thh increasing thic
tlement pote
ility (Cc) an
bility (Cc) ison exerted bettle more thl volume of tertical stress (the volume
13) ranges band whether e0 values uselities, the gearsons Bridg
ease the margail:
er is well aboyer was not involume of thowever, it show the LL (<er below and
Minhoto; the diffesses of the overbw the differences he center of the mckness of the ove
ential at MHM
10
nd initial po
s a fundamenby a uniaxialhan a sedimethe voids andwill producof voids wil
etween 0.2 athe index w
ed in the modotechnical dge boreholesgins of error
ove the LL ancluded in thhis layer washould be not<~55%), the
d present a m
ferently burden in
marsh erburden
M
stress prosurface loof ~25m ithickness Figure 7; compressMinhoto)essentiallysediment Accordingsettlemen
The plcompactiocenter andarea growoverburde
In othelayer willcenter of result in f
orosity ratio
ntal parametl stress: undeent with a lowd of the solid
ce a proportioll decrease w
and 0.25 butas calculateddels for Eq.
data presentes. There are sr of the calcu
and has the che calculatios added to thted that if thien this layer
more consolid
opagation to oad. For a sein radius andof 10m (purthe maximuible sedimen the stress pry unchangedcolumn, i.e.gly the mod
nt calculation
lot in Figure on differentid the margin
ws as the thicen layer incr
er words, thel be thicker tthe marsh w
further comp
o (e0)
ter in oedomer the same swer Cc. Theds in the layonal change
while the vol
t the report dd for the slur1 were obta
ed by ENGEseveral discrulations. The
characteristicon for compahe volume neis layer is pacan becomedate behavio
8/5/16
100% of thediment additd a sedimentrple line in
um thicknessnts predictedropagates d throughout Ip=~1. el used for thn uses Ip = 1
8 shows theial between tns of the MHckness of thereases.
e overburdentowards the
which will alspaction.
metric studiesstress field, ae initial void yer to be
in the void rlume of solid
does not specrry, the plast
ained by O (2013) anrepancies e paragraphs
cs of a fluid action with teeded to reacartially driede more plastior.
e tion t
s of d for
t the
he .
e the
HM e
n
so
s and a ratio
ratio ds
cify tic or
nd the
s that
the ch d so ic
Subsurface properties and settlement potential at MHM 8/5/16
11
The volume of the slurry layer calculated by the model for the 136 sites is 29.09 m3, which extrapolated to the SA covered by M2, M3 and H1 is 23,375m3 (33,967 cy) (Table 3). If the slurry layer is not removed and partially dewatered from ~70% to ~40% water content (which would turn the slurry into a more plastic sediment) the volume would become 10,264 m3 (13,343 cy).
‘Plastic’ layer: In the ENGEO (2013) report, this layer is described either: 1) as ‘very soft highly organic clay’ (sample S1@1’-2’ at 1.75 feet), with a moisture content 94.4%, e0=2.636, porosity=~72%; 2) as ‘very soft with visible water’ (sample S3@3’-4.5’ at 4. 5 feet, which is the deepest sample that they have analyzed), with a moisture content 82.7%, e0=2.242, porosity=~69%. If this layer of plastic clay is correlated to Kleinfelder’s (2002) shallowest sample (B-1, 13.0 feet) the compression ratio would be Cc/1+e0 = 0.235. Hence, if we calculate the Compressibility Index Cc for sample B-1 using the value of e0 from the two ENGEO samples we would obtain values for Cc between 0.615 and 0.761 which would result in almost three times more compressible than Cc=2.5 reported by ENGEO. Note that using Kleinfelder’s rather than ENGEO’s Cc values would significantly affect the settlement and volume loss calculations (up to ~3 times larger).
‘Stiff’ layer: Although not clearly explained in the ENGEO’s report, sample S2@0-24” at 1.67 feet (silty, clayey SAND and that has a e0=0.667, and 22.4% moisture), could have been collected from the ‘stiff’ layer since it is much drier than any other sample analyzed. Since the compressibility of this layer is 1 order of magnitude smaller than normal consolidated sediments and to simplify the calculations, the model used here approximates this layer to incompressible.
Normal consolidated layer: this layer, which likely represents the bulk of the sediment between the ‘basement’ and the bottom of the stiff layer, is the least known amongst the layers that make up the sediment column at MHM. Although there is no direct geotechnical information from this depth, the model considers this layer as normal-consolidated and based on the analogy with the ENGEO samples, the value chosen is Cc=2.5 as for the plastic layer.
In conclusion, given the lack of information on the Compressibility Indexes for the different layers at MHM, the model assumes the most conservative and lowest values (i.e. the settlement could be much higher) for both the plastic and normal consolidated layers (Cc=2.5) and no compression for the stiff layer.
To calculate the stress (kN/m2) generated by the overburden layer the model uses the density value for dry clay or=1600 (kg/m3);
Calculation of the thickness of the ‘slurry’ and the plastic layers
‘Slurry’ layer The ‘slurry’ layer is the layer of non-consolidated material ~>55% water content and above
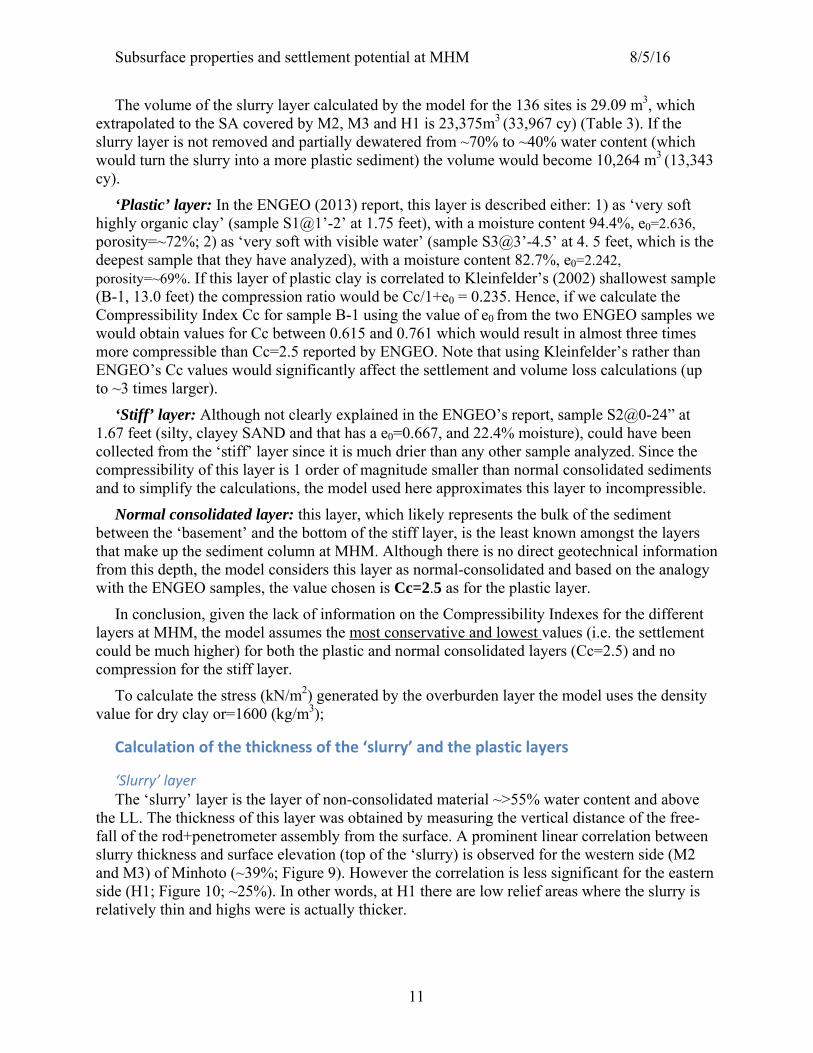
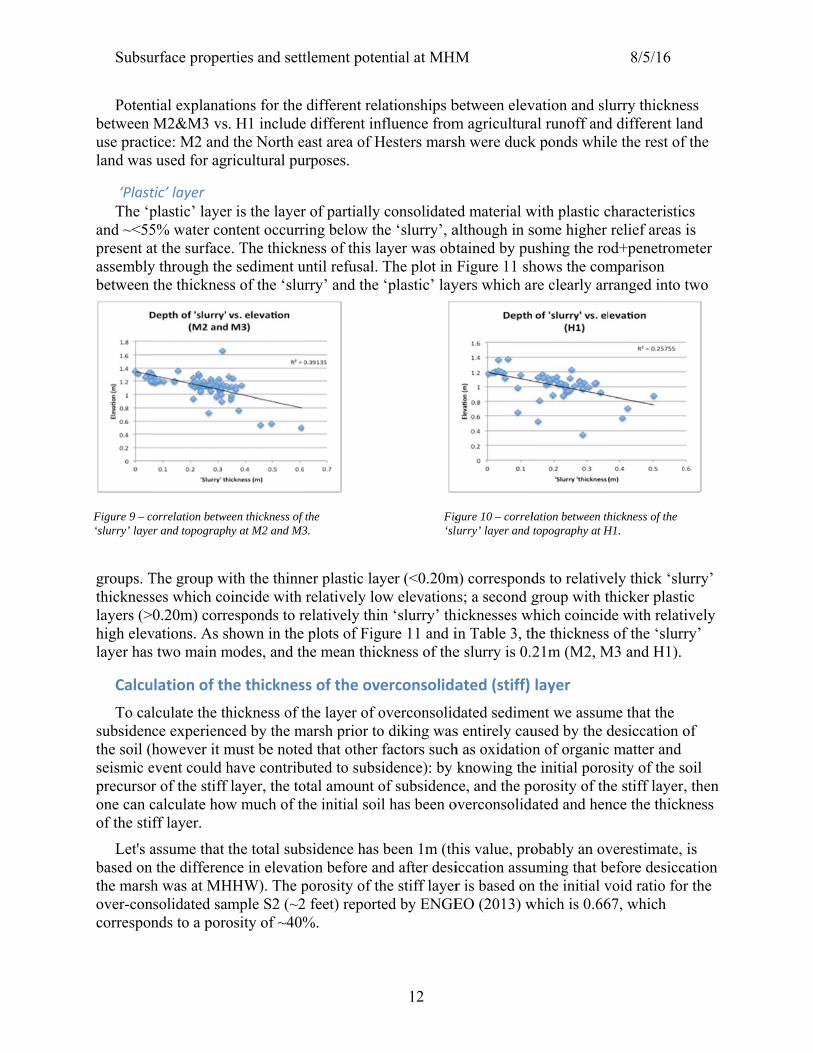
the LL. The thickness of this layer was obtained by measuring the vertical distance of the free-fall of the rod+penetrometer assembly from the surface. A prominent linear correlation between slurry thickness and surface elevation (top of the ‘slurry) is observed for the western side (M2 and M3) of Minhoto (~39%; Figure 9). However the correlation is less significant for the eastern side (H1; Figure 10; ~25%). In other words, at H1 there are low relief areas where the slurry is relatively thin and highs were is actually thicker.
Subsu
Potentbetween use practland was
‘PlastThe ‘p
and ~<55present aassemblybetween
groups. Tthicknesslayers (>high elevlayer has
Calcu
To calsubsidenthe soil (hseismic eprecursorone can cof the sti
Let's abased onthe marshover-concorrespon
Figure 9 – c‘slurry’ laye
urface proper
tial explanatM2&M3 vs
tice: M2 and used for agr
tic’ layer plastic’ layer5% water coat the surfacey through thethe thicknes
The group wses which co0.20m) corr
vations. As ss two main m
ulation of th
lculate the thce experienchowever it m
event could hr of the stiff calculate howff layer.
assume that the differenh was at MH
nsolidated samnds to a poro
orrelation betweer and topograph
rties and sett
tions for the . H1 include
d the North ericultural pu
r is the layerntent occurr
e. The thickne sediment uss of the ‘slu
with the thinnoincide with esponds to rhown in the
modes, and th
he thicknes
hickness of tced by the mmust be notehave contriblayer, the to
w much of th
the total subnce in elevatiHHW). The pmple S2 (~2osity of ~40%
een thickness of hy at M2 and M3
tlement pote
different rele different ineast area of Hurposes.
r of partially ring below thness of this launtil refusal. urry’ and the
ner plastic layrelatively lo
relatively thiplots of Fig
he mean thic
ss of the ov
the layer of omarsh prior toed that other uted to subs
otal amount ohe initial soi
bsidence has ion before anporosity of th2 feet) report%.
f the 3.
ential at MHM
12
lationships bnfluence fromHesters mars
consolidatehe ‘slurry’, aayer was obtThe plot in ‘plastic’ lay
yer (<0.20mow elevationn ‘slurry’ th
gure 11 and ickness of the
erconsolida
overconsolido diking wasfactors such
sidence): byof subsidencil has been o
been 1m (thnd after desihe stiff layerted by ENGE
Fig‘sl
M
between elevm agriculturash were duck
ed material walthough in stained by puFigure 11 sh
yers which ar
m) correspondns; a second ghicknesses win Table 3, the slurry is 0.2
ated (stiff)
dated sedimes entirely cauh as oxidationknowing the
ce, and the poverconsolida
his value, proiccation assur is based onEO (2013) w
gure 10 – correllurry’ layer and
vation and slal runoff andk ponds whil
with plastic csome higher ushing the rohows the comre clearly arr
ds to relativegroup with t
which coincidhe thickness21m (M2, M
layer
ent we assumused by the dn of organice initial poroorosity of thated and hen
obably an ovuming that bn the initial vwhich is 0.66
lation between thtopography at H
8/5/16
lurry thickned different lale the rest of
characteristicrelief areas
od+penetrommparison ranged into
ely thick ‘sluthicker plastide with relatis of the ‘slurrM3 and H1).
me that the desiccation o
c matter and osity of the she stiff layer,nce the thick
verestimate,efore desicc
void ratio for67, which
hickness of the H1.
ess and f the
cs is
meter
two
urry’ ic ively ry’
of
soil , then
kness
is cation r the
Subsu
Then the porosis 2.636, before an
Hencemeters, wwill requbecome a
In consedimentrealistic n
Tota
As shoEq. 1) is Figure 6)in the oedthicknesshypothetexample
For eawere calc
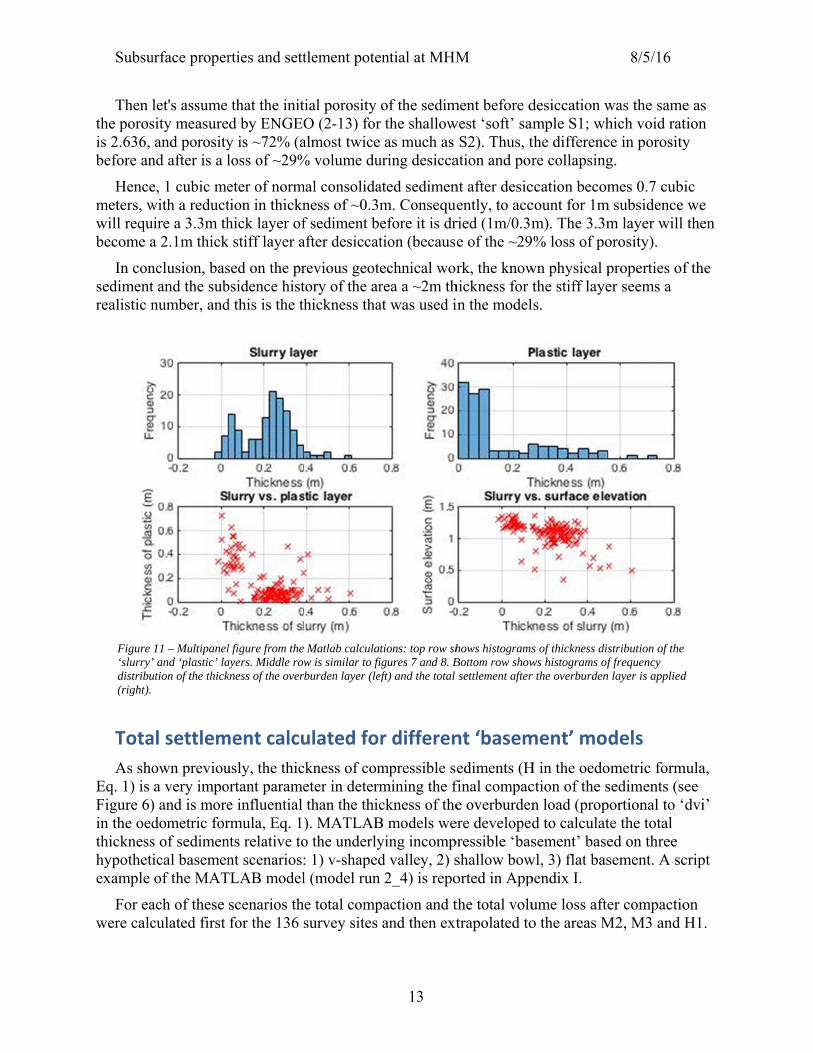
Figure ‘slurrydistribu(right).
urface proper
let's assume sity measureand porosity
nd after is a l
e, 1 cubic mewith a reductuire a 3.3m tha 2.1m thick
nclusion, bast and the subnumber, and
al settlem
own previoua very impo
) and is moredometric fors of sedimenical basemenof the MAT
ach of these culated first
11 – Multipanel’ and ‘plastic’ laution of the thick
rties and sett
that the initd by ENGEOy is ~72% (aloss of ~29%
eter of normtion in thicknhick layer of
k stiff layer a
sed on the prbsidence histd this is the th
ment calcu
usly, the thicortant paramee influential rmula, Eq. 1)nts relative tont scenarios:
TLAB model
scenarios thfor the 136 s
l figure from the ayers. Middle rowkness of the over
tlement pote
ial porosity O (2-13) foralmost twice% volume du
mal consolidaness of ~0.3mf sediment beafter desiccat
revious geotetory of the arhickness tha
ulated fo
ckness of cometer in determthan the thic). MATLABo the underly: 1) v-shapedl (model run
e total compsurvey sites
Matlab calculaw is similar to fiburden layer (lef
ential at MHM
13
of the sedimr the shallow as much as
uring desicca
ated sedimenm. Consequeefore it is drtion (becaus
echnical worrea a ~2m that was used i
r differen
mpressible smining the fckness of the
B models weying incompd valley, 2) s2_4) is repo
paction and tand then ext
tions: top row shigures 7 and 8. Beft) and the total
M
ment before dwest ‘soft’ sam
S2). Thus, tation and por
nt after desicently, to accried (1m/0.3me of the ~29
rk, the knowhickness for tin the model
nt ‘basem
ediments (Hfinal compace overburden
ere developedpressible ‘basshallow boworted in App
the total volutrapolated to
hows histogramsBottom row showsettlement after
desiccation wample S1; whthe differencre collapsing
ccation becomcount for 1mm). The 3.3m% loss of po
wn physical pthe stiff laye
ls.
ment’ mod
H in the oedoction of the sn load (propd to calculatsement’ base
wl, 3) flat baspendix I.
ume loss afteo the areas M
s of thickness disws histograms ofr the overburden
8/5/16
was the samehich void ratce in porosityg.
mes 0.7 cubim subsidence
m layer will orosity).
properties ofer seems a
dels
ometric formsediments (sportional to ‘te the total ed on three sement. A sc
er compactioM2, M3 and H
stribution of the f frequency layer is applied
e as tion y
ic we then
f the
mula, ee dvi’
cript
on H1.
d
Subsu
Restoraticalculatio
To extH1) we uRestorati3), whichthat the ~accommoslightly hto the ent
Our causing thethe MATrepresentthus are rincludes M1 comp
Calcu
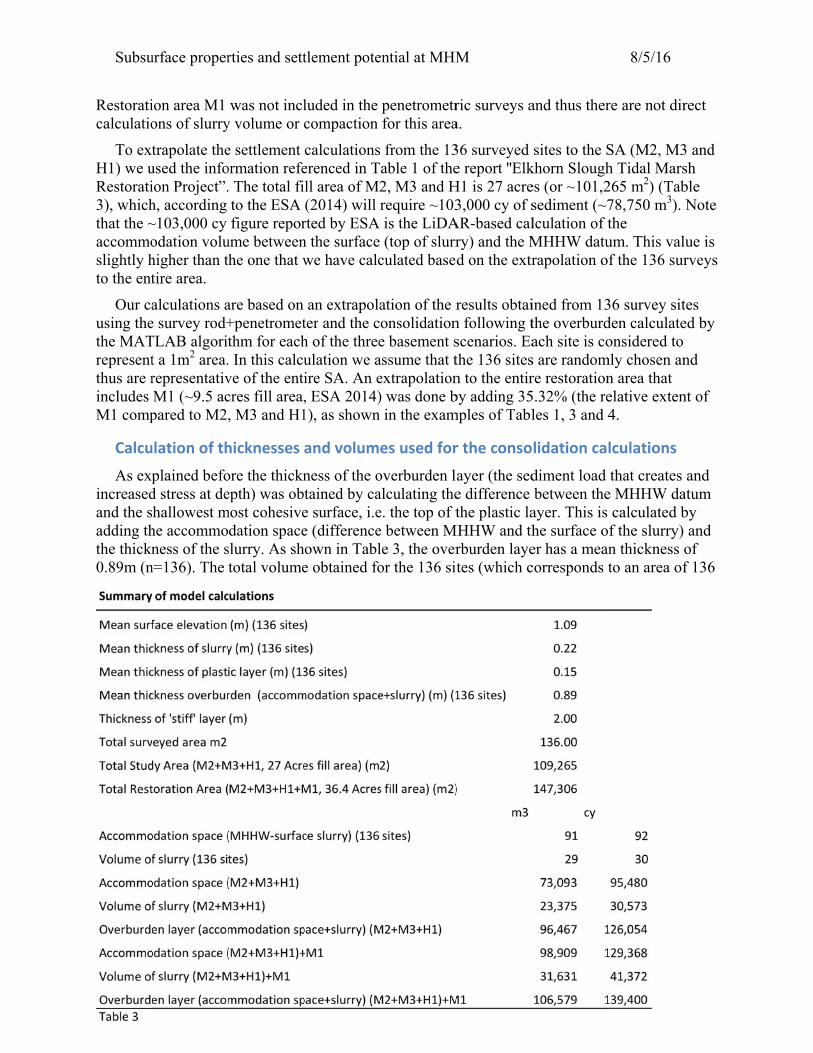
As expincreasedand the sadding ththe thickn0.89m (n
urface proper
ion area M1 ons of slurry
trapolate theused the infoion Project”.h, according ~103,000 cy odation voluhigher than ttire area.
alculations ae survey rod+TLAB algoritt a 1m2 area.representativM1 (~9.5 acpared to M2
ulation of th
plained befod stress at dehallowest m
he accommoness of the s
n=136). The
rties and sett
was not incly volume or c
e settlement ormation refe. The total fito the ESA figure repor
ume betweenthe one that w
are based on +penetrometthm for each. In this calcuve of the enticres fill area,, M3 and H1
hicknesses
ore the thicknepth) was ob
most cohesivedation space
slurry. As shtotal volume
tlement pote
luded in the compaction
calculationserenced in Tll area of M2(2014) will rrted by ESA n the surface we have calc
an extrapolater and the ch of the threeulation we aire SA. An e, ESA 2014)1), as shown
and volum
ness of the otained by cae surface, i.ee (differenceown in Table obtained fo
ential at MHM
14
penetrometrfor this area
from the 13able 1 of the2, M3 and Hrequire ~103is the LiDA(top of slurr
culated base
ation of the ronsolidatione basement sassume that textrapolation) was done bin the exam
es used for
overburden lalculating thee. the top of te between Mle 3, the overor the 136 sit
M
ric surveys aa.
36 surveyed e report ''Elk
H1 is 27 acre3,000 cy of s
AR-based calry) and the Md on the extr
results obtain following tscenarios. Eathe 136 sitesn to the entirby adding 35mples of Tabl
r the conso
ayer (the sede difference the plastic la
MHHW and thrburden layetes (which c
and thus ther
sites to the Skhorn Sloughes (or ~101,2sediment (~7lculation of tMHHW daturapolation o
ined from 13the overburdach site is cos are randomre restoration5.32% (the reles 1, 3 and 4
lidation ca
diment load between the
ayer. This is he surface oer has a meancorresponds t
8/5/16
re are not dir
SA (M2, M3h Tidal Mars265 m2) (Tab78,750 m3).the um. This valf the 136 sur
36 survey sitden calculateonsidered to
mly chosen ann area that elative exten4.
lculations
that creates e MHHW da
calculated bf the slurry) n thickness oto an area of
rect
3 and sh ble Note
lue is rveys
tes ed by
nd
nt of
and atum by and
of f 136
Subsu
m2) is ~1each volu803. A fuadding 3
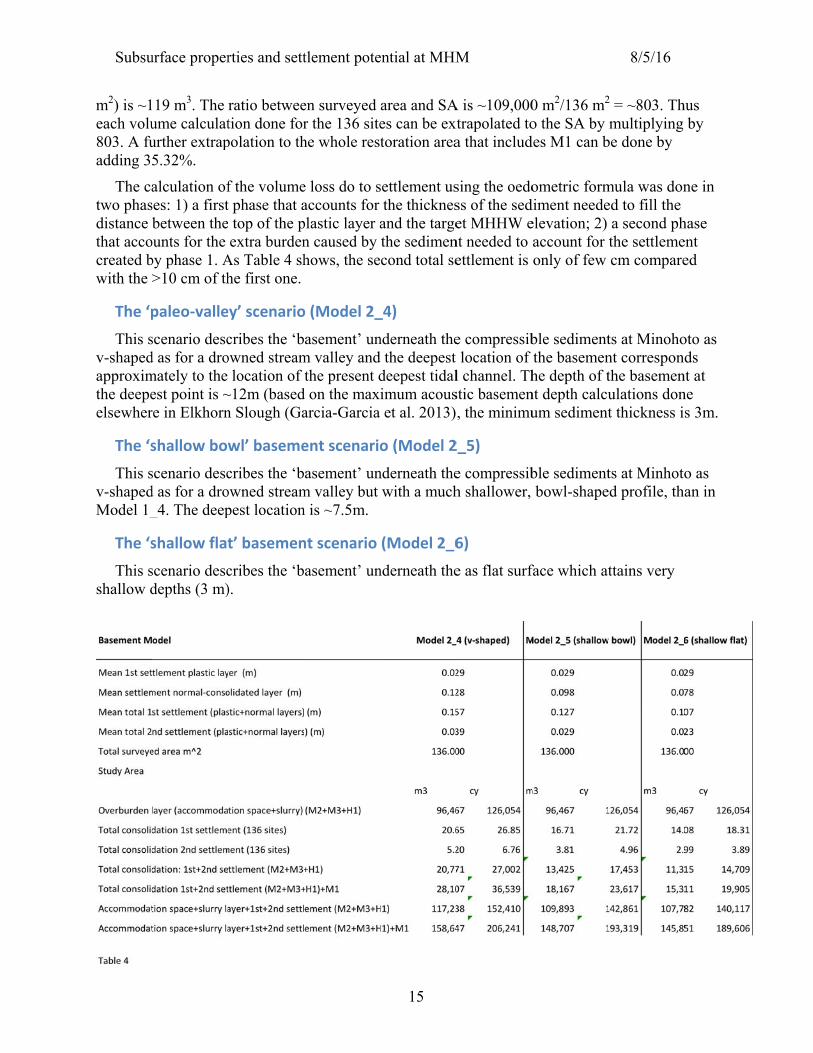
The catwo phasdistance that accocreated bwith the
The ‘p
This sv-shapedapproximthe deepeelsewher
The ‘s
This sv-shapedModel 1_
The ‘s
This sshallow d
urface proper
19 m3. The ume calculaturther extrap5.32%.
alculation ofses: 1) a firstbetween the
ounts for the by phase 1. A>10 cm of th
paleo‐valle
scenario descd as for a dromately to the est point is ~re in Elkhorn
shallow bow
scenario descd as for a dro_4. The deep
shallow flat
scenario descdepths (3 m)
rties and sett
ratio betweetion done forpolation to th
f the volumet phase that a top of the pextra burden
As Table 4 shhe first one.
ey’ scenario
cribes the ‘bowned stream
location of ~12m (basedn Slough (Ga
wl’ baseme
cribes the ‘bowned streampest location
t’ basemen
cribes the ‘b).
tlement pote
en surveyed r the 136 sitehe whole rest
e loss do to saccounts for plastic layer an caused by hows, the se
o (Model 2_
asement’ unm valley andthe present d
d on the maxarcia-Garcia
ent scenario
asement’ unm valley but n is ~7.5m.
nt scenario
asement’ un
ential at MHM
15
area and SAes can be exttoration area
settlement usthe thicknes
and the targethe sedimencond total se
_4)
nderneath thed the deepest deepest tidalimum acouset al. 2013)
o (Model 2
nderneath thewith a much
(Model 2_6
nderneath the
M
A is ~109,000xtrapolated toa that includ
sing the oedoss of the sedet MHHW e
nt needed to ettlement is
e compressib location of l channel. Thstic basemen, the minimu
2_5)
e compressibh shallower,
6)
e as flat surf
0 m2/136 m2
o the SA by des M1 can b
ometric formdiment needeelevation; 2) account for only of few
ble sedimentthe basemenhe depth of t
nt depth calcuum sediment
ble sedimentbowl-shape
face which at
8/5/16
2 = ~803. Thmultiplying
be done by
mula was doned to fill the
a second phthe settlemecm compare
ts at Minohont corresponthe basemenulations dont thickness i
ts at Minhotoed profile, th
ttains very
hus by
ne in
hase ent ed
oto as ds
nt at ne s 3m.
o as an in
Subsurface properties and settlement potential at MHM 8/5/16
16
References Cited
ENGEO, 2013. Elkhorn Slough Tidal Marsh Restoration Project Watsonville, California: FINDINGS OF LIMITED SUBSURFACE EXPLORATION. 23 pp.
ESA, 2014, Final Elkhorn Slough Tidal Marsh Restoration Project Restoration Plan, July 1, 2014.
Garcia-Garcia, A., Levey M.D, and Watson, E.B., 2013, High resolution seismic study of the Holocene infill of the Elkhorn Slough, central California. Continental Shelf Research, V 55, 108-118.
Kleinfelder, 2002. GEOTECHNICAL ENGINEERING INVESTIGA TION�FOR UNION PACIFIC RAILROAD BRIDGE (103.27 COAST) REPLACEMENT PROJECT AT PARSONS SLOUGH IN MONTEREY COUNTY, CALIFORNIA. I0-3012-84/GEO (1011 R877)/jb. 233 pp.