Elite long sprint running: a comparison between incline ...
14
HAL Id: hal-01765355 https://hal-insep.archives-ouvertes.fr/hal-01765355 Submitted on 12 Apr 2018 HAL is a multi-disciplinary open access archive for the deposit and dissemination of sci- entific research documents, whether they are pub- lished or not. The documents may come from teaching and research institutions in France or abroad, or from public or private research centers. L’archive ouverte pluridisciplinaire HAL, est destinée au dépôt et à la diffusion de documents scientifiques de niveau recherche, publiés ou non, émanant des établissements d’enseignement et de recherche français ou étrangers, des laboratoires publics ou privés. Elite long sprint running: a comparison between incline and level training sessions Jean Slawinski, Sylvain Dorel, François Hug, Antoine Couturier, Valentin Fournel, Jean-Benoît Morin, Christine Hanon To cite this version: Jean Slawinski, Sylvain Dorel, François Hug, Antoine Couturier, Valentin Fournel, et al.. Elite long sprint running: a comparison between incline and level training sessions. Medicine and Science in Sports and Exercise, American College of Sports Medicine (ACSM), 2008, 40 (6), pp.1155-1162. hal- 01765355
Transcript of Elite long sprint running: a comparison between incline ...
HAL Id: hal-01765355https://hal-insep.archives-ouvertes.fr/hal-01765355
Submitted on 12 Apr 2018
HAL is a multi-disciplinary open accessarchive for the deposit and dissemination of sci-entific research documents, whether they are pub-lished or not. The documents may come fromteaching and research institutions in France orabroad, or from public or private research centers.
L’archive ouverte pluridisciplinaire HAL, estdestinée au dépôt et à la diffusion de documentsscientifiques de niveau recherche, publiés ou non,émanant des établissements d’enseignement et derecherche français ou étrangers, des laboratoirespublics ou privés.
Elite long sprint running: a comparison between inclineand level training sessions
Jean Slawinski, Sylvain Dorel, François Hug, Antoine Couturier, ValentinFournel, Jean-Benoît Morin, Christine Hanon
To cite this version:Jean Slawinski, Sylvain Dorel, François Hug, Antoine Couturier, Valentin Fournel, et al.. Elite longsprint running: a comparison between incline and level training sessions. Medicine and Science inSports and Exercise, American College of Sports Medicine (ACSM), 2008, 40 (6), pp.1155-1162. �hal-01765355�
Article publié dans : Medicine & Science in Sports & Exercise, 2008, vol. 40, n° 6, pp. 1155-1162
Elite long sprint running: a comparison between incline and level training sessions
JEAN SLAWINSKI 1,2, SYLVAIN DOREL1, FRANÇOIS HUG 1,3, ANTOINE COUTURIER 1, VALENTIN FOURNEL 1, JEAN-BENOIT MORIN 4, and CHRISTINE HANON 1
1 Laboratory of Biomechanics and Physiology, French National Institute of Sports;
2 Team Lagardère, Paris;
3 Laboratory of Motricity, Interactions, Performance, University of Nantes, Nantes Atlantic Universities, Nantes;
4Research Unit PPEH, Faculty of Medicine, University of Saint Etienne, Saint-Etienne Cedex 2, FRANCE
ABSTRACT
Purpose: We compared incline and level training sessions as usually used in elite 400-m runners through stride kinematics and muscular activity measurements.
Methods: Nine highly trained 400-m ramiers (international and French national level) performed two maximal velocity sprints: 1) 300-m on level ground (LEV) and 2) 250-m on an incline ground (INC) characterized by a mean ± SD grade of 5.4 ± 0.7%. Kinematics (250 Hz) and electromyography parameters (root mean square [RMS] and integrated electromyography [iEMG] measurements) were analyzed (from 40- to 50-m phases).
Results: INC induced a decrease in running velocity compared to LEV (6.28 ± 0.38 vs 7.56 ± 0.38 ms-
1) explained by a reduction in stride length ( -14.2%) and stride rate (-7.4%) and by an increase in push-off time (+26.4%). Kinematics analysis indicated that the lower limbs were more flexed during INC running. Concerning the level of activity of the lower limb muscles, the major findings pointed out the decrease in RMS for semitendinosus and biceps femoris muscles during the contact phase and for vastus lateralis during its concentric phase. However, iEMG of both semitendinosus and biceps femoris muscles remained constant during both contact and push-off phases.
Conclusion: Our results are clearly different from those of previous studies carried out at similar absolute velocities in both LEV and INC conditions, which were not the case in this study. The lower running velocity marking INC running was associated with a decrease in the activation of the hamstrings. Trainers should particularly consider this lower level of activation of the hamstrings muscles during INC maximal sprint.
Key Words: MAXIMAL VELOCITY RUNNING, KINEMATICS, EMG, ATHLETICS TRAINING
Address for correspondence: Christine Hanon, Ph.D., Laboratory of Biomechanics and Physiology, French National Institute of Sports, 11 Tremblay Ave, 75012 Paris, France; E-mail: [email protected].

Article publié dans : Medicine & Science in Sports & Exercise, 2008, vol. 40, n° 6, pp. 1155-1162
It has been widely accepted by coaches that incline (INC) sprint training could improve level (LEV) running performance. Indeed, training methods intending to improve sprint performance have included INC running sessions performed at high velocities (3). Although these training sessions are designed to enhance muscular loading applied to the hip, knee, and ankle extensors (4), it has not, been well demonstrated whether INC sprint training could be effective for LEV running performance.
From a mechanical point of view, during INC running, lower limb muscles should generate additional net mechanical work to increase the potentiel energy of the body. The greater demand for mechanical work as the slope increases might be met by an increase in power output at a11 joints or only a subset of joints. Using inverse dynamics, Roberts and Belliveau (20) demonstrated that the increase in work output with increasing slope resulted in increases in net work done at the hip level, whereas the knee and ankle kept on producing similar work outputs at all slopes. These authors made the hypothesis that this additional work may be developed by hip extensor muscles such as gluteus maximus, biceps femoris, or semitendinosus (16).
The hypothesis according to which a greater work is produced by the hip extensor muscles during incline running was tested using magnetic resonance imaging (21,22). The results of these studies have shown a greater total activation of the lower limb muscles during INC running compared to LEV treadmill running with similar activations of the hip extensors (21,22). However, this technique only gives an indirect indication of the global activity level of the muscles and does not allow a precise comparison between muscles (11). In contrast, with surface electromyography (EMG) measurements, Swanson and Caldwell (23) reported higher activation levels of the hip extensors during incline treadmill running at a slope of 30% and a velocity of 4.5 •s-1 when compared with level running under similar conditions.
All the protocols carried out in the previously mentioned studies were performed on treadmills at different grades and aimed to compare exercises performed in INC and LEV conditions at the same absolute submaximal velocity (e.g., 4.5 m•s 1 in both LEV and INC running (23)). However, training sessions of elite athletes are performed in field conditions (on a track or a road) and at higher running velocities, i.e., somewhat far from these standard non-maximal laboratory conditions. Furthermore, no information is available concerning the mechanical and neuromuscular parameters in such all-out running conditions. Moreover, the activity of the lower limb muscles and several kinematic parameters showed systematic changes between overground and treadmill running (18). In light of this specificity of overground running conditions and of the highly particular adaptations to maximal running velocity induced by sprinting compared to high-but-not-maximal velocities, we thought that a comparison of biomechanical and neuromuscular parameters measured during exercises performed both in field conditions and at a similarly relative maximal intensity could be important for coaches to better understand the specific adaptations occurring during such INC training exercises.
Therefore, the purpose of this study is to document, in elite-level athletes, the effects of INC maximal sprint running performed during a training session on mechanical and neuromuscular parameters. INC running, compared to LEV running, was expected to induce an increase in the activation of the hip extensors and to alter stride and hip kinematics.
METHODS
Subjects and experimental protocol. Nine highly trained 400-m runners, eight women and one man, all members of the French national team, gave their written informed consent to participate in the study. Their age, body mass, height, and personal record on 400 m were 25.9 ± 4.2 yr, 59.9 ± 7.8 kg, 171.0± 5.4 cm, and 55.51 ± 1.61 s, respectively, for the women and 21 yr, 77 kg, 184 cm, and 46.51 s for the man. This study conforms to the recommendations of the Declaration of Helsinki and has been approved by the local ethics committee.
Two sprint conditions were examined: 1) 250-m INC running at maximal velocity and at a mean ± SD
Article publié dans : Medicine & Science in Sports & Exercise, 2008, vol. 40, n° 6, pp. 1155-1162 grade of 5.4 ± 0.7% on an outdoor road and 2) 300-m LEV running at maximal velocity on a standard synthetic indoor track. Different running distances were chosen to limit the difference in running time between both conditions. Indoor and outdoor tracks were chosen aiming to respect the training conditions of the athletes. After a typical warm-up, subjects performed the 300-m maximal LEV sprint followed by a 60-min recovery and the 250-m maximal INC sprint. The EMG activity from the vastus lateralis (VL), gluteus maximus (GM), rectus femoris (RF), biceps femoris (BF), semitendinosus (ST), tibialis anterior (TA), gastrocnemius (GA), and soleus (SOL) muscles was recorded during both running sessions. At the same time, contact (Tc) and flight times (Tf) were measured with FSR pressure sensors (Interlink, UK) taped on the insole of each shoe, facing the heel and the first metatarsal (big toe) regions. Each pair of sensors was connected in sertes allowing detection of the instants of heel-strike and toe-off and thus measurement of Tc and Tf for each step in field conditions, as described earlier (17). Kinematics of the left leg for one complete step was recorded by high-speed video. Because of the slope, the camera was placed 50-m alter the starting line of LEV running and 40-m alter that of INC running, to be located within the maximal velocity phase in both conditions.
Running velocity and step kinematics. Running velocity (in meters per second) was measured over the entire distance by photocells (Microgate, Bolzano, Italy) placed every 50 m. Step rate (SR in hertz) was calculated from Tc and Tf (in seconds) over 50 m (between 40 and 90 m beyond the starting line). Step length (SL in meters) was calculated over the same part of the sprint from running velocity and SR values.
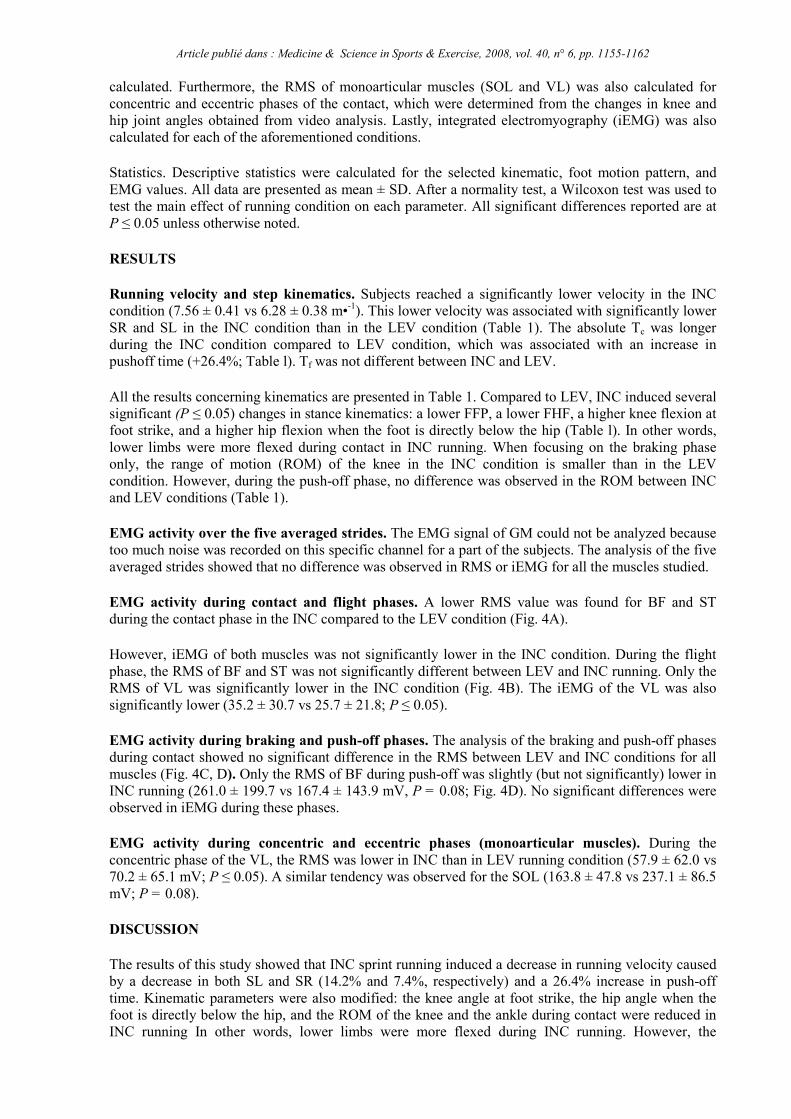
The sagittal plane motion of seven retroreflective markers defining the extremities of the foot, leg, thigh, and hip segments was recorded at 250 Hz using a video camera (Sony, Tokyo, Japan; see Fig. 1 for details). The twodimensional coordinates of the markers were digitized using a motion analysis system (Simi Reality Motion Systems GmbH, Unterschleissheim, Germany). After proper scaling, the raw coordinate data were smoothed with a 4-point moving average filter. One whole stride cycle (i.e., from one left foot strike to the next ipsilateral foot strike) was analyzed for each condition (LEV and INC). During the contact phase, joint angles were calculated as the angles between adjacent segments (Fig. 1). Finite difference methods were used to calculate linear and angular velocity data for each segment. As described in Figure 2, selected kinematic parameters at key moments in the gait cycle were calculated. The path diagram of the foot relative to the reference point at the great trochanter allowed to calculate foot position, hip, knee, and ankle angles at foot strike, foot directly under the hip, and toe-off moments. The description of the different calculated kinematic parameters is presented in Figure 2.
Electromyography. The electrical activity of eight lower limb muscles was monitored with pairs of surface Ag/ AgCl electrodes (Blue Sensor; Ambu Ltd., Copenhagen, Denmark) placed on the skin with a 2-cm interelectrode distance. The electrodes were placed longitudinally with respect to the underlying muscle fiber arrangement and located according to recommendations by SENIAM (Surface EMG for the Non-Invasive Assessment of Muscles) (10). Before electrode application, the skin was shaved and cleaned with alcohol to minimize impedance. The wires connected to the electrodes were well secured with tape to avoid movement-induced artifacts. Raw EMG signals were preamplified (with a gain of 375) close to the electrodes, band-pass-filtered (8-500 Hz), amplified (ME6000P16; Mega Electronics, Ltd., Kuopio, Finland), and analog-to-digital converted at a sampling rate of 1 kHz. The data logger of the ME6000 biomonitor recorded the signal of the FSR sensors, allowing temporal synchronization with EMG signals.
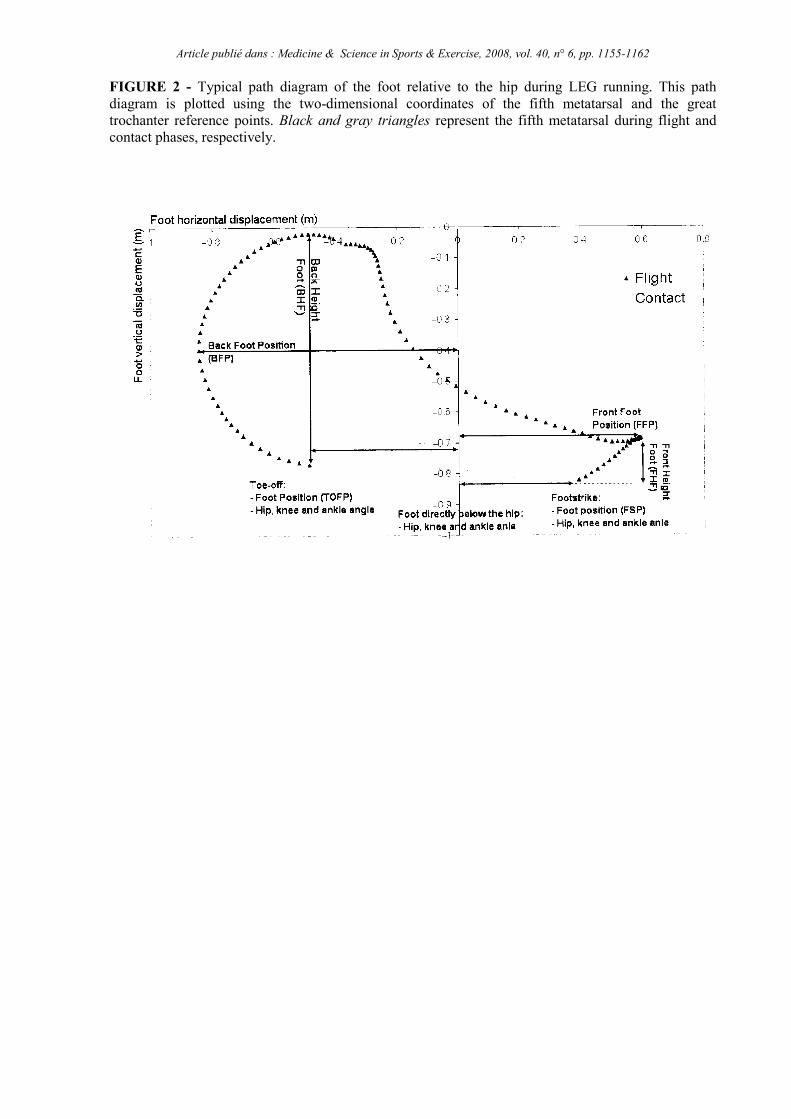
Raw EMG data were high-pass-filtered at 20 Hz using a dual-pass, fourth-order Butterworth filter to eliminate possible movement artifacts. Muscular activity was quantified using the EMG signal recorded during the different phases of the stride. This signal was full-wave-rectified and the root mean square (RMS) was computed with a 20-ms moving window. The EMG of each muscle was measured at 250 m for INC and 300 m for LEV running. From these recordings, five strides were analyzed (from the 10th to the 15th stride alter the start of the exercise, which corresponded to the passage of the runner in the shot of the camera). The data from these five strides were averaged to obtain a mean RMS envelope for each muscle (Fig. 3). Then, the RMS values of the contact and flight phases were calculated for each muscle. During the contact phase, the RMS of braking and push-off phases was
Article publié dans : Medicine & Science in Sports & Exercise, 2008, vol. 40, n° 6, pp. 1155-1162 calculated. Furthermore, the RMS of monoarticular muscles (SOL and VL) was also calculated for concentric and eccentric phases of the contact, which were determined from the changes in knee and hip joint angles obtained from video analysis. Lastly, integrated electromyography (iEMG) was also calculated for each of the aforementioned conditions.
Statistics. Descriptive statistics were calculated for the selected kinematic, foot motion pattern, and EMG values. All data are presented as mean ± SD. After a normality test, a Wilcoxon test was used to test the main effect of running condition on each parameter. All significant differences reported are at P ≤ 0.05 unless otherwise noted.
RESULTS
Running velocity and step kinematics. Subjects reached a significantly lower velocity in the INC condition (7.56 ± 0.41 vs 6.28 ± 0.38 m•-1). This lower velocity was associated with significantly lower SR and SL in the INC condition than in the LEV condition (Table 1). The absolute Tc was longer during the INC condition compared to LEV condition, which was associated with an increase in pushoff time (+26.4%; Table l). Tf was not different between INC and LEV.
All the results concerning kinematics are presented in Table 1. Compared to LEV, INC induced several significant (P ≤ 0.05) changes in stance kinematics: a lower FFP, a lower FHF, a higher knee flexion at foot strike, and a higher hip flexion when the foot is directly below the hip (Table l). In other words, lower limbs were more flexed during contact in INC running. When focusing on the braking phase only, the range of motion (ROM) of the knee in the INC condition is smaller than in the LEV condition. However, during the push-off phase, no difference was observed in the ROM between INC and LEV conditions (Table 1).
EMG activity over the five averaged strides. The EMG signal of GM could not be analyzed because too much noise was recorded on this specific channel for a part of the subjects. The analysis of the five averaged strides showed that no difference was observed in RMS or iEMG for all the muscles studied.
EMG activity during contact and flight phases. A lower RMS value was found for BF and ST during the contact phase in the INC compared to the LEV condition (Fig. 4A).
However, iEMG of both muscles was not significantly lower in the INC condition. During the flight phase, the RMS of BF and ST was not significantly different between LEV and INC running. Only the RMS of VL was significantly lower in the INC condition (Fig. 4B). The iEMG of the VL was also significantly lower (35.2 ± 30.7 vs 25.7 ± 21.8; P ≤ 0.05).
EMG activity during braking and push-off phases. The analysis of the braking and push-off phases during contact showed no significant difference in the RMS between LEV and INC conditions for all muscles (Fig. 4C, D). Only the RMS of BF during push-off was slightly (but not significantly) lower in INC running (261.0 ± 199.7 vs 167.4 ± 143.9 mV, P = 0.08; Fig. 4D). No significant differences were observed in iEMG during these phases.
EMG activity during concentric and eccentric phases (monoarticular muscles). During the concentric phase of the VL, the RMS was lower in INC than in LEV running condition (57.9 ± 62.0 vs 70.2 ± 65.1 mV; P ≤ 0.05). A similar tendency was observed for the SOL (163.8 ± 47.8 vs 237.1 ± 86.5 mV; P = 0.08).
DISCUSSION
The results of this study showed that INC sprint running induced a decrease in running velocity caused by a decrease in both SL and SR (14.2% and 7.4%, respectively) and a 26.4% increase in push-off time. Kinematic parameters were also modified: the knee angle at foot strike, the hip angle when the foot is directly below the hip, and the ROM of the knee and the ankle during contact were reduced in INC running In other words, lower limbs were more flexed during INC running. However, the

Article publié dans : Medicine & Science in Sports & Exercise, 2008, vol. 40, n° 6, pp. 1155-1162 variation in kinematics did not induce large modifications of the foot path diagram. Concerning muscular activation, the major findings concern the decrease in the RMS of ST and BF during contact and the decrease in that of VL during its concentric phase in INC sprint running. However, the level of neuromuscular activity of the other muscles studied remained similar between LEV and INC.
Step kinematics. Our data showed that, compared to level running, uphill sprint running induced a 4% reduction in knee angle at foot strike, a 15% reduction in hip angle when the foot is directly below the hip, and 38% and 17% reductions in the ROM of the knee and of the ankle, respectively, during the braking phase. It should be noted that these data were obtained from a limited data sample because only one complete stride cycle could be analyzed for each condition (LEV and INC). That said, these results are similar to those obtained by Paradisis and Cooke (19) who have demonstrated a decrease in the trunk, shank, and thigh angles during the braking phase. In the latter study, these modifications induced a significant 22.5% decrease in foot strike position relative to the vertical position of the hip (FSP in our study) during uphill sprint running. Contrary to these authors, we did not observe any significant decrease in FSP despite the decrease in both hip and knee angles. This discrepancy can be attributed to the method of FSP estimation used by Paradisis and Cooke who computed the distance between the foot and a line perpendicular to the running surface, which was the vertical projection of the center of mass at touchdown and not that of the theoretical middle of the hip (as defined in the present study, i.e., the great trochanter).
Furthermore, the 17% increase in Tc during INC running observed in the present study is much larger than that of the 3% previously reported by Paradisis and Cooke (19). This difference could be attributed to the lower slope they used (3% vs 5.4% in the present study). The lower slope used by Paradisis and Cooke induced a lower decrease in running velocity during INC than that observed in the present study. Indeed, with Te being inversely related to the running velocity (5), one could have expected an increase in Te with decreasing velocity. Thus, a slight change in the slope seems to have a great influence on both running velocity and Tc. Therefore, it seems that coaches and athletes have to be very careful when choosing the slope during INC sprint running training sessions.
On the field, sprinting on incline surfaces is often used as a form of specific strength and power training that is considered by coaches to provide a highly specific forward sprint training load, more specific than that reached through other forms of resistance exercise such as weight training. Considering the decrease in maximal running velocity and the increase in Tc observed in the present study, it is not obvious that a positive transfer may occur from INC sprint training to horizontal LEV sprint performance. An interesting result is the increase in push-off time in the INC condition although the SL was shorter than in the LEV condition. Indeed, the higher relative part of the propulsive phase during contact in uphill sprinting and the increase in resistance associated with the slope may overload the muscles, which contributes to the force production during push-off.
EMG. In contrast with the latter data, the decrease in RMS for BF and ST during the contact phase associated with the decrease in RMS for VL during its concentric phase did not support the aforementioned hypothesis of an increase in muscular loading during the push-off phase. Aiming to compare similar velocities during INC and LEV running, Gottschall and Kram (8) have shown that the normal (i.e., in the direction perpendicular to the ground) impact force and the parallel (i.e., in the direction parallel to the ground) braking impulse are lower and that the parallel propulsive impulse is higher during INC running. This increase was associated with a longer push-off time and a higher peak propulsive parallel force. As a consequence, the increase in propulsive parallel impulse allowed subjects to maintain a similar velocity during INC and LEV running. However, in our study, the fact that running velocity decreased during INC versus LEV running could be associated with a decrease in propulsive parallel impulse (8). Hence, with push-off time being longer for an equivalent impulse, it seems reasonable to hypothesize that the peak and/or mean propulsive parallel force applied to the ground is lower during INC sprint running. As a consequence, the decrease in RMS of BF and ST during the contact phase may be partly associated with this decrease in propulsive parallel force. However, the increase in pushoff time could also lead to an increase in the time of activation of BF and ST. This is confirmed by the stability of iEMG of both muscles during contact and push-off phases. Thus, during INC running, BF and ST could be less activated (as shown by the lower RMS values

Article publié dans : Medicine & Science in Sports & Exercise, 2008, vol. 40, n° 6, pp. 1155-1162 obtained during the contact phase) but for a longer time. That being said, gluteus muscles and the other heads of the hamstrings have to be considered to fully complete this comparison. Future studies could also examine the level and timing of the activation of the other lower limb muscles.
Considering the different phases of the stride, the decrease in muscular activity of BF and ST during the contact phase is not in accordance with previous studies showing a similar or higher activation of the hip extensor muscles during INC running (21-23). These discrepancies could be explained by the different running velocities reached. As previously mentioned, the running velocities reported in these studies were set at the same value during LEV and INC running. In the present study, which was based on all-out efforts, the lower maximal running velocity during INC (compared to LEV) could explain the decrease in muscular activity of BF and ST (9,12,13,16).
During the stride cycle, VL is activated concentrically at the end of the flight phase and eccentrically at the beginning of the contact phase (9,12,16). The major function of VL during running is to extend the knee during the terminal swing and to possibly stabilize the patella (16). Thus, the activity of VL before maximal front leg extension has been demonstrated to decrease as a function of running velocity (12,16). The present results confirm this observation, showing that, during its concentric phase, the RMS of VL decreases by 35% in the INC condition. Moreover, the decrease in VL activity could be associated with the decrease in front leg extension and the lower knee angle at foot strike during INC running. All the aforementioned differences in kinematics and muscular activity levels seem to be more directly related to running velocity than to incline. As a matter of fact, other studies should be undertaken to better understand the relationships between running kinematics, muscular activity, running velocity, and incline and to provide evidence-based arguments to figure out whether the changes observed are due to the slope of the terrain and/or to the changes in running velocity it induces and to what extent.
That said, it is interesting to note that despite the decrease in running velocity in the INC condition, the muscular activity of all other muscles remained similar to that measured in LEV sprint running, particularly concerning GA that has been shown to be more activated during the push-off phase of LEV running (14,15).
Why are INC sprint training sessions used? Contrary to our hypothesis, the neuromuscular activity of some of the lower limb muscles recorded was lower in the INC condition than in the LEV sprint running. From a neuromuscular activity point of view, the increase in slope during a sprint running session did not compensate for the decrease in running velocity induced. At that point, a question remains to be answered: what is the rationale for coaches to use INC sprint training sessions?
Different hypotheses can be made considering the different adaptations occurring during INC running. An explanation can be found in the mechanical similarity between INC running and the acceleration phase of a sprint (6,7). Indeed, INC running induced an increased push-off time; an adaptation also observed during the acceleration phase of a sprint (15). Thus, it can be put forward that the increase in push-off time could be beneficial to performance during the acceleration phase of the sprint start, in that the longer time available for force application and hence high positive impulses production might lead to their increase at each step (at least during the onset of the sprint). A second explanation can be found in the decrease of activity of the hamstrings. Indeed, this decrease may have, for consequence, to protect the runner from hamstrings injuries. The high prevalence of hamstrings strains in sprinters traumatology is well documented and high-velocity running is particularly associated with a risk of hamstrings injury (1,2). These authors demonstrated that all subjects of a group of 18 elite sprinters had been injured during competitive sprinting and that the primary injuries were all in the long head of BF muscle. Hamstrings injuries are often detrimental to the athlete, causing prolonged absence from competition and high rates of injury recurrence. Thus, it can be hypothesized that INC sprint running makes a maximal commitment of the runner possible, concomitantly inducing a lower level of activity of the hamstrings than that observed during LEV sprinting. On the one hand, that could lead to a decrease in the constraints applied to the hamstrings during training and hence partly prevent injuries. On the other hand, it can also be assumed that this decrease in activity of the hamstrings does not prepare this muscular group for the solicitation induced by LEV maximal running and especially

Article publié dans : Medicine & Science in Sports & Exercise, 2008, vol. 40, n° 6, pp. 1155-1162 during competitions. Therefore, INC sprint training sessions could be coupled with LEV sprint training sessions to better prepare hamstrings to be maximally activated. Another explanation could be found regarding the amount of work. The decrease in the activity of the hamstrings associated with the decrease in vertical impact force (8) could allow a greater amount of training load than in LEV running. To confirm this last hypothesis, the effect of fatigue during INC sprint running remains to be investigated (personal data in preparation).
In conclusion, INC sprint running induced a decrease in running velocity and led to numerous modifications of the running pattern. Step kinematics were modified, with decreasing SL and SR and increased push-off time, and the lower limbs were more flexed during INC running. Concerning muscular activation, the major findings concerned the whole decrease in the RMS for ST and BF during the contact phase and in the RMS for VL during its concentric phase. Hamstrings muscles were less activated but for a longer time during contact. These results suggest that INC sprint running could be beneficial to performance of the specific acceleration phase of a sprint start and to help reduce the level of activation of the hamstrings during maximal sprint session.
The authors are grateful to the French Athletics Federation and the French Ministry of Sport for their financial support.
REFERENCES
1. Askling CM, Tengvar M, Saartok T, Thorstensson A. Acute first time hamstring strains during high-speed running: a longitudinal study including clinical and magnetic resonance imaging findings. Am J Sports Med. 2007;35:197-206. 2. Chumanov E, Heiderscheit B, Thelen D. The effect of speed and influence of individual muscles on hamstring mechanics during the swing phase of sprinting. J Biomech. 2007;40:3555-62. 10.1016/ j.biomech.2007.05.026. 3. Costill D. A scientific approach to distance running. Track Field News. 1979;128. 4. Delecluse C, Van Coppenolle H, Willems E, Van Leemputte M, Diels R, Goris M. Influence of high-resistance and high-velocity training on sprint performance. Med Sci Sports Exerc. 1995;27(8): 1203-9. 5. Dillman CJ. Kinematic analyses of running. Exerc Sport Sci Rev. 1975;3(1):193-218. 6. di Prampero PE, Fusi S, Antonutto G. Of sprint running or running uphill? J Physiol. 2002;543P:198. 7. di Prampero PE, Fusi S, Sepulcri L, Morin JB, Belli A, Antonutto G. Sprint running: a new energetic approach. J Exp Biol. 2005;208:2809-16. 8. Gottschall JS, Kram R. Ground reaction forces during downhill and uphill running. J Biomech. 2005;38:445-52. 9. Hanon C, Thepaut-Mathieu C, Vandewalle H. Determination of muscular fatigue in elite runners. Eur J Appl Physiol. 2005;94: 118-25. 10. Hermens HJ, Freriks B, Disselhorst-Klug C, Rau G. Development of recommendations for SEMG sensors and sensor placement procedures. J Electromyogr Kinesiol. 2000;10:361-74. 11. Hug F, Marqueste T, Le Fur Y, Cozzone PJ, Grelot L, Bendahan D. Selective training-induced thigh muscles hypertrophy in professional road cyclists. Eur J Appl Physiol. 2006;97:591-7.
12. Kyröläinen H, Avela J, Komi PV. Changes in muscle activity with increasing running speed. J Sports Sci. 2005;23:1101-9. 13. Kyröläinen H, Komi PV, Belli A. Changes in muscle activity patterns and kinetics with increasing running speed. J Strength Cond Res. 1999;13:400-6. 14. Mann R, Sprague P. A kinetic analysis of the ground leg during sprint running. Res Q Exerc Sport. 1980;51:334-48. 15. Mero A, Komi PV, Gregor RI. Biomechanics of sprint running. A review. Sports Med. 1992;13:376-92. 16. Montgomery WH 3rd, Pink M, Perry J. Electromyographic analysis of hip and knee musculature

Article publié dans : Medicine & Science in Sports & Exercise, 2008, vol. 40, n° 6, pp. 1155-1162 during running. Am J Sports Med. 1994;22:272-8. 17. Morin JB, Jeannin T, Chevallier B, Belli A. Spring-mass model characteristics during sprint running: correlation with performance and fatigue-induced changes. Int J Sports Med. 2006;27:158-65. 18. Nigg BM, De Boer RW, Fisher V. A kinematic comparison of overground and treadmill running. Med Sci Sports Exerc. 1995; 27(1):98-105. 19. Paradisis GP, Cooke CB. Kinematic and postural characteristics of sprint running on sloping surfaces. J Sports Sci. 2001;19: 149-59. 20. Roberts TJ, Belliveau RA. Sources of mechanical power for uphill running in humans. J Exp Biol. 2005;208:1963-70. 21. Sloniger MA, Cureton KJ, Prior BM, Evans EM, Prior Evans EM. Anaerobic capacity and muscle activation during horizontal and uphill running. J Appl Physiol. 1997;83:262-9. 22. Sloniger MA, Cureton KJ, Prior BM, Evans EM. Lower extremity muscle activation during horizontal and uphill running. J Appl Physiol. 1997;83:2073-9. 23. Swanson SC, GE Caldwell. An integrated biomechanical analysis of high speed incline and level treadmill running. Med Sci Sports Exerc. 2000;32 (6): 1146-55.

Article publié dans : Medicine & Science in Sports & Exercise, 2008, vol. 40, n° 6, pp. 1155-1162 FIGURE 1 - Convention used for the calculation of the three joint angles from marker coordinates of the different segments: foot (from the fifth metatarsal to the posterior surface of the calcaneus), shank (from the lateral malleolus to the lateral epicondyle of femur), thigh (from the femur lateral epicondyl to the great trochanter), and hip (from the anterior superior iliac spine to the posterior superior iliac spine).
Article publié dans : Medicine & Science in Sports & Exercise, 2008, vol. 40, n° 6, pp. 1155-1162 FIGURE 2 - Typical path diagram of the foot relative to the hip during LEG running. This path diagram is plotted using the two-dimensional coordinates of the fifth metatarsal and the great trochanter reference points. Black and gray triangles represent the fifth metatarsal during flight and contact phases, respectively.
Article publié dans : Medicine & Science in Sports & Exercise, 2008, vol. 40, n° 6, pp. 1155-1162 FIGURE 3 - Activity patterns of the biceps femoris (BF) and semitendinosus (ST) muscles during incline (INC; solid line) and level running (LEV; dotted line) obtained from a typical subject. Five strides were averaged to obtain this RMS envelope. The beginning of the averaging corresponds to the foot strike moment and the end corresponds to the end of the stride (next foot strike of the same leg). The first series of vertical lines correspond to the end of the braking phase in INC (solid line) and LEV (dotted line) conditions. The second series of vertical lines correspond to the end of the push-off phase in INC (solid line) and LEV (dotted line) conditions.

Article publié dans : Medicine & Science in Sports & Exercise, 2008, vol. 40, n° 6, pp. 1155-1162 FIGURE 4 - Differences in RMS measured during contact (A), flight (B), braking (C), and push-off (D) phases during level (LEV) and incline (INC) running for the muscles studied: vastus lateralis (VL), rectus femoris (RF), biceps femoris (BF), semitendinosus (ST), tibialis anterior (TA), gastrocnemius (GA), and soleus (S). *P ≤ 0.05.
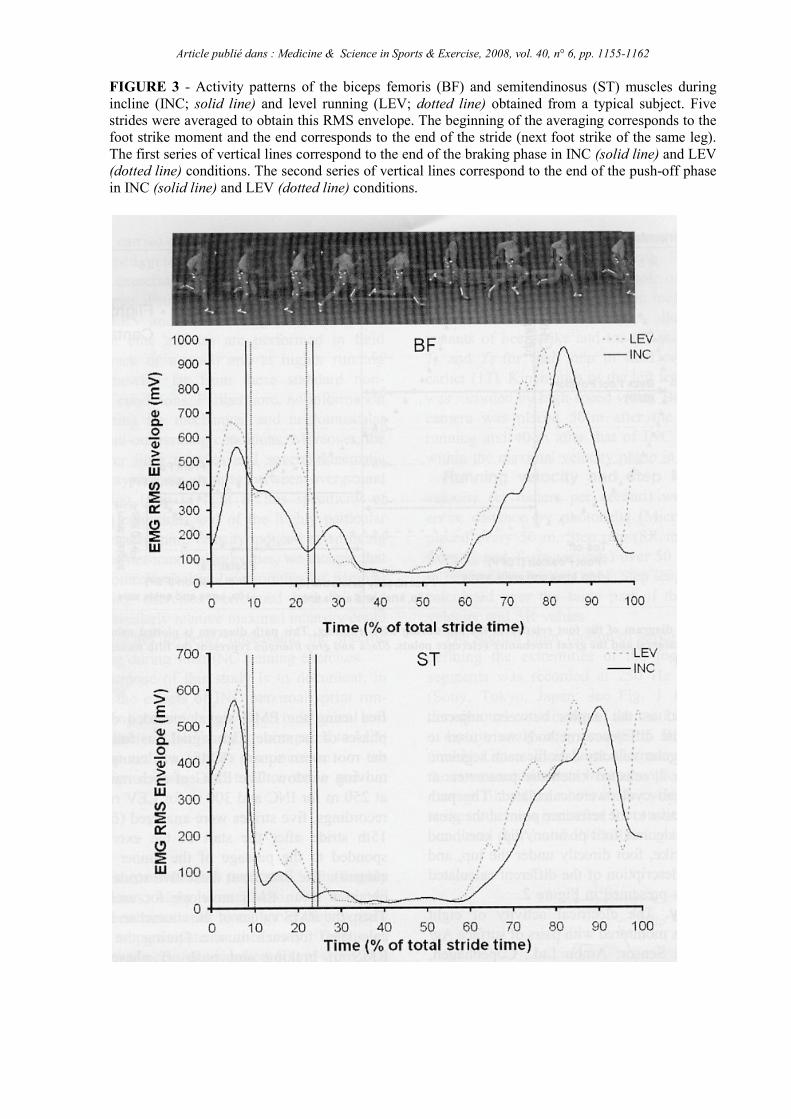
Article publié dans : Medicine & Science in Sports & Exercise, 2008, vol. 40, n° 6, pp. 1155-1162 TABLE 1. Effect of slope on running kinematics: contact time (Tc), flight time (Tf), step rate (SR), step length (SL), horizontal distance covered by the hip during the stance phase (DHS)
Level Incline Variables (mean ± SD) (mean ± SD) Velocity and step kinematics
Tc (s) 0.117 ± 0.006 0.137 ± 0.004* Braking Lime (s) 0.049 ± 0.004 0.050 ± 0.008 Push-off Lime (s) 0.068 ± 0.003 0.086 ± 0.008*
Tf (s) 0.128 ± 0.010 0.132 ± 0.009 SR (Hz) 3.90 ± 0.15 3.61 ± 0.11* SL (m) 2.12 ± 0.13 1.82 ± 0.14* Velocity (m•s-1) 7.56 ± 0.41 6.28 ± 0.38* Foot path parameters FSP (m) 0.404 ± 0.018 0.352 ± 0.066 TOFP (m) -0.464 ± 0.044 -0.510 ± 0.071 DHS (m) 0.868 ± 0.052 0.862 ± 0.124 FFP (m) 0.587 ± 0.029 0.485 ± 0.063* BFP (m) -0.685 ± 0.095 -0.757 ± 0.039 FHF (m) 0.112 ± 0.035 0.078 ± 0.028* BHF (m) 0.570 ± 0.225 0.601 ± 0.054 Angles at foot strike (°) θHip 55.3 ± 9.2 47.1 ± 4.7 θKnee 149.4 ± 4.3 143.4 ± 2.6* θAnkle 102.6 ± 6.9 96.2 ± 7.6 Angles at foot directly below the hip (°)
θHip 66.4 ± 4.3 57.5 ± 3.0* θKnee 126.5 ± 10.0 129.2 ± 5.2
θAnkle 69.9 ± 8.3 69.2 ± 3.7 Angles at toe-off (°) θHip 95.9 ± 8.5 95.8 ± 7.1
θKnee 151.6 ± 14.7 159.4 ± 5.6 θAnkle 104.5 ± 10.8 103.9 ± 7.7 ROM during braking (°) Hip 13.1 ± 6.8 7.9 ± 4.2
Knee -22.9 ± 9.3 -14.3 ± 7.4* Ankle -32.7 ± 5.0 -27.1 ± 4.4* ROM during push-off (°) Hip 29.4 ± 8.0 38.3 ± 7.6
Knee 25.1 ± 5.8 30.2 ± 4.5 Ankle 34.7 ± 9.5 34.8 ± 9.2
Selected kinematic parameters at key moments in the gait cycle were calculated relative to the reference point at the great trochanter. We calculated foot position at foot strike (FSP) and toe-off (TOFP). Positions were also calculated for the following typical moments: furthest back foot position (BFP), highest point behind the foot strike position (BHF), furthest forward foot position (FFP), and foot height at the latter moment (FHF).
* P≤ 0.05.