Eliciting Self-Explanations Improves Children’s … Self-Explanations Improves Children’s...
30
Eliciting Self-Explanations Improves Children’s Performance on a Field-Based Map Skills Task Kim A. Kastens Lamont-Doherty Earth Observatory Department of Earth & Environmental Sciences Columbia University Lynn S. Liben Department of Psychology The Pennsylvania State University at University Park To investigate children’s ability to translate between the environment and an abstract representation, fourth graders were asked to indicate the location of colored flags by placing similarly colored stickers on a map. In the explaining condition, students wrote down what clues they had used; in the baseline condition, they placed stickers without explanation. The explaining students significantly outperformed the baseline students, especially with respect to egregious errors indicative of failure to under- stand basic representational correspondence. The hypothesized interpretation is that children who generated explanations were more likely to notice and then correct dis- crepancies between their answers in progress and the referent space and that they did so by activating existing spatial and symbolic competencies. Becoming a skilled user of maps in the real world is not an easy cognitive task. When people look around them, they see a world that is constantly changing: day to night, season to season, and minute to minute. They perceive a landscape of mil- lions of tiny details: blades of grass, cracks in the sidewalk, ripples on the pond. They look horizontally out across the landscape, from a vantage point 4 or 5 ft (ap- COGNITION AND INSTRUCTION, 25(1), 45–74 Copyright © 2007, Lawrence Erlbaum Associates, Inc. Correspondence should be addressed to Kim Kastens, Lamont-Doherty Earth Observatory of Co- lumbia University, Route 9W, Palisades, NY 10964. E-mail: [email protected] or Lynn S. Liben, Department of Psychology, The Pennsylvania State University, 450 Moore Bldg., University Park, PA 16802–3106. E-mail: [email protected]
Transcript of Eliciting Self-Explanations Improves Children’s … Self-Explanations Improves Children’s...

Eliciting Self-Explanations ImprovesChildren’s Performance
on a Field-Based Map Skills Task
Kim A. KastensLamont-Doherty Earth Observatory
Department of Earth & Environmental SciencesColumbia University
Lynn S. LibenDepartment of Psychology
The Pennsylvania State University at University Park
To investigate children’s ability to translate between the environment and an abstractrepresentation, fourth graders were asked to indicate the location of colored flags byplacing similarly colored stickers on a map. In the explaining condition, studentswrote down what clues they had used; in the baseline condition, they placed stickerswithout explanation. The explaining students significantly outperformed the baselinestudents, especially with respect to egregious errors indicative of failure to under-stand basic representational correspondence. The hypothesized interpretation is thatchildren who generated explanations were more likely to notice and then correct dis-crepancies between their answers in progress and the referent space and that they didso by activating existing spatial and symbolic competencies.
Becoming a skilled user of maps in the real world is not an easy cognitive task.When people look around them, they see a world that is constantly changing: dayto night, season to season, and minute to minute. They perceive a landscape of mil-lions of tiny details: blades of grass, cracks in the sidewalk, ripples on the pond.They look horizontally out across the landscape, from a vantage point 4 or 5 ft (ap-
COGNITION AND INSTRUCTION, 25(1), 45–74Copyright © 2007, Lawrence Erlbaum Associates, Inc.
Correspondence should be addressed to Kim Kastens, Lamont-Doherty Earth Observatory of Co-lumbia University, Route 9W, Palisades, NY 10964. E-mail: [email protected] or Lynn S.Liben, Department of Psychology, The Pennsylvania State University, 450 Moore Bldg., UniversityPark, PA 16802–3106. E-mail: [email protected]

proximately 1.2 to 1.5 m) above the ground. Somehow, they need to learn to “trans-late” mentally from the intricate, constantly changing, horizontally viewed worldthat they see around them into a schematic, unchanging, vertically viewed map assummarized in Figure 1.
Anecdotal encounters with map-challenged adults, plus a large body of cogni-tive-developmental research literature, tell us that many people never master this“translation” skill (Liben, 2006). In a review of the research literature on children’sacquisition of map literacy, Liben and Downs (1989) concluded that many youngchildren show competence at simple map tasks, such interpreting a floor plan of asingle room containing a few items. However, when children are asked to performtasks that are more akin to those facing adults in either practical or professionalmap-using situations, their performance is much less impressive. For example,when asked to select the bird’s-eye view of their school building from among sixchoices, only 20% of first graders and 29% of second graders could correctly iden-
46 KASTENS AND LIBEN
FIGURE 1 Locating oneself or an observed object on a map is a complex cognitive task. Themap user must translate information seen in profile view to a spatial representation drawn inbird’s-eye view; from an intricately detailed, visually perceived landscape to an abstract andschematic spatial representation; from a view that changes over time to an unchanging represen-tation; from a large environment to a small representation. From “Development and Evaluationof ‘Where Are We?’Map-Skills Software and Curriculum,” by K. A. Kastens, D. Kaplan and K.Christie-Blick, 2001, Journal of Geoscience Education, 49, p. 249. Copyright 2001 by of Jour-nal of Geoscience Education. Reprinted with permission.

tify the U-shaped plan view (Downs & Liben, 1990). When asked to place coloredstickers on a map in locations that corresponded to colored flags on a three-dimen-sional model of the same terrain, only 27% of the first graders’ stickers and 40% ofthe second graders’ stickers ended up in approximately the correct location (Liben& Downs, 1989). These and other research results lead to the conclusion thatskilled map use is not an ability that develops naturally and inevitably in all chil-dren, like walking or talking. Instead, it is a complex ability that must be taught andpracticed if it is to be fully developed.
In thinking about the mistakes that people make in using maps, it is important todistinguish between understanding some general aspect of the map–space corre-spondence and being able to actually use that understanding to locate oneself or anobject in an unfamiliar, realistically complex terrain. Working with adults experi-enced in using topographic maps and who could thus be presumed to understandthe general concept of correspondences between map and space, Pick et al. (1995)found that only 1 of 17 could find their position on a topographic map when“dropped” into an unknown location and not allowed to move around. Liben,Kastens, and Stevenson (2002) reported a similar finding from a study with collegestudents who were new to campus. Participants were taken to five locations oncampus and asked to place stickers on a campus map to indicate where theythought they were. Performance covered the full range, with some participants cor-rect on no locations and others correct on all. What was striking was the dramaticnature of many of the errors: Stickers were often placed far from the correct spot,and often on or near map symbols representing buildings or locations with verydifferent qualities than the correct ones.
In summary, past research has shown that neither children nor adults are univer-sally successful when asked to translate information obtained from the large-scaleenvironment to an abstract plan map or vice versa. Our work has been aimed at try-ing to develop methods to enhance these skills in elementary school children and tounderstand more fully where children go astray. We have developed a set offield-based map skills assessments specifically to examine participants’ ability totranslate information from map to referent space and vice versa. These were origi-nally developed to evaluate the Where Are We? software and curriculum materials(Kastens, Kaplan, & Christie-Blick, 2001; Liben et al., 2002) but have also provenof value for investigating children’s strategies and mistakes while using maps moregenerally. The methods used in this study are notable for their use of a large-scaleoutdoor environment of sufficient size and complexity that the participants couldnot see the entire field area from any single vantage point. This spatial scale is un-derstudied in the research literature on map-comprehension and spatial cognition,yet it is a crucial scale for the use of maps in everyday life and in map-using profes-sions such as geology, ecology, architecture, or urban planning.
To better understand the sources of errors children make while using a mapwithin the represented environment, we designed a method to ask children di-
CHILDREN’S PERFORMANCE ON A FIELD MAP TASK 47
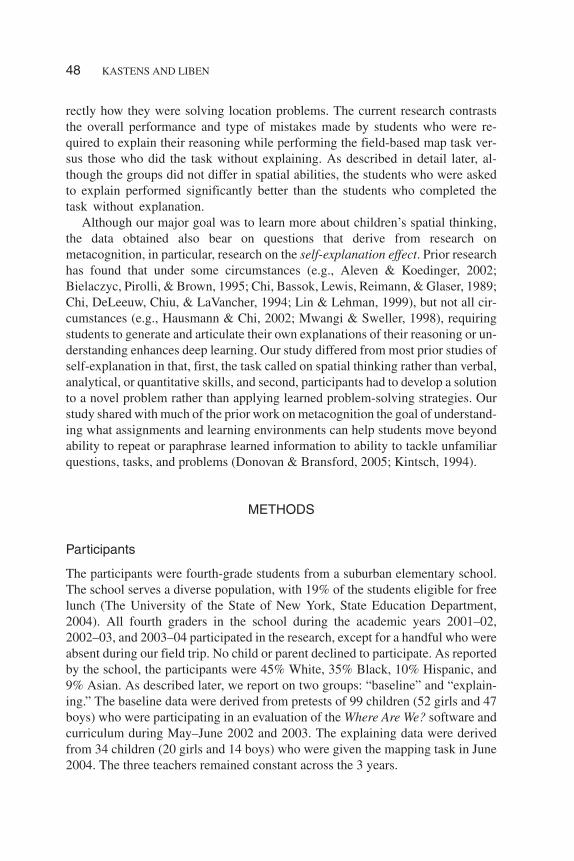
rectly how they were solving location problems. The current research contraststhe overall performance and type of mistakes made by students who were re-quired to explain their reasoning while performing the field-based map task ver-sus those who did the task without explaining. As described in detail later, al-though the groups did not differ in spatial abilities, the students who were askedto explain performed significantly better than the students who completed thetask without explanation.
Although our major goal was to learn more about children’s spatial thinking,the data obtained also bear on questions that derive from research onmetacognition, in particular, research on the self-explanation effect. Prior researchhas found that under some circumstances (e.g., Aleven & Koedinger, 2002;Bielaczyc, Pirolli, & Brown, 1995; Chi, Bassok, Lewis, Reimann, & Glaser, 1989;Chi, DeLeeuw, Chiu, & LaVancher, 1994; Lin & Lehman, 1999), but not all cir-cumstances (e.g., Hausmann & Chi, 2002; Mwangi & Sweller, 1998), requiringstudents to generate and articulate their own explanations of their reasoning or un-derstanding enhances deep learning. Our study differed from most prior studies ofself-explanation in that, first, the task called on spatial thinking rather than verbal,analytical, or quantitative skills, and second, participants had to develop a solutionto a novel problem rather than applying learned problem-solving strategies. Ourstudy shared with much of the prior work on metacognition the goal of understand-ing what assignments and learning environments can help students move beyondability to repeat or paraphrase learned information to ability to tackle unfamiliarquestions, tasks, and problems (Donovan & Bransford, 2005; Kintsch, 1994).
METHODS
Participants
The participants were fourth-grade students from a suburban elementary school.The school serves a diverse population, with 19% of the students eligible for freelunch (The University of the State of New York, State Education Department,2004). All fourth graders in the school during the academic years 2001–02,2002–03, and 2003–04 participated in the research, except for a handful who wereabsent during our field trip. No child or parent declined to participate. As reportedby the school, the participants were 45% White, 35% Black, 10% Hispanic, and9% Asian. As described later, we report on two groups: “baseline” and “explain-ing.” The baseline data were derived from pretests of 99 children (52 girls and 47boys) who were participating in an evaluation of the Where Are We? software andcurriculum during May–June 2002 and 2003. The explaining data were derivedfrom 34 children (20 girls and 14 boys) who were given the mapping task in June2004. The three teachers remained constant across the 3 years.
48 KASTENS AND LIBEN
Field Area and Map
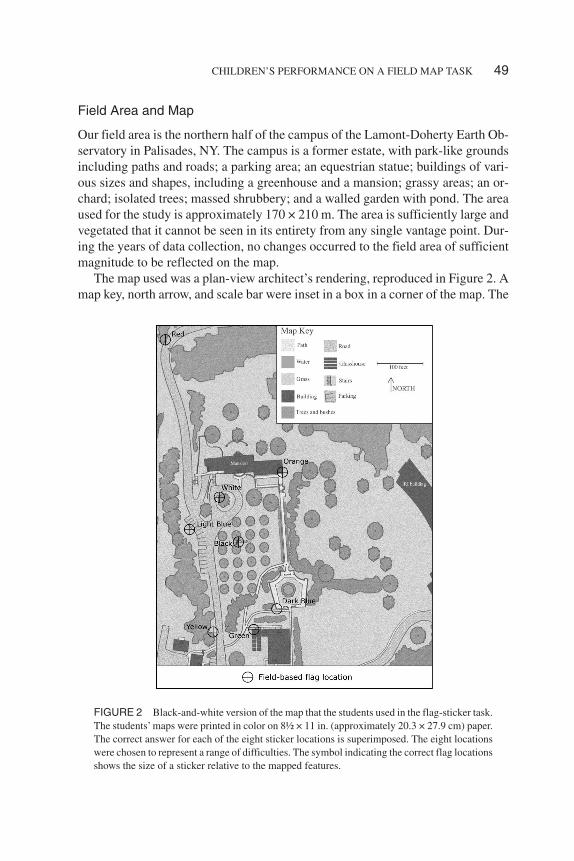
Our field area is the northern half of the campus of the Lamont-Doherty Earth Ob-servatory in Palisades, NY. The campus is a former estate, with park-like groundsincluding paths and roads; a parking area; an equestrian statue; buildings of vari-ous sizes and shapes, including a greenhouse and a mansion; grassy areas; an or-chard; isolated trees; massed shrubbery; and a walled garden with pond. The areaused for the study is approximately 170 × 210 m. The area is sufficiently large andvegetated that it cannot be seen in its entirety from any single vantage point. Dur-ing the years of data collection, no changes occurred to the field area of sufficientmagnitude to be reflected on the map.
The map used was a plan-view architect’s rendering, reproduced in Figure 2. Amap key, north arrow, and scale bar were inset in a box in a corner of the map. The
CHILDREN’S PERFORMANCE ON A FIELD MAP TASK 49
FIGURE 2 Black-and-white version of the map that the students used in the flag-sticker task.The students’ maps were printed in color on 8½ × 11 in. (approximately 20.3 × 27.9 cm) paper.The correct answer for each of the eight sticker locations is superimposed. The eight locationswere chosen to represent a range of difficulties. The symbol indicating the correct flag locationsshows the size of a sticker relative to the mapped features.
maps given to the children were color-photocopied onto 8½ × 11 in. (approxi-mately 20.3 × 27.9 cm) paper at a scale close to 1:1,000. Grass, bushes, and shrubswere shown in green, the pond and fountains in blue, and the paths and roads inshades of gray. Because the map scale was so large, the mapped width of the sym-bolized roads and paths was at the same scale as the map, and the mapped shape ofthe building symbols matched the real-world building footprints.
The Flag-Sticker Field-Based Map Skills Test
The field-based maps skills assessment used here was modeled after a test devel-oped by Liben and Downs (1986, 1989). In the original task, seven colored flagswere placed in various locations on a tabletop three-dimensional model of the localregion, and children were asked to place similarly colored stickers on a topo-graphic map of the same region to show the flags’ locations. In our life-size ver-sion, we placed eight flags around the field area. We gave each student a paper mapand a set of eight colored stickers. The students were asked to place each sticker ontheir map to indicate the position of the similarly colored flags. The stickers wereround, and the diameter (5/16 in., or approximately 8 mm) corresponded to ap-proximately 7 m on the ground. It was possible, with care, to peel off a placedsticker and reposition it elsewhere on the map.
The flag positions were selected to span a range from very easy to quite difficult.We made this judgment based on the recorded comments of students who did theflag-sticker activity in pairs during the pilot stage of the project and on prior researchshowing that locations on unique map symbols are easier than those on repeatedsymbols (e.g., Blades & Spencer, 1994; Liben & Downs, 1989), and locations proxi-mal to landmarksareeasier than locationsremotefromlandmarks(Siegel,1981).
Students were introduced to the activity one class at a time (14 to 20 students) asthey sat on the steps of the mansion. As part of the introduction, each item on themap key was pointed out on a poster-sized version of the map held up in front of thegroup. After being given an opportunity to ask questions, students were called upone by one to begin the task. Individually, students were handed a map that wascorrectly oriented with the terrain, shown where they were standing and which di-rection they were facing, and launched on the task. Students could explore the fieldarea and place their stickers in any order they chose. Adults were strategically posi-tioned around the periphery of the field area to keep children from wandering outof bounds. There was no time constraint.
Baseline and Explaining Conditions
In the baseline condition, the students completed the task exactly as just described.In the explaining condition, students performed the flag-sticker task as describedearlier, but with one modification: After they had found a flag and placed its sticker
50 KASTENS AND LIBEN

on the map, they were asked to “write down [on a paper form] what clues you usedto decide where that color sticker should go on the map” before going on the nextflag. The forms on which the students recorded their clue answers had prelabeledresponse areas for each color; the order of responses was not recorded.
The map, flag locations, script for describing the sticker-placement task, andprocedure for briefing and launching the children were identical in the two condi-tions. In both experiments, the investigator emphasized, “This is not a race, andthere is no time limit.”
Spatial Abilities Assessments
We administered three paper-and-pencil assessments of students’ spatial skills toallow us to determine whether the two groups were well-matched in underlyingspatial abilities. The three tests were selected to represent the three component spa-tial abilities identified by Linn and Petersen (1985): imagining figures or objectsrotating in two- or three-dimensional space (“mental rotation”), identifying stablepositions or axes such as vertical or horizontal in spite of a conflicting visual envi-ronment (“spatial perception”), and performing multistep spatial tasks using vari-ous strategies (“spatial visualization”).
Mental rotation. Skill in mental rotation was assessed by the Spatial Rela-tions Sub-Test of the Primary Mental Abilities test (Thurstone, 1962) as modifiedby Liben and Downs (1986). For each of the 21 items in this task, participants areshown a two-dimensional line drawing of a figure as a model and then asked tomark which of five drawings show the “same” figure—in other words, a figure thatcan be formed by rotation of the model within the plane of the paper. Scores are re-ported as the number of correct figures marked minus the number of incorrect fig-ures marked within the allowed 6 min.
Water level. Ability to identify a stable axis in spite of a conflicting visualenvironment was assessed by a variant of the water level task, originally developedby Piaget and Inhelder (1956). The task was designed to tap respondents’ ability torecognize the invariant horizontality of water in the face of the conflicting obliquecues provided by the sides of the tipped container that holds it. Following the pro-cedure used by Liben and Golbeck (1980), children were asked to draw lines toshow where water would be in each of six tilted bottles. No time limit was given forthe task, which was typically completed within a few minutes. Performance wasscored as the number of lines drawn parallel to the line indicating the tabletop,within a margin of error of 5°.
Hidden pictures. “Spatial visualization” (as defined by Linn & Petersen,1985) was assessed by the Hidden Pictures test, designed by Liben as a children’s
CHILDREN’S PERFORMANCE ON A FIELD MAP TASK 51

equivalent of the Group Embedded Figures Task (Witkin, Oltman, Raskin, &Karp, 1971). In this task, respondents are asked to find a simple figure within thepattern of a complex drawing. Scores are reported as number of simple figures cor-rectly outlined, out of a maximum of 13, within the 6 min allowed.
RESULTS
Groups’ Spatial Skills
As described earlier, to determine whether the baseline and explaining groups haddifferent spatial abilities, we administered three spatial skills measures. Scores onthe mental rotation, water level, and Hidden Pictures tests were analyzed with ttests for each measure. There were no significant differences between the groupson any of the measures (all ps > .25), and thus there is no evidence that the groups’spatial abilities differed.
Types of Flag-Sticker Responses
All of the children’s sticker maps were scanned, and the sticker positions were dig-itized. The digitized sticker positions were entered into a geographic informationsystem (GIS) to give us flexibility in scoring the responses. After some pilot cod-ing, we selected two ways of scoring each sticker location. The first was a simplenumerical measure of the linear distance offset between a student’s sticker locationand the correct location. We used “sticker diameters” as the unit of measure, be-cause the sticker size conveys an implicit message to the students about how much“slop” is allowed in mechanically placing the sticker onto the paper. The stickersize relative to the mapped features is shown in Figure 2. This offset measure iseasy to understand and completely objective.
However, the offset measure fails to capture important aspects of the map-us-ing process. For example, consider the orange flag, on the southeast corner ofthe mansion (see Figure 2). An orange sticker on some other building, even abuilding distant from the mansion, seems to show a higher level of understand-ing of the map–environment correspondence than a sticker placed in the middleof the lawn immediately north of the mansion, even though the latter position ismetrically closer to the correct location. To capture these differences, we devel-oped a categorical scheme of response types (see Table 1 and Figures 3 and 4),based in part on the types of errors observed in previous studies. Each sticker foreach participant was categorized as falling into one of five error types or a “noerror” category.
Error Types 1, 2, and 3 are the most egregious errors (see Figure 3). In ErrorType 1, the sticker is placed on a map symbol that resembles the sticker in size
52 KASTENS AND LIBEN

53
TABLE 1The Categorical Scheme of Response Types Used
to Classify Sticker Placements
Response Type Description Vulnerable Flags Interpretation
1Sticker is centered on a map
object that resembles thesticker in size and shape
All except white
Failure to understand oremploy the assignedsymbolic “stand-for”relationship
2
Sticker is placed on symbol forgrass, trees or bushes, andnot on or adjacent to anybuilt object
All flags
Failure of representationalcorrespondence
3a
Sticker should have been onstructure (building, statue, orwall); placed instead on oradjacent to road or path
black, dark blue,orange, green
3b
Sticker should have beenadjacent to a road or path;placed instead on or adjacentto a structure
red, white, lightblue, yellow
4a
Sticker should have been onstructure; placed on oradjacent to the wrongstructure
black, dark blue,orange, green Success of representational
correspondence; substantialfailure of configurationalcorrespondence
4b
Sticker should be adjacent to aroad or path; placed on oradjacent to the wrong road orpath segmenta
red, white, lightblue, yellow
5aSticker should be on structure;
placed on correct structure,but outside of no-error ringb
dark blue,orange, green Success of representational
correspondence; subtlefailure of configurationalcorrespondence5b
Sticker should be adjacent to aroad or path; placed oncorrect path or road segment,but outside the no-error ring
red, white, lightblue, yellow
No errorCenter of sticker is placed
within two sticker diametersof the exact location
All flagsGood enough for personal
navigation
Note. For each color flag, the map area was divided into regions, each characterized by one of theseresponse types. The assignment of stickers to regions was done via a geographic information system.
aThe roads on the Lamont campus are connected to each other. We have divided them into segmentsbased on where the observer in the field area perceives a marked change in character, such as a suddenchange in width or gradient of the road. bThe black flag was placed on a statue, a structure that is smallrelative to the no-error ring; thus it is not vulnerable to error type 5a.

and shape. Although this seems like an improbable thing to do, Liben and Yekel(1996) reported a similar finding in a study in which preschoolers placed roundstickers on a classroom map that happened to contain a wastebasket symbol thesame size and shape as the sticker. In Error Type 2, the sticker is placed out inthe grass or trees, far away from any built feature, even though all of the flagswere along roads, along paths, or on built structures. This is analogous to stu-dents in the Liben and Yekel study who placed stickers in the middle of the floorrather than on the furniture symbols. In Error Type 3, the sticker is placed on abuilt object, but the wrong sort of built object: for example, on a road when itshould have been on a building. Error Categories 1, 2, and 3 are intended to cap-ture circumstances in which the student has failed to understand the basic
54 KASTENS AND LIBEN
FIGURE 3 We interpret errors in Categories 1, 2, and 3 as indicative of failure to correctly ex-ploit representational correspondence. Representational correspondence means that an objectin the real world corresponds to a symbol on the map, and all instances of the same type of ob-ject in the real world are shown on the map with the same symbol.

“stand-for relationship” or “representational correspondence” (Liben & Downs,1989, 1993) between something in the real world and the type of symbol that isused to represent that type of thing on the map.
Error Types 4 and 5 are more subtle errors (see Figure 4). In each case, the stu-dent has placed the sticker on the correct type of symbol: For example, a stickercorresponding to a flag on a building is placed on a building symbol on the map.However, in Error Type 4, the sticker is on the wrong symbol, for example, thewrong building. In Error Type 5, the sticker is on the right symbol, but on thewrong part of the symbol. Error Types 4 and 5 are intended to capture circum-stances in which the student has correctly understood the representational corre-spondence between map and environment but has failed to use the configuration offeatures on the map to successfully disambiguate multiple occurrences of the samesymbol on the map or to pinpoint location within a large map symbol.
CHILDREN’S PERFORMANCE ON A FIELD MAP TASK 55
FIGURE 3 Continued.

A sticker was classified as a “no error” response if it fell within two stickerdiameters of the correct placement, which corresponds to 16 mm on the map orapproximately 15 m on the ground. If map readers were using the map for navi-gation to reach a destination, by the time they had come this close to the target,they would likely switch from using the map to scanning the terrain for the desti-nation; thus, this two-sticker-diameter criterion can be read as “close enough”for personal navigation.
This categorization was implemented by defining fields within the GIS sys-tem, so that we were able to iterate through multiple definitions of the responsetypes until we felt satisfied that each was internally consistent. The final set offields incorporated a 0.5-sticker-diameter buffer around each built object (struc-
56 KASTENS AND LIBEN
FIGURE 4 We interpret errors in Categories 4 and 5 as indicative of failure to correctly ex-ploit configurational correspondence. Configurational correspondence means that the relativeplacement or arrangement of objects in the real world (i.e., their “configuration”) is the same asthe arrangement of the corresponding symbols on the map.

ture, road, or path) so that a sticker was counted as being “on” the object if thecenter of the sticker was within half a sticker diameter of the object, that is, ifthe edge of the sticker overlapped the object. The GIS fields for each responsetype for each flag are shown in Figure 5. This coding scheme is similar in spiritand intent, but differs in detail, from the manual coding scheme described inKastens et al. (2001).
The clue answers written by the explaining students were typed up and codedwith respect to the following questions: (a) Is the clue answer an accurate or inac-curate description of the environment? (b) Does the clue answer describe one ormore objects that exist both on the map and in the real world? (c) Does the clue an-swer contain sufficient detail to pinpoint the flag location? Details of the students’clue answers will be reported in a separate paper.
CHILDREN’S PERFORMANCE ON A FIELD MAP TASK 57
FIGURE 4 Continued.

Explaining Versus Baseline Students’ Flag-StickerPerformance
Maps showing sticker placements for baseline and explaining groups are presentedin Figure 5. Visual comparison of the left and right panels of the figure shows thatthe group of students who explained their reasoning placed their stickers far moreaccurately than did the group who did not.
58 KASTENS AND LIBEN
FIGURE 5 Maps showing the locations of all student stickers relative to the correct locationand relative to the response type regions. For each flag, the stickers of the baseline students(left-hand map of each pair) are more scattered than the stickers of the explaining students(right-hand map). To show all of the data, the dots on these maps are smaller than the stickersplaced by the students. The numbered regions show the GIS-based fields corresponding to eachresponse type for each flag. VC refers to the name of the school.

To quantify the students’ responses, we first calculated the offset distance be-tween each student sticker and the corresponding correct location, and then aver-aged across all eight stickers to compute an “average offset score” for each stu-dent, in units of sticker diameters. Note that on this measure, higher scoresindicate worse performance. To visualize the magnitude of these sticker-diame-ter offsets, refer to Figure 2. Figure 6 provides histograms for sticker-diameteroffset score. The baseline group includes many extremely poor scores (very highsticker-diameter offsets), whereas this tail of poor performers is absent in the ex-plaining group.
CHILDREN’S PERFORMANCE ON A FIELD MAP TASK 59
FIGURE 5 Continued.

Average offset scores served as the dependent variable in a Group (baseline, ex-plaining)×Sexanalysisofvariance (ANOVA).Themaineffectofgroupwassignifi-cant,F(1,129)=23.20,p<.001,withchildren in thebaselinegrouphaving largerav-erage errors than children in the explaining group, means (standard deviations),respectively, of 4.9 (3.1) versus 2.2 (1.5) sticker diameters. There was neither a sig-nificant main effect for sex nor a significant interaction between sex and group.
The GIS-derived data are summarized in Table 2, which shows the mean num-ber of stickers that the students placed in each response category. Category 1, 2,and 3 responses are the most serious kinds of errors. These errors were collapsedinto a total representational correspondence error score, which was then analyzed
60 KASTENS AND LIBEN
FIGURE 5 Continued.

with a Group (baseline vs. explaining) × Sex ANOVA. There was a significantmain effect of group, F(1, 129) = 8.12, p = .005, with a greater number of represen-tational correspondence errors in the baseline group than in the explaining group,means (standard deviations), respectively, of 1.79 (1.59) versus 0.88 (1.04) stick-ers. There was also a significant main effect for sex, F(1, 129) = 5.18, p = .025,with boys making a greater number of these errors than girls, with means (standarddeviations), respectively, of 1.87 (1.78) versus 1.29 (1.21). There was no signifi-cant interaction between group and sex.
The intermediate category of configurational correspondence errors also con-tains fewer errors among children in the explaining group than among those in the
CHILDREN’S PERFORMANCE ON A FIELD MAP TASK 61
FIGURE 5 Continued.

baseline group (see Table 2). However, this measure is ambiguous and is not fur-ther analyzed because an intervention that successfully improved map-using per-formance would move some answers into this category from the representationalcorrespondence category and other answers out of this category into the no-errorcategory.
62 KASTENS AND LIBEN
FIGURE 6 Histograms comparing performance of the baseline group and the explaininggroup on the average offset measure. The scale is in sticker diameters; see Figure 2 for size ofstickers relative to the map features. On this measure, lower scores represent better perfor-mance. The baseline group has a long tail of poor performers that is not present in the explaininggroup, even accounting for the smaller sample size in the explaining group. Std. Dev. = standarddeviation.

At the other end of the response spectrum were responses that fell within twosticker diameters of the correct location. The numbers of no-error responses wereanalyzed with a parallel ANOVA. Again, there was a significant main effect ofgroup, F(1, 129) = 14.71, p < .001, with the number of no-error responses beingsignificantly lower in the baseline than the explaining groups, means (standard de-viations), respectively, of 4.04 (1.70) versus 5.35 (1.43). There was neither a maineffect of sex nor an interaction between group and sex.
Both groups of students were told that there was no time limit and encouragedto take as long as they needed with each flag, but the explaining students spontane-ously elected to spend longer at each flag. We did not time the students individu-ally, but at the group level we noted that the time from the launch of the first studentto the return of the last student was approximately 45 min for the explainingclasses versus 15 to 20 min for baseline classes. The extra time was longer thanwould be required just to write down the fairly short clue answers, which averaged11 words each. Students were observed to use this extra time to look around, pause,write a few words, look back at the flag, look around some more, and write somemore.
DISCUSSION
Possible Causes for Superior Performance of Explainers:Motivation and Metacognition
Children who were required to explain what clues they had used to place eachsticker performed significantly better, as a group, on our field-based map skillstask than did children who performed the task without explaining their reasoning.
CHILDREN’S PERFORMANCE ON A FIELD MAP TASK 63
TABLE 2Mean Number of Stickers Per Student in Each Response Category
Baseline Explaining
Response Group Response Type M SD M SD
Representational Correspondence Errors 1 0.06 0.24 0.06 0.242 1.17 1.36 0.38 0.65
3a & 3b 0.56 0.80 0.44 0.70
Configurational Correspondence Errors 4a & 4b 0.97 0.99 0.47 0.665a & 5b 1.20 0.91 1.29 1.09
No error (within 2 sticker-diameters) no error 4.04 1.70 5.35 1.43
Note. Relative to the baseline group, the explaining group placed fewer of their stickers in positionsattributed to representational correspondence errors, and more of their stickers in the no error circle.

The study was designed to avoid confounding factors that could favor the ex-plaining group. The map was the same and the flags were in the same locations.The flag-sticker task was explained to both groups using the same script andprops. The participants began in the same location (sitting on the steps of themansion facing south). The map was oriented individually for students in bothgroups. Both groups seemed to find the task interesting and enjoyable. The stu-dents were drawn from the same school, taught by the same teachers, and testedat the same point in the school year. They did not differ detectably in underlyingspatial abilities.
We consider two possible explanations of the explaining students’better perfor-mance: motivation and metacognition. First, with respect to motivation, it is possi-ble that the task in the baseline condition was not taken as seriously. Perhaps theactivity of hunting for colored flags in a park-like setting seemed more like a gamethan a cognitive challenge. In both conditions, the children’s own teacher intro-duced the activity and the experimenter and encouraged the students to do theirbest. However, the act of writing answers on paper in the explaining condition mayhave made the task seem more school-like and serious, which in turn could havemotivated some students to spend more time and try harder.
Second, with respect to metacognition, or awareness of one’s own thought pro-cesses, we note that activities that foster metacognition are associated with im-proved learning in children (Bransford, Brown, & Cocking, 2000; Donovan &Bransford, 2005; White & Frederiksen, 1998). The requirement that students writedown the clues they used may have triggered more metacognitive awareness thanoccurred when students were merely asked to put the stickers on the map. Previousstudies have found that explaining what one thinks or understands can improvelearning or problem solving, a phenomenon sometimes called the self-explanationeffect. The term self-explanation (Chi et al., 1989) or self-generated explanation(Chi & Bassok, 1989) refers to explanations generated by the learner, as contrastedwith explanations provided by the instructor, textbook, or other external source.Compared to the modest gains typical in education research, the improvements at-tributed to self-explaining are stunning; self-explainers often do twice as well asnon-self-explainers on the same task. The self-explanation effect has been docu-mented under a wide range of conditions, on tasks ranging from text reading (e.g.,Chi et al., 1994; Coleman, Brown, & Rivkin, 1997; Kintsch, 1994) to physics prob-lem solving (Chi & Bassok, 1989) to computer programming (Pirolli & Recker,1994) to spreadsheet use in accountancy (Reimann & Neubert, 2000) to experi-mental design (Lin & Lehman, 1999), and has been found for students rangingfrom middle school through college. The explanation may be spoken out loud or inone’s own head (e.g., Didierjean & Cauzinille-Marmèche, 1997) or written ortyped (e.g., Aleven & Koedinger, 2002). Self-explanation helps both when feed-back is given on the correctness of the explanation (Aleven & Koedinger, 2002)and when it is not (e.g., Chi et al., 1989, 1994).
64 KASTENS AND LIBEN
In light of the strong contrast in performance between our explaining and base-line groups, and in the context of these previous studies documenting the self-ex-planation effect, we attribute at least part of the superior performance of the ex-plaining group in our map skills study to increased metacognitive awarenessfostered by the requirement that students articulate their thought processes. Wecannot, however, disambiguate the extent to which increased motivation may alsohave played a role. It is striking that the mere act of thinking and writing about theirthought processes improved student’ thought processes. There was no interveningstep of external feedback or formative evaluation through which students couldlearn from their right and wrong answers.
Note that the students wrote down their clues after they placed each sticker.How, then, could this improve the accuracy of the stickers they had already placed?We see three possibilities: First, anticipation that they were soon going to have toprovide a written self-explanation may have caused them to begin covert self-ex-planation (Chi, 2000) during the problem-solving step, while they were examiningthe landscape, planning their answer, and poised with sticker on finger above themap. Second, if they became aware of a discrepancy between their sticker place-ment on the map and the flag location in the terrain while writing their clue answer,they could peel off the sticker and reposition it on the map. Finally, self-explainingon earlier flags may have helped them figure out strategies that they could then ap-ply to subsequent flags, such as using the pond as a landmark or using multiplelandmarks to pin down their answer.
Hypotheses for Why Self-Explaining Improves Performance
There seems to be no single, simple answer concerning why students who explaintheir thinking perform better than those who do not. Table 3 summarizes some ofthe hypotheses in the literature. Note that these ideas are not mutually exclusive.One family of hypotheses (see Table 3a) centers around the concept that self-ex-plaining helps students correct, repair, revise, or reorganize their existing knowl-edge, understanding, or mental model. For example, Chi et al. (1994) and Chi(2000) have suggested that for students learning by studying a biology textbook,self-explaining may help because it gives rise to multiple opportunities to see, andresolve, conflicts between one’s evolving mental structure and the veridical de-scription. The second family of hypotheses (see Table 3b) considers that self-ex-plaining helps students construct something new: a new problem schema, a newsituational model, new connections between broad scientific principles and indi-vidual actions. For example, Didierjean and Cauzinille-Marmèche (1997) inferredthat some students developed a new abstract problem-solving schema when theywere asked to self-explain while studying algebra problems.
The most parsimonious explanation for the superior performance of our ex-plaining students falls in the correct–repair–revise family of hypotheses. Follow-
CHILDREN’S PERFORMANCE ON A FIELD MAP TASK 65

66
TABLE 3Literature Review of Why Student Generation of Explanations Improves Learning, Understanding, or Problem Solving
Reference Name Domain/Task Interpretation
(a) Correct, repair, revise, or reorganize
Chi et al. (1989); VanLehn& Jones (1993) Gap-detection and
gap-filling
Studying worked examples of physics problems Self-explaining causes students to detect, and seek to fill,gaps in their knowledge. Self-explanation causesstudents to detect, and seek to remedy, failures of theirunderstanding.Lin & Lehman (1999)
Experimental design using controlled variablesin life sciences
DeLeeuw & Chi (2003);Chi (2000)
Mental model revisionStudying biology textbook passage on blood
circulation
Students begin with a mental model; as they read they (a)insert new information from text into model, (b) replacewrong knowledge with correct information, and (c)make inferences that address flaws in the model.
Chi et al. (1994)Conflict-detection and
resolution duringknowledge integration
Studying biology textbook passage on bloodcirculation
Integration of new and existing knowledge duringself-explaining gives rise to multiple opportunities tosee [and potentially resolve] conflicts between one’sevolving mental structure and the veridical descriptionfrom the text.
Lin & Lehman (1999) Organize thoughtsExperimental design using controlled variables
in life sciencesSelf-explaining helps students organize their thoughts,
which helps them plan and monitor their activities.
Current studyError detection &
self-correctionPinpointing map location of real world objects
in a large-scale environment
Self-explaining causes problem-solvers to recognize thatthey are making a mistake and self-correct the mistakebefore finalizing their answer.

67
(b) Construct
Didierjean &Cauzinille-Marmèche(1997)
Schema formation
Studying worked examples of factoring inalgebra
Self-explaining helps the learner to develop a new abstractproblem-solving schema.
Case-based reasoningSelf-explaining helps the learner to develop a library of
annotated, cataloged examples, which are used in latercase-based reasoning.
Reimann (1992) Analogic enhancementa Studying worked examples of physics problems
Self-explaining creates a richer, more-nuancedunderstanding of the example, which increaseslikelihood that student will retrieve the example and useit effectively when solving an analogous problem.
Aleven & Koedinger(2002)
Visual/verbal integration Solving geometry problemsHelps integrate two modes of learning: implicit visual
induction and explicit verbal knowledge acquisition.
Chi et al. (1994) Construction of newdeclarative orprocedural knowledge
Studying biology textbook passage on bloodcirculation
Self-explaining fosters construction of new knowledge,including inference rules that can be used in problemsolving, or knowledge inferences that can be used toanswer complex questions.
Chi et al. (1989); VanLehnet al. (1992)
Studying worked example of physics problems
Lin & Lehman (1999)Connect principles to
actionExperimental design using controlled variables
in life sciences
Self-explanation provides opportunities to make use ofdomain-specific knowledge to explain procedures used,and thus build connections between broad scientificprinciples and individual actions.
Kintsch (1994)Situational model
buildingReading text in science
Self-explaining helps student to combine prior and newknowledge to build a situational model (i.e., a workingmodel with which one can make inferences,explanations, and predictions).
Note. Summary of published explanations for why student generation of explanations improves learning, understanding, or problem solving. Our study falls amongthose that attribute the self-explanation effect to the enforced opportunity to correct, repair, revise, and/or reorganize one’s thinking.
aThe term analogic enhancement is from VanLehn and Jones (1993).

ing Chi et al. (1994), we hypothesize that self-explaining may cause children to no-tice a conflict between the veridical location of the flag and their model of thatlocation, that is, the sticker position on the map. They then self-correct this incipi-ent mistake to the best of their ability. Given the short time on task and the absenceof instruction or feedback, we further suggest that students achieve these self-cor-rections by activating their existing spatial and symbolic competencies, rather thanby acquiring new competencies. Students who are not encouraged to explain areless likely to make the critical comparison between their model of the flag locationand the incoming information (Chi, 2000) from the surrounding environment.
Where Was the Improvement Concentrated?
Looking at the data from the perspective of the types of errors made, the most dra-matic improvement of the explaining students relative to the baseline students oc-curred in Error Categories 1, 2, and 3, those that we attribute to failure to fully un-derstand and utilize the representational correspondence between map andrepresented space. A fourth grader, at age 9 or 10, would be expected to have a firmgrasp of representational correspondence, given that even by age 3, children typi-cally understand the general “stand-for” significance of representations (e.g.,DeLoache, 1987). From this developmental perspective, then, the surprise is notthat the explaining children avoided representational correspondence errors butthat the baseline children made such errors. We infer that self-explanation acti-vated underlying spatial and symbolic competencies pertaining to representationalcorrespondence in map use and thus allowed the explaining children to avoid er-rors in representational correspondence.
If self-explaining is indeed activating existing spatial skills, it is interesting toask whether it is doing so for both high-spatial and low-spatial children. Figure 7shows regression plots for map skills performance as a function of mental rotationscore, for both the baseline and explaining groups. Across the full range of spatialability captured by the mental rotation test, the explaining group outperformed thebaseline group. Likewise, on the water level and hidden picture spatial measures,both high- and low-spatial children in the explaining group outperformed childrenof similar spatial ability in the baseline group.
Consistency Between Self-Explanation Interpretationand Children’s Reported Clue Answers
A detailed analysis of the explaining students’ clue answers will be reported else-where as part of a study of the kinds of observations children make of map and ref-erent space while using maps. For our current focus on the distinction between thebaseline and explaining groups, the important finding about the clue answers isthat these data are consistent with the self-explanation interpretation offered ear-lier. Good clue answers were associated with more accurate sticker placements,
68 KASTENS AND LIBEN

where good clue answers are those that (a) mention at least one landmark that ex-ists in the real world and is shown on the map and (b) describe the location of theflag accurately. This observed association is consistent with the hypothesis thattask-relevant reflection on one’s own reasoning improves sticker placement (al-though it could also mean merely that children who are good at one cognitive taskare likely to be good at another).
Among the clue answers that mentioned at least one landmark that exists in thereal world and is shown on the map, we distinguish between those that contain onlytopological information (e.g., “near the mansion” for white, “on a tree” for red)and those that contain information about the spatial configuration of multiple fea-tures (e.g., “on a tree in the middle of the circle in the road” for white or “on theedge of a building; inside is a pond” for dark blue). Clue answers that contain topo-logical information are more abundant than clue answers that contain configura-tional information, which is consistent with our interpretation that self-explainingactivated students’understanding of representational correspondence more so thanconfigurational correspondence.
CHILDREN’S PERFORMANCE ON A FIELD MAP TASK 69
FIGURE 7 Regression plots for map skills performance (in sticker diameter offset) on mentalrotation score, for the baseline and explaining groups. The downward shift of the entire regres-sion curve from the baseline group to the explaining group shows that self-explanation im-proves performance across the full range of spatial abilities captured by the mental rotationsmeasure. The tighter scatter around the explaining group regression line shows that mental rota-tion score is a stronger predictor of map skills performance among the explaining group (R2 =.38) than among the baseline group (R2 = .06). This is consistent with our interpretation thatself-explanation is helping students activate their underlying spatial competencies.

Finally, we note that many stickers were placed more accurately than would bepossible if the child had been working from information in the associated clue an-swer alone. For example, one student wrote only “I walked and I spotted it [thegreen flag]” and yet placed that sticker perfectly. This is consistent with our viewthat self-explaining (externally, to an audience) serves as a thinking aid that can beuseful for mitigating certain kinds of errors in certain circumstances, but the abilityand willingness to recognize and articulate the reasoning behind one’s stickerplacement is not a necessary part of the problem-solving process.
Is This Just a Gimmick?
If self-explaining on our task merely activates existing competencies rather thanbuilding new competencies, does this mean that self-explanation during problemsolving is just a trick, a gimmick that improves tested performance without actu-ally improving students’ knowledge or ability? In part that depends on one’s viewof the pedagogical purpose of providing students with problems to solve. If prob-lems are assigned primarily to assess students’mastery of a body of content knowl-edge, then presence or absence of self-explanation could be viewed as a confound-ing factor that distorts the assessment’s validity.
If, however, it is an explicit goal of education to help students become skilledproblem solvers (Bransford et al., 2000; Hassard, 2005), then our results suggestthat all students would benefit from being taught to self-explain during and afterproblem solving. By doing so, students should be better able to apply their fullrange of competencies to any problem at hand—even to problems that bear no re-semblance to problems they have previously encountered.
New Constraints on the General Questionof How and Why Self-Explanation Works
Most prior work on the effectiveness of self-explanation has focused on verbal(e.g., Chi, 2000; Chi et al., 1994; Coleman et al., 1997; Kintsch, 1994) or quantita-tive tasks (e.g., Chi et al., 1989; Didierjean & Cauzinille-Marmèche, 1997). To-gether with the early study of Gagne and Smith (1962) and Aleven’s work on ge-ometry (summarized in Aleven & Koedinger, 2002), our work shows that elicitingself-explanations can also increase performance in spatial thinking. As discussedin detail in a recent report by the National Research Council Committee on Sup-port for Thinking Spatially (2006), spatial thinking is critical for a wide range oftasks encountered in both daily life (e.g., assembling a piece of furniture) and pro-fessions (e.g., remodeling a building or designing a garment).
Most prior work on self-explanation in the absence of feedback has examinedspoken statements. An exception is the work by Hausman and Chi (2002), in whichstudents typed their messages on a computer keyboard. Although Hausman andChi used the same materials and tasks as in the explanation-rich study of Chi et al.
70 KASTENS AND LIBEN

(1994), their participants generated very few self-explanations and achieved nomore learning than the control group. Even when participants were explicitlyprompted to explain, most statements typed were paraphrases rather than explana-tions. We note that in Hausman and Chi’s study the presented material and the stu-dent response were identical in format and locale: words on the computer screen.This similarity may have encouraged or allowed the student to create the responsefrom the presented material with minimal deep-level cognitive processing, that is,as a paraphrase. In our study, the presented material was nonverbal spatial informa-tion, and the response was verbal. To transform the presented spatial informationinto the required verbal response could not be done without significant processingof the information. It may be that requiring a transformation of format of the mate-rial (e.g., written verbal to oral verbal; spatial to written verbal) fosters the type ofmetacognition that leads to improved performance.
Previous studies documenting a self-explanation effect have usually involved ju-nior high, high school, or college students. Our finding of a self-explanation effectamong fourth graders (9 and 10 years old) raises the question of how young theself-explanation effect emerges. It seems plausible that the self-explanation effectdocumented among adolescents and adults is a continuation of the effect of “privatespeech,” which has been shown to help 3- to 10-year-olds guide themselves throughchallenging tasks (Berk, 1994; Berk & Garvin, 1984; Bivens & Berk, 1990).
Most prior work on the effectiveness of self-explanation has focused on self-ex-planation that occurs while the student is studying or practicing (e.g., Bielaczyc etal., 1995; Chi et al., 1989; Chi et al., 1994; Coleman et al., 1997; Gagne & Smith,1962; Lin & Lehman, 1999). The students’ mastery of the material was then testedduring a posttest phase when self-explanation was not monitored. Our study differsin that we examined self-explanation during problem solving, rather than duringstudying or practicing. We found a self-explanation effect when students weresolving an unfamiliar problem in the absence of external feedback about either thequality of their answers or their explanations. The fact that self-explanation seemsto help in solving novel problems without explicit instruction is a promising find-ing for a world in which novel problems abound and fostering young people’s abil-ity to innovate is seen as a national imperative (National Research Council Com-mittee on Prospering in the Global Economy of the 21st Century, 2006).
Conclusions
We have found that requiring children to explain their reasoning as they complete afield-based maps skills task improved their overall performance and decreased thefrequency of errors grounded in failure to understand the representational corre-spondence between map and referent space. We infer that the process of generatingexplanations caused children to detect discrepancies between a location in the en-vironment and the proposed corresponding location on the map; they then self-cor-rected these incipient errors by drawing on their underlying spatial competencies.
CHILDREN’S PERFORMANCE ON A FIELD MAP TASK 71

These findings accord well with prior research showing that eliciting self-gen-erated explanations from students can improve performance on tasks as diverse asreading a text about Darwinian evolution (Coleman et al., 1997), factoring algebraequations (Didierjean & Cauzinille-Marmèche, 1997), or designing an ecologicalexperiment (Lin & Lehman, 1999). Our findings add to the literature on theself-explanation effect by showing such an effect on a task that is spatial ratherthan verbal or quantitative, with participants who are elementary-school age ratherthan adolescent or adult, and in a situation where the students self-explain whileproblem solving rather than while studying or practicing.
There is growing recognition of the need to foster spatial thinking among K–12students (Liben, 2006; National Research Council Committee on Support forThinking Spatially, 2006), in light of the importance of spatial thinking in science,engineering, and everyday life. Yet there is no consensus on how this fostering canbe accomplished. Our findings suggest that one useful step would be for curricu-lum designers and teachers to structure opportunities for self-explanation into ge-ography lessons and other spatial tasks, just as math curriculum materials now rou-tinely ask students to “show your work.”
ACKNOWLEDGMENTS
This work was funded through National Science Foundation Grants ESI-01-01806and ESI-01-01758 to Kastens and Liben, respectively; however, all opinions, find-ings, and conclusions or recommendations expressed are ours and do not necessar-ily reflect the views of the National Science Foundation. This is Lamont-DohertyEarth Observatory Contribution No. 6968.
We gratefully acknowledge the assistance of Jennifer Griffith, Daniel Heuer,Toru Ishikawa, Lauren Myers, Linda Pistolesi, Elisabeth Sultzbaugh, MargaretTurrin, and Brian Verdine in acquiring, coding, and analyzing the data reported inthis article. We appreciate the insightful participation of Mrs. Davies, Mrs.Hankinson, Mrs. Kanthal, and the fourth graders of Valley Cottage ElementarySchool, Nyack School District, New York. We thank Director P. Michael Purdy forpermission to use the grounds of the Lamont-Doherty Earth Observatory.
REFERENCES
Aleven, V., & Koedinger, K. (2002). An effective metacognitive strategy: Learning by doing and ex-plaining with a computer-based cognitive tutor. Cognitive Science, 26, 147–179.
Berk, L. A., & Garvin, R. A. (1984). Development of private speech among low-income Appalachianchildren. Developmental Psychology, 20, 271–286.
Berk, L. E. (1994, November). Why children talk to themselves. Scientific American, 271, 78–83.Bielaczyc, K., Pirolli, P., & Brown, A. L. (1995). Training in self-explanation and self-regulation strate-
gies: Investigating the effects of knowledge acquisition activities on problem solving. Cognition andInstruction, 13, 221–252.
72 KASTENS AND LIBEN

Bivens, J. A., & Berk, L. A. (1990). A longitudinal study of the development of elementary school chil-dren’s private speech. Merrill-Palmer Quarterly, 36, 443–463.
Blades, M., & Spencer, C. (1994). The development of children’s ability to use spatial representations.In H. W. Reese (Ed.), Advances in child development and behavior (Vol. 25, pp. 157–199). SanDiego, CA: Academic.
Bransford, J., Brown, A. I., & Cocking, R. R. (Eds.). (2000). How people learn: Brain, mind, experi-ence, and school. Washington, DC: National Academy Press.
Chi, M. T. H. (2000). Self-explaining expository texts: The dual processes of generating inferences andrepairing mental models. In R. Glaser (Ed.), Advances in instructional psychology (pp. 161–238).Mahwah, NJ: Lawrence Erlbaum Associates, Inc.
Chi, M. T. H., & Bassok, M. (1989). Learning from examples via self explanations. In L. B. Resnick(Ed.), Knowing, learning and instruction: Essays in honor of Robert Glaser (pp. 251–282). Mahwah,NJ: Lawrence Erlbaum Associates, Inc.
Chi, M. T. H., Bassok, M., Lewis, M., Reimann, P., & Glaser, R. (1989). Self-explanations: How stu-dents study and use examples in learning to solve problems. Cognitive Science, 13, 145–182.
Chi, M. T. H., DeLeeuw, N., Chiu, M.-H., & LaVancher, C. (1994). Eliciting self-explanations im-proves understanding. Cognitive Science, 18, 439–477.
Coleman, E. B., Brown, A. L., & Rivkin, I. D. (1997). The effect of instructional explanations on learn-ing from scientific texts. Journal of the Learning Sciences, 6, 347–365.
DeLeeuw, N., & Chi, M. T. H. (2003). Self-explanation: Enriching a situation model or repairing a do-main model? In G. Sinatra & P. Pintrich (Eds.), International conceptual change (pp. 55–78).Mahwah, NJ: Lawrence Erlbaum Associates, Inc.
DeLoache, J. S. (1987). Rapid change in the symbolic functioning of very young children. Science,238, 1556–1557.
Didierjean, A., & Cauzinille-Marmèche, E. (1997). Eliciting self explanations improves problem solv-ing: What processes are involved? Cahiers de Psychologie Cognitive/Current Psychology of Cogni-tion, 16, 325–351.
Donovan, M. S., & Bransford, J. D. (Eds.). (2005). How students learn: Science in the classroom.Washington, DC: National Research Council.
Downs, R. M., & Liben, L. S. (1990). Getting a bearing on maps: The role of projective spatial conceptsin map understanding by children. Children’s Environments Quarterly, 7, 15–25.
Gagne, R. M., & Smith, E. C., Jr. (1962). A study of the effects of verbalization on problem solving.Journal of Experimental Psychology, 63, 12–18.
Hassard, J. (2005). The art of teaching science. Oxford, England: Oxford University Press.Hausmann, R. G. M., & Chi, M. T. H. (2002). Can computer interface support self-explaining? Cogni-
tive Technology, 7, 4–14.Kastens, K. A., Kaplan, D., & Christie-Blick, K. (2001). Development and evaluation of “Where Are
We?” map-skills software and curriculum. Journal of Geoscience Education, 49, 249–266.Kintsch, W. (1994). Text comprehension, memory and learning. American Psychologist, 49,
294–303.Liben, L. S. (2006). Education for spatial thinking. In W. Damon & R. Lerner (Series Eds.) & K. A.
Renninger & I. E. Sigel (Vol. Eds.), Handbook of child psychology: Vol. 4. Child psychology in prac-tice (6th ed., pp. 197–247). Hoboken, NJ: Wiley.
Liben, L. S., & Downs, R. M. (1986). Children’s production and comprehension of maps: Increasinggraphic literacy: Final report to the National Institute of Education. University Park: The Pennsylva-nia State University, Department of Psychology.
Liben, L. S., & Downs, R. M. (1989). Understanding maps as symbols: The development of map con-cepts in children. In H. W. Reese (Ed.), Advances in child development and behavior (Vol. 22, pp.145–201). New York: Academic.
Liben, L. S., & Downs, R. M. (1993). Understanding person–space–map relations: Cartographic anddevelopmental perspectives. Developmental Psychology, 29, 739–752.
CHILDREN’S PERFORMANCE ON A FIELD MAP TASK 73

Liben, L. S., & Golbeck, S. L. (1980). Sex differences in performance on Piagetian spatial tasks: Differ-ence in competence or performance? Child Development, 51, 594–597.
Liben, L. S., Kastens, K. A., & Stevenson, L. M. (2002). Real world knowledge through real-worldmaps: A developmental guide for navigating the educational terrain. Developmental Review, 22,267–322.
Liben, L. S., & Yekel, C. A. (1996). Preschoolers’ understanding of plan and oblique maps: The role ofgeometric and representational correspondence. Child Development, 67, 2780–2796.
Lin, X. D., & Lehman, J. D. (1999). Supporting learning of variable control in a computer-based biol-ogy environment: Effects of prompting college students to reflect on their own thinking. Journal ofResearch in Science Teaching, 36, 837–858.
Linn, M. C., & Petersen, A. C. (1985). Emergence and characterization of sex differences in spatialability: A meta-analysis. Child Development, 56, 1479–1498.
Mwangi, W., & Sweller, J. (1998). Learning to solve compare word problems: The effect of exampleformat and generating self explanations. Cognition and Instruction, 16, 173–199.
National Research Council Committee on Prospering in the Global Economy of the 21st Century.(2006). Rising above the gathering storm: Energizing and employing America for a brighter eco-nomic future. Washington, DC: National Academy Press.
National Research Council Committee on Support for Thinking Spatially. (2006). Learning to thinkspatially. Washington, DC: National Academy Press.
Piaget, J., & Inhelder, B. (1956). The child’s conception of space. London: Routledge & Kegan Paul.Pick, H. L., Heinrichs, M. R., Montello, D. R., Smith, K., Sullivan, C. N., & Thompson, W. B. (1995).
Topographic map reading. In P. A. Hancock, J. M. Flach, J. Caird, & K. J. Vincente (Eds.), Local ap-plications of the ecological approach to human–machine systems (pp. 255–284). Mahwah, NJ: Law-rence Erlbaum Associates, Inc.
Pirolli, P., & Recker, M. (1994). Learning strategies and transfer in the domain of programming. Cogni-tion and Instruction, 12, 235–275.
Reimann, P. (1992). Modeling active, hypothesis-driven learning from examples. In E. DeCorte, M.Linn, H. Mandl, & L. Verschffel (Eds.), Computer-based learning environments and problem solving(pp. 129–148). Berlin, Germany: Springer-Verlag.
Reimann, P., & Neubert, C. (2000). The role of self-explanation in learning to use a spreadsheet throughexamples. Journal of Computer Assisted Learning, 16, 316.
Siegel, A. W. (1981). The externalization of cognitive maps by children and adults: In search of ways toask better questions. In L. S. Liben, A. H. Patterson, & N. Newcombe (Eds.), Spatial representationand behavior across the life span: Theory and application (pp. 167–194). New York: Academic.
Thurstone, T. G. (1962). Primary mental abilities. Chicago: Science Research Associates.University of the State of New York, State Education Department. (2004, March 10). NY State School
Report Card: Comprehensive Information Report. Retrieved June 8, 2005, fromhttp://www.emsc.nysed.gov/repcrd2000/500304030005.pdf
VanLehn, K., & Jones, R. M. (1993). What mediates the self-explanation effect? Knowledge gaps,schemas or analogies? In M. Polsen (Ed.), Proceedings of the 15th Annual Conference of the Cogni-tive Science Society (pp. 1034–1039). Hillsdale, NJ: Lawrence Erlbaum Associates, Inc.
VanLehn, K., Jones, R. M., & Chi, M. T. H. (1992). A model of the self-explanation effect. Journal ofthe Learning Sciences, 2, 1–59.
White, B. Y., & Fredrickson, J. R. (1998). Inquiry, modeling, and metacognition: Making science ac-cessible to all students. Cognition and Science, 16, 90–91.
Witkin, H., Oltman, P., Raskin, E., & Karp, S. (1971). A manual for the Embedded Figures Tests. PaloAlto, CA: Consulting Psychologists Press.
74 KASTENS AND LIBEN