Combat to Community: Facts and Figures of Post-9/11 Veterans and their Families (April 2010)

ELEVEN FACTS ABOUT
AMERICAN FAMILIES AND WORK
October 2014

1
Contents
Introduction ........................................................................................................................................................ 2
Fact 1: Women are increasingly the household breadwinners. ......................................................................... 4
Fact 2: Fathers are increasingly family caregivers. ............................................................................................. 6
Fact 3: Women make up nearly half of today’s labor force. .............................................................................. 8
Fact 4: Women are increasingly among our most skilled workers, attaining the majority of college degrees
and deepening their work experiences. ........................................................................................................... 10
Fact 5: Women are making massive strides in the workplace but continue to earn less than men................ 12
Fact 6: Millennial women have more labor market equality than previous generations. ............................... 15
Fact 7: Most children live in households where all parents work. ................................................................... 18
Fact 8: Caregiving doesn’t end when the children are grown: eldercare is a growing responsibility of
workers. ............................................................................................................................................................ 20
Fact 9: Men and women alike face challenges as they try to balance work and family. ................................. 22
Fact 10: Many workplaces have not kept up with the needs of 21st century workers and families. ............... 24
Fact 11: Providing workplace flexibility and paid leave strengthens families, businesses, and our economy.
.......................................................................................................................................................................... 27
References ........................................................................................................................................................ 29

2
Introduction
Over the past several decades, the American workforce has fundamentally changed. Mothers have entered the workforce and fathers have increasingly taken on caregiving responsibilities. Workplaces, however, have been slower to adapt. This has set up an increasing conflict between responsibilities at home and at work for men and women struggling to make ends meet and set their children on a path to success.
In this report we lay out eleven important facts about American families and work which together illustrate the changes that are needed to ensure our long-term economic growth, maintain our economic competitiveness, improve the well-being of Americans, and make full use of all of America’s talent. The interaction between our family lives and our work lives has profound implications for our economy. Most workers have caregiving responsibilities for others—children, elderly parents, aunts or uncles, spouses, adult children with disabilities, or returning veterans needing support as they readjust to home life. Trying to balance breadwinning and caregiving responsibilities without the support of work-family policies designed to help families navigate these complexities is leaving too many families stressed, exhausted, and burdened by work-family conflict. Growth in women’s labor force participation and earnings has been essential for both family incomes and our overall economy. Without the increase in women’s labor force participation since 1970, median family income would be $14,000 less today. Without the increase in employment and hours worked among women, our overall economy would be $2 trillion dollars smaller. Yet after rising dramatically in the 1970s and 1980s, women’s labor force participation has stagnated. Significant barriers remain to further gains. Women continue to earn less than men, and despite representing an increasing share of our nation’s skilled workers, women often choose occupations that allow for part-time work and flexible schedules. Making it easier for everyone to participate in the economy to their fullest potential is an essential ingredient in economic success. For these reasons, in June the White House, the Department of Labor, and the Center for American Progress hosted the first-ever Summit on Working Families, which built on the President’s plan to improve the lives of hardworking Americans by elevating the national conversation about making today’s workplace work for everyone. With women increasingly the household breadwinners, policies to raise the minimum wage to $10.10 per hour, ensure equal pay, modernize overtime rules to restore protections to millions of Americans, and address discrimination against pregnant workers are critical to supporting the America’s working families. Efforts to ensure that all American workers have access to paid family leave, paid sick days, and flexible work arrangements will help boost business and worker productivity. Since taking office, President Obama has acted repeatedly to lift up this important conversation and promote these critical policies. The difficult choices that families face on a daily basis are intimately linked to the success of our businesses and our economy. When workers do not have consistent access to affordable child care, every day can be a struggle to meet the needs of their kids and a distraction from delivering their

3
top performance at work. When workers are choosing which companies to work for based on their family-friendly policies, the companies that adopt such policies are better able to attract and retain talent. When more companies have adopted such policies, we can make it easier for parents to participate in the labor force and increase the pace of economic growth. Only by fielding our full team will we be able to compete in a global economy in the 21st century.

4
Fact 1: Women are increasingly the household breadwinners. Mothers are bringing home more of family income than ever before. Mothers’ income is not just supplemental—it is increasingly a necessary source of funds to pay for child care, housing, transportation, and other essentials. More than 40 percent of mothers are now the sole or primary source of income for the household and about two-thirds of children live in a family with a co-breadwinner or breadwinner mother, up from less than 30 percent in 1967.1 This reflects both a rise of single mothers and the fact that more married women are out-earning their husbands.2 Overall, more than 70 percent of mothers are in the labor force, with approximately three-quarters of single mothers participating. Among married women who are working, 24 percent earn more than their husbands compared to only 7 percent in 1970.3 Growth in married women’s earnings has been an essential component of growth in family incomes with most of the growth in family income over the past several decades coming from women’s rising earnings. In 2013, the income of employed married women comprised 44 percent of their family’s income, up from 37 percent of household income in 1970.4
This has partially been because women’s real incomes have risen at a time when male income has stagnated. As a result, nearly all of the rise in family income since the 1970s has been due to women’s earnings. In fact, if women’s participation had not increased since 1970, median family
1 CEA analysis of American Community Survey. Allegretto and Filion (2011). Co-breadwinner is defined as a worker with earnings accounting for at least 25 percent of household income; breadwinner is defined as a worker with earnings accounting for at least 50 percent of household income. 2 Bureau of Labor Statistics and Census Bureau, Current Population Survey. 3 CEA analysis of Current Population Survey. 4 CEA analysis of Current Population Survey, shown in the Council of Economic Adviser’s “Women’s Participation in in Education and the Workforce” March 12, 2014.
30
32
34
36
38
40
42
44
46
1968 1974 1980 1986 1992 1998 2004 2010
Figure 1: Employed Married Women's Contribution to Family EarningsPercent
2013
Source: Current Population Survey, ASEC; CEA calculations.

5
income would be about $14,000 less than what it is today.5 Because of women’s increasing importance to their families’ financial health, policies to raise the wages of working women, such as raising the Federal minimum wage to $10.10 per hour, ending pregnancy discrimination, and increasing pay transparency, can help narrow the gender pay gap and help families overall. CEA estimates that increasing the wages of working women by 10 percent would lift nearly 1.3 million individuals out of poverty and close the gender wage gap by 8 cents.6
Survey data show that both men and women recognize how important women’s income is for families. They both increasingly think it is important that women work either full-time or part-time, regardless of their children’s ages, and decreasingly agree with the male-breadwinner model of the family.7
5 CEA analysis of Current Population Survey, Annual Social and Economic Supplement. 6 CEA Calculations using the Current Population Survey Annual Social and Economic Supplement, using median earnings of full-time, year-round workers. 7 General Social Survey, 1988, 1994, 2002, 2012; CEA calculations.
6
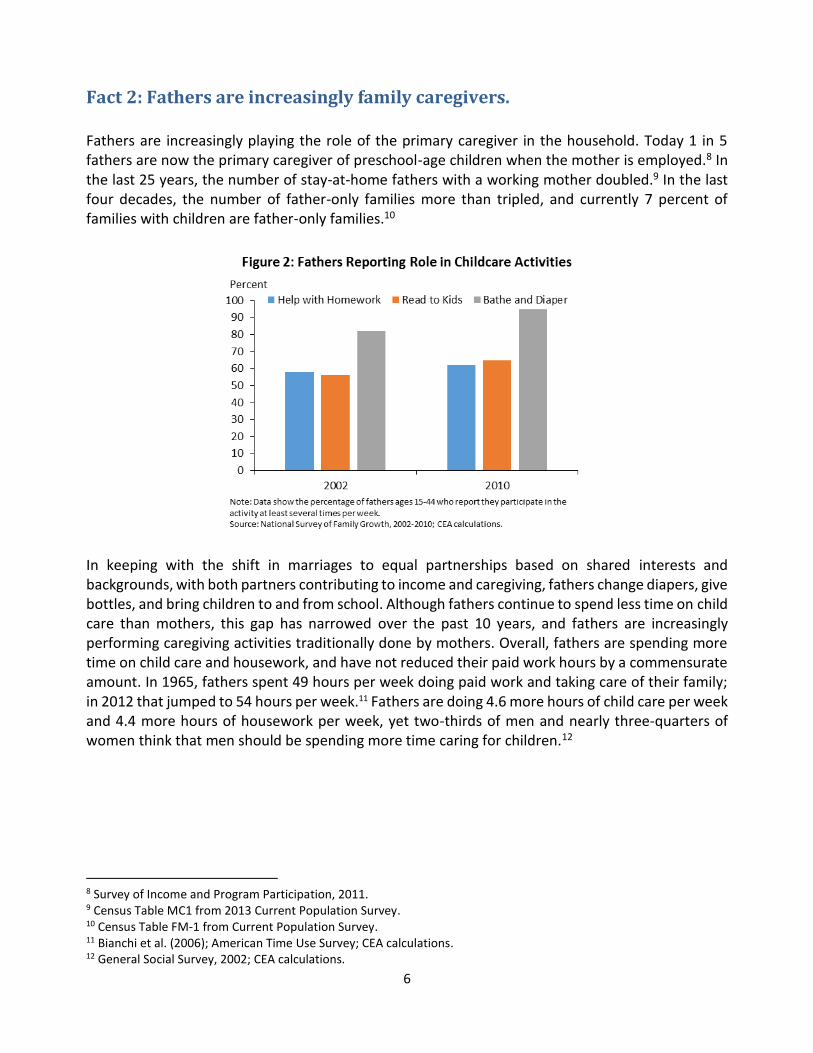
Fact 2: Fathers are increasingly family caregivers. Fathers are increasingly playing the role of the primary caregiver in the household. Today 1 in 5 fathers are now the primary caregiver of preschool-age children when the mother is employed.8 In the last 25 years, the number of stay-at-home fathers with a working mother doubled.9 In the last four decades, the number of father-only families more than tripled, and currently 7 percent of families with children are father-only families.10
In keeping with the shift in marriages to equal partnerships based on shared interests and backgrounds, with both partners contributing to income and caregiving, fathers change diapers, give bottles, and bring children to and from school. Although fathers continue to spend less time on child care than mothers, this gap has narrowed over the past 10 years, and fathers are increasingly performing caregiving activities traditionally done by mothers. Overall, fathers are spending more time on child care and housework, and have not reduced their paid work hours by a commensurate amount. In 1965, fathers spent 49 hours per week doing paid work and taking care of their family; in 2012 that jumped to 54 hours per week.11 Fathers are doing 4.6 more hours of child care per week and 4.4 more hours of housework per week, yet two-thirds of men and nearly three-quarters of women think that men should be spending more time caring for children.12
8 Survey of Income and Program Participation, 2011. 9 Census Table MC1 from 2013 Current Population Survey. 10 Census Table FM-1 from Current Population Survey. 11 Bianchi et al. (2006); American Time Use Survey; CEA calculations. 12 General Social Survey, 2002; CEA calculations.

7
With fathers spending 5.5 hours more per week on paid work, housework, and child care compared to 1965, it is no surprise that the majority of fathers are looking for a solution to work-family conflict.13 In 2008, 60 percent of fathers in dual-earner couples reported work-family conflict compared to 35 percent in 1977.14
13 All statistics from CEA analysis of 2012 American Time Use Survey. 14 Galinsky et al (2011) and Family and Work Institute (2002).
0
10
20
30
40
50
60
1965 2013Note: Fathers are defined as adult men ages 18-64 with children under 18. Source: Bianchi et al. (2006); 2013 American Time Use Survey; CEA calculations.
Hours Per Week Spent on Activity
Childcare (2.5)
Housework (4.4)
Paid Work (42.0)
Childcare (6.7)
Housework (9.7)
Paid Work (38.0)
Figure 3: Fathers' Average Weekly Time Use

8
Fact 3: Women make up nearly half of today’s labor force.
Today’s workforce is comprised more equally of men and women than in the past. Today women make up 47 percent of the labor force, compared to 38 percent in 1970.15
While women continue to work fewer hours than men on average, women are working more hours than they used to, and their share of total hours has risen over 14 percentage points since 1962.16 This growth in women’s paid work was responsible for nearly a fifth of the growth in real GDP in the 1970s and 1980s. Today, our economy is 13.5 percent larger than it would be if women were employed at the same rate and worked the same number of hours that they did in 1970. That’s an additional $2.0 trillion in GDP due to the increased attachment of women to the labor force since 1970.17 The lesson is clear: if we want to increase the pace of economic growth we should make it easier for more men and women to participate in the labor force. After rising rapidly in the 1970s and 1980s, women’s participation in the workforce has stagnated in recent decades. Indeed, over the last fifteen years, the only gains in women’s labor force participation have come from those age 55 and over. However women have continued to make gains as a share of the workforce both because the hours gap between men and women has continued to narrow and because men’s labor force participation has continued its long-run decline. In 1990, the United States ranked 7th among 24 developed countries in women’s labor force participation, but by 2012, the United States had fallen to the 16th position.18 Not unrelatedly, the 15 Bureau of Labor Statistics, Current Population Survey. These figures include individuals ages 16 and older as well as self-employed workers, who are 58 percent male. 16 CEA analysis of Current Population Survey. 17 CEA calculations. It includes the impact of increasing hours and participation. 18 OECD (2012), looking at women age 15 to 64.
0
5
10
15
20
25
30
35
40
45
50
1948 1957 1966 1975 1984 1993 2003 2012
Figure 4: Female Workers as a Share of the Workforce
Sep 2014
Source: Bureau of Labor Statistics; CEA calculations.
Percent

9
United States increasingly lags other developed countries in providing flexible work and paid leave arrangements that enable all workers to be a part of the workforce and to build long-term careers, while also providing care for their families.19
19 Blau and Kahn (2013).
50
60
70
80
90
100
1990 1994 1998 2002 2006 2010
Netherlands
Percent
Figure 5: International Comparison of Women's Labor Force Participation Rate
Germany United States
FranceCanada
Note: Data are for women ages 25-54. Workers on leave are included in the labor force.Source: International Labor Organization.
Sweden
2013

10
Fact 4: Women are increasingly among our most skilled workers, attaining
the majority of college degrees and deepening their work experiences. Women are fast becoming our most educated workers—they are attending school at higher rates, and they are entering a wide range of careers and deepening their work experience. Women’s educational attainment grew during the 1970s and 1980s, catching up with college-going rates of men. In the early 1990s, women were as likely as men to graduate college, but women’s growth in educational attainment has continued and today substantially more women than men attend and graduate college. This rise in college attendance takes time to show up in the labor force, but women’s share of the college-educated labor force is rising.
Moreover, the education pattern of young workers makes it clear that women will soon be the majority of college-educated workers. In 2014, women ages 25 to 34 were more than 20 percent more likely than men to be college graduates.20 Women are also deepening their labor market experience, closing the gap between their work experience and that of their male counterparts. In 2012, the gap in median job tenure closed for the first time since the Bureau of Labor Statistics began measuring the figure in 1983 (although it slightly reopened in 2014). Since 1983, women’s median job tenure has increased nearly 30 percent (compared with a decline of about 7 percent in men’s median job tenure).21
20 CEA analysis of Current Population Survey, Annual Social and Economic Supplement. 21 Current Population Survey, Occupational Mobility and Job Tenure.
0
10
20
30
40
50
60
1962 1969 1975 1981 1987 1993 1999 2005 2011
Bachelor's Degree
Less than Bachelor's Degree
Figure 6: Female Share of the Workforce by Educational AttainmentPercent
2014
Source: Current Population Survey, ASEC; CEA calculations.

11
Women also continue to make inroads in historically male-dominated occupations and in professional and graduate degree programs. In 1968, women made up less than 10 percent of the entering classes of MD, JD, and MBA programs, but the share of female students has grown to nearly 50 percent in each program.22 Today, female college graduates ages 30 to 34 are just as likely to be employed as doctors, dentists, lawyers, professors, managers, and scientists as they are to be employed as teachers, nurses, librarians, secretaries, or social workers. This reflects the closing of a substantial gap—women in the 1960s were 7 times more likely to be in the latter, traditionally female, occupations. Despite this progress, women have not reached parity with men in occupational choice, particularly in the most highly compensated fields. On average, women make up 56 percent of workers in the 20 lowest-paid occupations, but only 29 percent of workers in the 20 highest-paid occupations.23 Less than 20 percent of graduates in computer science and engineering are women, down from 37 percent in 1985.24 Reducing barriers to female occupational choice, including gender discrimination, would not only raise women’s earnings, but would also increase overall productivity by better matching worker skills to jobs. Recent research has shown that women can help drive innovation and better target female customers and employees.25 In addition, studies estimate that 15 to 20 percent of wage growth in the last 50 years was due to a decline in barriers to occupational choice.26
22 American Bar Association; Association of American Medical Colleges; Department of Education 23 CEA analysis. 24 Pew Research; National Science Foundation (2013). 25 Center for Talent Innovation (2013) 26 Hsieh, Hurst, Jones, and Klenow (2012)
3.0
3.5
4.0
4.5
5.0
5.5
6.0
6.5
1980 1988 1996 2004 2012
Figure 7: Median Job Tenure for Wage and SalaryWorkers Age 25 and Older
Year
Men
Women
Overall
Source: Bureau of Labor Statistics.
2014

12
Fact 5: Women are making massive strides in the workplace but continue
to earn less than men.
Women have made tremendous strides in earnings relative to men since 1960 and the gap in men’s and women’s earnings narrowed substantially in the 1970s, 1980s, and 1990s. Today among those who work full-time, year-round, the median man earns $50,033, while the median women earns $39,157.
The narrowing of the gender wage gap has been driven both by gains in women’s earnings and by stagnation in male wages. Men’s wage growth closely tracked growth in per capita GDP until the early 1970s, when growth in the earnings of men began to level off. In contrast, earnings of women have continued to rise along with growth in per capita GDP.
0
10,000
20,000
30,000
40,000
50,000
60,000
1960 1970 1980 1990 2000 2010
2013 $
Source: Census Bureau
2013Male Earnings
Female Earnings
Figure 8: Male and Female Median Earnings of Full-Time, Year-Round Workers
0
50
100
150
200
250
300
350
400
1947 1957 1967 1977 1987 1997 2007
1947 = 100
Per Capita GDP
Women's Median Weekly Earnings
Men's Median Weekly Earnings
Figure 9: Per Capita GDP and Median Earnings Growth by Gender
Source: Bureau of Economic Analysis; Current Population Survey; CEA calculations.
2013

13
A variety of factors have contributed to the gains in women’s earnings. As discussed above, women are increasingly closing the gaps in education, experience, and occupational choice that contributed to substantial wage gaps in the past. However, since the labor force is made up of many generations, past gaps in education, experience, and occupational choice still contribute to the overall gender wage gap. Research confirms that factors like education and experience contributed more to gender wage gaps in the past, explaining 24 percent of the wage gap in 1979, compared to just 8 percent in 1998.27 If current trends continue, the gender wage gap will likely continue to narrow. Women now exceed men in educational attainment, a major driver of earnings, which should result in lower wage gaps going forward. Occupation also has a large impact on earnings, and although a large occupational choice gap remains, as mentioned above, occupational segregation has fallen over time.28 In addition, some of the higher paying occupations with significant representation of women are those that offer flexible work arrangements. Research shows that women often choose occupations that allow for part-time work and flexible schedules, such as obstetrics and pharmacy.29 Contrary to the perception that some careers cannot accommodate caregivers, studies suggest that industries and occupations can adapt and become more flexible over time.30 Therefore, increasing workplace flexibility could reduce the barriers women face entering high paying occupations and continue to narrow the gender pay gap. Differences in work experience have also declined over time, and as mentioned above, today the median female worker has been with her current employer for a similar tenure as her male counterpart.31 These trends clearly point to greater gender wage convergence overall, but progress has been uneven in places. Somewhat surprisingly, progress has been slower for more skilled women. The gender wage gap is roughly consistent across educational categories, but has narrowed more in recent years among workers with less education. Earnings gaps among those with graduate and advanced degrees have proved to be more persistent and today, the largest gaps are among women with the most education.
27 Blau and Kahn (2006b). 28 Barbulescu and Bidwell (2013); Bertrand (2011); Bertrand and Hallock (2001); Blau and Kahn (2000); Blau and Kahn (2004); Blau and Kahn (2007); Daymont and Andrisani (1984); Dohmen and Falk (2011); Goldin (2013); Goldin (2014); Goldin and Polachek (1987); Gunderson (1989); Oaxaca (1973) 29 Goldin (2014). 30 Ibid. 31 However, women still have less work experience on average and as of fifteen years ago, differences in work experience could explain roughly a tenth of the gender pay gap. (Blau and Kahn 2006).

14
Moreover, the earnings gap grows over women’s lifetimes as men and women progress through their careers (Figure 11).32 Although the earnings gap starts off lower for each new group of women entering the labor force, it increases as women progress further into their careers. There are a variety of reasons for the increase in the earnings gap: Women are less likely to negotiate for raises—research shows that men initiate negotiations in their professional lives roughly four times as often as women.33 They are more likely to be passed over for promotion.34 Women are more likely to take time off to have children. Indeed, women’s earnings growth levels off after they have their first child.35 Policies such as paid family leave and flexible work arrangements can help workers maintain a connection to the labor market while they care for their families, helping to increase participation and experience over a worker’s career.36
32 CEA calculations. 33 Babcock and Laschever (2003). 34 Ibid. 35 Wilde, Batchelder, and Ellwood (2010). 36 CEA (2014b); CEA (2014c).
0
0.1
0.2
0.3
0.4
0.5
0.6
0.7
0.8
0.9
Less than HighSchool
High SchoolDegree
College Graduate
1980 1990 2013
Figure 10: Female-to-Male Earnings Ratio by Level of EducationEarnings Ratio
Source: Current Population Survey, ASEC 1981, 1991, 2014; CEA calculations.Note: Earnings gap calculated using income from wage and salary for full-time, year-round workers.
0
0.05
0.1
0.15
0.2
0.25
0.3
0.35
0.4
25 29 33 37 41 45 49
Born Between 1965 and 1970
Figure 11: Earnings Gap Over the Life-Cycle by Cohort
Born Between 1975 and 1980
Earnings Gap
Source: Current Population Survey, ASEC; CEA calculations.Note: Earnings gap calculated using average income from wage and salary for full-time, year-round workers.

15
Fact 6: Millennial women have more labor market equality than previous
generations.
Millennials37 are not only the most highly educated U.S. generation to date, but a larger share of that increase has come from the educational attainment of women. Millennial women are attending college and attaining degrees in greater numbers than in the past. Women have closed an educational attainment gap with men that dates back to World War II, as shown in Figure 12.38 In fact, starting in the late 1990s, just as the first Millennial cohorts were completing high school, women began to outpace men in completion of both four-year college degrees and post-college educational attainment.
That Millennial women on average exceed Millennial men in terms of educational attainment means that they account for an increasingly large share of our skilled workforce and enter the labor force with early career earnings and employment rates that are considerably closer to their male peers than past generations. Figure 13 shows that hourly wages, earnings, labor force participation, and employment for young women have risen relative to those for young men in every decade since 1980.
37 There is no strong consensus about how to define Millennials, though several sources attribute the word to historians Neil Howe and William Strauss, who outlined a theory of social generations in American history. 38 Goldin, Katz and Kuziemko (2006).
0
5
10
15
20
25
30
35
40
45
1964 1974 1984 1994 2004 2014
Women- At Least a Bachelor's Degree
Women- At Least Some Graduate School
Figure 12: Percent with Bachelor's Degree or Higher, Ages 25 to 34 by Gender
Men- At Least Some Graduate School
Men- At Least a Bachelor's Degree
Percent
Source: Current Population Survey, ASEC; CEA calculations.

16
Millennial women are making a strong start in the labor market because they are reaping the benefits of their greater investments in education, but Millennial women are not the only beneficiaries of their investments in education and hard work. Their higher earnings translate into greater household income for their families. This is critical to the 1 in 4 Millennial households with children where the mother is the sole breadwinner, an arrangement that is more common for Millennials, as shown in Figure 14. Women’s incomes are essential to supporting the well-being of even more families since all parents work in roughly 70 percent of Millennial households with children.39
The benefits to working for Millennial women are greater, and their incomes are more important to their families, than for past generations of American women. Young men and women recognize the
39 Current Population Survey, March Supplement 2014. CEA calculations.
00.10.20.30.40.50.60.70.80.9
1
Mean HourlyWage
Mean Earnings Labor ForceParticipation
Employed
1980 1990 2013
Source: Current Population Survey March Supplement, 1981, 1991, 2013, 2014; CEA calculations.Note: Earnings ratio is the ratio of mean wage and salary income of all workers. Hourly wage ratio is the ratio of mean hourly wages of all workers.
Figure 13: Ratio of Women's Labor Market Outcomes to Men's by Decade, Ages 18 to 34Ratio
0
5
10
15
20
25
30
1967 1971 1975 1979 1983 1987 1991 1995 1999 2003 2007 2011
x 0
.01
Figure 14: Share of Households with a Parent Age 22 to 34 with Children in Which Only the Mother is Working
Percent
Source: Current Population Survey March Supplement; CEA calculations.
2013

17
important role that women’s earnings play in the household. Almost all young men and women think that women with school age children should work and more than half think that women should work when they have children younger than school age.40 However, there is a large gap in the views of men and women. The share of women who think that women should work while they have pre-school aged children has grown rapidly in recent years. Focusing on young women ages 18 to 22 reveals that as of 2002, 82 percent believed that women with young children should work. Men’s attitudes have moved less in recent years and remain below that of women, with only roughly 50 percent of men agreeing. The gender disparity may reflect the fact that women recognize how difficult it is for them to reenter the labor force after stepping out for several years. Yet, both men and women, recognize the challenges of balancing work and family obligations, a factor that may influence their preferences about women working with small children.
40 General Social Survey (2002).
0
20
40
60
80
100
With a childunder school
age
Once heryoungest child
has startedschool
With a childunder school
age
Once heryoungest child
has startedschool
Female Male
1988 1994 2002
Percent
Source: General Social Survey; CEA calculations.
Figure 15: Percent Agreeing that "Women Should Work Full- or Part-Time..." Among 18 to 34 Year-Olds

18
Fact 7: Most children live in households where all parents work.
Today, across married and single parent families, all parents are working in more than 6 out of every 10 households with children, up from 4 out of 10 in 1965.41 This includes both dual-earner couples as well as single working parents, both of which have been increasing. This steady increase over the last 40 years also holds for families with kids where the youngest child is under one-year old.42
While more families have all parents in the workforce and therefore a need for child care, affordable child care has become increasingly hard to find. Child care costs have steadily increased in the last 25 years, making it harder for parents to find affordable child care when children are young and after school or when school is not in session.43
41 CEA analysis of Current Population Survey. Including biological, step, and adoptive parents. 42 Current Population Survey; CEA calculations. 43 US Census Bureau (2013).
0
10
20
30
40
50
60
70
1968 1974 1980 1986 1992 1998 2004 2010
Children of Any Age
Youngest Child Under 12 Months
Figure 16: Percent Households with Children in Which All Parents WorkPercent
2014
Source: Current Population Survey, ASEC; CEA calculations.

19
Even with affordable care, parents must be able to handle the occasional call from their child care provider telling them that they have a child too sick to stay in school or who needs to see a physician. Without workplace flexibility and a supportive work environment, it can be difficult for parents to handle these unexpected child care needs, especially since almost one-quarter of adults report that they have lost a job or were threatened with job loss for an absence due to illness or having to care for a sick child or relative.44 This problem is even more acute for low-wage workers who are the least likely to have workplace flexibility options and can least afford to take unpaid leave. Moreover, low-wage workers often face unpredictable schedules with little advance warning making it challenging to schedule even routine well-child doctor visits or teacher meetings.
44 Smith and Kim (2010).
75
85
95
105
115
125
135
145
1985 1990 1995 2000 2005 2010
Figure 17: Weekly Child Care Costs Paid by Families with Employed Mothers
2010 $
Note: Weekly expenditures among persons making child care payments for all children in family younger than 15. Source: Census Bureau.
2011

20
Fact 8: Caregiving doesn’t end when the children are grown: eldercare is a
growing responsibility of workers. There are many people who need care besides children: the elderly and those with disabilities including grown children, spouses, siblings, and returning veterans. Most people care for someone besides themselves or a child during their lifetime. Approximately 40 million Americans (16 percent of the population aged 15 and older) provide unpaid care to an elderly relative or friend each year.45 Men and women are similarly likely to be providing eldercare, 15 and 17 percent respectively, although women spend slightly more hours per week providing eldercare than men (3.5 hours a week versus 2.9).46
The majority (63 percent) of people providing unpaid eldercare have jobs, with about half of caregivers working full-time. One-fifth of eldercare givers are also caring for young children. Parents who provide eldercare have even higher rates of employment—78 percent are employed, and 62 percent work full-time.47 These members of the “sandwich generation”—those caring for elderly relatives and young children—face special challenges in balancing work and family. The percentage of households with both children under 18 and adults over the age of 64 has been rising for the past 30 years, as seen in the graph below.48 In addition, workers are also caring for relatives living outside the household—and non-household members account for the vast majority (85 percent) of all unpaid eldercare.49
45 In 2011, the American Time Use Survey began asking questions about time spent caring for older individuals. The data reported are for 2011 and 2012. 46 Bureau of Labor Statistics (2013c). 47 Bureau of Labor Statistics (2013c). 48 Current Population Survey, ASEC; CEA calculations. 49 Bureau of Labor Statistics (2013c).
0
10
20
30
40
50
60
70
80
90
100
Men Women
All Parents
Percent
Source: American Time Use Survey, 2011 and 2012
Figure 18: Percent of All Unpaid Caregivers Who Are Employed
68%59%
89%
71%

21
0
1
2
3
4
5
6
1968 1972 1976 1980 1984 1988 1992 1996 2000 2004 2008 2012
Figure 19: Share of Households with Children Under 18 and Adults Over 65Percent
2014
Source: Current Population Survey, ASEC; CEA calculations.

22
Fact 9: Men and women alike face challenges as they try to balance work
and family.
Men and women are increasingly pressed for time and, as a result, struggle to meet their work and family responsibilities. Fathers’ desires to be active caregivers and to share parenting with their partners has likely contributed to the unprecedented level of reported conflict between work and family among men. In 2008, 60 percent of fathers in dual-earner couples reported work/family conflict up from 35 percent in 1977 (a 71 percent increase in just one generation).50 This proportion surpassed the number of mothers in dual-earner couples reporting work/family conflict.
Increasingly, both men and women report that work interferes with family—not the other way around.51 In 2010, 46 percent of working men and women reported that their job demands interfered with their family life sometimes or often, up from 41 percent in 2002. In contrast, less than 30 percent reported that their family life interferes with their work life.
50 Galinsky et al. (2011). 51 King (2005).
30
35
40
45
50
55
60
65
1977 2008
Source: 2008 NSCW, FWI and 1977 QES, U.S. Department of Labor
Fathers in Dual-Earner Couples
Mothers in Dual-Earner Couples
60%
35%
41%
47%
Figure 20: Percentage of Mothers and Fathers Reporting Work-Family ConflictPercent

23
20
25
30
35
40
45
50
2002 2010Source: General Social Survey, 2002, 2010; CEA calculations.
Figure 21: Percentage of Workers Who Report Work-Family Conflict
Work interferes with family
Family interferes with work
41%
46%
29%28%

24
Fact 10: Many workplaces have not kept up with the needs of 21st century
workers and families. Workers struggling to balance their work and family obligations are increasingly choosing to work for employers that offer flexibility, and, in some cases, workers are leaving jobs that do not offer the flexibility or time off they need to address their family responsibilities. Overall, one-third of workers have passed up a job because it conflicted with family obligations, including 49 percent of working parents with kids under 18.52 Similarly, research finds that women are increasingly choosing career paths with flexibility over the year, week, and day such as dentistry, veterinary medicine, optometry, and pharmacy.53
52 Nielsen (2014). Harris Poll of 4,096 U.S. adults (aged 18+), conducted online May 27-30, 2014. 53 Goldin (2006).

25
Fathers are joining women in prioritizing jobs that allow more flexibility, require less travel, or include paid paternity leave. For example, a 2014 survey of high-skilled working fathers conducted by researchers at Boston College found that 89 percent of these fathers reported the availability of paid paternity leave as an important consideration in seeking a new job if they planned to have another child. Likewise, 95 percent of these working fathers reported that workplace flexibility policies allowing them to actively engage with their children were an important job characteristic.54 Popular rankings and lists such as the 100 Best Companies list, which is compiled each year by Working Mother Magazine to evaluate companies with over 500 employees on their workplace policies on parental leave, back-up and sick-child care, career advancement, and workplace flexibility, help working men and women identify family-friendly companies.55
The United States is the only developed country that does not have mandatory paid parental leave policies, which means that aside from a few states and municipalities that have adopted paid parental or sick leave policies, it is up to businesses to offer this important benefit. However, only 11 percent of private sector employers offer formal paid leave specifically for family reasons.56 The Family and Medical Leave Act guarantees unpaid leave, however it only covers about 60 percent of workers. 57 About half of workers believe that they could take paid leave for a family reason, although the gap between workers beliefs and employer compensation surveys suggests that this is comprised of a web of informal policies and an ability to use other forms of leave for family reasons in addition to formal employer paid leave for family reasons.58
The availability of paid leave and workplace flexibility policies varies substantially across the income distribution, and low-wage workers in particular face multiple workplace challenges, including inflexible, yet variable, schedules coupled with an abundance of part-time work. Only half of workers earning less than $540 a week (about $13.50 an hour at full-time hours) have access to any form of paid leave, compared to more than 80 percent of workers earning more than $1,230 a week ($30.75 an hour at full-time hours).59 Low-wage workers are most likely to report not being able to take unpaid leave because they cannot afford it. On the other hand, high-wage workers report being unable to take leave because they have too much work. 54 Harrington et al. (2014). 55 Working Mother Media (2013). 56 National Compensation Survey (2013). 57 Klerman, et al., (2013). 58 CEA analysis of 2011 American Time Use Survey. 59 CEA analysis of 2011 American Time Use Survey.
Reason % Paid % Unpaid
Family 48% 71%
Own Illness 53% 73%
Vacation 56% 60%
Table 1: Access to Leave
Source: ATUS 2011; CEA ca lculations .

26
Although less than half of workers currently have access to paid leave for family reasons, more than 80 percent of men, and 90 percent of women, assert that women should have access to paid maternity leave.60 About one-third of men (32 percent) and women (38 percent) report that mothers and fathers should take equal amounts of paid leave for the birth of a child.61 Finally, one additional way in which workplaces need to adapt to modern times is workplace climate. Women are leaving jobs, and in some cases careers, because of a sense of being in an uncomfortable or unsupportive environment. Fifty-six percent of women drop out of computer science professions by midcareer – double the rate of men – in some cases because they experience sexist or demeaning workplaces.62 Specifically, nearly 40 percent of women who quit science, engineering, and technology jobs cite a “hostile macho culture” as their primary reason for leaving, compared to 27 percent who cite compensation. Only about half of the women who quit jobs because of the culture continue their career in science, technology, and engineering fields.63
60 General Social Survey (2002). 61 General Social Survey (2012). The remaining two-thirds answered that women should take the majority or the entire amount of paid parental leave. 62 Hewlett at al. (2008). 63 Hewlett at al. (2008).

27
Fact 11: Providing workplace flexibility and paid leave strengthens
families, businesses, and our economy. Although workplace flexibility policies have an upfront cost, they have been shown to generate a positive return for employers. Policies that increase workplace flexibility, such as job sharing, phased retirement of older workers, flexible hours, and use of telecommuting, allow workers to continue making productive contributions to the workforce while also attending to family and other responsibilities. Having access to flexible workplaces is important to many workers: in 2006, 50 percent of men and 57 percent of women reported that workplace flexibility and flexible hours were important or very important characteristics of a job.64 Likewise, a 2011 Gallup Poll finds that having access to flexible work arrangements was highly correlated with greater worker engagement and higher well-being.65
Because they are important to workers, these policies help businesses attract and retain talent, contributing to a business’s bottom line. One study tracked the announcements of new work-life balance policies by Fortune 500 companies and found firms’ stock prices rose 0.36 percent on the days following announcements, suggesting investors believe these policies to be profitable investments. 66 A comprehensive study of 700 firms in the United States and Europe conducted by business management researchers found that work-life balance policies are positively associated with good management.67 In addition, a randomized evaluation found that when call center employees were allowed to work from home, there was a 13 percent performance increase.68 Research suggests that both employees and employers can benefit from higher wages, better 64 General Social Survey (2006). 65 Harter and Agrawal (2013). 66 Arthur (2003). Similar findings have been documented over a longer time period. See Edmans (2011). 67 Bloom et al (2006). 68 Bloom et al (2013).
Benefits Companies
Increases productivity
Helps recruit more talented workers
Lowers worker turnover and replacement costs
Reduces Absenteeism
Boosts profits and cuts costs
Benefits Shareholders
Lifts a company's stock price when announced
Shares outperform over the long-term
Benefits Workers
Improves job satisfaction
Alleviates challenges affecting work-family balance
Table 2: Studies Show that Increasing Paid Leave and Flexibility…

28
training, and benefits. Costco pays its employees about 40 percent more than its competitors, but Costco employees sell $986 per square foot, as compared to $588 per square foot at their largest competitor.69 Additionally, a survey of 253 employers affected by California’s paid leave program, which offers almost all private sector workers up to 6 weeks of paid leave, found that over ninety percent of employers reported either a positive effect on profitability, turnover, and morale or reported no noticeable impact.70 Because many employers may not have accurate information about the costs and benefits of workplace flexibility practices and because some of the benefits may extend beyond the individual employer and its workers, wider adoption of such policies and practices likely offers more benefits to firms, workers, and the U.S. economy than employers may realize. With women and men increasingly sharing breadwinning and caregiving responsibilities, today’s working families need a modern workplace—one with workplace flexibility, paid leave, and quality child and eldercare. Such policies are beneficial for the economy as they lead to higher labor force participation, greater labor productivity and work engagement and better allocation of talent across the economy. The International Monetary Fund and the Organization for Economic Cooperation and Development have both identified child care policies and paid leave as important drivers of female labor force participation.71 These policies are also essential for long run growth as they allow for better bonding between parents and children which has been shown to lead to better outcomes for the kids as adults. Researchers have shown that children of women who receive paid maternity leave can earn on average 5 percent higher wages at age 30.72 More broadly, closing the male-female employment gap would raise GDP by 9 percent.73 Especially as the United States rebuilds after the Great Recession, it is critical for the 21st century U.S. workplace to be organized for the 21st century workforce.
69 Ton (2012). 70 Appelbaum and Milkman (2011). 71 Elborgh-Woytek et al. (2013). 72 Carneiro et al. (2011). 73 CEA calculation. Other studies find similar results—see Aguirre et al. (2012) and Goldman Sachs (2007).

29
References Aguirre, DeAnne, Leila Hoteit, Christine Rupp and Karim Sabbagh. 2012. “Empowering the Third Billion:
Women and the World of Work in 2012.” Booz & Company Inc. Allegretto, Sylvia and Kai Filion. 2011. “Waiting for Change: The $2.13 Federal Subminimum Wage,”
Economic Policy Institute and Center on Wage and Employment Dynamics, Briefing Paper #297. Appelbaum, Eileen and Ruth Milkman. 2011. “Paid Family Leave Pays Off in California.” Harvard Business
Review Blog Network. http://blogs.hbr.org/2011/01/paid-family-leave-pays-off-in. Arthur, Michelle. 2003. “Share Price Reactions to Work-Family Initiatives: An Institutional Perspective.”
Academy of Management Journal 46, no. 4: 497-505. Babcock, Linda, and Sara Laschever. 2003. "Women don’t ask." Negotiation and the Gender Divide,
Princeton University Press, Princeton. Barbulescu, Roxana, and Matthew Bidwell. 2013. "Do women choose different jobs from men?
Mechanisms of application segregation in the market for managerial workers." Organization Science 24, no. 3: 737-756.
Bertrand, Marianne. 2011. "New perspectives on gender." Handbook of labor economics 4: 1543-1590. Bertrand, Marianne, and Kevin F. Hallock. 2001. “The gender gap in top corporate jobs.” Industrial and
Labor Relations Review, Vol. 55, no. 1 (October): 3-21. Bianchi, S. M., J.P Robinson and M Milkie. 2006. Changing Rhythms of American Family Life. New York:
Russell Sage Foundation. Blau, Francine D., and Lawrence M. Kahn. 2000. “Gender Differences in Pay.” Journal of Economic
Perspectives 14, no. 4: 75-99. Blau, Francine D., and Lawrence M. Kahn. 2003. “Understanding International Differences in the Gender
Pay Gap.” Journal of Labor Economics 21, no. 1: 106-44. Blau, Francine D., and Lawrence M. Kahn. 2004. “The US gender pay gap in the 1990s: Slowing
convergence.” No. w10853. National Bureau of Economic Research. Blau, Francine D., and Lawrence M. Kahn. 2006. The Gender Pay Gap: Going, Going … But Not Gone. In
The Declining Significance of Gender?, edited by Francine D. Blau, Mary C. Brinton, and David B. Grusky, 37–66. New York: Russell Sage Foundation.
Blau, Francine D., and Lawrence M. Kahn. 2007. “The Gender Pay Gap: Have Women Gone as Far as They Can?” Academy of Management Perspectives 21, no. 1: 7-23.
Bloom, Nick, Tobias Krestchmer, and John Van Reenen. 2006. “Work-Life Balance, Management Practices and Productivity.” Centre for Economic Performance, London School of Economics.
Bloom, Nicholas, James Liang, John Roberts, and Zhichun Jenny Ying. 2013. “Does Working from Home Work? Evidence from a Chinese Experiment,” NBER Working Paper 18871.
Boushey, Heather, Sarah Jane Glynn and Ann O’Leary. 2013. “Our Working Nation in 2013.” Center for American Progress.
BLS (Bureau of Labor Statistics). 2014. “Labor Force Statistics from the Current Population Survey: May Supplement.” US Department of Labor.
_____. 2013a. “Paid Leave in Private Industry Over the Past 20 Years.” US Department of Labor. _____. 2013b. “Recent College Graduates in the U.S. Labor Force: Data from the Current Population
Survey.” Monthly Labor Review. _____. 2013c. “Unpaid Eldercare in the United States 2011-2012: Data from the American Time Use
Survey.” US Department of Labor. _____. 2011. “Access to and Use of Leave 2011: Data from the American Time Use Survey.” UfildS
Department of Labor.

30
Carneiro, Pedro, Katrine V. Loken and Kjell G. Salvanes. 2011. “A Flying Start? Maternity Leave Benefits and Long Run Outcomes of Children.” Institute for the Study of Labor (IZA) Discussion Paper 5793.
Copeland, Craig. 2012. “Employee Tenure Trends: 1983-2012.” Employee Benefit Research Institute. http://www.ebri.org/pdf/notespdf/EBRI.Notes.Dec12.Tenure-Only1.pdf.
Council of Economic Advisers. 2014a. “15 Economic Facts about Millennials.” http://www.whitehouse.gov/sites/default/files/docs/millennials_report.pdf.
Council of Economic Advisers. 2014b. “The Economics of Paid and Unpaid Leave.” http://www.whitehouse.gov/sites/default/files/docs/leave_report_final.pdf.
Council of Economic Advisers. 2014c. “Work-Life Balance and the Economics of Workplace Flexibility.” http://www.whitehouse.gov/sites/default/files/docs/updated_workplace_flex_report_final_0.pdf
Daymont, Thomas N., and Paul J. Andrisani. 1984. "Job preferences, college major, and the gender gap in earnings." Journal of Human Resources: 408-428.
Dohmen, Thomas and Armin Falk. 2011. “Performance Pay and Multidimensional Sorting: Productivity, Preferences, and Gender.” The American Economic Review 101, no. 2: 556-590.
Edmans, Alex. 2011. “Does the Stock Market Fully Value Intangibles? Employee Satisfaction and Equity Prices.” Journal of Financial Economics 101: 621-640.
Elborgh-Woytek, Katrin, Monique Newiak, Kalpana Kochhar, Stefania Fabrizio, Kangni Kpodar, Philippe Wingender, Benedict Clements and Gerd Schwartz. 2013. “Women, Work and the Economy: Macroeconomic Gains from Gender Equity.” International Monetary Fund (IMF) Staff Discussion Note. https://www.imf.org/external/pubs/ft/sdn/2013/sdn1310.pdf.
Ellwood, David, Try Wilde, and Lily Batchelder. 2004. "The mommy track divides: The impact of childbearing on wages of women of differing skill levels." Harvard University, March 152.
Family and Work Institute. 2002. “Generation & Gender in the Workplace.” The American Business Collaboration. http://familiesandwork.org/downloads/GenerationandGender.pdf.
Fortin, Nicole M. 2008. "The Gender Wage Gap among Young Adults in the United States: The Importance of Money vs. People." Journal of Human Resources 43(4): 884-918.
Galinsky, Ellen, Kerstin Aumann and James T. Bond. 2011. “Times are Changing: Gender and Generation at Work and at Home.” Families and Work Institute: 2008 National Study of the Changing Workforce. (http://familiesandwork.org/downloads/TimesAreChanging.pdf).
Goldin, Claudia. 2006. “The Quiet Revolution That Transformed Women’s Employment, Education, and Family.” American Economic Review, Papers and Proceedings 96: 1–26.
Goldin, Claudia. 2013. "A pollution theory of discrimination: male and female differences in occupations and earnings." In Human Capital in History: The American Record. University of Chicago Press.
Goldin Claudia. 2014. “A Grand Gender Convergence: Its Last Chapter.” American Economic Review. 104(4):1091-1119.
Goldin, Claudia, Lawrence F. Katz, and Ilyana Kuziemko. 2006. “The homecoming of American college women: The reversal of the college gender gap.” No. w12139. National Bureau of Economic Research.
Goldin, Claudia, and Solomon Polachek. 1987. "Residual differences by sex: Perspectives on the gender gap in earnings." The American Economic Review: 143-151
Goldman Sachs. 2007. “Gender Inequality, Growth and Global Ageing.” Goldman Sachs Economic Research Global Economics Paper.
Gunderson, Morley. 1989. "Male-female wage differentials and policy responses."Journal of Economic Literature: 46-72.
Harrington, Brad, Fred Van Deusen, Jennifer Sabatini Fraone and Samantha Eddy. 2014. “The New Dad: Take Your Leave.” Center for Work & Family, Carroll School of Management. Boston.

31
http://www.thenewdad.org/yahoo_site_admin/assets/docs/BCCWF_The_New_Dad_2014_FINAL.157170735.pdf.
Harter, James K and Sangeeta Agrawal. 2012. “Engagement at Work: Working Hours, Flextime, Vacation Time, and Wellbeing.” Gallup Inc.
http://www.gallup.com/strategicconsulting/157238/engagement-work-working-hours-flextime-vacation-time-wellbeing.aspx.
Hewlett, Sylvia Ann, Carolyn Buck Luce, Lisa J. Servon, Laura Sherbin, Peggy Shiller, Eytan Sosnovich and Karen Sumberg. 2008. “The Athena Factor: Reversing the Brain Drain in Science, Engineering, and Technology.” Harvard Business Review, no. 10094.
Howe, Neil, and William Strauss. 2000. “Millennials Rising: The Next Great Generation.” New York. Vintage Books.
Hsieh, Chang-Tai, Erik Hurst, Charles I. Jones and Peter J. Klenow. 2013. “The Allocation of Talent and U.S. Economic Growth.” NBER Working Paper.
Jagsi, Reshma, Kent A. Griffith, Abigail Stewart, Dana Sambuco, Rochelle DeCastro, and Peter A. Ubel. 2012. "Gender differences in the salaries of physician researchers." JAMA 307, no. 22: 2410-2417.
King, Jacque L. 2005. ”Research Review: Work-Family/Family-Work Conflict.” International Journal of Leadership Studies 1, no. 1: 102-105.
National Economic Council, Council of Economic Advisers, Domestic Policy Council and Department of Labor. 2014. “The Impact of Raising the Minimum Wage on Women.” http://www.whitehouse.gov/sites/default/files/docs/20140325minimumwageandwomenreportfinal.pdf.
National Science Foundation (NSF). 2013. “Women, Minorities, and Persons with Disabilities in Science and Engineering.” National Center for Science and Engineering Statistics. http://www.nsf.gov/statistics/wmpd/2013/pdf/nsf13304_digest.pdf.
NORC (National Data Program for the Sciences). 2002. “General Social Survey.” University of Chicago. _____. 2006. “General Social Survey.” University of Chicago. _____. 2012. “General Social Survey.” University of Chicago. Oaxaca, Ronald. 1973. "Male-female wage differentials in urban labor markets." International economic
review: 693-709. OECD (Organization for Economic Co-operation and Development). 2012. “Labor Force Participation
Rate by Sex, 15+, 15-64 and 15-24 years old.” OECD Employment Database. Paris. http://www.oecd.org/gender/data/labourforceparticipationbysex15and15-24yearsold.htm.
O'Neill, June, and Solomon Polachek. 1993. "Why the gender gap in wages narrowed in the 1980s." Journal of Labor Economics: 205-228.
Pew Research Center. 2014. “On Equal Pay Day, Key Facts about the Gender Pay Gap.” http://www.pewresearch.org/fact-tank/2014/04/08/on-equal-pay-day-everything-you-need-to-know-about-the-gender-pay-gap/.
Smith, Tom, Jibum Kim. 2010. Paid Sick Days: Attitudes and Experiences. National Opinion Research Center at the University of Chicago for the Public Welfare Foundation publication.
Ton, Zeynep. 2012. “Why “Good Jobs” are Good for Retailers.” Harvard Business Review, January-February 2012. http://hbr.org/2012/01/why-good-jobs-are-good-for-retailers/ar/1.
White House Council of Women and Girls. 2012. “Keeping America’s Women Moving Forward.” http://www.whitehouse.gov/sites/default/files/email-files/womens_report_final_for_print.pdf.
Working Mother Media. 2013. “100 Best Companies Survey.” http://www.wmmsurveys.com/2013-chart.pdf.