Elevated serum triglycerides is the strongest single indicator for the presence of metabolic...
5
BioMed Central Page 1 of 5 (page number not for citation purposes) Cardiovascular Diabetology Open Access Methodology Elevated serum triglycerides is the strongest single indicator for the presence of metabolic syndrome in patients with type 2 diabetes Maria Kompoti 2 , Anargiros Mariolis 1 , Alevizos Alevizos* 1,2,3 , Ioannis Kyriazis 2 , Ioannis Protopsaltis 2 , Eleni Dimou 2 , Ioannis Lentzas 1,2 , Dimitrios Levisianou 2 , Afroditi Gova 2 and Andreas Melidonis 2 Address: 1 Department of General Practice/Family Medicine, Health Centre of Vyronas, Athens, Greece, 2 Diabetes Center, Tzanion General Hospital, Piraeus, Greece and 3 3 korytsas str., 16231 Vyronas, Athens, Greece Email: Maria Kompoti - [email protected]; Anargiros Mariolis - [email protected]; Alevizos Alevizos* - [email protected]; Ioannis Kyriazis - [email protected]; Ioannis Protopsaltis - [email protected]; Eleni Dimou - [email protected]; Ioannis Lentzas - [email protected]; Dimitrios Levisianou - [email protected]; Afroditi Gova - [email protected]; Andreas Melidonis - [email protected] * Corresponding author Abstract Background: Patients with diabetes already fulfill one diagnostic criterion for MS according to the existing classifications. Our aim was to identify one single clinical parameter, which could effectively predict the presence of MS in patients with type 2 diabetes. Methods: We studied all patients with type 2 diabetes who attended our Diabetes Outpatient Clinic during a three-month period. Waist circumference, blood pressure and serum lipids were measured. Establishment of MS diagnosis was based a) on National Cholesterol Education Program Adult Treatment Panel III (NCEP ATP III) criteria and b) on International Diabetes Federation (IDF) criteria. Receiver operating characteristic (ROC) analysis was applied in order to identify the clinical parameter with the highest predictive capability for MS. Among the 500 participating patients (231 males, 269 females), MS was diagnosed in 364 patients (72.8%) according to the NCEP ATP III criteria and in 408 patients (81.6%) according to the IDF criteria. Results: For the NCEP ATP III classification, serum triglycerides (in the overall population), waist and HDL (in female population) demonstrated the highest predictive capability for MS (AUCs:0.786, 0.805 and 0.801, respectively). For the IDF classification, no single parameter reached an AUC > 0.800 in the overall population. In females, HDL displayed a satisfactory predictive capability for MS with an AUC which was significantly higher than the one in males (0.785 vs. 0.676, respectively, p < 0.05). Conclusion: Elevated serum triglycerides strongly indicate the presence of MS in patients with type 2 diabetes. In female patients with type 2 diabetes, central obesity was the second stronger predictor of MS besides hypertriglyceridemia. Published: 04 October 2006 Cardiovascular Diabetology 2006, 5:21 doi:10.1186/1475-2840-5-21 Received: 13 July 2006 Accepted: 04 October 2006 This article is available from: http://www.cardiab.com/content/5/1/21 © 2006 Mariolis et al; licensee BioMed Central Ltd. This is an Open Access article distributed under the terms of the Creative Commons Attribution License (http://creativecommons.org/licenses/by/2.0 ), which permits unrestricted use, distribution, and reproduction in any medium, provided the original work is properly cited.
-
Upload
maria-kompoti -
Category
Documents
-
view
212 -
download
0
Transcript of Elevated serum triglycerides is the strongest single indicator for the presence of metabolic...

BioMed CentralCardiovascular Diabetology
ss
Open AcceMethodologyElevated serum triglycerides is the strongest single indicator for the presence of metabolic syndrome in patients with type 2 diabetesMaria Kompoti2, Anargiros Mariolis1, Alevizos Alevizos*1,2,3, Ioannis Kyriazis2, Ioannis Protopsaltis2, Eleni Dimou2, Ioannis Lentzas1,2, Dimitrios Levisianou2, Afroditi Gova2 and Andreas Melidonis2Address: 1Department of General Practice/Family Medicine, Health Centre of Vyronas, Athens, Greece, 2Diabetes Center, Tzanion General Hospital, Piraeus, Greece and 33 korytsas str., 16231 Vyronas, Athens, Greece
Email: Maria Kompoti - [email protected]; Anargiros Mariolis - [email protected]; Alevizos Alevizos* - [email protected]; Ioannis Kyriazis - [email protected]; Ioannis Protopsaltis - [email protected]; Eleni Dimou - [email protected]; Ioannis Lentzas - [email protected]; Dimitrios Levisianou - [email protected]; Afroditi Gova - [email protected]; Andreas Melidonis - [email protected]
* Corresponding author
AbstractBackground: Patients with diabetes already fulfill one diagnostic criterion for MS according to theexisting classifications. Our aim was to identify one single clinical parameter, which could effectivelypredict the presence of MS in patients with type 2 diabetes.
Methods: We studied all patients with type 2 diabetes who attended our Diabetes OutpatientClinic during a three-month period. Waist circumference, blood pressure and serum lipids weremeasured. Establishment of MS diagnosis was based a) on National Cholesterol Education ProgramAdult Treatment Panel III (NCEP ATP III) criteria and b) on International Diabetes Federation (IDF)criteria. Receiver operating characteristic (ROC) analysis was applied in order to identify theclinical parameter with the highest predictive capability for MS. Among the 500 participatingpatients (231 males, 269 females), MS was diagnosed in 364 patients (72.8%) according to the NCEPATP III criteria and in 408 patients (81.6%) according to the IDF criteria.
Results: For the NCEP ATP III classification, serum triglycerides (in the overall population), waistand HDL (in female population) demonstrated the highest predictive capability for MS(AUCs:0.786, 0.805 and 0.801, respectively). For the IDF classification, no single parameter reachedan AUC > 0.800 in the overall population. In females, HDL displayed a satisfactory predictivecapability for MS with an AUC which was significantly higher than the one in males (0.785 vs. 0.676,respectively, p < 0.05).
Conclusion: Elevated serum triglycerides strongly indicate the presence of MS in patients withtype 2 diabetes. In female patients with type 2 diabetes, central obesity was the second strongerpredictor of MS besides hypertriglyceridemia.
Published: 04 October 2006
Cardiovascular Diabetology 2006, 5:21 doi:10.1186/1475-2840-5-21
Received: 13 July 2006Accepted: 04 October 2006
This article is available from: http://www.cardiab.com/content/5/1/21
© 2006 Mariolis et al; licensee BioMed Central Ltd.This is an Open Access article distributed under the terms of the Creative Commons Attribution License (http://creativecommons.org/licenses/by/2.0), which permits unrestricted use, distribution, and reproduction in any medium, provided the original work is properly cited.
Page 1 of 5(page number not for citation purposes)

Cardiovascular Diabetology 2006, 5:21 http://www.cardiab.com/content/5/1/21
BackgroundPatients with the metabolic syndrome (MS) are atincreased risk of coronary heart disease and other cardio-vascular diseases related to plaque buildups in artery walls(e.g., stroke and peripheral vascular disease) [1]. Moreo-ver MS also increases mortality from both cardiovasculardisease and all causes [2,3]. Patients with type 2 diabetesalready fulfill one of the NCEP ATP III or IDF diagnosticcriteria, while at least two more are required for the con-firmation of NCEP ATP III/M.S diagnosis, and necessarilyabdominal obesity plus one additional criterion for theIDF/MS diagnosis [4,5]. Several studies have investigatedthe role of each of the metabolic syndrome componentsin modifying cardiovascular risk in patients with type 2diabetes [6].
Our study aimed in identifying a single parameter – ofthose used for diagnosing MS according to NCEP ATP IIIand IDF classifications – which could predict the presenceof the syndrome in patients with type 2 diabetes.
Research design and methodsWe studied all patients with type 2 diabetes who attendedour Diabetes Outpatient Clinic during a three-monthperiod in 2004. Pregnant females were excluded from thestudy. Waist circumference, systolic (SBP) and diastolic(DBP) blood pressure were measured, body mass index(BMI) was estimated and blood samples were drawn forserum lipids measurement after a 12-hour fast. Establish-ment of MS diagnosis was based: a) on NCEP ATP III cri-teria [4] and b) on IDF criteria [5]. The study wasapproved by the ethical review committee of our hospital.All patients gave an informed consent.
According to the NCEP ATP III classification, MS isdefined as the presence of three or more of the followingcriteria: 1) increased waist circumference (>102 cm inmales, >88 cm in females), 2) elevated serum triglycerides(≥150 mg/dl), 3) low HDL cholesterol (<40 mg/dl inmales, <50 mg/dl in females), 4) hypertension (SBP ≥130mmHg and/or DBP ≥85 mmHg) or medical treatment ofpreviously diagnosed hypertension and 5) impaired fast-ing glucose (≥110 mg/dl). According to the new IDF defi-nition, diagnosis of MS requires central obesity (defined aswaist circumference ≥94 cm for Europid men and ≥80 cmfor Europid women, with ethnicity specific values forother groups) plus any two of the following: 1) elevatedserum triglycerides (≥150 mg/dl) or specific treatment forthis lipid abnormality, 2) low HDL cholesterol (<40 mg/dl in males, <50 mg/dl in females) or specific treatmentfor this lipid abnormality, 3) hypertension (SBP ≥130mmHg and/or DBP ≥85 mmHg) or medical treatment forpreviously diagnosed hypertension and 4) high fastingplasma glucose (≥100 mg/dl) or previously diagnosedtype 2 diabetes.
We created receiver operating characteristics (ROC) curvesof serum triglycerides, HDL, SBP, DBP and waist circum-ference for the prediction of MS and we used the areasunder the corresponding curves (area under the curve,AUC) to evaluate the predictive efficiency of each MSparameter. Statistical analysis was performed with SPSS10.0 (1999, Chicago, IL). Statistical significance was set ata level of p < 0.05. Variables with AUCs≥0.800 were con-sidered as having satisfactory predictive capability for thepresence of MS. We used the algorithms of Hanley andMcNeil for comparison of AUCs derived from differentsamples [7] or from the same sample [8]. The critical levelfor the z statistic was set at 1.96. We also tried differentcutoffs in the selected variables and estimated the corre-sponding sensitivity (SENS), specificity (SPEC), positivepredictive value (PPV) and negative predictive value(NPV). Serum HDL and waist circumference were ana-lyzed according to gender, since the cutoffs used in thetwo definitions for these variables are different in malesand females.
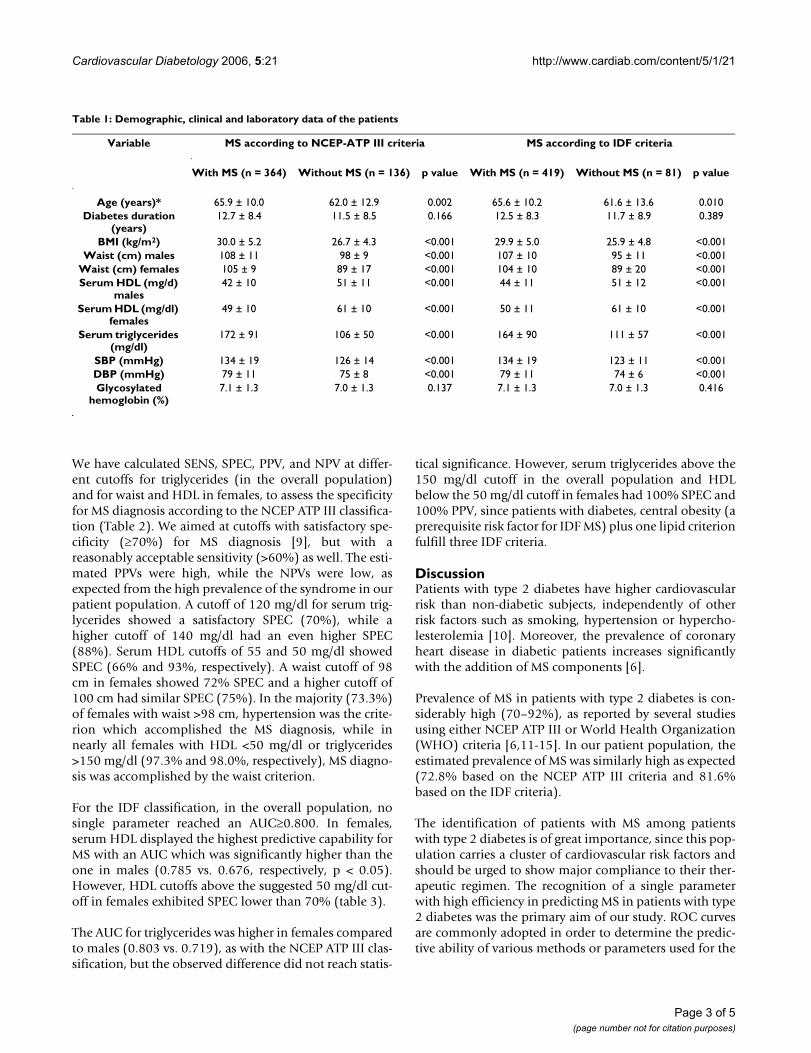
Results500 patients (231 males and 269 females) were enrolledin the study. Metabolic syndrome was diagnosed in 364patients (72.8%) according to the NCEP ATP III criteriaand in 408 patients (81.6%) according to the IDF criteria.The concordance between the two classifications wasmoderate (kappa = 0.640, p < 0.001). 10 (2.7%) of the364 patients diagnosed with MS according to the NCEPATP III classification did not fulfill the IDF criteria for MS,while 54 (13.2%) of the 408 patients diagnosed with MSaccording to the IDF classification did not fulfill the NCEPATP III criteria for MS. After stratification by gender, 213females (79.1%) and 151 males (65.4%) had MS accord-ing to the NCEP ATP III classification (p = 0.001), while232 females (86.2%) and 176 males (76.2%) had MSaccording to the IDF classification (p = 0.004). Demo-graphic and other characteristics of the patients with MSvs. those without MS according to the two classificationsare shown in table 1.
For the NCEP ATP III classification, serum triglycerides inthe overall population, and waist circumference and HDLin females had the highest predictive ability for MS(AUCs: 0.786, 0.805 and 0.801, respectively). After strati-fication by gender, the AUC for triglycerides differed sig-nificantly (0.843 in females vs. 0.744 in males, z = 2.47, p< 0.05). In younger patients (<50 years old), AUC forserum triglycerides was 0.811 [95% confidence intervals(CI) 0.685–0.939, p < 0.001]. In females, serum triglycer-ide level was a stronger predictor of MS than waist circum-ference (0.843 vs. 0.805, respectively), but the differencedid not reach statistical significance (z = 0.82, p = NS).
Page 2 of 5(page number not for citation purposes)
Cardiovascular Diabetology 2006, 5:21 http://www.cardiab.com/content/5/1/21
We have calculated SENS, SPEC, PPV, and NPV at differ-ent cutoffs for triglycerides (in the overall population)and for waist and HDL in females, to assess the specificityfor MS diagnosis according to the NCEP ATP III classifica-tion (Table 2). We aimed at cutoffs with satisfactory spe-cificity (≥70%) for MS diagnosis [9], but with areasonably acceptable sensitivity (>60%) as well. The esti-mated PPVs were high, while the NPVs were low, asexpected from the high prevalence of the syndrome in ourpatient population. A cutoff of 120 mg/dl for serum trig-lycerides showed a satisfactory SPEC (70%), while ahigher cutoff of 140 mg/dl had an even higher SPEC(88%). Serum HDL cutoffs of 55 and 50 mg/dl showedSPEC (66% and 93%, respectively). A waist cutoff of 98cm in females showed 72% SPEC and a higher cutoff of100 cm had similar SPEC (75%). In the majority (73.3%)of females with waist >98 cm, hypertension was the crite-rion which accomplished the MS diagnosis, while innearly all females with HDL <50 mg/dl or triglycerides>150 mg/dl (97.3% and 98.0%, respectively), MS diagno-sis was accomplished by the waist criterion.
For the IDF classification, in the overall population, nosingle parameter reached an AUC≥0.800. In females,serum HDL displayed the highest predictive capability forMS with an AUC which was significantly higher than theone in males (0.785 vs. 0.676, respectively, p < 0.05).However, HDL cutoffs above the suggested 50 mg/dl cut-off in females exhibited SPEC lower than 70% (table 3).
The AUC for triglycerides was higher in females comparedto males (0.803 vs. 0.719), as with the NCEP ATP III clas-sification, but the observed difference did not reach statis-
tical significance. However, serum triglycerides above the150 mg/dl cutoff in the overall population and HDLbelow the 50 mg/dl cutoff in females had 100% SPEC and100% PPV, since patients with diabetes, central obesity (aprerequisite risk factor for IDF MS) plus one lipid criterionfulfill three IDF criteria.
DiscussionPatients with type 2 diabetes have higher cardiovascularrisk than non-diabetic subjects, independently of otherrisk factors such as smoking, hypertension or hypercho-lesterolemia [10]. Moreover, the prevalence of coronaryheart disease in diabetic patients increases significantlywith the addition of MS components [6].
Prevalence of MS in patients with type 2 diabetes is con-siderably high (70–92%), as reported by several studiesusing either NCEP ATP III or World Health Organization(WHO) criteria [6,11-15]. In our patient population, theestimated prevalence of MS was similarly high as expected(72.8% based on the NCEP ATP III criteria and 81.6%based on the IDF criteria).
The identification of patients with MS among patientswith type 2 diabetes is of great importance, since this pop-ulation carries a cluster of cardiovascular risk factors andshould be urged to show major compliance to their ther-apeutic regimen. The recognition of a single parameterwith high efficiency in predicting MS in patients with type2 diabetes was the primary aim of our study. ROC curvesare commonly adopted in order to determine the predic-tive ability of various methods or parameters used for the
Table 1: Demographic, clinical and laboratory data of the patients
Variable MS according to NCEP-ATP III criteria MS according to IDF criteria
With MS (n = 364) Without MS (n = 136) p value With MS (n = 419) Without MS (n = 81) p value
Age (years)* 65.9 ± 10.0 62.0 ± 12.9 0.002 65.6 ± 10.2 61.6 ± 13.6 0.010Diabetes duration
(years)12.7 ± 8.4 11.5 ± 8.5 0.166 12.5 ± 8.3 11.7 ± 8.9 0.389
BMI (kg/m2) 30.0 ± 5.2 26.7 ± 4.3 <0.001 29.9 ± 5.0 25.9 ± 4.8 <0.001Waist (cm) males 108 ± 11 98 ± 9 <0.001 107 ± 10 95 ± 11 <0.001
Waist (cm) females 105 ± 9 89 ± 17 <0.001 104 ± 10 89 ± 20 <0.001Serum HDL (mg/d)
males42 ± 10 51 ± 11 <0.001 44 ± 11 51 ± 12 <0.001
Serum HDL (mg/dl) females
49 ± 10 61 ± 10 <0.001 50 ± 11 61 ± 10 <0.001
Serum triglycerides (mg/dl)
172 ± 91 106 ± 50 <0.001 164 ± 90 111 ± 57 <0.001
SBP (mmHg) 134 ± 19 126 ± 14 <0.001 134 ± 19 123 ± 11 <0.001DBP (mmHg) 79 ± 11 75 ± 8 <0.001 79 ± 11 74 ± 6 <0.001Glycosylated
hemoglobin (%)7.1 ± 1.3 7.0 ± 1.3 0.137 7.1 ± 1.3 7.0 ± 1.3 0.416
Page 3 of 5(page number not for citation purposes)

Cardiovascular Diabetology 2006, 5:21 http://www.cardiab.com/content/5/1/21
confirmation of a disease, a clinical characteristic or anoutcome.
In the overall population, serum triglycerides had a satis-factory predictive ability for NCEP ATP III MS, while forthe IDF classification, no single parameter reached anAUC≥0.800. Serum triglycerides in females displayed thehighest AUCs in both classifications. The predictive abilityof triglycerides for the NCEP ATP III MS was higher infemales compared to males, while for the IDF MS a similardifference did not reach statistical significance. SerumHDL proved to be useful in females for both classifica-tions, but its predictive ability in males was not satisfac-tory. A serum HDL lower than 50 mg/dl in females withdiabetes (HDL criterion fulfilled) predicted the presenceof the whole syndrome with a specificity of 92%.
Furthermore, measurement of waist circumferencealthough easily performed in every clinical setting (hospi-tal, outpatient clinic, home), proved to be more useful infemales than in males. A waist circumference of 98 cm infemales with diabetes has been proved sufficient in pre-dicting the presence of MS according to the NCEP ATP IIIclassification.
LimitationsThere were several limitations in our study. The popula-tion sample was not so large as to yield statistically signif-icant results for small differences between AUCs [7]. Inparticular, differences between clinical parameters in thesame set of patients (e.g. serum triglycerides vs. waist cir-cumference in females) should be tested with larger sam-
ples to minimize the possibility of type II error. Inaddition, our population sample was a selected one, sinceit consisted of patients who were regularly followed up inan outpatient clinic. It would be interesting to apply thesame method in patients with recently diagnosed diabetesor in patients with incidentally diagnosed diabetes from arandom population sample.
Nevertheless, the information retrieved from our studyimplies that a female with type 2 diabetes and centralobesity most probably has the entire MS according to theNCEP ATP III classification.
ConclusionElevated serum triglyceride level was the strongest singlepredictor which effectively indicated the presence of MS inboth male and female patients with type 2 diabetesaccording to the NCEP ATP III classification. In femalepatients with type 2 diabetes, central obesity as implied byan increased waist circumference was the second strongerpredictor of MS after hypertriglyceridemia.
References1. Isomaa B, Almgren P, Tuomi T, Forsen B, Lahti K, Nissen M, taskinen
MR, Groop L: Cardiovascular mortality and mortality associ-ated with the metabolic syndrome. Diabetes Care 2001,24:683-689.
2. Haffner SM: The metabolic syndrome: inflammation, diabetesmellitus, and cardiovascular disease. Am J Cardiol 2006,97(2A):3A-11A.
3. Lorenzo C, Williams K, Hunt KJ, Haffner SM: Trend in the preva-lence of the metabolic syndrome and its impact on cardio-vascular disease incidence: the San Antonio Heart Study.Diabetes Care 2006, 29(3):625-30.
4. Expert Panel on Detection, Evaluation, and Treatment ofHigh Blood Cholesterol in Adults: Executive Summary of the
Table 2: Triglyceride, HDL and waiste circumference cutoffs and respective sensitivity and specificity of MS diagnosis according to NCEP-ATP III and IDF classifications.
Cutoffs NCEP-ATP III IDF
TGC (mg/dl) SENS (%) SPEC (%) PPV (%) NPV (%) SENS (%) SPEC (%) PPV (%) NPV (%)
120 70 70 85 47 67 66 89 31130 66 77 88 46 60 71 90 29140 61 88 92 46 55 81 93 29150 53 92 95 42 47 100* 100* 21
HDL (mg/dl) Females SENS (%) SPEC (%) PPV (%) NPV (%) SENS (%) SPEC (%) PPV (%) NPV (%)50 53 93 93 34 49 100* 100* 2055 71 66 89 38 67 62 92 2960 87 48 86 50 84 31 90 31
Waist (cm) Females SENS (%) SPEC (%) PPV (%) NPV (%) SENS (%) SPEC (%) PPV (%) NPV (%)90 97 52 88 8295 83 67 90 5598 79 72 90 41 **100 71 75 90 41102 57 77 90 32
*Patients fulfill three IDF criteria.**No AUCs calculated, because central obesity is a prerequisite for MS diagnosis with IDF criteria.
Page 4 of 5(page number not for citation purposes)

Cardiovascular Diabetology 2006, 5:21 http://www.cardiab.com/content/5/1/21
Publish with BioMed Central and every scientist can read your work free of charge
"BioMed Central will be the most significant development for disseminating the results of biomedical research in our lifetime."
Sir Paul Nurse, Cancer Research UK
Your research papers will be:
available free of charge to the entire biomedical community
peer reviewed and published immediately upon acceptance
cited in PubMed and archived on PubMed Central
yours — you keep the copyright
Submit your manuscript here:http://www.biomedcentral.com/info/publishing_adv.asp
BioMedcentral
Third Report of the National Cholesterol Education Pro-gram (NCEP) Expert Panel on Detection, Evaluation, andTreatment of High Blood Cholesterol in Adults (AdultTreatment Panel III). JAMA 2001, 288:2486-2497.
5. Alberti G: Introduction to the metabolic syndrome. Eur HeartJ 2005, 7(Suppl D):3-5.
6. Alexander CM, Landsman PB, Teutsch SM, Haffner SM: NCEP-defined metabolic syndrome, diabetes, and prevalence ofcoronary heart disease among NHANES III participants age50 years and older. Diabetes 2003, 52:1210-1214.
7. Hanley JA, McNeil BJ: The meaning and use of the area under areceiver operating characteristic (ROC) curve. Radiology1982, 143:29-36.
8. Hanley JA, McNeil BJ: A method of comparing the areas underreceiver operating characteristic curves derived from thesame cases. Radiology 1983, 148:839-843.
9. Sackett DL, Hayes RB, Guyatt GH, Tugwell P: The interpretationof diagnostic data (Ch. 4). In Clinical Epidemiology: A Basic Sciencefor Clinical Medicine 2nd edition. Little, Brown and Company, BostonMA; 1991:69-152.
10. Stamler J, Vaccaro O, Neaton JD, Wentworth D: Diabetes, otherrisk factors, and 12-year cardiovascular mortality for menscreened in the Multiple Risk Factor Intervention Trial(MRFIT). Diabetes Care 1993, 16:434-444.
11. World Health Organization: Definition, Diagnosis and Clas-sification of Diabetes Mellitus and its Complications. Part I:Diagnosis and Classification of Diabetes Mellitus. Geneva,World Health Org; 1999.
12. Ford ES, Giles WH: A comparison of the prevalence of themetabolic syndrome using two proposed definitions. DiabetesCare 2003, 52:2740-2747.
13. Meigs JB, Wilson PWF, Nathan DM, D'Agostino RB, Williams K, Haff-ner SM: Prevalence and characteristics of the metabolic syn-drome in the San Antonio Heart and Framingham Offspringstudies. Diabetes 2003, 52:2160-2167.
14. Bruno G, Merletti F, Biggeri A, Bargero G, Ferrero S, Runzo C, PrinaCerai S, Pagano G, Cavallo-Perin P: Casale Monferrato Study.Metabolic syndrome as a predictor of all-cause and cardio-vascular mortality in type 2 diabetes: the Casale MonferratoStudy. Diabetes Care 2004, 27:2689-2694.
15. Bonora E, Targher G, Formentini G, Calcaterra F, Lombardi S, MariniP, Zenari L, Saggiani F, Poli M, Perbellini S, Raffaelli A, Gemma L, SantiL, Bonadonna RC, Muggeo M: The metabolic syndrome is anindependent predictor of cardiovascular disease in type 2diabetic subjects. Prospective data from the Verona Diabe-tes Complications Study. Diabet Med 2004, 21:52-58.
Page 5 of 5(page number not for citation purposes)
http://www.ncbi.nlm.nih.gov/entrez/query.fcgi?cmd=Retrieve&db=PubMed&dopt=Abstract&list_uids=7063747
http://www.ncbi.nlm.nih.gov/entrez/query.fcgi?cmd=Retrieve&db=PubMed&dopt=Abstract&list_uids=7063747
http://www.ncbi.nlm.nih.gov/entrez/query.fcgi?cmd=Retrieve&db=PubMed&dopt=Abstract&list_uids=6878708
http://www.ncbi.nlm.nih.gov/entrez/query.fcgi?cmd=Retrieve&db=PubMed&dopt=Abstract&list_uids=6878708
http://www.ncbi.nlm.nih.gov/entrez/query.fcgi?cmd=Retrieve&db=PubMed&dopt=Abstract&list_uids=6878708
http://www.ncbi.nlm.nih.gov/entrez/query.fcgi?cmd=Retrieve&db=PubMed&dopt=Abstract&list_uids=8432214
http://www.ncbi.nlm.nih.gov/entrez/query.fcgi?cmd=Retrieve&db=PubMed&dopt=Abstract&list_uids=8432214