
Elemental analysis of laser induced breakdown spectroscopy aided by an empirical spectral database
6
Elemental analysis of laser induced breakdown spectroscopy aided by an empirical spectral database Steven Rock, Aristides Marcano, Yuri Markushin, Chandran Sabanayagam, and Noureddine Melikechi* Center for Research and Education in Optical Sciences and Applications, Department of Physics and Pre-Engineering, Delaware State University, 1200 North DuPont Hwy Dover, Delaware 19901, USA *[email protected] Received 31 March 2008; revised 16 July 2008; accepted 18 July 2008; posted 21 July 2008 (Doc. ID 94512); published 10 September 2008 Laser induced breakdown spectroscopy (LIBS) is commonly used to identify elemental compositions of various samples. To facilitate this task, we propose the use of an elemental spectral library for single- pulsed, nanosecond LIBS in the spectral range 198–968 nm. This spectroscopic library is generated by measuring optical emissions from plasmas of 40 pure elements. To demonstrate the usefulness of the proposed database, we measure and analyze the LIBS spectra of pure iron and of ethanol and show that we identify these samples with a high degree of certainty. © 2008 Optical Society of America OCIS codes: 300.6365, 300.6210, 160.2120, 350.5400, 070.4790. 1. Introduction Rapid identification of the elemental composition of solid, liquid, and gas samples has become increas- ingly important in recent years in many scientific and technological fields [1]. To achieve this rapid iden- tification, techniques such as atomic absorption spec- troscopy and inductively coupled plasma atomic emission spectrometry are commonly used in many research and industrial laboratories [2]. Laser in- duced breakdown spectroscopy (LIBS) is a relatively simple optical technique that can provide the elemen- tal composition of samples. Following laser ablation of a part of the sample and following a variety of physical processes that include multiphoton absorption and io- nization, LIBS yields to chemical breakdown of the sample’ s structure and plasma formation. During its relaxation, the plasma emits optical radiation that can be measured to collect a LIBS spectrum and that in turn can be used to uniquely characterize the sam- ple [3]. LIBS has several advantages over other spec- tral techniques. It requires very little sample preparation, can be used for multielement real-time analysis, can be used for solids, liquids, and gases [3–10], and typically only requires a few micrograms of sample. Currently the limit of detection for LIBS is better than a few hundreds of parts per million (ppm) (mass to mass) depending on the element [11]. Exam- ples of the use of LIBS for the qualitative and quan- titative elemental characterization are numerous and range from investigations of the environment [12,13] and soils [14,15] to metallurgical analysis [16–19]. In the past few years, we have been pursuing re- search on the characterization of various solid and liquid organic samples. To obtain the elemental com- position of our samples, we designed and assembled an experimental LIBS setup and, like most LIBS re- searchers, use the Atomic Spectra Database (ASD) compiled by the National Institute of Standards and Technology (NIST) to assign various measured emission lines to specific elements [20]. We find that in some situations, it is possible to match measured emission lines from samples with a specific emission line listed in the NIST database. However, in many cases it is not possible to identify a given emission line using only the NIST database. This is mainly due to the two following reasons. First, the experimental conditions used to generate the ASD emission lines published by NIST are very different from those used 0003-6935/08/310G99-06$15.00/0 © 2008 Optical Society of America 1 November 2008 / Vol. 47, No. 31 / APPLIED OPTICS G99
-
Upload
noureddine -
Category
Documents
-
view
213 -
download
1
Transcript of Elemental analysis of laser induced breakdown spectroscopy aided by an empirical spectral database

Elemental analysis of laser induced breakdownspectroscopy aided by an empirical spectral database
Steven Rock, Aristides Marcano, Yuri Markushin, Chandran Sabanayagam, andNoureddine Melikechi*
Center for Research and Education in Optical Sciences and Applications, Department of Physics and Pre-Engineering, DelawareState University, 1200 North DuPont Hwy Dover, Delaware 19901, USA
Received 31 March 2008; revised 16 July 2008; accepted 18 July 2008;posted 21 July 2008 (Doc. ID 94512); published 10 September 2008
Laser induced breakdown spectroscopy (LIBS) is commonly used to identify elemental compositions ofvarious samples. To facilitate this task, we propose the use of an elemental spectral library for single-pulsed, nanosecond LIBS in the spectral range 198–968nm. This spectroscopic library is generated bymeasuring optical emissions from plasmas of 40 pure elements. To demonstrate the usefulness of theproposed database, we measure and analyze the LIBS spectra of pure iron and of ethanol and show thatwe identify these samples with a high degree of certainty. © 2008 Optical Society of America
OCIS codes: 300.6365, 300.6210, 160.2120, 350.5400, 070.4790.
1. Introduction
Rapid identification of the elemental composition ofsolid, liquid, and gas samples has become increas-ingly important in recent years in many scientificand technological fields [1]. Toachieve this rapid iden-tification, techniques such as atomic absorption spec-troscopy and inductively coupled plasma atomicemission spectrometry are commonly used in manyresearch and industrial laboratories [2]. Laser in-duced breakdown spectroscopy (LIBS) is a relativelysimple optical technique that can provide the elemen-tal composition of samples. Following laser ablation ofapart of the sample and following avariety of physicalprocesses that includemultiphotonabsorption and io-nization, LIBS yields to chemical breakdown of thesample’s structure and plasma formation. Duringits relaxation, the plasma emits optical radiation thatcan be measured to collect a LIBS spectrum and thatin turn can be used to uniquely characterize the sam-ple [3]. LIBS has several advantages over other spec-tral techniques. It requires very little samplepreparation, can be used for multielement real-time
analysis, can be used for solids, liquids, and gases[3–10], and typically only requires a few microgramsof sample. Currently the limit of detection for LIBS isbetter than a few hundreds of parts per million (ppm)(mass to mass) depending on the element [11]. Exam-ples of the use of LIBS for the qualitative and quan-titative elemental characterization arenumerousandrange from investigations of the environment [12,13]and soils [14,15] to metallurgical analysis [16–19].
In the past few years, we have been pursuing re-search on the characterization of various solid andliquid organic samples. To obtain the elemental com-position of our samples, we designed and assembledan experimental LIBS setup and, like most LIBS re-searchers, use the Atomic Spectra Database (ASD)compiled by the National Institute of Standardsand Technology (NIST) to assign various measuredemission lines to specific elements [20]. We find thatin some situations, it is possible to match measuredemission lines from samples with a specific emissionline listed in the NIST database. However, in manycases it is not possible to identify a given emission lineusing only the NIST database. This is mainly due tothe two following reasons. First, the experimentalconditions used to generate the ASD emission linespublished by NISTare very different from those used
0003-6935/08/310G99-06$15.00/0© 2008 Optical Society of America
1 November 2008 / Vol. 47, No. 31 / APPLIED OPTICS G99
to generate LIBS spectra. As stated above, in LIBS,the creation of plasma that can reach temperaturesof the order of 104 K at a pressure of 760Torr is a si-tuation far different from those underwhich theNISTdatabase is typically collected. Second, the collectionof spectroscopic data is performed at two very differ-ent resolutions. Typically, LIBS spectra are broa-dened by a myriad of effects such as power, Stark,collision, and Doppler, and as in LIBS research, itis not possible to take full advantage of the high levelof spectroscopic precision that theNISTdatabase pro-vides. As a result, in LIBS measurements, opticalemissions fromdifferent atomic and ionic species can-not always be resolved and identifiedwith ahigh levelof certainty.Using theNISTdatabase to assignanele-ment to a particular emission line often yields morethan one potential candidate. Furthermore, it is notpossible to unambiguously extract information fromratios of the strengths of various emission lines. ALIBS bibliographical database published by theUnited States Army Research Laboratory gives ex-tensive references for published work where specificelemental emission lines have been reported [21].However, only the spectra of noble gases are gener-ated from pure samples, while the rest are obtainedusing compounds.We have developed a LIBS library of pure elemen-
tal spectra. Our goal is that this library will help inthe identification of emission lines from samples ofunknown composition. In this paper, we presentthe first results for a LIBS database, composed of40 elements, and show that the use of this databasemakes identification of elements less prone to the un-certainties discussed above. To demonstrate this, weprovide analysis of two samples with known elemen-tal composition: pure iron and ethanol.
2. Materials and Methods
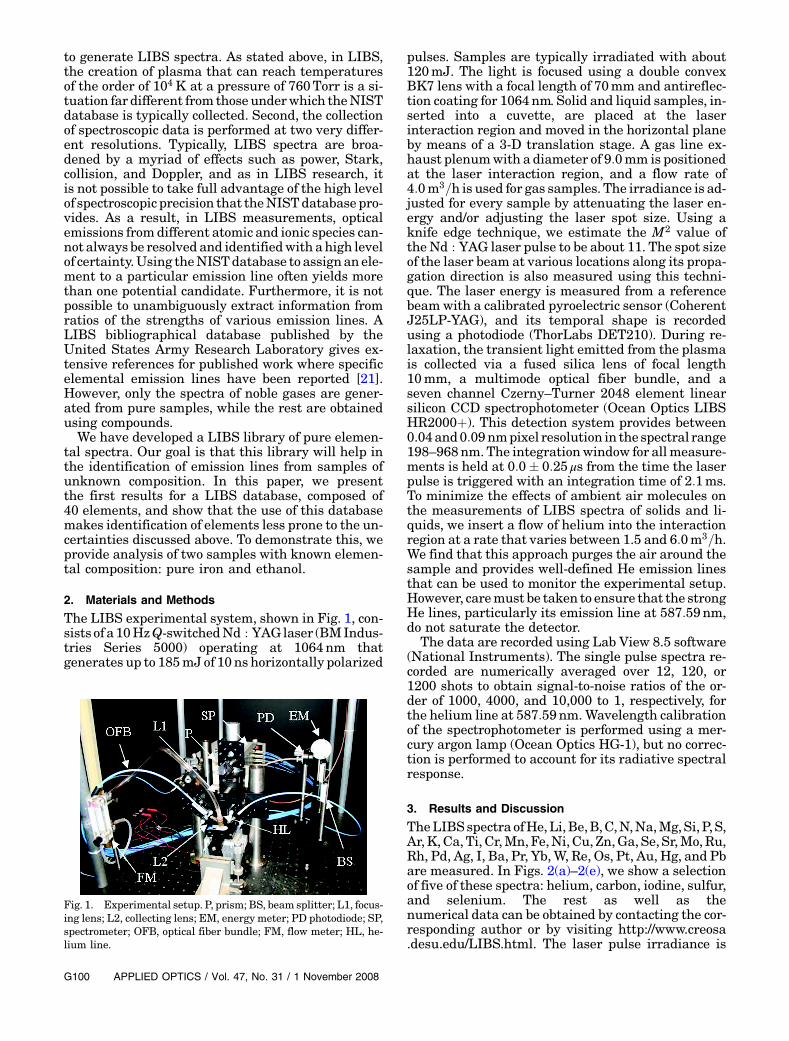
The LIBS experimental system, shown in Fig. 1, con-sists of a10HzQ-switchedNd : YAGlaser (BMIndus-tries Series 5000) operating at 1064nm thatgenerates up to 185mJof 10ns horizontally polarized
pulses. Samples are typically irradiated with about120mJ. The light is focused using a double convexBK7 lens with a focal length of 70mm and antireflec-tion coating for 1064nm. Solid and liquid samples, in-serted into a cuvette, are placed at the laserinteraction region and moved in the horizontal planeby means of a 3-D translation stage. A gas line ex-haust plenumwith a diameter of 9:0mm is positionedat the laser interaction region, and a flow rate of4:0m3=h is used for gas samples. The irradiance is ad-justed for every sample by attenuating the laser en-ergy and/or adjusting the laser spot size. Using aknife edge technique, we estimate the M2 value ofthe Nd : YAG laser pulse to be about 11. The spot sizeof the laser beam at various locations along its propa-gation direction is also measured using this techni-que. The laser energy is measured from a referencebeam with a calibrated pyroelectric sensor (CoherentJ25LP-YAG), and its temporal shape is recordedusing a photodiode (ThorLabs DET210). During re-laxation, the transient light emitted from the plasmais collected via a fused silica lens of focal length10mm, a multimode optical fiber bundle, and aseven channel Czerny–Turner 2048 element linearsilicon CCD spectrophotometer (Ocean Optics LIBSHR2000þ). This detection system provides between0.04and0:09nmpixel resolution in the spectral range198–968nm. The integrationwindow for allmeasure-ments is held at 0:0� 0:25 μs from the time the laserpulse is triggered with an integration time of 2:1ms.To minimize the effects of ambient air molecules onthe measurements of LIBS spectra of solids and li-quids, we insert a flow of helium into the interactionregion at a rate that varies between 1.5 and 6:0m3=h.We find that this approach purges the air around thesample and provides well-defined He emission linesthat can be used to monitor the experimental setup.However, caremust be taken to ensure that the strongHe lines, particularly its emission line at 587:59nm,do not saturate the detector.
The data are recorded using Lab View 8.5 software(National Instruments). The single pulse spectra re-corded are numerically averaged over 12, 120, or1200 shots to obtain signal-to-noise ratios of the or-der of 1000, 4000, and 10,000 to 1, respectively, forthe helium line at 587:59nm.Wavelength calibrationof the spectrophotometer is performed using a mer-cury argon lamp (Ocean Optics HG-1), but no correc-tion is performed to account for its radiative spectralresponse.
3. Results and Discussion
TheLIBSspectra ofHe,Li,Be,B,C,N,Na,Mg,Si, P,S,Ar,K,Ca, Ti, Cr,Mn, Fe,Ni, Cu, Zn,Ga, Se, Sr,Mo,Ru,Rh, Pd, Ag, I, Ba, Pr, Yb,W, Re, Os, Pt, Au, Hg, and Pbare measured. In Figs. 2(a)–2(e), we show a selectionof five of these spectra: helium, carbon, iodine, sulfur,and selenium. The rest as well as thenumerical data can be obtained by contacting the cor-responding author or by visiting http://www.creosa.desu.edu/LIBS.html. The laser pulse irradiance is
Fig. 1. Experimental setup. P, prism; BS, beam splitter; L1, focus-ing lens; L2, collecting lens; EM, energy meter; PD photodiode; SP,spectrometer; OFB, optical fiber bundle; FM, flow meter; HL, he-lium line.
G100 APPLIED OPTICS / Vol. 47, No. 31 / 1 November 2008
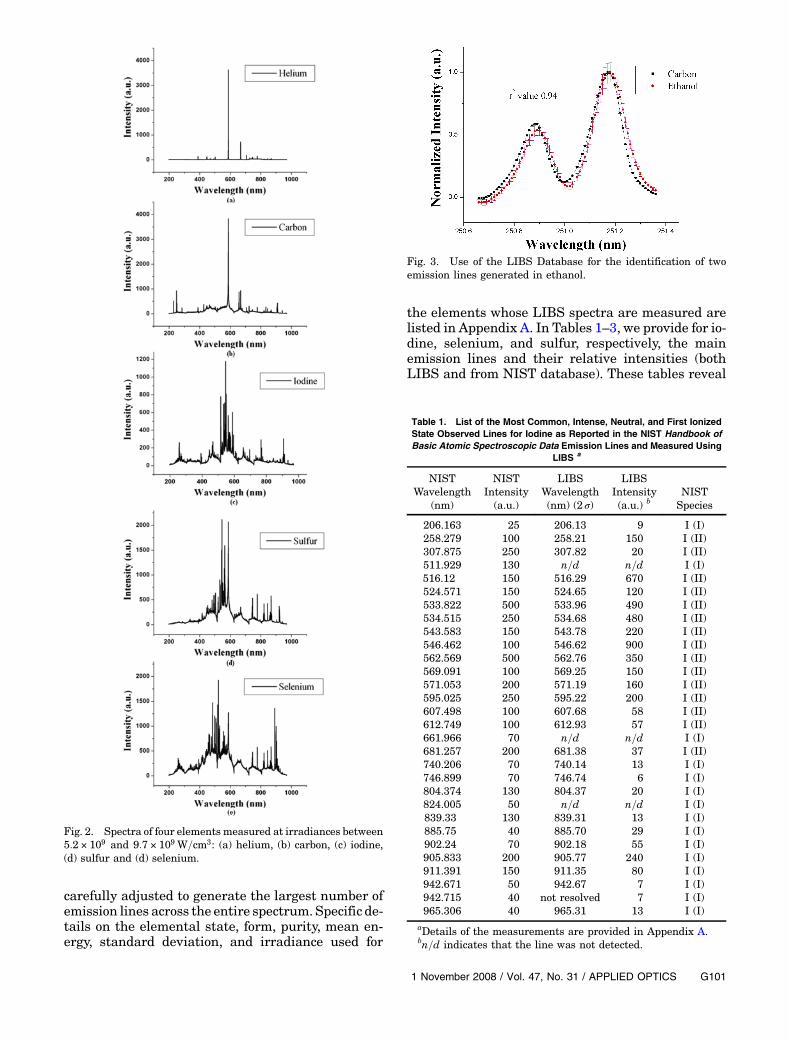
carefully adjusted to generate the largest number ofemission lines across the entire spectrum. Specific de-tails on the elemental state, form, purity, mean en-ergy, standard deviation, and irradiance used for
the elements whose LIBS spectra are measured arelisted in Appendix A. In Tables 1–3, we provide for io-dine, selenium, and sulfur, respectively, the mainemission lines and their relative intensities (bothLIBS and from NIST database). These tables reveal
Fig. 2. Spectra of four elements measured at irradiances between5:2 × 10⁹ and 9:7 × 10⁹ W=cm3: (a) helium, (b) carbon, (c) iodine,(d) sulfur and (d) selenium.
Table 1. List of the Most Common, Intense, Neutral, and First IonizedState Observed Lines for Iodine as Reported in the NIST Handbook ofBasic Atomic Spectroscopic Data Emission Lines and Measured Using
LIBS a
NISTWavelength
(nm)
NISTIntensity(a.u.)
LIBSWavelength(nm) (2 σ)
LIBSIntensity(a.u.) b
NISTSpecies
206.163 25 206.13 9 I (I)258.279 100 258.21 150 I (II)307.875 250 307.82 20 I (II)511.929 130 n=d n=d I (I)516.12 150 516.29 670 I (II)524.571 150 524.65 120 I (II)533.822 500 533.96 490 I (II)534.515 250 534.68 480 I (II)543.583 150 543.78 220 I (II)546.462 100 546.62 900 I (II)562.569 500 562.76 350 I (II)569.091 100 569.25 150 I (II)571.053 200 571.19 160 I (II)595.025 250 595.22 200 I (II)607.498 100 607.68 58 I (II)612.749 100 612.93 57 I (II)661.966 70 n=d n=d I (I)681.257 200 681.38 37 I (II)740.206 70 740.14 13 I (I)746.899 70 746.74 6 I (I)804.374 130 804.37 20 I (I)824.005 50 n=d n=d I (I)839.33 130 839.31 13 I (I)885.75 40 885.70 29 I (I)902.24 70 902.18 55 I (I)905.833 200 905.77 240 I (I)911.391 150 911.35 80 I (I)942.671 50 942.67 7 I (I)942.715 40 not resolved 7 I (I)965.306 40 965.31 13 I (I)
aDetails of the measurements are provided in Appendix A.bn=d indicates that the line was not detected.
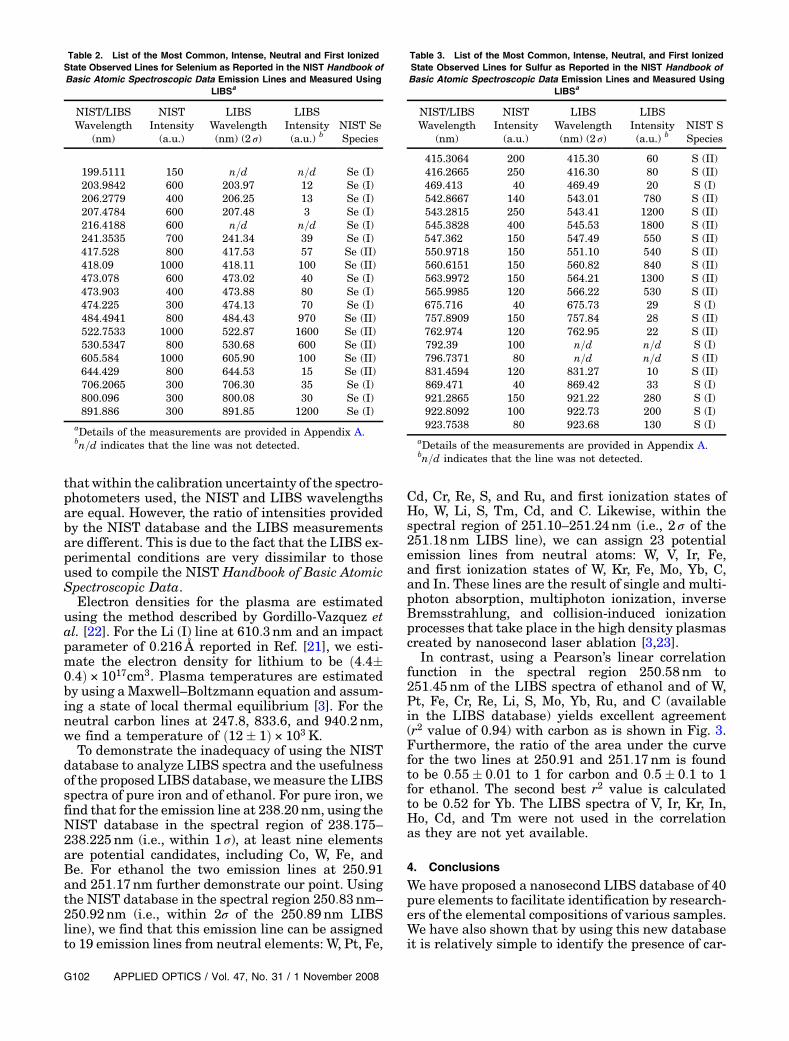
Fig. 3. Use of the LIBS Database for the identification of twoemission lines generated in ethanol.
1 November 2008 / Vol. 47, No. 31 / APPLIED OPTICS G101
that within the calibration uncertainty of the spectro-photometers used, the NIST and LIBS wavelengthsare equal. However, the ratio of intensities providedby the NIST database and the LIBS measurementsare different. This is due to the fact that the LIBS ex-perimental conditions are very dissimilar to thoseused to compile the NIST Handbook of Basic AtomicSpectroscopic Data.Electron densities for the plasma are estimated
using the method described by Gordillo-Vazquez etal. [22]. For the Li (I) line at 610:3nm and an impactparameter of 0:216Å reported in Ref. [21], we esti-mate the electron density for lithium to be ð4:4�0:4Þ × 1017cm3. Plasma temperatures are estimatedby using aMaxwell–Boltzmann equation and assum-ing a state of local thermal equilibrium [3]. For theneutral carbon lines at 247.8, 833.6, and 940:2nm,we find a temperature of ð12� 1Þ × 103 K.To demonstrate the inadequacy of using the NIST
database to analyze LIBS spectra and the usefulnessof the proposed LIBS database, wemeasure the LIBSspectra of pure iron and of ethanol. For pure iron, wefind that for the emission line at 238:20nm, using theNIST database in the spectral region of 238:175–238:225nm (i.e., within 1 σ), at least nine elementsare potential candidates, including Co, W, Fe, andBe. For ethanol the two emission lines at 250.91and 251:17nm further demonstrate our point. Usingthe NIST database in the spectral region 250:83nm–
250:92nm (i.e., within 2σ of the 250:89nm LIBSline), we find that this emission line can be assignedto 19 emission lines from neutral elements: W, Pt, Fe,
Cd, Cr, Re, S, and Ru, and first ionization states ofHo, W, Li, S, Tm, Cd, and C. Likewise, within thespectral region of 251:10–251:24nm (i.e., 2 σ of the251:18nm LIBS line), we can assign 23 potentialemission lines from neutral atoms: W, V, Ir, Fe,and first ionization states of W, Kr, Fe, Mo, Yb, C,and In. These lines are the result of single and multi-photon absorption, multiphoton ionization, inverseBremsstrahlung, and collision-induced ionizationprocesses that take place in the high density plasmascreated by nanosecond laser ablation [3,23].
In contrast, using a Pearson’s linear correlationfunction in the spectral region 250:58nm to251:45nm of the LIBS spectra of ethanol and of W,Pt, Fe, Cr, Re, Li, S, Mo, Yb, Ru, and C (availablein the LIBS database) yields excellent agreement(r2 value of 0.94) with carbon as is shown in Fig. 3.Furthermore, the ratio of the area under the curvefor the two lines at 250.91 and 251:17nm is foundto be 0:55� 0:01 to 1 for carbon and 0:5� 0:1 to 1for ethanol. The second best r2 value is calculatedto be 0.52 for Yb. The LIBS spectra of V, Ir, Kr, In,Ho, Cd, and Tm were not used in the correlationas they are not yet available.
4. Conclusions
We have proposed a nanosecond LIBS database of 40pure elements to facilitate identification by research-ers of the elemental compositions of various samples.We have also shown that by using this new databaseit is relatively simple to identify the presence of car-
Table 2. List of the Most Common, Intense, Neutral and First IonizedState Observed Lines for Selenium as Reported in the NIST Handbook ofBasic Atomic Spectroscopic Data Emission Lines and Measured Using
LIBSa
NIST/LIBSWavelength
(nm)
NISTIntensity(a.u.)
LIBSWavelength(nm) (2 σ)
LIBSIntensity(a.u.) b
NIST SeSpecies
199.5111 150 n=d n=d Se (I)203.9842 600 203.97 12 Se (I)206.2779 400 206.25 13 Se (I)207.4784 600 207.48 3 Se (I)216.4188 600 n=d n=d Se (I)241.3535 700 241.34 39 Se (I)417.528 800 417.53 57 Se (II)418.09 1000 418.11 100 Se (II)473.078 600 473.02 40 Se (I)473.903 400 473.88 80 Se (I)474.225 300 474.13 70 Se (I)484.4941 800 484.43 970 Se (II)522.7533 1000 522.87 1600 Se (II)530.5347 800 530.68 600 Se (II)605.584 1000 605.90 100 Se (II)644.429 800 644.53 15 Se (II)706.2065 300 706.30 35 Se (I)800.096 300 800.08 30 Se (I)891.886 300 891.85 1200 Se (I)
aDetails of the measurements are provided in Appendix A.bn=d indicates that the line was not detected.
Table 3. List of the Most Common, Intense, Neutral, and First IonizedState Observed Lines for Sulfur as Reported in the NIST Handbook ofBasic Atomic Spectroscopic Data Emission Lines and Measured Using
LIBSa
NIST/LIBSWavelength
(nm)
NISTIntensity(a.u.)
LIBSWavelength(nm) (2 σ)
LIBSIntensity(a.u.) b
NIST SSpecies
415.3064 200 415.30 60 S (II)416.2665 250 416.30 80 S (II)469.413 40 469.49 20 S (I)542.8667 140 543.01 780 S (II)543.2815 250 543.41 1200 S (II)545.3828 400 545.53 1800 S (II)547.362 150 547.49 550 S (II)550.9718 150 551.10 540 S (II)560.6151 150 560.82 840 S (II)563.9972 150 564.21 1300 S (II)565.9985 120 566.22 530 S (II)675.716 40 675.73 29 S (I)757.8909 150 757.84 28 S (II)762.974 120 762.95 22 S (II)792.39 100 n=d n=d S (I)796.7371 80 n=d n=d S (II)831.4594 120 831.27 10 S (II)869.471 40 869.42 33 S (I)921.2865 150 921.22 280 S (I)922.8092 100 922.73 200 S (I)923.7538 80 923.68 130 S (I)
aDetails of the measurements are provided in Appendix A.bn=d indicates that the line was not detected.
G102 APPLIED OPTICS / Vol. 47, No. 31 / 1 November 2008
bon in ethanol with a very high degree of certaintyand that the use of the NIST database for the samepurpose is not adequate. The proposed LIBS data-base is by no means complete or final but is a steptowards providing a LIBS library of various elementsandmolecules that we hope researchers will find use-ful. Furthermore, we show that using both the NISTdatabase and the LIBS database presented in thispaper, it is possible to identify elements with lessuncertainty than if the NIST database was usedby itself. This is particularly important when deter-mining the composition of complex, including im-pure, samples when multiple elements’ emissionsoverlap. This is part of our current effort.
Appendix A
Table 4 presents a list of the LIBS Spectra measured.
This research was supported by a grant from theDepartment of Defense (CDMRPaward # OC050108)and the National Science Foundation Center of Re-search Excellence in Science and Technology pro-gram (award # 0630388).
References1. K. E. Jarvis, A. L. Gray, and R. S. Houk, Handbook of Induc-
tively Coupled Plasma Mass Spectrometry (Blackie Academicand Professional, 1992).
2. P. W. J. M. Boumans, “Inductively coupled plasma-atomicemission spectroscopy: its present and future position in ana-lytical chemistry,” Z. J. Anal. Chem. 299, 337–361(1979).
3. F. Yueh, J. Singh, and H. Zhang, “Laser-induced breakdownspectroscopy, elemental analysis,” in Encyclopedia of Analyti-cal Chemistry (Wiley, 2000), pp. 2066–2087.
4. M. Lawrence-Snyder, J. Scaffidi, S. M. Angel, A. P. Michel, andA. D. Chave, “Laser-induced breakdown spectroscopy of high-pressure bulk aqueous solutions,” Appl. Spectrosc. 60, 786–790 (2006).
Table 4. Table of the LIBS Spectra Measured
Element Irradiance �5% Mean Energy Form Purity Number of Shots CAS
Helium 9:7 × 10⁹ W=cm2 122:0þ = − 2:3mJ Gas 99.95% 1200 7440-59-7Lithium 7:7 × 10⁹ W=cm2 100:7þ = − 0:6mJ Dry granular 99+% 120 7439-93-2Beryllium 4:2 × 10⁹ W=cm2 126:5� 0:9mJ Powder 325 mesh 99+% 12 7440-41-7Boron 5:6 × 10⁹ W=cm2 121:6� 0:9mJ Crystaline 99.7% 120 7440-42-8Carbon 5:2 × 10⁹ W=cm2 123:7� 1:7mJ Graphite rod 99.99% 1200 7440-44-0Nitrogen 9:6 × 10⁹ W=cm2 120:5� 1:0mJ Gas 99.95% 1200 7727-37-9Sodium 0:9 × 10⁹ W=cm2 64:3� 0:7mJ Dry stick 99% 120 7440-23-5Magnesium 2:3 × 10⁹ W=cm2 41:0� 0:7mJ Ribbon 99.5% 120 7439-95-4Silicon 7:6 × 10⁹ W=cm2 117:2� 0:8mJ Powder 325 mesh 99+% 12 7440-21-3Phosphorus 7:6 × 10⁹ W=cm2 118:3� 1:0mJ Lump 99.999% 12 7723-14-0Sulfur 8:6 × 10⁹ W=cm2 121:8� 0:7mJ Crystaline 99.999% 12 7704-34-9Argon 9:6 × 10⁹ W=cm2 120:9� 0:9mJ Gas 99.95% 1200 7440-37-1Potassium 6:7 × 10⁹ W=cm2 67:2� 0:8mJ Chuncks 98% 120 7440-09-7Calcium 7:0 × 109 W=cm2 109:9� 1:5mJ Turning 99% 1200 7440-70-2Titanium 4:9 × 10⁹ W=cm2 134:8� 0:9mJ Rod 99.97% 120 7440-32-6Chromium 6:4 × 10⁹ W=cm2 119:4� 0:7mJ Chips 99.6% 120 7440-47-3Manganese 3:2 × 10⁹ W=cm2 119:8� 0:8mJ Powder 325 mesh 99+% 12 7439-96-5Iron 5:6 × 10⁹ W=cm2 134:4� 1:9mJ Powder 325 mesh 99% 12 7439-89-6Nickel 8:5 × 10⁹ W=cm2 125:6� 0:7mJ Sphere 99.95% 120 7440-02-0Copper 7:9 × 10⁹ W=cm2 125:3� 0:9mJ 1 − 10mm sphere 99.9% 120 7440-50-8Zinc 7:3 × 10⁹ W=cm2 67:3� 0:8mJ Granular 20 mesh 99.7% 120 7440-66-6Gallium 1:4 × 10⁹ W=cm2 123:0� 0:8mJ Liquid 99.99% 120 7440-55-3Selenium 4:2 × 10⁹ W=cm2 126:4� 0:8mJ powder 200 mesh 99.5+ % 12 7782-49-2Strontium 1:5 × 10⁹ W=cm2 73:1� 0:8mJ Dendritic pieces 99.99% 120 7440-24-6Molybdenum 3:2 × 10⁹ W=cm2 119:5� 0:8mJ Powder 200 mesh 99.99% 12 7439-98-7Ruthenium 7:7 × 10⁹ W=cm2 119:4� 0:6mJ Powder 200 mesh 99.9% 12 7440-18-8Rhodium 5:1 × 10⁹ W=cm2 120:0� 1:0mJ Powder 99.9% 12 7440-16-6Palladium 7:9 × 10⁹ W=cm2 123:9� 0:8mJ Foil 99.9% 120 7440-05-3Silver 2:2 × 10⁹ W=cm2 40:4� 0:7mJ Foil 99.9% 120 7440-22-4Iodine 3:3 × 10⁹ W=cm2 123:2� 1:0mJ Crystaline 99.99% 12 7553-56-2Barium 1:5 × 10⁹ W=cm2 38:5� 0:8mJ Rod 99+% 120 7440-39-3Praseodymium 6:3 × 10⁹ W=cm2 119:3� 0:9mJ Powder 40 mesh 99.9% 12 7440-10-0Ytterbium 3:3 × 10⁹ W=cm2 85:0� 0:8mJ Ingot 99.9% 1200 7440-64-4Tungsten 7:9 × 10⁹ W=cm2 121:2� 1:3mJ Powder 12μm 99.9% 12 7440-33-7Rhenium 5:8 × 10⁹ W=cm2 122:3� 1:0mJ Foil 99.98% 1200 7440-15-5Osmium 8:1 × 10⁹ W=cm2 124� 3mJ Sponge 100 mesh 99.9% 12 7440-04-2Platinum 8:2 × 10⁹ W=cm2 129:4� 1:4mJ Powder 98% 12 7440-06-4Gold 7:9 × 10⁹ W=cm2 121:0� 0:7mJ Agglomerated 50 to 5 mesh 99.99% 12 7440-57-5Mercury 0:7 × 10⁹ W=cm2 38:6� 0:7mJ Liquid 99.999% 120 7439-97-6Lead 1:6 × 10⁹ W=cm2 119:4� 0:8mJ Granular 99% 120 7439-92-1
1 November 2008 / Vol. 47, No. 31 / APPLIED OPTICS G103
5. P. Fichet, D. Menut, R. Brennetot, E. Vors, and A. Rivollan,“Analysis by laser-induced breakdown spectroscopy ofcomplex solids, liquids, and powders with an echelle spectro-meter,” Appl. Opt. 42, 6029–6035 (2003).
6. R. Knopp, F. J. Scherbaum, and J. I. Kim, “Laser inducedbreakdown spectroscopy (LIBS) as an analytical tool for thedetection of metal ions in aqueous solutions,” Anal. Bioanal.Chem. 355, 16–20 (1996).
7. P. B. Dixon and D. W. Hahn, “Feasibility of detection and iden-tification of individual bioaerosols using laser-induced break-down spectroscopy,” Anal. Chem. 77, 631–638 (2005).
8. J. D. Hybl, G. A. Lithgow, and S. G. Buckley, “Laser-inducedbreakdown spectroscopy detection and classification of biolo-gical aerosols,” Appl. Spectrosc. 57, 1207–1215 (2003).
9. A. C. Samuels, F. C. DeLucia, K. L. McNesbby, andA. W. Miziolek, “Laser-induced breakdown spectroscopy ofbacterial spores, molds, pollens, and protein: initial studiesof discrimination potential,” Appl. Opt. 42, 6205–6209 (2003).
10. E. Vors and L. Salmon, “Laser-induced breakdown spectro-scopy (LIBS) for carbon single shot analysis of micrometer-sized particles,” Anal. Bioanal. Chem. 385, 281–286 (2006).
11. Y. Lee, K. Song, and J. Sneddon, Laser-Induced BreakdownSpectrometry (Nova Science, 2000).
12. T. Hussain and M. A. Gondal, “Monitoring and assessment oftoxic metals in Gulf War Oil Spill contaminated soil using la-ser-induced breakdown spectroscopy,” Environ Monit. Assess.136, 391–399 (2007).
13. V. Sturm and R. Noll, “Laser-induced breakdown spectroscopyof gas mixtures of air, CO2, N2, and C3H8 for simultaneous C,H, O, and N measurement,” Appl. Opt. 42, 6221–6225 (2003).
14. T. Hussain, M. A. Gondal, Z. H. Yamani, andM. A. Baig, “Mea-surement of nutrients in green house soil with laser-inducedbreakdown spectroscopy,” Environ. Monit. Assess. 124, 131–139 (2007).
15. Z. A. Arp, D. A. Cremers, R. C. Wiens, D. M. Wayne, B. Sallé,and S. Maurice, “Analysis of water ice and water ice/soil mix-tures using laser-induced breakdown spectroscopy: applica-tion to Mars polar exploration, ”Appl. Spectrosc. 58, 897–909(2004).
16. A. K. Rai, F. Y. Yueh, and J. P. Singh, “Laser-induced break-down spectroscopy of molten aluminum alloy,” Appl. Opt. 42,2078–84 (2003).
17. F. R. Doucet, T. F. Belliveau, J. L. Fortier, and J. Hubert, “Useof chemometrics and laser-induced breakdown spectroscopyfor quantitative analysis of major and minor elements in alu-minum alloy,” Appl. Spectrosc. 61, 327–32 (2007).
18. M. A. Gondal A, T. Hussain, Z. H. Yamani, andA. H. Bakry, “Study of hazardous metals in iron slag wasteusing laser-induced breakdown spectroscopy,” J. Environ.Sci. Health, Part A Toxic/Hazard. Subst. Environ. Eng. 42,767–775 (2007).
19. K. Loebe, A. Uhl, and H. Lucht, “Microanalysis of tool steeland glass with laser-induced breakdown spectroscopy,” Appl.Opt. 42, 6166–6173 (2003).
20. National Institute of Standards and Technology, http://physics.nist.gov/PhysRefData/ASD/index.html
21. United States Army Research Laboratory, http://www.arl.army.mil/www/default.cfm?Action=247&Page=250
22. F. J. Gordillo-Vazquez, A. Perea, A. P. McKiernan, andC. N. Afonso, “Electronic temperature and density of the plas-ma produced by nanosecond ultraviolet laser ablation of LiF,”Appl. Phys. Lett. 86, 181501 (2005).
23. M. Capitelli, A. Casavola, G. Colonna, and A. De Giacomo,“Laser-induced plasma expansion: theoretical and experimen-tal aspects,” Spectrochim. Acta, Part B 59 271–289(2004) .
G104 APPLIED OPTICS / Vol. 47, No. 31 / 1 November 2008


