ggplot2 and some stuff about R graphics and publication level graphics
Upload
yannabrahamCategory
view
4.228download
2
Elegant Graphics for Data Analysis with ggplot2
Yann Abraham
BaselR 28.04.2010

Who is Yann Abraham
• Biochemist by training
• Bioinformatician by trade
• Pharma/Biotech
– Cellzome AG
– Novartis Pharma AG
• http://ch.linkedin.com/in/yannabraham

How to Represent Data

“A Picture is Worth a Thousand Words”
• Visualization is a critical component of data analysis
• Graphics are the most efficient way to digest large volumes of data & identify trends
• Graphical design is a mixture of mathematical and perceptual science

A Straightforward Way to Create Visualizations
• Grammar of Graphics provides a framework to streamline the description and creation of graphics
• For a given dataset to be displayed:– Map variables to aesthetics
– Define Layers• A representation (a ‘geom’) ie line, boxplot, histogram,…
• Associated statistical transformation ie counts, model,…
– Define Scales• Color, Shape, axes,…
– Define Coordinates
– Define Facets

Why Use ggplot2?
• Simple yet powerful syntax
• Provides a framework for creating any type of graphics
• Implements basic graphical design rules by default

An Example
• 4 cell lines where treated with a compound active against a class of enzymes
• Proteins where extracted and quantified using mass spectrometry
• Is there anything interesting?!?

Excel…

R…

R…

R…
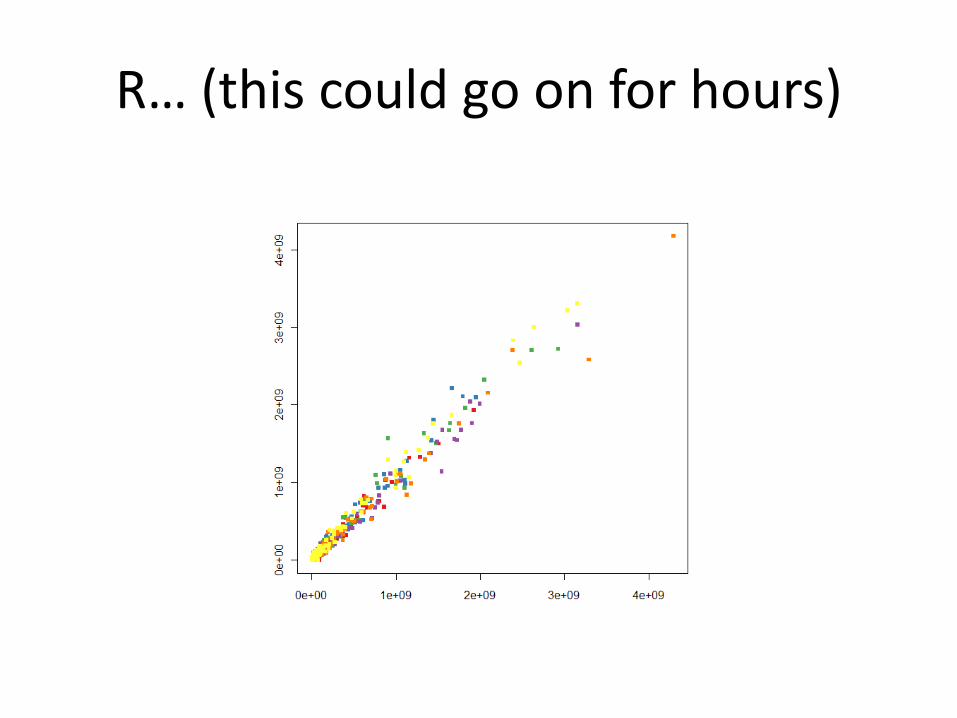
R… (this could go on for hours)

…ggplot2!

ggplot2!

ggplot2!

ggplot2!

ggplot2!
qplot(Experiment_1,Experiment_2,data=comp,color=CELLLINE,facets=ISTARGET~CELLLINE)+coord_equal()+scale_x_log10()+scale_y_log10()

When Visualization Alone is Not Enough
• Some datasets are large multidimensional data structures
• Representing data from such structure requires data transformation
• R is good at handling large sets
• R functions for handling multidimensional sets are complex to use

Easy Data Transformation With plyr
• plyr provides wrappers around typical R operations
– Split
– Apply
– Combine
• plyr functions are similar to the by() function

Why use plyr?
• Simple syntax
• Predictable output
• Tightly integrated into ggplot2
• This comes at a price – somewhat slower than apply

An Example
• Given a set of raw data from a High Throughput Screen, compute the plate-normalized effect

The standard R way
plate.mean <- aggregate(hts.data$RAW,
list(hts.data$PLATE_ID),mean)
names(plate.mean) <- c(‘PLATE_ID’,’PLATE_MEAN’)
hts.data <- merge(hts.data,plate.mean)
hts.data$NORM<-hts.data$RAW/hts.data$PLATE_MEAN

The plyr way
hts.data <-ddply(hts.data,.(PLATE_ID),function(df) {
df$NORM<-df$RAW/mean(df$RAW)
return(df) }
)

Benefits of Using plyr & ggplot2
• Compact, straightforward syntax– Good basic output, complex options only required
for polishing
• Shifts focus from plotting to exploring– Presentation graphics can be created from there
at minimal cost
– Data transformation is intuitive
• Powerful statistics available– It’s R!

Some links…
• The Grammar of Graphics book by Leland Wilkinson
• The ggplot2 book by Hadley Wickham
– And the corresponding website
• A presentation about plyr by JD Long
– And his initial blog post

THANK YOU FOR YOUR ATTENTION!


![Data Science: Data Visualization Boot Camp Relationship ...Information Graphics: A Comprehensive Illustrated Reference, Oxford University Press, 2000. [3]Hadley Wickham, ggplot2: Elegant](https://static.fdocuments.in/doc/165x107/5f47920cadf6a75090029c4f/data-science-data-visualization-boot-camp-relationship-information-graphics.jpg)