Elegance Of Indexing Davidow 0113 - Charles Schwab | A ... · The Elegance of Indexing Schwab...
24
The Elegance of Indexing Schwab Center for Financial Research 1
Transcript of Elegance Of Indexing Davidow 0113 - Charles Schwab | A ... · The Elegance of Indexing Schwab...

The Elegance of Indexing
Schwab Center for Financial Research
1

2

I have always believed that investing is the best way for people to participate in the growth of the world’s economies and potentially build wealth. Of course, we also participate through our jobs and the earnings that come from our work. But for most of us, stock investing is the means to participate — as owners — in the growth of companies that make up the global economy.
Companies are built to grow
Stocks, or “equities,” as they are also called, are shares of ownership in companies and are the foundation of investing. All companies are motivated to grow, and stock ownership is the opportunity for individuals to participate in that growth. Other types of investments certainly provide their own benefits, but they may not be solely oriented toward increasing in value. For example, you might invest in bonds to lend stability and income to your portfolio; or in real estate, in order to earn rent or have a tangible asset. Only companies are built to grow.
In fact, a company’s board of directors will demand that it grow over time; otherwise, management risks being replaced. Over my career, I have been fortunate to serve on numerous boards of both public and private companies. In each case, we held management responsible for growing the business. As much as we may like a CEO personally, our goal is to make sure that a given leader is capable of growing a company and increasing shareholder value.
This process has led to many success stories in the market. Apple started by making one computer in 1976, and today produces hundreds of millions of consumer electronic devices. McDonald’s started with one store and now has over 36,000 locations. Of course, not all companies grow; some fail or get acquired – Digital Equipment and Sears Roebuck are two examples that come to mind. However, over the long run, investing in companies has proven a time-tested way to grow one’s wealth.
The challenge for the investor is determining which stock to buy. Investors can choose to buy shares in individual companies. However, not everyone can take the time to research a company, analyze its balance sheet, and determine whether it is fairly priced in the market. This is challenging, difficult work that even seasoned professionals often struggle to do successfully and consistently.
A message from Charles R. Schwab
Founder and Chairman
3

The sophistication of indexing
For those of us without the time or interest to do research, one of the most effective strategies to gain exposure to the growth power of companies is using mutual funds and exchange-traded funds (ETFs) to own a basket of companies. And the most brilliant approach to that, from my perspective, is index investing. Index investing addresses two of our key Investing Principles – build a diversified portfolio and minimize fees and taxes.
I believe indexing is unfairly perceived as unsophisticated. The industry often refers to indexing as “passive” because index funds follow a stock index, as opposed to actively managed funds, which have an individual manager who chooses securities based on his or her professional assessment of their potential for investment returns. As you’ll see in the following paper, the word passive does a disservice to investors considering their options. Indexing provides an effective means of owning the market and allows investors to participate in the returns of a basket of stocks. The basket of stocks changes over time as stocks are added or removed based on its rules.
Academic research shows how difficult it is for active managers to consistently outperform their benchmarks over the long term, especially when factoring in the impact of fees. In contrast, index investing typically aims for market-based results and doesn’t deviate from a predetermined methodology. It removes the emotions that often hinder active management. For all these reasons, index funds can be an important tool for both new and experienced investors and often form the core of a well-diversified portfolio. And there are a variety of indexing approaches, from so-called market-cap weighted strategies that adjust stock exposure based on companies’ capitalization to fundamental index strategies that weight securities based on such economic measures as sales, cash flow, and dividends + buybacks, among others.
Our Commitment to Indexing
It’s generally expected that companies will grow and increase in value, and that the potential growth will be available to those who invest in them. That’s why I launched the Schwab 1000 Index®, and the mutual fund based on it, in 1991—to give investors a lower-cost, diversified option to invest in stock. This was before the first Exchange-Traded Fund (ETF) was launched. Here are a few of our other innovations in indexing:
4

2007: Schwab launches Fundamental Index® mutual funds
2009: Schwab launches a family of Exchange-Traded Funds (ETFs)
2013: Schwab launches ETF OneSource® (Commission-free ETFs)
2013: Schwab launches a family of Fundamental Index® ETFs
2014: Schwab launches Index Advantage® (ETFs in 401K plans)
2015: Schwab launches Schwab Intelligent Portfolios™ (automated investment advisory service using market-cap weighted & Fundamental Index® ETFs – sponsored by Schwab Wealth Investment Advisory, Inc.)
2015: Schwab launches Institutional Intelligent Portfolios™ (Advisor version of Schwab Intelligent Portfolios – sponsored by Schwab Wealth Investment Advisory, Inc.)
2016: Schwab launches Target Index Funds (ETFs in a Target Date fund)
Sometimes the most straightforward and simple approach is best. I invite you to learn more about the power of indexing — and the rich variety of approaches it can take — in the following paper by the
Schwab Center for Financial Research.
Charles R. Schwab, Founder and Chairman
5

Key Points
• Index funds provide the benefit of diversification in a singleinvestment vehicle, eliminating the challenge of evaluatingindividual securities.
• Index funds help take the emotion out of investing. Theyfollow disciplined, rules-based methodologies, stayingcommitted to their strategy and remaining invested throughup and down markets.
• Index funds tend to be more cost effective and more taxefficient than actively managed mutual funds
Many investors lack the time or the expertise to determine which specific stocks — or bonds or other investments — they should hold in their portfolio. In addition, they may not have enough money on hand to sufficiently spread out their risk by holding a large number of different securities across sectors, industries, and companies.
This spreading out of risk, or diversification, is one of the basic tenets of
modern portfolio theory, which holds that you can reduce the risk (volatility) of
the overall portfolio by owning a number of securities that tend to move
independently of each other. The illustration below shows how diversifying, or
introducing more securities, helps reduce the overall risk of a portfolio. The
fewer securities you hold, the likelier it is that a decline in one of them could
adversely affect the whole portfolio; a larger pool of securities tends to spread
that risk.
Charles R. Schwab Founder and Chairman
Anthony B. Davidow, CIMA® Vice President, Alternative Beta and Asset Allocation Strategist – Schwab Center for Financial Research
6

Source: Schwab Center for Financial Research. This example shows the mathematical probability of losing money in a single year when the market return is 6% if the investor selects stocks at random (i.e., has no stock selection skill). Calculations include standard deviation assumptions of 23.8%, 9.1%, and 5.3% for the 5-, 20-, and 40-stock portfolios, respectively, and assume a normal distribution of returns.
One way to reap the benefits of diversification is through index investing – the
practice of investing in a fund or exchange-traded fund (ETF) that mirrors a
particular index. But this method wasn’t always available.
It started with mutual funds
The modern mutual fund was born almost a century ago. The premise of the
mutual fund was, and remains, fairly simple: a fund, or pool of dollars from
numerous investors, enables a manager to buy dozens, if not hundreds, of
stocks, bonds, or other investments, providing a level of diversification that few
investors could achieve on their own. Today more than 8,000 mutual funds in
the United States invest, in aggregate, more than $16 trillion.1
From the 1920s through the 1960s, all mutual funds were “actively managed,”
which means a portfolio manager or a team of investors sifts through potential
investments to identify and invest in those they believe will be the best fit to
achieve the fund’s overall objective.
1Morningstar Direct, data as of December 31, 2016
Today more than 8,000
mutual funds in the
United States invest,
in aggregate, more
than $16 trillion.
7

Indexing 1.0
In 1971, the pension fund of the luggage manufacturer Samsonite Company
invested $6 million in a new type of mutual fund called an “index fund.” These
funds are sometimes referred to as “passive” to differentiate them from
actively managed funds, and aim to mirror the performance of a particular
index, like the S&P 500®, Russell 1000®, MSCI EAFE, FTSE 100, or the
Bloomberg Barclays U.S. Aggregate Bond Index.
Designed chiefly to provide investors with broad exposure to various segments
of the market, index investing has evolved markedly over the years, taking a
quantum leap forward in the 1990s with the advent of exchange-traded funds,
or ETFs. These funds have helped democratize investing, allowing individuals to
invest in scores of markets and investment opportunities — from traditional
domestic stock and bond investments to emerging market bonds, currencies,
commodities, and sophisticated investment strategies.
In recent years, ETF growth has been largely at the expense of actively-
managed mutual funds. Since 2008, equity mutual funds have experienced net
outflows, while ETFs have experienced positive inflows every year.
Unfortunately, as the data below shows the cumulative equity flows from 2008
have been negative. In other words, many investors have missed out on the
‘bull-market’ run since the Financial Crisis.
As of November 30, 2016. Source: Investment Company Institute (ICI)
8

Indexing has evolved from plain vanilla exposure to segments of the market, to
innovative ways of improving the market experience. The wave of innovation
within index investing hasn’t abated. But before we look at the new
developments in index funds, it’s important to understand what makes these
funds so appealing.
Why index funds?
Index funds let you participate in the growth of the economy in a very
straightforward way: the U.S. market has grown over time, so the indexes that
follow it have risen in tandem.
Put another way, $100,000 invested in the Schwab 1000® Index twenty five
years ago and left untouched would be worth more than $1 million today. We
also show the cumulative growth of inflation over this time period. The “real”
return is the difference between the annualized Schwab 1000® Index (9.63%)
and the annualized inflation rate (2.30%). While inflation has been fairly benign
recently, it can erode an investor’s purchasing power over time. Certain
investments like cash and cash equivalents have provided ‘negative real
returns’ in recent years. In other words, investors who have been sitting on the
sidelines in money market funds over the last several years may have actually
lost money when factoring in the impact of inflation.
Source: Schwab Center for Financial Research with data provided by Morningstar Direct. Data as of December 31, 2016. *CPI Data is as of November 30, 2016. Index returns assume reinvestment of capital gains and dividends, but do not take fees, expenses and taxes into consideration. If they had been considered, performance would have been lower. Indexes cannot be invested in directly. Past performance is no guarantee of future results. 9

An index is a broad basket of securities that is designed to be representative of
a market segment. Index investing is a straightforward way to track the market.
It is also generally a more tax-efficient approach than actively managed mutual
funds. Active funds tend to have higher turnover than index funds — their
managers continuously buy and sell securities in an attempt to beat the market,
rather than invest according to a set schedule of reconstitution and/or
rebalancing. Without that frequent buying and selling, there are fewer
occasions to realize capital gains. ETFs are often touted for their potential tax
efficiency, which stems from their generally lower turnover rates and structural
advantages compared to mutual funds.
Index investing allows investors to obtain broad exposure to the market even if
they do not have large sums to invest.
And finally, there’s cost. The typical index fund has lower operating expenses
and management fees than an actively managed fund. The average cost of an
actively managed all-equity mutual fund is roughly 0.84% of assets per year.
Index mutual funds and exchange-traded funds (ETFs) range in cost but
typically charge between 0.03% and 0.30% of assets. This gap in fees adds up
over the life of an investment. For instance, a $100,000 portfolio growing at 6%
annually over 25 years would accumulate over $62,000 more if the fees were
0.15% instead of 0.84%.
Source: Schwab Center for Financial Research. This hypothetical example is for illustrative purposes only; assumes an annualized return rate of 6%, active equity fund expense of 0.84%, and index fund expense of 0.15%; and is not representative of any specific investment or product
ETFs are often
touted for their
potential tax efficiency,
which stems from their
generally lower
turnover rates and
structural advantages
compared to mutual
funds.
10

Bottom line, index funds have done well on both an absolute and a relative
basis: on an absolute basis over the long term because equity markets have
grown over time, and on a relative basis because of their lower cost structures.
The following chart shows the hypothetical gains that could have been made by
contributing $10,000 annually in the Schwab 1000® Index over the last 25
years as part of a systematic investment plan. Over 25+ years, an investor
would have contributed $250,000, plus the initial $100,000, for a total of
$350,000 - and seen this investment grow to over $1,898,000.
Source: Schwab Center for Financial Research with data provided by Morningstar Direct. Data is from April 2, 1991 - December 31, 2016. The example is hypothetical and provided for illustrative purposes only. This does not include the impact of fees and expenses, but does include reinvestment of dividends and capital gains. Past performance is no guarantee of future results.
How an index works
Index investing often is referred to as “passive” because index funds are
designed to track the movements of a particular index, as opposed to actively
managed funds, which have an individual manager choosing investments. While
accurate, the word “passive” may suggest a lack of change and doesn’t fully
capture the dynamic nature of index funds. The fact is, index funds follow a
rigorous methodology that periodically alters their composition, enabling
investors to participate in important market shifts.
11
To illustrate this point, let’s again consider the Schwab 1000® Index. It screens
and ranks all U.S. stocks based on their market capitalization, or the total stock
market value of their shares. It builds a portfolio containing the top 1,000
stocks in proportion to their overall value. Then, every year, it adjusts that
portfolio to account for stock splits, performance, and other corporate actions,
and re-ranks the top 1,000, ensuring that investors have exposure to the
biggest publicly traded contributors to the U.S. economy. Because the rankings
and weightings shift according to each company’s market performance, index
fund owners are essentially making the market their manager.
While indexing sounds pretty simple and straight forward, it is more dynamic
than investors might think. Indexes change as new companies come to the
market, and others go out of business or merge with larger companies. In fact,
if we think of some of the well-known companies today like – Google
(Alphabet), Facebook and Alibaba – they didn’t even exist a mere 25 years ago.
In the early 1990’s, companies like Microsoft, Sears Roebuck and Eastman
Kodak were some of the top holdings in the Schwab 1000® Index. Today, the
market is dominated by such companies as Apple, Facebook, Amazon and
Google among others. Apple is the largest holding in the Schwab 1000® Index,
due in large part to their dominant position with iPhones. In 1991, Apple was the
138th largest holding and was a PC company.
Behavioral Biases
There’s no shortage of literature discussing the difficulty of outperforming the
market on a consistent basis. In the popular book, “A Random Walk Down Wall
Street”, Princeton economist Burton Malkiel argued that a “blindfolded
monkey” has just as good a chance of outperforming the market as a market
professional. While some individual stock pickers do beat the market each year,
data from the Schwab Center for Financial Research illustrates how difficult it
is for actively managed funds to deliver outstanding results year after year.
Our evaluation shows that between 2007 and 2016, not one equity mutual fund
was able to rank in the top performance quartile for more than seven years.
12

Source: Schwab Center for Financial Research with data provided by Morningstar Direct. The chart examines a universe of 1460 distinct portfolios of diversified U.S. domestic equity funds with a complete 10 year history from January 2007 through December 2016. Each fund’s annual performance was ranked within a given year and placed into quartiles within its respective Morningstar style category. The annual ranking was derived by comparing the funds’ performance to the performance of all distinct, nonpassive portfolios currently placed in the category. The number of times an individual’s fund’s annual performance ranked in a year’s top quartile was then counted. Past performance is no guarantee of future results.
Perhaps more troubling is the fact that many investors spend too much time
and energy ‘chasing’ returns. There’s an old investment adage that “it’s not
timing the market, but time in the market.” Investors often attempt to time the
market – betting when to enter and exit the market – or chase the ‘hot’
performing manager or asset class. Investors often chase returns and allow
their emotions to get in the way of their investment plans.
Based on proprietary research conducted by the Schwab Center for Financial
Research, over the 10 year period ending December 2015, the difference in the
returns of the average mutual fund and the average investor in that fund was
greater than 1% per annum. This is due to investors ‘chasing’ returns rather
than staying on course with their long term plan. In today’s market environment,
the difference could determine whether investors make or lose money.
There’s an old
investment adage that
“it’s not timing the
market, but time in the
market.”
13
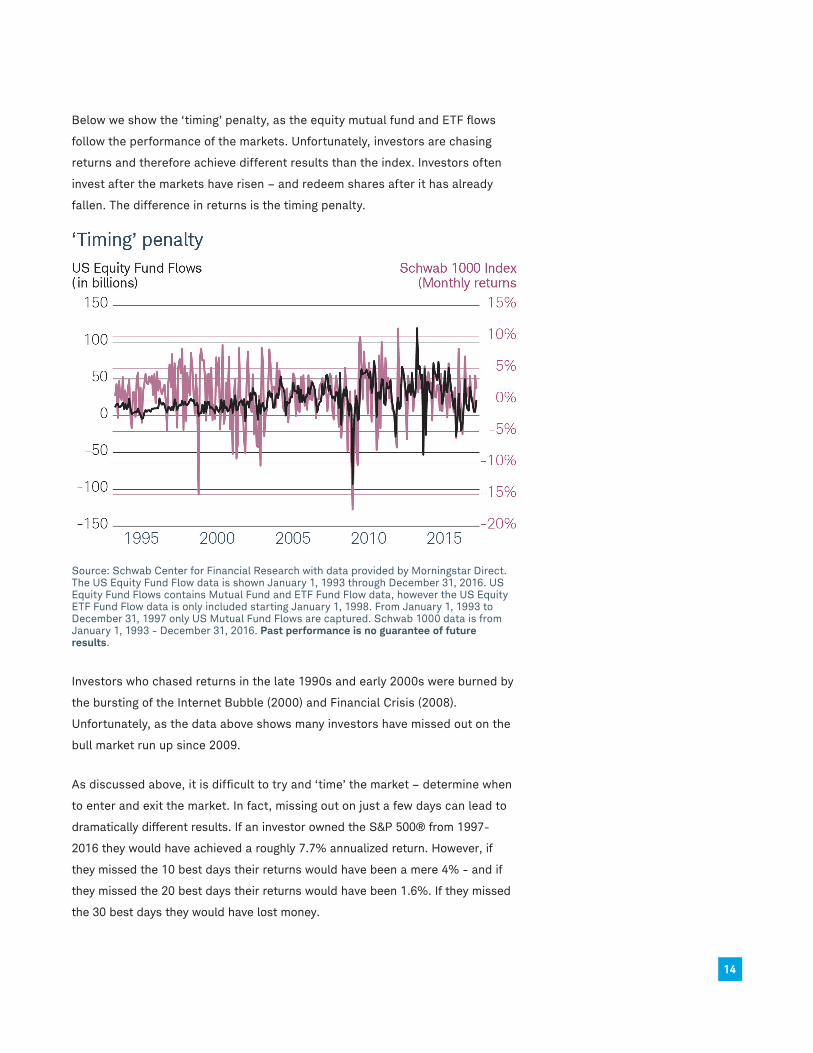
Below we show the ‘timing’ penalty, as the equity mutual fund and ETF flows
follow the performance of the markets. Unfortunately, investors are chasing
returns and therefore achieve different results than the index. Investors often
invest after the markets have risen – and redeem shares after it has already
fallen. The difference in returns is the timing penalty.
Source: Schwab Center for Financial Research with data provided by Morningstar Direct. The US Equity Fund Flow data is shown January 1, 1993 through December 31, 2016. US Equity Fund Flows contains Mutual Fund and ETF Fund Flow data, however the US Equity ETF Fund Flow data is only included starting January 1, 1998. From January 1, 1993 to December 31, 1997 only US Mutual Fund Flows are captured. Schwab 1000 data is from January 1, 1993 - December 31, 2016. Past performance is no guarantee of future results.
Investors who chased returns in the late 1990s and early 2000s were burned by
the bursting of the Internet Bubble (2000) and Financial Crisis (2008).
Unfortunately, as the data above shows many investors have missed out on the
bull market run up since 2009.
As discussed above, it is difficult to try and ‘time’ the market – determine when
to enter and exit the market. In fact, missing out on just a few days can lead to
dramatically different results. If an investor owned the S&P 500® from 1997-
2016 they would have achieved a roughly 7.7% annualized return. However, if
they missed the 10 best days their returns would have been a mere 4% - and if
they missed the 20 best days their returns would have been 1.6%. If they missed
the 30 best days they would have lost money.
14

Source: Schwab Center for Financial Research with data provided by Standard and Poor’s. Return data is annualized based on an average of 252 trading days within a calendar year. The year begins on the first trading day in January and ends on the last trading day of December, and daily total returns were used. Returns assume reinvestment of dividends. When out of the market, cash is not invested. Market returns are represented by the S&P 500® Index which represents an index of widely traded stocks(purple bar). Top days are defined as best performing days of the S&P 500 during the twenty-year period. Indices are unmanaged, do not incur fees or expenses, and cannot be invested directly. Past performance is no guarantee of future results.
Investors would be better served by developing a long-term asset allocation
strategy and implementing some form of disciplined saving plan over time.
Indexing removes the emotion that often prevents investors from making the
right decision. Rather than debating whether to own Apple or Amazon – an
index may own both. Rather than determining when to get in and out of the
market – an indexed approach can help you stay invested through market
cycles. Indexing provides broad based diversification, and removes the emotion
that often hinders investors from making the right decisions at the right time.
Indexing 2.0
The first phase of indexing was designed to provide exposure to virtually every
market in a cost-effective manner. Index funds and ETFs were great tools for
institutional and individual investors. With the increased demand, indexing has
evolved beyond the traditional market capitalization approach to include a
number of new and innovative approaches.15

Recent innovations in indexing aim to combine the benefits of both traditional
indexing and active fund management. One twist is fundamentally weighted
indexes, which screen and weight stocks based on a variety of economic
factors, such as a company’s adjusted sales, cash flow, and dividends +
buybacks.
Fundamental index strategies sometimes are referred to as “strategic beta” or
“smart beta” because they provide broad-based market exposure (beta), and
they weight securities based on fundamental factors rather than simply
assigning the greatest weights to the largest capitalized companies.
Fundamental index strategies rely on a rules-based discipline to select and
weight securities, removing the potential biases of an active manager who may
favor a particular stock because of emotional attachment to the company’s
management or a product, for example.
Top 10 Holdings: Fundamental and Market-cap indexes
Russell RAFI US Large Company Index Russell 1000 Index
Company Weight Company Weight
Exxon Mobil 4.17% Apple 2.95%
Chevron 2.81% Microsoft 2.19%
Apple 2.29% Exxon Mobil 1.75%
AT&T 2.05% Johnson & Johnson 1.47%
Microsoft Corp 1.76% JPMorgan Chase & Co
1.46%
International Business Machines
1.46% Berkshire Hathaway 1.43%
JPMorgan Chase & Co
1.44% Amazon.com 1.35%
Wal-Mart Stores 1.34% General Electric 1.35%
Intel Corp 1.28% AT&T 1.22%
Pfizer 1.27% Facebook 1.20%
Source: Morningstar Direct, Top Holdings as of December 31, 2016. For illustrative purposes only. Holdings are subject to change without notice. Not a recommendation or guarantee that any company has or will be profitable.
At Schwab, we believe that fundamental index strategies are an important
evolutionary step forward in index investing. While the past is never a
guarantee of future returns, fundamental index strategies have historically
outperformed their market-cap index counterparts.
The Russell 1000 Index and the Russell RAFI U.S. Large Company Index own
most of the same companies, but with different weights. The Russell 1000
Index assigns the largest weight to the largest companies based on market 16

capitalization, while the Russell RAFI U.S. Large Company Index weights
securities based on fundamental factors.
While both indexes hold the same companies, the difference in weighting
methodology can lead to dramatically different results over time. To highlight
the differences in weighting methodology, we focus on the FANG stocks –
Facebook, Amazon, Netflix and Google (Alphabet). These stocks are often
referred to as Tech bellwethers, and became very popular in 2015 – a year
dominated by momentum stocks.
Because of their popularity, the weights of the FANG stocks in market-cap
indexes have risen dramatically over the last several years. However, since
fundamental indexes screen and weight securities based on factors like –
sales, cash flow and dividends + buybacks – their weightings were substantially
lower. One measure used to determine the valuation of a company is their P/E
ratio (Price-to-Earnings). A high P/E suggests that a company is ‘expensive’ and
a low P/E suggests a company may be ‘cheap’. Based on this measure, the
FANG stocks are expensive.
As of December 31, 2016
Rank in Russell 1000
Rank in Russell RAFI US Large Cap
Forward P/E Ratio
Facebook 10 279 22.4
Amazon 7 150 69.9
Netflix 89 -- 153.8
Google (Alphabet) 12 76 19.5
Russell 1000 Index 20.44
Russell RAFI US Large Cap
18.79
Source: Schwab Center for Financial Research. For illustrative purposes only. Not a recommendation or guarantee that any company is or has been profitable.
The difference in weighting methodology highlighted above can lead to
dramatically different results over time. Below we compare fundamental
indexes to their comparable market-cap equivalents. The differences in returns
can be quite dramatic as the data shows in 2016. Not in each and every market
environment – but over longer periods – we see that fundamental indexes have
delivered excess returns relative to the market-cap indexes.
17
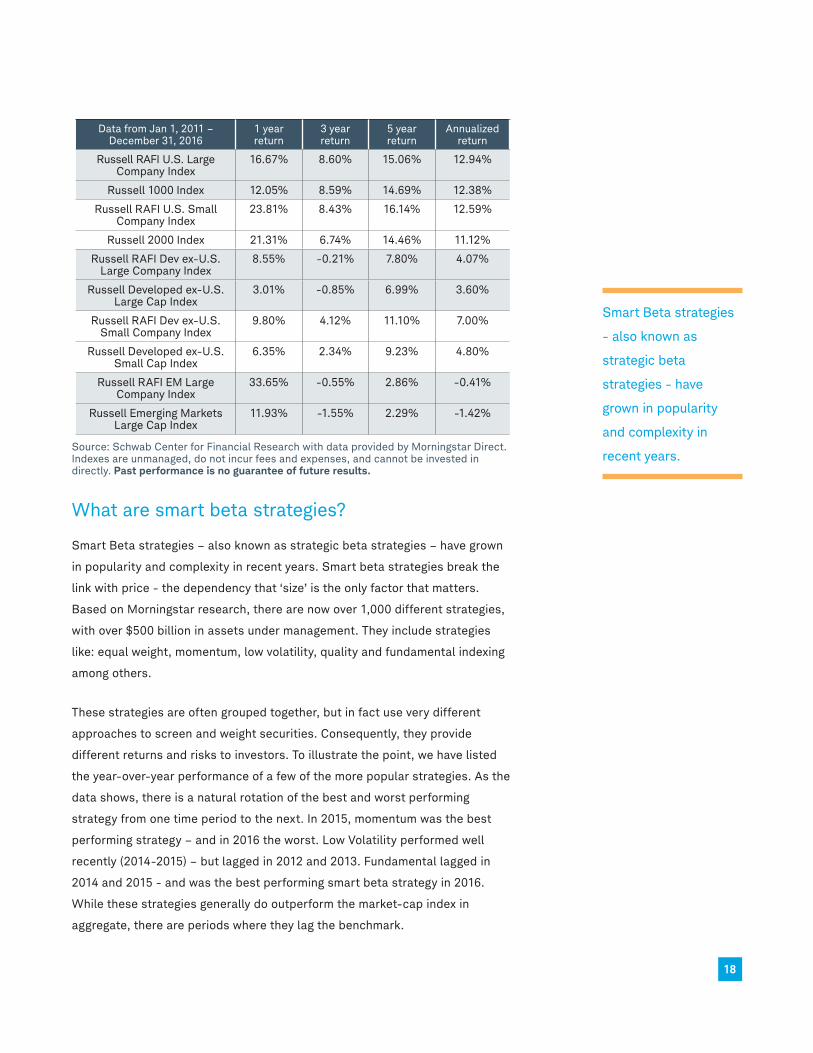
Data from Jan 1, 2011 – December 31, 2016
1 year return
3 year return
5 year return
Annualized return
Russell RAFI U.S. Large Company Index
16.67% 8.60% 15.06% 12.94%
Russell 1000 Index 12.05% 8.59% 14.69% 12.38%
Russell RAFI U.S. Small Company Index
23.81% 8.43% 16.14% 12.59%
Russell 2000 Index 21.31% 6.74% 14.46% 11.12%
Russell RAFI Dev ex-U.S. Large Company Index
8.55% -0.21% 7.80% 4.07%
Russell Developed ex-U.S. Large Cap Index
3.01% -0.85% 6.99% 3.60%
Russell RAFI Dev ex-U.S. Small Company Index
9.80% 4.12% 11.10% 7.00%
Russell Developed ex-U.S. Small Cap Index
6.35% 2.34% 9.23% 4.80%
Russell RAFI EM Large Company Index
33.65% -0.55% 2.86% -0.41%
Russell Emerging Markets Large Cap Index
11.93% -1.55% 2.29% -1.42%
Source: Schwab Center for Financial Research with data provided by Morningstar Direct. Indexes are unmanaged, do not incur fees and expenses, and cannot be invested in directly. Past performance is no guarantee of future results.
What are smart beta strategies?
Smart Beta strategies – also known as strategic beta strategies – have grown
in popularity and complexity in recent years. Smart beta strategies break the
link with price - the dependency that ‘size’ is the only factor that matters.
Based on Morningstar research, there are now over 1,000 different strategies,
with over $500 billion in assets under management. They include strategies
like: equal weight, momentum, low volatility, quality and fundamental indexing
among others.
These strategies are often grouped together, but in fact use very different
approaches to screen and weight securities. Consequently, they provide
different returns and risks to investors. To illustrate the point, we have listed
the year-over-year performance of a few of the more popular strategies. As the
data shows, there is a natural rotation of the best and worst performing
strategy from one time period to the next. In 2015, momentum was the best
performing strategy – and in 2016 the worst. Low Volatility performed well
recently (2014-2015) – but lagged in 2012 and 2013. Fundamental lagged in
2014 and 2015 - and was the best performing smart beta strategy in 2016.
While these strategies generally do outperform the market-cap index in
aggregate, there are periods where they lag the benchmark.
Smart Beta strategies
- also known as
strategic beta
strategies - have
grown in popularity
and complexity in
recent years.
18

Smart Beta Year-Over-Year Results
Source: Schwab Center for Financial Research with data provided by Morningstar Direct . Data used from January 1, 2012 through December 31, 2016. Strategy performance represented by annual total returns for the following indexes: Market Capitalization (Market Cap) - S&P 500; Fundamental - Russell RAFI US Large Cap; Equal Weight - S&P 500 Equal Weighted; Momentum - MSCI USA Momentum; Low Volatility - S&P 500 Low Volatility; Quality - Russell 1000 Quality Factor. Indexes are unmanaged, do not incur fees or expenses, and cannot be invested in directly. Please see disclosures for more information about the market indexes. Past performance is no guarantee of future results.
Putting the pieces together
With the innovation of indexing, you can now choose to own a segment of the
market in a market-cap fashion, or choose among the different types of smart
beta strategies (i.e., momentum, low volatility, quality, equal weight or
fundamental). Fundamental index strategies screen & weight securities based
on such factors as – sales, cash flow & dividends + buybacks. As shown above,
the difference in weighting methodology can provide very different returns over
time.
19

We are advocates of allocating to both market-cap and fundamental index
strategies. Each has a role within a portfolio. Market-cap strategies tend to be
the lowest cost solution. They provide little or no tracking error and provide
market beta by definition.
Based on research conducted by the Schwab Center for Financial Research,
fundamental indexing has delivered excess returns over time. They typically
exhibit high tracking error, and are cost effective relative to active mutual
funds. The combination provides diversification, cost-effective exposure and
the potential for alpha (excess returns).
At Schwab, we see index-based strategies forming the core of investors’
portfolios. Index investing offers a simple yet highly effective way to participate in
the growth of the global economy — allowing individual investors to diversify, gain
market exposure, and maybe even capture greater growth potential as part of
their overall investment strategy.
Glossary of Terms
Asset Allocation: Asset allocation is an investment strategy that aims to
balance risk and reward by apportioning a portfolio’s assets according to an
individual’s goals, risk-tolerance, and time horizon. Asset allocation typically
diversifies portfolio holdings across stocks, bonds, and cash and cash
equivalents in an attempt to position portfolios for long-term success.
Alpha: A performance measure on a risk-adjusted basis. Alpha takes the
volatility (risk) of a mutual fund, or other type of investment, and compares its
risk-adjusted performance to a benchmark index. The excess return of the fund
relative to the return of the benchmark index is a fund’s alpha.
Beta: A measure of the volatility, or systematic risk, of a security or a portfolio
in comparison to the market as a whole. Beta is used in the capital asset
pricing model (CAPM), a model that calculates the expected return of an asset
based on its beta and expected market returns.
Equal Weight: Equal Weight indexes are a form of smart beta strategy. Rather
than weighting securities based on their market capitalization, Equal Weight
indexes provide the same weight to each of its constituent holdings.
20

Fundamental Indexing: Fundamental indexes screen and weight securities
based on economic factors like - sales, cash flows, and dividends + buybacks.
By breaking the link with price (size), these indexes provide different returns
and risk characteristics as the market-cap equivalent. Fundamental indexes are
sometimes referred to as Smart Beta or Strategic Beta.
Low Volatility: Low Volatility indexes are a form of smart beta strategy. Rather
than weighting securities based on their market capitalization, a Low Volatility
index screens and weights securities based on their historical volatility (i.e.,
risk).
Quality: Quality indexes are a form of smart beta strategy. Rather than
weighting securities based on their market-capitalization, Quality indexes
screen and weight securities based on factors like – return on equity, earnings
growth and leverage.
Market-Cap Indexes: Most of the broadly-used market indexes today are
market-cap weighted indexes, such as the S&P 500®, Russell 1000®, and MSCI
EAFE indexes. They weight securities based on their market capitalization (i.e.,
size of the company).
Momentum: Momentum indexes are a form of smart beta strategy. Rather than
weighting securities based on their market capitalization, Momentum indexes
screen and weight securities based on those that have exhibited positive price
momentum over a period of time (i.e., stocks that have risen).
Smart Beta: Also known as strategic beta provides an alternative weighting
methodology than market-cap indexes. Smart Beta strategies include various
sub-strategies including – equal weight, low volatility, momentum, quality and
fundamental indexing among others.
Standard Deviation: Standard deviation is a statistical measurement that
measures historical volatility. It is a relative measure that allows investors to
distinguish the risk of two or more investments. For example, a volatile portfolio
will have a higher standard deviation than a less volatile portfolio.
Volatility: Volatility is a statistical measure of the dispersion of returns for a
given security or index. Volatility can either be measured by using the standard
deviation or variance between returns from that same security or market index.
Commonly, the higher the volatility, the riskier the security.
21

Important Disclosures
Investors should carefully consider information contained in the prospectus, including investment objectives, risks, charges, and expenses. You can request a prospectus by visiting Schwab.com or calling Schwab at 800-435-4000. Please read the prospectus carefully before investing.
Past performance is no guarantee of future results.
All expressions of opinion are subject to change without notice in reaction to shifting market conditions. Data here is obtained from what are considered reliable sources; however, its accuracy, completeness, or reliability cannot be guaranteed.
The information here is for general informational purposes only and should not be considered an individualized recommendation or personalized investment advice. The type of securities and investment strategies mentioned may not be suitable for everyone. Each investor needs to review a security transaction for his or her own particular situation.
Diversification strategies do not ensure a profit and do not protect against losses in declining markets.
Indexes are unmanaged, do not incur management fees, costs, and expenses, and cannot be invested in directly.
The phrase ‘Fundamental Index®’ is a registered trademark of Research Affiliates.
* Schwab is a registered service mark ofCharles Schwab & Co., Inc. Fundamental Index is a registered trademark of Research Affiliates, LLC.
Russell Investments and Research Affiliates LLC have entered into a strategic alliance with respect to the Russell RAFI Indexes. Subject to Research Affiliates’ intellectual property rights in certain content, Russell Investments is the owner of all copyrights related to the Russell AFI Indexes. Russell Investments and Research Affiliates jointly own all trademark and service mark rights in and to the Russell RAFI Indexes. Charles Schwab & Co., Inc. is not affiliated with Russell Investments or Research Affiliates. [The Schwab Fundamental Index Funds are not sponsored, endorsed, sold or promoted by Russell Investments or Research Affiliates, and Russell Investments or Research Affiliates do not make any representation regarding the advisability of investing in shares of the fund.] Effective December 1, 2016, the names of the Russell Fundamental Index Series and all
associated indexes were changed from “Russell Fundamental” to “Russell RAFI” by the index provider. No other changes have occurred
Index Definitions
The S&P 500® Index is a stock market index based on the market capitalizations of 500 large companies having common stock listed on the NYSE or NASDAQ.
The Russell 1000® Index measures the performance of the large-cap segment of the U.S. equity universe. It is a subset of the Russell 3000® Index and includes approximately 1,000 of the largest securities based on a combination of their market capitalization and current index membership.
The Russell RAFI U.S. Large Company Index ranks companies in the Russell 3000 Index by fundamental measures of size and tracks the performance of those companies whose fundamental scores are in the top 87.5% of the Russell 3000 Index. The index uses a partial quarterly reconstitution methodology in which the index is split into four equal segments at the annual reconstitution and each segment is then rebalanced on a rolling quarterly basis. Performance includes reinvestment of dividends.
The Schwab 1000 Index includes the stocks of the largest 1,000 publicly traded companies in the United States, with size determined by market capitalization (total market value of all shares outstanding). The index is designed to measure the performance of large- and mid-cap U.S. stocks.
MSCI EAFE - The MSCI EAFE Index (Europe, Australasia and the Far East) comprises the MSCI country indexes capturing large and mid-cap equities across developed markets, excluding the U.S. and Canada. The MSCI EAFE Index consists of the following 21 developed-market country indexes: Australia, Austria, Belgium, Denmark, Finland, France, Germany, Hong Kong, Ireland, Israel, Italy, Japan, the Netherlands, New Zealand, Norway, Portugal, Singapore, Spain, Sweden, Switzerland and the United Kingdom.
Russell RAFI US Small Company Index. An index that ranks companies in the Russell 3000® Index by fundamental measures of size and tracks the performance of those companies whose fundamental scores are in the bottom 12.5% of the Russell 3000 Index. The index uses a partial quarterly
reconstitution methodology in which the index is split into four equal segments at the annual reconstitution and each segment is then rebalanced on a rolling quarterly basis. The Russell 3000 Index measures the performance of the largest 3000 U.S. companies representing approximately 98% of the investable U.S. equity market.
Russell 2000 The Russell 2000 index is an index measuring the performance approximately2,000 small-cap companies in the Russell 3000 Index, which is made up of 3,000 of the biggest U.S. stocks. The Russell 2000 serves as a benchmark for small-cap stocks in the United States.
Russell RAFI Developed ex-US Large Company Index ) An index that ranks companies in the Russell Developed ex-U.S. Index by fundamental measures of size and tracks the performance of those companies whose fundamental scores are in the top 87.5% of the Russell Developed ex-U.S. Index. The index uses a partial quarterly reconstitution methodology in which the index is split into four equal segments at the annual reconstitution and each segment is then rebalanced on a rolling quarterly basis. The Net series reduces index performance by adjusting for local taxes. The Russell Developed ex-U.S. Index measures the performance of the largest investable securities in developed countries globally, excluding companies assigned to the United States.
Russell RAFI Developed ex-US Small Company Index. An index that ranks companies in the Russell Developed ex-U.S. Index by fundamental measures of size and tracks the performance of those companies whose fundamental scores are in the bottom 12.5% of the Russell Developed ex-U.S. Index. The index uses a partial quarterly reconstitution methodology in which the index is split into four equal segments at the annual reconstitution and each segment is then rebalanced on a rolling quarterly basis. The Net series reduces index performance by adjusting for local taxes. The Russell Developed ex-U.S. Index measures the performance of the largest investable securities in developed countries globally, excluding companies assigned to the United States
Russell RAFI Emerging Markets Large Cap Index - The Russell RAFI Emerging Markets Index Series selects, ranks, and weights securities by fundamental measures of company size as opposed to market capitalization. The fundamental overall company scores are created using as the universe the members of the Russell
22

Emerging Markets Index. Securities are grouped in order of decreasing company score for each index and each company receives a weight as a percentage of the sum of the weights of the individual securities within each index.
Russell Emerging Markets Large Cap Index The Russell Emerging Markets Large Cap Index measures the performance of the investable securities in emerging countries globally. The Russell Emerging Markets Index is constructed to provide a comprehensive and unbiased barometer for this market segment and is completely reconstituted annually to accurately reflect the changes in the market over time.
S&P 500 Equal Weight - The S&P 500 Equal Weight Index is an index developed by Standard & Poor’s in collaboration with Guggenheim Investments. In the S&P 500 Equal Weight Index, each of the stocks that make up the index is “equally weighted.” To maintain composition, the S&P 500 Equal Weight Index rebalances quarterly.
Russell 1000 Quality Factor - The Russell 1000 Quality Factor Index is an index derived from the Russell 1000 Index, designed to capture the Quality Factor - Quality is defined as securities tend to continue to do what they are already doing (either rising or falling in price).
S&P 500 Low Volatility - The S&P 500® Low Volatility Index measures performance of the 100 least volatile stocks in the S&P 500. The index benchmarks low volatility or low variance strategies for the U.S. stock market. Constituents are weighted relative to the inverse of their corresponding volatility, with the least volatile stocks receiving the highest weights.
MSCI USA Momentum - The MSCI USA Momentum Index is based on MSCI USA Index, its parent index, which captures large and mid cap stocks of the US market.It is designed to reflect the performance of an equity momentum strategy by emphasizing stocks with high price momentum, while maintaining reasonably high trading liquidity, investment capacity and moderate index turnover
Russell Developed ex US Large Cap Index - The Russell Global ex US Large Cap Index offers investors access to the large-cap segment of the global equity market, excluding companies assigned to the United States. The Russell Developed ex US Large Cap Index is constructed to provide a comprehensive and unbiased barometer for the large-cap segment and is completely reconstituted annually to accurately reflect the changes in the market over time.
Russell Developed ex US Small Cap Index - The Russell Global ex US Small Cap Index offers investors access to the small-cap segment of the global equity market, excluding companies assigned to the United States. The Russell Developed ex US Small Cap Index is constructed to provide a comprehensive and unbiased barometer for the small-cap segment and is completely reconstituted annually to accurately reflect the changes in the market over time.
23

©2017 Charles Schwab & Co., Inc. All rights reserved. Member SIPC.(0117-T4N0) MKT80952-01 (01/17)