Electrostatic DFT Map for the Complete Vibrational Amide ...
13
Electrostatic DFT Map for the Complete Vibrational Amide Band of NMA Tomoyuki Hayashi, Wei Zhuang, and Shaul Mukamel* Department of Chemistry, UniVersity of California, IrVine, California 92697-2025 ReceiVed: May 4, 2005; In Final Form: August 16, 2005 An anharmonic vibrational Hamiltonian for the amide I, II, III, and A modes of N-methyl acetamide (NMA), recast in terms of the 19 components of an external electric field and its first and second derivative tensors (electrostatic DFT map), is calculated at the DFT(BPW91/6-31G(d,p)) level. Strong correlations are found between NMA geometry and the amide frequency fluctuations calculated using this Hamiltonian together with the fluctuating solvent electric field obtained from the MD simulations in TIP3 water. The amide I and A frequencies are strongly positively correlated with the CdO and N-H bond lengths. The CdO and C-N amide bond lengths are negatively correlated, suggesting the solvent-induced fluctuations of the contribution of zwitterionic resonance form. Sampling the global electric field in the entire region of the transition charge densities (TCDs) is required for accurate infrared line shape simulations. Collective electrostatic solvent coordinates which represent the fluctuations of the 10 lowest amide fundamental and overtone states are reported. Normal-mode analysis of an NMA-3H 2 O cluster shows that the 660 cm -1 to 1100 cm -1 oscillation found in the frequency autocorrelation functions of the amide modes may be ascribed to the two bending vibrations of intermolecular hydrogen bonds with the amide oxygen of NMA. I. Introduction Ultrafast vibrational spectroscopy is a powerful tool for prob- ing molecular structure and dynamics in the condensed phase. 1-13 Vibrational frequencies are sensitive to the local solvent environment; the frequency shift with respect to the gas phase provides information about the average structure, whereas the line shapes depend on dynamics of fluctuations. The amide-I infrared absorption band of peptides which originates from the stretching motion of the CdO bond (coupled to N-H bending and C-H stretching) provides a useful indicator of secondary structure changes because of its sensitivity to hydrogen bonding, dipole-dipole interactions, and geometry of the peptide back- bone. The anharmonicity and vibrational relaxation were probed in the first 2D IR measurements of peptides. 14 Extensive studies were performed on a small and flexible peptide, trialanine, and yielded the Ramachandran angles in good agreement with NMR studies. 8,9 For larger peptides the emphasis of 2D IR has been to relate certain patterns in the spectra to typical structural motifs as a-helix, 3 10 -helix, and -sheet. 14-18 However, the cross-peak pattern of other amide bands can provide additional structural information. A high-level vibrational Hamiltonian of N-methyl acetamide (NMA) which is the simplest model system for the peptide bond is crucial for constructing the Hamiltonian of larger proteins and simulating their vibrational dynamics. NMA is highly polarizable due to the contribution of the two resonance structures (Figure 1), and its structural changes in different solvent environments have been studied. 19-21 The effects of hydrogen bonding with water on the structure were studied by ab initio geometry optimization of NMA-water clusters. 19 H-bonding was found to increase the CdO bond length by 0.008-0.023 Å, indicating an increased contribution of the ionic resonance form. Similar results were found for liquid NMA. 20 Connecting the vibrations and the structure in solution is of great interest. Ab initio ground-state calculations have been compared with experimental infrared and Raman spectra in the gas phase and in water. 22-27 MP2 28-30 and several density functionals have been tested. The PW91 31 and its hybrid functional with Becke88 32 (BPW91) combined with 6-31G(d,p) and 6-31+G- (d) basis sets give better gas-phase amide harmonic frequencies of NMA and amide dimers than B3LYP 33,34 and MP2. 24,26 The PW91 functional provides good binding energies of hydrogen bond and van der Waals interactions in several dimers of small molecules (0.33 kcal/mol; exp 0.28 kcal/mol for Ar-Ar dimer), whereas B3LYP fails to have an energy minimum for the system. 35 Including three water molecules directly bonded to NMA explicitly, combined with the Onsager reaction field model 36,37 was found crucial for reproducing the amide frequen- cies of NMA in water. 38 However it is still not clear whether these interactions are purely electrostatic or involve covalent bonding. The amide I band is widely used as a marker for secondary structure, dynamics, and hydrogen bonding pattern. 16 Electro- static maps have been used to simulate the vibrational dephasing of amide I mode in NMA, reproducing both the peak shift and bandwidth. 39,40 An empirical linear relation was assumed between the ab initio normal-mode frequency of NMA-water clusters and the electrostatic potentials at the 6 atom sites of NMA in the same clusters. The maps are limited to the fundamental frequency, and it is not clear whether they are generally transferable to other solvents. The amide II and III modes are known as marker bands and show a blueshift in polar solvents. 38 The diagonal and off-diagonal peaks of all amide modes can be used to characterize the structure of proteins. In linear spectra the amide A band in water is usually hidden underneath the broad O-H stretch band of water. However the amide A can be observed in 2D measurements as its off-diagonal peaks with other amide modes. Figure 1. Resonance structures of NMA. Left: neutral; right: zwitterionic. 9747 J. Phys. Chem. A 2005, 109, 9747-9759 10.1021/jp052324l CCC: $30.25 © 2005 American Chemical Society Published on Web 10/12/2005
Transcript of Electrostatic DFT Map for the Complete Vibrational Amide ...

Electrostatic DFT Map for the Complete Vibrational Amide Band of NMA
Tomoyuki Hayashi, Wei Zhuang, and Shaul Mukamel*Department of Chemistry, UniVersity of California, IrVine, California 92697-2025
ReceiVed: May 4, 2005; In Final Form: August 16, 2005
An anharmonic vibrational Hamiltonian for the amide I, II, III, and A modes ofN-methyl acetamide (NMA),recast in terms of the 19 components of an external electric field and its first and second derivative tensors(electrostatic DFT map), is calculated at the DFT(BPW91/6-31G(d,p)) level. Strong correlations are foundbetween NMA geometry and the amide frequency fluctuations calculated using this Hamiltonian togetherwith the fluctuating solvent electric field obtained from the MD simulations in TIP3 water. The amide I andA frequencies are strongly positively correlated with the CdO and N-H bond lengths. The CdO and C-Namide bond lengths are negatively correlated, suggesting the solvent-induced fluctuations of the contributionof zwitterionic resonance form. Sampling the global electric field in the entire region of the transition chargedensities (TCDs) is required for accurate infrared line shape simulations. Collective electrostatic solventcoordinates which represent the fluctuations of the 10 lowest amide fundamental and overtone states arereported. Normal-mode analysis of an NMA-3H2O cluster shows that the 660 cm-1 to 1100 cm-1 oscillationfound in the frequency autocorrelation functions of the amide modes may be ascribed to the two bendingvibrations of intermolecular hydrogen bonds with the amide oxygen of NMA.
I. Introduction
Ultrafast vibrational spectroscopy is a powerful tool for prob-ing molecular structure and dynamics in the condensed phase.1-13
Vibrational frequencies are sensitive to the local solventenvironment; the frequency shift with respect to the gas phaseprovides information about the average structure, whereas theline shapes depend on dynamics of fluctuations. The amide-Iinfrared absorption band of peptides which originates from thestretching motion of the CdO bond (coupled to N-H bendingand C-H stretching) provides a useful indicator of secondarystructure changes because of its sensitivity to hydrogen bonding,dipole-dipole interactions, and geometry of the peptide back-bone. The anharmonicity and vibrational relaxation were probedin the first 2D IR measurements of peptides.14 Extensive studieswere performed on a small and flexible peptide, trialanine, andyielded the Ramachandran angles in good agreement with NMRstudies.8,9 For larger peptides the emphasis of 2D IR has beento relate certain patterns in the spectra to typical structural motifsas a-helix, 310-helix, andâ-sheet.14-18 However, the cross-peakpattern of other amide bands can provide additional structuralinformation.
A high-level vibrational Hamiltonian ofN-methyl acetamide(NMA) which is the simplest model system for the peptide bondis crucial for constructing the Hamiltonian of larger proteinsand simulating their vibrational dynamics. NMA is highlypolarizable due to the contribution of the two resonancestructures (Figure 1), and its structural changes in differentsolvent environments have been studied.19-21 The effects ofhydrogen bonding with water on the structure were studied byab initio geometry optimization of NMA-water clusters.19
H-bonding was found to increase the CdO bond length by0.008-0.023 Å, indicating an increased contribution of the ionicresonance form. Similar results were found for liquid NMA.20
Connecting the vibrations and the structure in solution is of greatinterest. Ab initio ground-state calculations have been comparedwith experimental infrared and Raman spectra in the gas phaseand in water.22-27 MP228-30 and several density functionals havebeen tested. The PW9131 and its hybrid functional with
Becke8832 (BPW91) combined with 6-31G(d,p) and 6-31+G-(d) basis sets give better gas-phase amide harmonic frequenciesof NMA and amide dimers than B3LYP33,34and MP2.24,26ThePW91 functional provides good binding energies of hydrogenbond and van der Waals interactions in several dimers of smallmolecules (0.33 kcal/mol; exp 0.28 kcal/mol for Ar-Ar dimer),whereas B3LYP fails to have an energy minimum for thesystem.35 Including three water molecules directly bonded toNMA explicitly, combined with the Onsager reaction fieldmodel36,37was found crucial for reproducing the amide frequen-cies of NMA in water.38 However it is still not clear whetherthese interactions are purely electrostatic or involve covalentbonding.
The amide I band is widely used as a marker for secondarystructure, dynamics, and hydrogen bonding pattern.16 Electro-static maps have been used to simulate the vibrational dephasingof amide I mode in NMA, reproducing both the peak shift andbandwidth.39,40 An empirical linear relation was assumedbetween the ab initio normal-mode frequency of NMA-waterclusters and the electrostatic potentials at the 6 atom sites ofNMA in the same clusters. The maps are limited to thefundamental frequency, and it is not clear whether they aregenerally transferable to other solvents. The amide II and IIImodes are known as marker bands and show a blueshift in polarsolvents.38 The diagonal and off-diagonal peaks of all amidemodes can be used to characterize the structure of proteins. Inlinear spectra the amide A band in water is usually hiddenunderneath the broad O-H stretch band of water. However theamide A can be observed in 2D measurements as its off-diagonalpeaks with other amide modes.
Figure 1. Resonance structures of NMA. Left: neutral; right:zwitterionic.
9747J. Phys. Chem. A2005,109,9747-9759
10.1021/jp052324l CCC: $30.25 © 2005 American Chemical SocietyPublished on Web 10/12/2005
In this paper we construct a general ab initio electrostaticmap that can simultaneously predict the fundamental andcombination bands of several amide modes and is particularlysuitable for the simulation of the nonlinear-infrared response.We have demonstrated this approach for the O-H stretch ofHOD in D2O.41 A fluctuating Hamiltonian was obtained bydiagonalizing the anharmonic ab initio vibrational Hamiltonianof an isolated HOD molecule in a spatially nonuniformelectrostatic potential expanded to second-order Cartesiancoordinates at the center of charge.41 This approach has severalnotable advantages over the empirical ab initio maps whichpredict the line width with comparable accuracy. First, it showsthat the electrostatic modeling can reproduce the experimentallinear and third-order infrared spectra, suggesting that theelectrostatic contributions are more important than covalentcontributions to hydrogen bonding effects on high-frequencyvibrational bands. Second, it includes geometry changes due tothe solvent-induced polarization. The geometry of NMA isoptimized in the presence of the electric field when the DFTmap is created. Therefore the simulation includes geometryfluctuations in response to the solvent-induced electrostaticpotential, which allow us to establish the connection betweenthe frequency and geometry fluctuations. Third, the mapincorporates higher (up to fourth order) derivatives of theelectrostatic potential. Our calculations clearly demonstrate thatthe electric field gradient-tensor contributes significantly to thefrequency fluctuations. Fourth, this map is not optimized to aparticular solvent or solvent environment and is thereforetransferable. Fifth, it provides the entire fluctuating Hamiltonianrequired for simulations of nonlinear spectra (fundamental andovertone frequency as well as the transition dipole magnitudeand direction) from first principles. Collective solvent coordi-nates have been identified, offering a simple physical picturefor the infrared bands and allowing high level line shapesimulations using the stochastic Liouville equations.42
The DFT electrostatic map was constructed for NMA at theBPW91/6-31G(d,p) level where the four amide (I, II, III, andA) fundamental frequencies and their combination and overtonefrequencies are parametrized in terms of the electrostaticpotential expanded to third order in Cartesian coordinate. Themap is obtained by numerical derivatives of the vibrationaleigenstates calculated for the sixth-order ab initio anharmonicvibrational potential with respect to the electric field, first andsecond electric field derivatives. The solute-solvent interactionsare assumed to be purely electrostatic, and the map includesthe electronic polarization of NMA and the solute-solventdynamics. The complete fluctuating Hamiltonian required forthe third-order vibrational response of NMA is calculated usingthe electric field and its first and second derivatives. These areobtained by least-squares fits to an electric field sampling gridfrom MD simulations The linear-infrared spectra are calculated,including all 4 amide modes. A local sampling at 4 amide(C,O,N,H) atoms and 3 additional points (for out-of-planegradients) fails to reproduce amide II and III solvent shifts,whereas a global sampling which spans the entire region oftransition charge densities (TCDs) of amide modes predicts theamide I, III, and A peak shifts, in good agreement withexperiment. The amide II shift is less accurate since its moredelocalized TCD is not fully covered by our electrostatic grid.A collective solvent coordinate, a linear combination of 19independent components of electric field and its derivatives, isconstructed for each of the 10 amide states considered (thefundamentals, overtones, and combination bands).
Inhomogeneous electrostatic fluctuations for the amide modesobtained from MD simulations and the least-squares fit usingthe sampling point of large amide transition charge densitiesare shown in section II. Electrostatic DFT maps are constructedfor the NMA structure, the 10 lowest amide frequencies(fundamental, overtone, and combination), and their transitiondipole moments in section III. The infrared spectrum issimulated in section IV. An electrostatic collective coordinatefor each of the 10 states is presented in section V. Finally, ourresults are discussed in section VI.
II. Inhomogeneous Electrostatic Fluctuations of theAmide Modes
The molecular charge densityF(r ) can be expanded in thevibrational modesQi:43
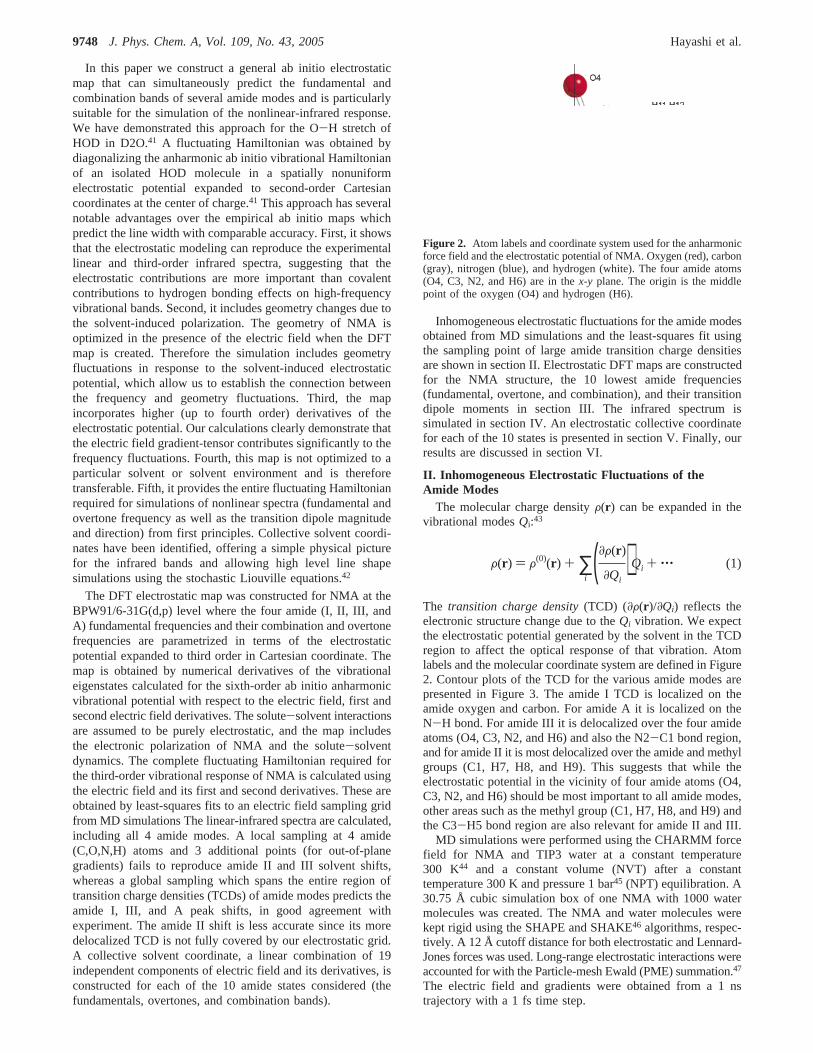
The transition charge density(TCD) (∂F(r )/∂Qi) reflects theelectronic structure change due to theQi vibration. We expectthe electrostatic potential generated by the solvent in the TCDregion to affect the optical response of that vibration. Atomlabels and the molecular coordinate system are defined in Figure2. Contour plots of the TCD for the various amide modes arepresented in Figure 3. The amide I TCD is localized on theamide oxygen and carbon. For amide A it is localized on theN-H bond. For amide III it is delocalized over the four amideatoms (O4, C3, N2, and H6) and also the N2-C1 bond region,and for amide II it is most delocalized over the amide and methylgroups (C1, H7, H8, and H9). This suggests that while theelectrostatic potential in the vicinity of four amide atoms (O4,C3, N2, and H6) should be most important to all amide modes,other areas such as the methyl group (C1, H7, H8, and H9) andthe C3-H5 bond region are also relevant for amide II and III.
MD simulations were performed using the CHARMM forcefield for NMA and TIP3 water at a constant temperature300 K44 and a constant volume (NVT) after a constanttemperature 300 K and pressure 1 bar45 (NPT) equilibration. A30.75 Å cubic simulation box of one NMA with 1000 watermolecules was created. The NMA and water molecules werekept rigid using the SHAPE and SHAKE46 algorithms, respec-tively. A 12 Å cutoff distance for both electrostatic and Lennard-Jones forces was used. Long-range electrostatic interactions wereaccounted for with the Particle-mesh Ewald (PME) summation.47
The electric field and gradients were obtained from a 1 nstrajectory with a 1 fstime step.
Figure 2. Atom labels and coordinate system used for the anharmonicforce field and the electrostatic potential of NMA. Oxygen (red), carbon(gray), nitrogen (blue), and hydrogen (white). The four amide atoms(O4, C3, N2, and H6) are in thex-y plane. The origin is the middlepoint of the oxygen (O4) and hydrogen (H6).
F(r ) ) F(0)(r ) + ∑i
(∂F(r )
∂Qi)Qi + ‚‚‚ (1)
9748 J. Phys. Chem. A, Vol. 109, No. 43, 2005 Hayashi et al.

Contour plots of the average and variance of the electrostaticpotentials and the electric fields (Ex andEy) are shown in Figure4. By symmetry, the averageEz vanishes in thex-y plane andis not shown. The average electrostatic potential has onemaximum at (-2,-1.3,0) Å which corresponds to the H2Ohydrogen bound to the amide oxygen of NMA and a minimumat (2,1,0) Å, corresponding to the oxygen of water bound tothe amide hydrogen. The variances of electrostatic fields,Ex
andEy, are larger in the right and left side of the contour plotswhere the solvent is accessible. We defined the averagecorrelation time ofEx andEy:
Contour plots oftR shown in Figure 4 indicate that in the regionwhere the water hydrogen bonded to NMA is possible, theelectric field varies more slowly due to the intermolecularvibrations and the exchange of water. However the fast timescales are not directly connected to intermolecular vibrationsor exchange. It should be noted that the classical point chargeapproximation for the solvent overestimates the electric fieldin the area where the solvent is accessible due to neglectingthe solvent charge distribution.
The solvent-induced electrostatic potentialU was expandedto cubic order in Cartesian coordinatesXR (R ) x, y, z) aroundthe midpoint between amide oxygen and hydrogen atoms ofNMA (Figure 2)
Apart from the trivial factorU0, eq 3 has 19 independentparameters (note thatERâ ) EâR) which were arranged in avectorC ) (Ex, Ey, Ez, Exx, Eyy, Ezz, Exy, Exz, Eyz, Exxx, Eyyy, Ezzz,Exyy, Exxy, Exxz, Exzz, Eyzz, Eyyz, Exyz). C was obtained by a least-squares-fit of the actual electric field data obtained from theMD configurations. We used 67 sampling points consisting oftwo-dimensional 49 (7× 7) grid points in thex-y plane withina rectangular area defined as-1.4 < x < 1.4 and-0.8 < y <0.8 in Å, 6 additional points outside of the rectangular area inthex-y plane, and 10 points located at ((0.5,0,0), ((0.5,0,(0.5),and ((1,0,0), ((1,0,(0.5) in Å. This sampling, denotedS1, covers most of the areas of large TCD (larger than 0.01
esu/Bohr) for amide I, III, and A. For comparison, we also useda 7-point sampling (S2), 5 in thex-y plane at the positions of 4amide atoms and the origin of the coordinate system and 2 out-of-plane located at (x, y, z) ) (0,0,0.2) and (0,0,-0.2). S2 wasonly used as a reference in a few calculations indicated below;all other calculations are based on S1.
Contour plots of the averageEx andEy in the vicinity of 4amide atoms directly calculated from MD simulation togetherwith fits are shown in Figure 5. The root-mean-square-displacement (RMSD) between the MD simulation and least-squares fit was calculated as well and displayed in Figure 15 inthe Supporting Information
whereERMD(r , t) andER
LSQ(r , t) represent the electric field inR) x, y direction at timet, and positionr is calculated from MDsimulation and from the least-squares fit.T ) 2 ns is thesimulation time. S2 gives a better field (smaller RMSD) at the4 amide atoms. HoweverEy has a saddle point near the amidenitrogen, whereas S2 has a minimum. S1 has a larger RMSDat the 4 amide atoms but better reproduces the global electricfields Ex andEy.
III. The DFT Electrostatic Map
Geometry optimization and normal mode calculations oftrans-NMA with Cs symmetry in the gas phase38 were performedusing Gaussian 03 at the BPW91/6-31G(d,p) level.48 TheBPW91 functional with 6-31G(d) basis set is known toreproduce experimental amide I, II, and III frequencies.38 Weused the 6-31G(d,p) basis set with extra p-functions on thehydrogen atoms. The resulting anharmonic vibrational potentialV(Q;C(t)) was expanded in 5 normal coordinates involving theamide CdO stretch, N-H bending, and N-H stretch (Q1:mixture of N-H bending and methyl deformation,Q2: amideIII mode,Q3: amide II mode,Q4: amide I mode, andQ5: amideA mode). The harmonic frequencies are listed in Table 1.V(Q;C(t)) fluctuates with time, following the solvent-inducedelectrostatic potentialU(X) parametrized byC(t). The potentialenergy of NMA was expanded to sixth order in the 5 normalcoordinates
where f l1‚‚‚ln(n) ≡ (∂nV/∂Ql1‚‚‚∂Qln)/n!. The geometry was opti-
mized with respect to these 5 normal coordinates, holding allother degrees of freedom frozen to vanish the linear coefficientsf i
(1)(C) in the presence of nonuniform external electric fields.The anharmonic force constants were then calculated bynumerical derivatives of the analytical energy gradients in thesame external fields, using our modified Gaussian 03 code.41
We have parametrized the internal coordinates at the minimalenergy geometry withC
whereRa is either a bond length, a bond angle, or a dihedral
Figure 3. Transition charge densities (TCD) (eq 1) for the 4 amidemodes of NMA. Shown is the 0.010 esu/Bohr contour of (A): amideIII mode; (B): amide II mode; (C): amide III mode; (D): amide Amode. Violet and brown contours represent positive and negative values,respectively.
tR(r ) ) ∫0
∞dt⟨ER(0;r )ER(t;r )⟩/⟨ER(r )2⟩, R ) x, y (2)
U(X) ) U0 - ∑R
ERXR -1
2∑R,â
ERâXRXâ -1
6∑R,â,γ
ERâγXRXâXγ (3)
ERRMSD(r ) )1
T∫0
Tdt(ER
MD(r , t) - ERLSQ(r , t))2, R ) x, y (4)
V(Q;C) ) ∑i
f i(1)(C)Qi + ∑
i,j
f ij(2)(C)QiQj + ∑
i,j,k
f ijk(3)(C)QiQjQk
+ ∑i,j,k,l
f ijkl(4)(C)QiQjQkQl + ∑
i,j,k,l,m
f ijklm(5) (C)QiQjQkQlQm
+ ∑i,j,k,l,m,n
f ijklmn(6) (C)QiQjQkQlQmQn (5)
Ra ) Rgasa + Ra(1)†C +1
2C†Ra(2)C (6)
Complete Vibrational Amide Band of NMA J. Phys. Chem. A, Vol. 109, No. 43, 20059749

angle,R(1) is a 19 component row vector
andR(2) is a 19× 19 matrix
Pi represents the number of possible permutation of the indicesof Ei, e.g.Pi is 2 for Ei ) Exy. The maps (Ra(1)) of the CdO,C-N, and N-H bond lengths are given in Table 8 of theSupporting Information.
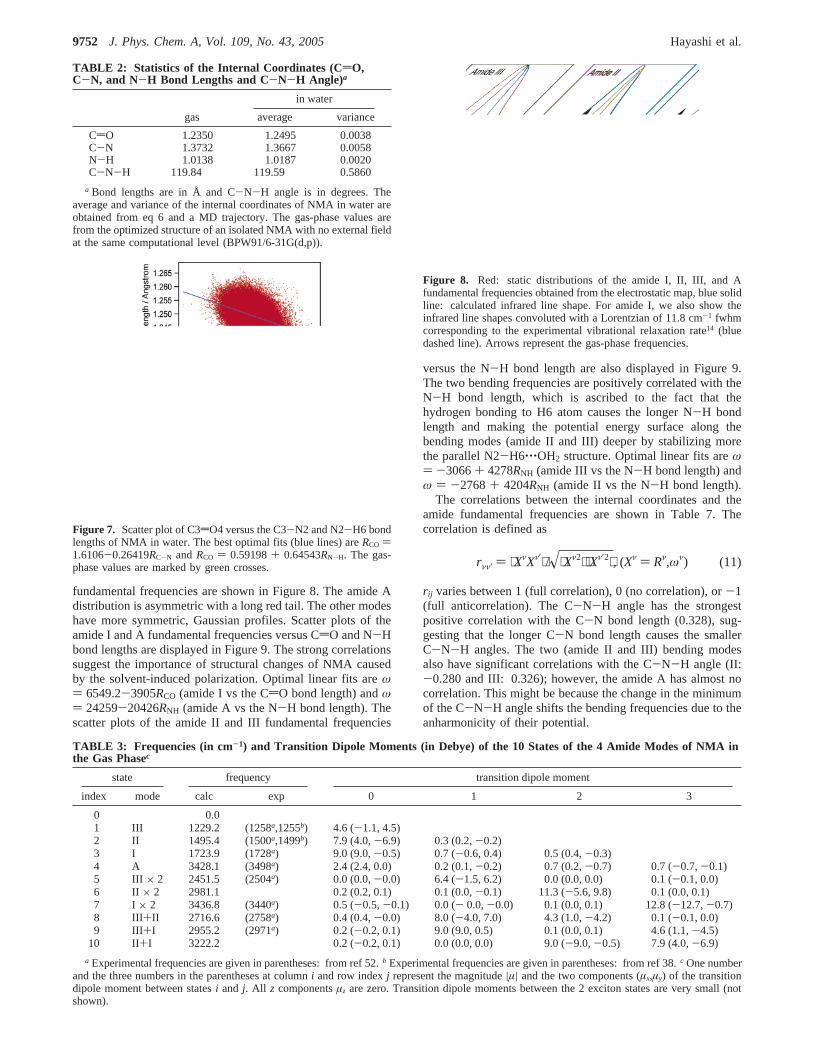
Fluctuations of the structure were calculated using eq 6. Thestatic distributions of the CdO, C-N, and N-H bond lengthsand the C-N-H angle are shown in Figure 6. The statistics ofthese internal coordinates are summarized in Table 2. Thedistribution of the N-H bond length is asymmetric with a tailfor a longer bond length. Both average CdO and N-H bondlengths in water are significantly longer than in the gas phase(0.014 and 0.005 Å, respectively), and the C-N stretch in wateris shorter by 0.007 Å. This is in qualitative agreement with theearlier study of the Hartree-Fock level calculations of NMA+2-(or 3)H2O19 (CdO: 0.0122-0.0227 Å, C-N: -0.0158 ∼-0.0299 Å, and N-H: 0.0080-0.0092 Å depending on clusterconfigurations). The C-N-H angle has the scatter plots of Cd
O versus C-N, and the N-H bond lengths are shown in Figure7. The CdO and C-N bond lengths are negatively correlated,suggesting that the relative contribution of the two resonancestructures N2-C3dO4 and N2+dC3-O4- change dependingon the solvent environment (Figure 1). The CdO and N-Hbond lengths have a positive correlation. This can be rationalizedsince hydrogen bonding to either O4 or H6 causes a positiveelectric field Ex making both CdO and N-H bond lengthslonger due to the larger molecular dipole-electric field interac-tions.
The vibrational Hamiltonian was recast in a normally orderedform (Appendix C of ref 49), and the eigenstates were obtainedby diagonalizing the Hamiltonian using the Implicit RestartedArnoldi Method (IRAM)49-51 using a Hartree product basis setmade of 12 harmonic oscillator eigenfunctions per one normalmode. Basis states where the total number of excitationsnT ≡n1 + n2 + n3 are larger than 12 are neglected. The basis setsize was 6183. The gas-phase vibrational eigenstates (eigen-frequencies and eigenvectors) are tabulated in Table 9 of theSupporting Information.
We focused on the 10 eigenstates which dominate the linearand the third-order infrared spectra: the 4 amide I, II, III, andA fundamentals which have large transition dipole moments tothe ground state, the 3 first overtone of amide I, II, and IIImodes, and the 3 combination bands. The 6 overtone andcombination states have large transition dipole moments to the
Figure 4. Top row: the average electrostatic potential (ESP) in atomic unit and the electric field components (Ex andEy) in atomic units obtainedfrom the MD simulation of NMA in H2O. Red circles represent the four amide atoms (O4, C3, N2, and H6). Middle row: standard deviation ofthe same quantities using the same units as the top panels. Bottom row: The correlation time scale (eq 2) forEx andEy (in ps).
(Ra(1)†)i ≡ Pi∂Ra
∂Ei(7)
(Ra(2))ij ≡ PiPj( ∂2Ra
∂Ei∂Ej) (8)
9750 J. Phys. Chem. A, Vol. 109, No. 43, 2005 Hayashi et al.

3 amide I, II, and III fundamentals. The transition momentsbetween the other states are 1-2 orders of magnitude smaller.The frequencies and transition dipole moments of these 10 statesare summarized in Table 3. The amide I, II, and III frequenciesare in good agreement with experiment (without scaling) towithin 3-27 cm-1. The first overtone of amide I mode is at3436 cm-1 (experiment 3440 cm-1) and its anharmonicity 10.6cm-1 (experiment 16 cm-1). Compared with Table 1, thefundamental frequencies are around 10 cm-1 lower than theirharmonic frequencies (9 cm-1 for amide I).
The vibrational transition frequency from the ground stateto stateν and the transition dipole moments between statesνandν′ were parametrized using the electrostatic vectorC
whereO(1) andM νν′(1) are 19 component row vector andO(2)
andM νν′(2) are 19× 19 matrix defined in the same way as eqs7 and 8. The gas-phase frequenciesωgas
ν were taken fromexperiment.52 The linear terms of the DFT map,O(1) andM (1),are given in Tables 10 and 11 of the Supporting Information,respectively.
The amide frequency fluctuations are calculated using eq 9with the S1 sampling. The static distributions of the four
Figure 5. Left column: top- the average electric fieldEx of NMA in H2O from the MD simulation; middle- the least-squares-fit to the MDsimulation data using sampling 1 (S1); bottom- the least-squares-fit to the MD simulation data using sampling 2 (S2); right column: samequantities forEy. Red circles represent the four amide atoms (O4, C3, N2, and H6). The sampling points (S1) are shown by the blue crosses inpanels (b) and (e).
TABLE 1: Calculated Gas-Phase Normal Modes andHarmonic Frequencies Used To Calculate the VibrationalHamiltonian of NMA
mode no. harmonic frequency description
1 1081.6 N-H bend+ methyl def2 1241.2 amide III3 1506.6 amide II4 1732.8 amide I5 3582.8 amide A
Figure 6. Static distribution of the equilibrium bond lengths of C3dO4, C3-N2 and N2-H6, and the equilibrium C3-N2-H6 angle. Thearrows represent the gas-phase bond lengths and the C-N-H angle.
ωmapν ) ωgas
ν + Oν(1)†C +12C†Oν(2)C (9)
µRνν′ ) µgasR
νν′ + MRνν′(1)†C +1
2C†MR
νν′(2)C (R ) x, y, z) (10)
Complete Vibrational Amide Band of NMA J. Phys. Chem. A, Vol. 109, No. 43, 20059751
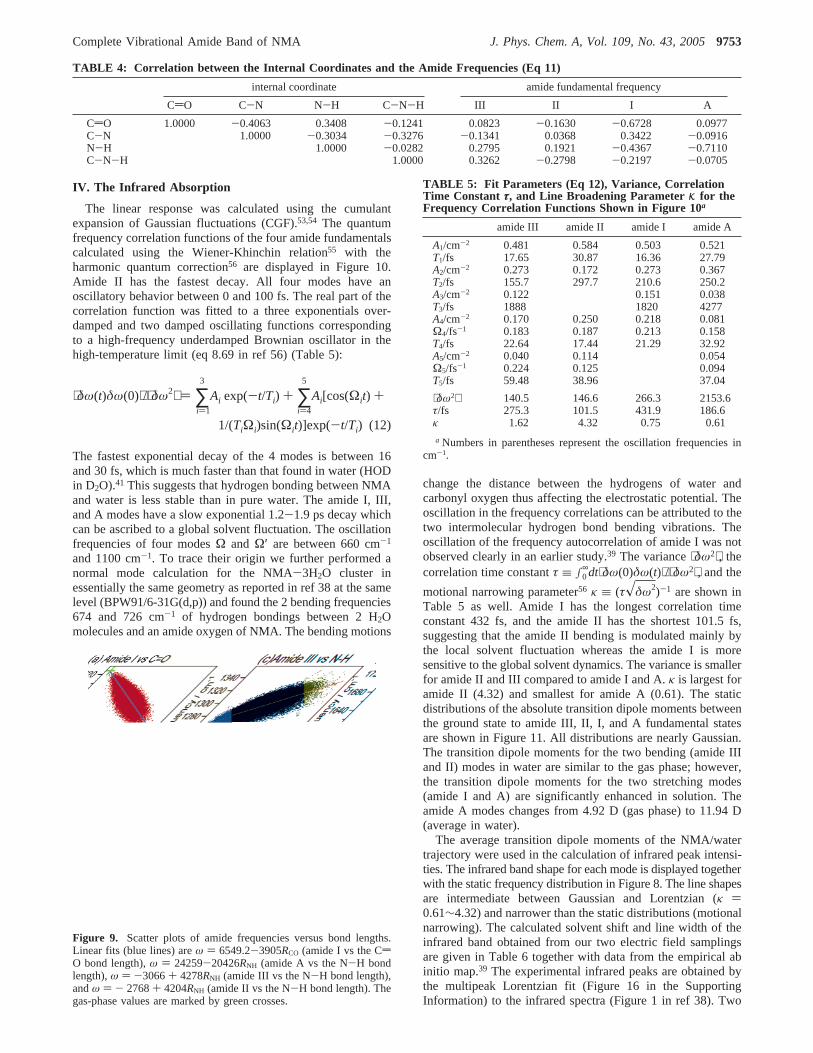
fundamental frequencies are shown in Figure 8. The amide Adistribution is asymmetric with a long red tail. The other modeshave more symmetric, Gaussian profiles. Scatter plots of theamide I and A fundamental frequencies versus CdO and N-Hbond lengths are displayed in Figure 9. The strong correlationssuggest the importance of structural changes of NMA causedby the solvent-induced polarization. Optimal linear fits areω) 6549.2-3905RCO (amide I vs the CdO bond length) andω) 24259-20426RNH (amide A vs the N-H bond length). Thescatter plots of the amide II and III fundamental frequencies
versus the N-H bond length are also displayed in Figure 9.The two bending frequencies are positively correlated with theN-H bond length, which is ascribed to the fact that thehydrogen bonding to H6 atom causes the longer N-H bondlength and making the potential energy surface along thebending modes (amide II and III) deeper by stabilizing morethe parallel N2-H6‚‚‚OH2 structure. Optimal linear fits areω) -3066+ 4278RNH (amide III vs the N-H bond length) andω ) -2768+ 4204RNH (amide II vs the N-H bond length).
The correlations between the internal coordinates and theamide fundamental frequencies are shown in Table 7. Thecorrelation is defined as
rij varies between 1 (full correlation), 0 (no correlation), or-1(full anticorrelation). The C-N-H angle has the strongestpositive correlation with the C-N bond length (0.328), sug-gesting that the longer C-N bond length causes the smallerC-N-H angles. The two (amide II and III) bending modesalso have significant correlations with the C-N-H angle (II:-0.280 and III: 0.326); however, the amide A has almost nocorrelation. This might be because the change in the minimumof the C-N-H angle shifts the bending frequencies due to theanharmonicity of their potential.
TABLE 2: Statistics of the Internal Coordinates (CdO,C-N, and N-H Bond Lengths and C-N-H Angle)a
in water
gas average variance
CdO 1.2350 1.2495 0.0038C-N 1.3732 1.3667 0.0058N-H 1.0138 1.0187 0.0020C-N-H 119.84 119.59 0.5860
a Bond lengths are in Å and C-N-H angle is in degrees. Theaverage and variance of the internal coordinates of NMA in water areobtained from eq 6 and a MD trajectory. The gas-phase values arefrom the optimized structure of an isolated NMA with no external fieldat the same computational level (BPW91/6-31G(d,p)).
Figure 7. Scatter plot of C3dO4 versus the C3-N2 and N2-H6 bondlengths of NMA in water. The best optimal fits (blue lines) areRCO )1.6106-0.26419RC-N and RCO ) 0.59198+ 0.64543RN-H. The gas-phase values are marked by green crosses.
TABLE 3: Frequencies (in cm-1) and Transition Dipole Moments (in Debye) of the 10 States of the 4 Amide Modes of NMA inthe Gas Phasec
state frequency transition dipole moment
index mode calc exp 0 1 2 3
0 0.01 III 1229.2 (1258a,1255b) 4.6 (-1.1, 4.5)2 II 1495.4 (1500a,1499b) 7.9 (4.0,-6.9) 0.3 (0.2,-0.2)3 I 1723.9 (1728a) 9.0 (9.0,-0.5) 0.7 (-0.6, 0.4) 0.5 (0.4,-0.3)4 A 3428.1 (3498a) 2.4 (2.4, 0.0) 0.2 (0.1,-0.2) 0.7 (0.2,-0.7) 0.7 (-0.7,-0.1)5 III × 2 2451.5 (2504a) 0.0 (0.0,-0.0) 6.4 (-1.5, 6.2) 0.0 (0.0, 0.0) 0.1 (-0.1, 0.0)6 II × 2 2981.1 0.2 (0.2, 0.1) 0.1 (0.0,-0.1) 11.3 (-5.6, 9.8) 0.1 (0.0, 0.1)7 I × 2 3436.8 (3440a) 0.5 (-0.5,-0.1) 0.0 (- 0.0,-0.0) 0.1 (0.0, 0.1) 12.8 (-12.7,-0.7)8 III+II 2716.6 (2758a) 0.4 (0.4,-0.0) 8.0 (-4.0, 7.0) 4.3 (1.0,-4.2) 0.1 (-0.1, 0.0)9 III+I 2955.2 (2971a) 0.2 (-0.2, 0.1) 9.0 (9.0, 0.5) 0.1 (0.0, 0.1) 4.6 (1.1,-4.5)
10 II+I 3222.2 0.2 (-0.2, 0.1) 0.0 (0.0, 0.0) 9.0 (-9.0,-0.5) 7.9 (4.0,-6.9)
a Experimental frequencies are given in parentheses: from ref 52.b Experimental frequencies are given in parentheses: from ref 38.c One numberand the three numbers in the parentheses at columni and row indexj represent the magnitude|µ| and the two components (µx,µy) of the transitiondipole moment between statesi and j. All z componentsµz are zero. Transition dipole moments between the 2 exciton states are very small (notshown).
Figure 8. Red: static distributions of the amide I, II, III, and Afundamental frequencies obtained from the electrostatic map, blue solidline: calculated infrared line shape. For amide I, we also show theinfrared line shapes convoluted with a Lorentzian of 11.8 cm-1 fwhmcorresponding to the experimental vibrational relaxation rate14 (bluedashed line). Arrows represent the gas-phase frequencies.
rνν′ ) ⟨XνXν′⟩/x⟨Xν2⟩⟨Xν′2⟩, (Xν ) Rν,ων) (11)
9752 J. Phys. Chem. A, Vol. 109, No. 43, 2005 Hayashi et al.
IV. The Infrared Absorption
The linear response was calculated using the cumulantexpansion of Gaussian fluctuations (CGF).53,54 The quantumfrequency correlation functions of the four amide fundamentalscalculated using the Wiener-Khinchin relation55 with theharmonic quantum correction56 are displayed in Figure 10.Amide II has the fastest decay. All four modes have anoscillatory behavior between 0 and 100 fs. The real part of thecorrelation function was fitted to a three exponentials over-damped and two damped oscillating functions correspondingto a high-frequency underdamped Brownian oscillator in thehigh-temperature limit (eq 8.69 in ref 56) (Table 5):
The fastest exponential decay of the 4 modes is between 16and 30 fs, which is much faster than that found in water (HODin D2O).41 This suggests that hydrogen bonding between NMAand water is less stable than in pure water. The amide I, III,and A modes have a slow exponential 1.2-1.9 ps decay whichcan be ascribed to a global solvent fluctuation. The oscillationfrequencies of four modesΩ and Ω′ are between 660 cm-1
and 1100 cm-1. To trace their origin we further performed anormal mode calculation for the NMA-3H2O cluster inessentially the same geometry as reported in ref 38 at the samelevel (BPW91/6-31G(d,p)) and found the 2 bending frequencies674 and 726 cm-1 of hydrogen bondings between 2 H2Omolecules and an amide oxygen of NMA. The bending motions
change the distance between the hydrogens of water andcarbonyl oxygen thus affecting the electrostatic potential. Theoscillation in the frequency correlations can be attributed to thetwo intermolecular hydrogen bond bending vibrations. Theoscillation of the frequency autocorrelation of amide I was notobserved clearly in an earlier study.39 The variance⟨δω2⟩, thecorrelation time constantτ ≡ ∫0
∞dt⟨δω(0)δω(t)⟩/⟨δω2⟩, and the
motional narrowing parameter56 κ ≡ (τxδω2)-1 are shown inTable 5 as well. Amide I has the longest correlation timeconstant 432 fs, and the amide II has the shortest 101.5 fs,suggesting that the amide II bending is modulated mainly bythe local solvent fluctuation whereas the amide I is moresensitive to the global solvent dynamics. The variance is smallerfor amide II and III compared to amide I and A.κ is largest foramide II (4.32) and smallest for amide A (0.61). The staticdistributions of the absolute transition dipole moments betweenthe ground state to amide III, II, I, and A fundamental statesare shown in Figure 11. All distributions are nearly Gaussian.The transition dipole moments for the two bending (amide IIIand II) modes in water are similar to the gas phase; however,the transition dipole moments for the two stretching modes(amide I and A) are significantly enhanced in solution. Theamide A modes changes from 4.92 D (gas phase) to 11.94 D(average in water).
The average transition dipole moments of the NMA/watertrajectory were used in the calculation of infrared peak intensi-ties. The infrared band shape for each mode is displayed togetherwith the static frequency distribution in Figure 8. The line shapesare intermediate between Gaussian and Lorentzian (κ )0.61∼4.32) and narrower than the static distributions (motionalnarrowing). The calculated solvent shift and line width of theinfrared band obtained from our two electric field samplingsare given in Table 6 together with data from the empirical abinitio map.39 The experimental infrared peaks are obtained bythe multipeak Lorentzian fit (Figure 16 in the SupportingInformation) to the infrared spectra (Figure 1 in ref 38). Two
TABLE 4: Correlation between the Internal Coordinates and the Amide Frequencies (Eq 11)
internal coordinate amide fundamental frequency
CdO C-N N-H C-N-H III II I A
CdO 1.0000 -0.4063 0.3408 -0.1241 0.0823 -0.1630 -0.6728 0.0977C-N 1.0000 -0.3034 -0.3276 -0.1341 0.0368 0.3422 -0.0916N-H 1.0000 -0.0282 0.2795 0.1921 -0.4367 -0.7110C-N-H 1.0000 0.3262 -0.2798 -0.2197 -0.0705
Figure 9. Scatter plots of amide frequencies versus bond lengths.Linear fits (blue lines) areω ) 6549.2-3905RCO (amide I vs the CdO bond length),ω ) 24259-20426RNH (amide A vs the N-H bondlength),ω ) -3066+ 4278RNH (amide III vs the N-H bond length),andω ) - 2768+ 4204RNH (amide II vs the N-H bond length). Thegas-phase values are marked by green crosses.
⟨δω(t)δω(0)⟩/⟨δω2⟩ ) ∑i)1
3
Ai exp(-t/Ti) + ∑i)4
5
Ai[cos(Ωit) +
1/(TiΩi)sin(Ωit)]exp(-t/Ti) (12)
TABLE 5: Fit Parameters (Eq 12), Variance, CorrelationTime Constant τ, and Line Broadening ParameterK for theFrequency Correlation Functions Shown in Figure 10a
amide III amide II amide I amide A
A1/cm-2 0.481 0.584 0.503 0.521T1/fs 17.65 30.87 16.36 27.79A2/cm-2 0.273 0.172 0.273 0.367T2/fs 155.7 297.7 210.6 250.2A3/cm-2 0.122 0.151 0.038T3/fs 1888 1820 4277A4/cm-2 0.170 0.250 0.218 0.081Ω4/fs-1 0.183 0.187 0.213 0.158T4/fs 22.64 17.44 21.29 32.92A5/cm-2 0.040 0.114 0.054Ω5/fs-1 0.224 0.125 0.094T5/fs 59.48 38.96 37.04
⟨δω2⟩ 140.5 146.6 266.3 2153.6τ/fs 275.3 101.5 431.9 186.6κ 1.62 4.32 0.75 0.61
a Numbers in parentheses represent the oscillation frequencies incm-1.
Complete Vibrational Amide Band of NMA J. Phys. Chem. A, Vol. 109, No. 43, 20059753

peaks are assigned to the broad 1628 cm-1 line (1635 cm-1
amide I and 1619 cm-1 H-O-H bending of water23). Twosharp peaks around 1400 cm-1 were assigned to the CCH3
symmetric bend (1377 cm-1) and the NCH3 symmetric bend(1416 cm-1)23 which are not included in our calculation. Sincethe amide A mode is hidden underneath the broad O-H stretchband of water, different experimental values of solvent shifthave been reported from Raman spectra (-184 cm-1)57 and theinfrared spectra of NMA in the D2O/HOD mixture (-78cm-1).27 Both S1 and S2 predict amide I peak shifts (-59 and-57 cm-1) and line widths (29 and 28 cm-1) in good agreementwith experiment-80 cm-1 and 29 cm-1. Both samplings alsogive the similar amide A frequency shifts (S1:-51, S2:-72cm-1). However S2 fails to reproduce the experimental amideII peak shift (calc: +10 cm-1; exp: +53 cm-1), and only S1gives a good amide III peak shift (+33 cm-1). Note that S2reproduces the electric field at amide 4 atoms better than S1,whereas S1 better reproduces the global electric field structure.This suggests that the amide I solvent peak shift only dependson the local electric field structure around the 4 amide atoms,but the amide III is dominated by the global electric fieldstructure. This is consistent with the fact that the TCD of amideI (Figure 3) is localized on the CdO bond region, but for amideIII it is more delocalized over the amide group and their bondsto carbons in the 2 methyl groups. The infrared band is thusdetermined by the global electric field structure in the area whereTCD is large. Amide II is most delocalized over the amide and2 methyl groups. Even though S1 gives a better solvent peakshift (+14 cm-1) than S2 (-16 cm-1) compared with experi-ment (+76 cm-1), neither is very good. The calculated amideI, II, and III peak intensities are in very good agreement withexperiment (Table 6). The amide A intensity is stronglyenhanced in water (1.42× 10⁻² Debye2) compared to the gasphase (2.42× 10⁻³ Debye). The effect is much smaller for theamide I intensity, implying that the N-H bond is more polarizedwith the N-H stretch vibration in solution.
V. The Collective Solvent Coordinates
We have defined the following anharmonicity parameters forthe overtones and combination bands
TABLE 6: Infrared Peak Positions in Gas Phase, Solvent Peak Shift, fwhm, and Intensity for 4 Amide Modes of NMA in H2OSolutiong
amide I amide II amide III amide A
gas shift fwhm int gas shift fwhm int gas shift fwhm int gas shift fwhm int
S1 1724 -59 29 1.0 1497 +14 19 0.656 1232 +33 22 0.215 3428 -51 77 0.338S2 1724 -57 28 1.0 1497 -16 37 1232 +10 33 3428 -72 116EMa - -78 25NMb 1738 -102 1533 +47 1240 +92exp. 1728c -87c,d 29 1.0 1500c +76c,d 36 0.803 1259c +53c,d 32 0.205 3498e -78f
a Empirical ab initio map based on the normal mode ab initio calculations of several different NMA in H2O clusters.39 b Normal mode ab initiocalculations of the NMA+ 3H2O cluster in dielectric medium.38 c From ref 52.d From ref 23. Experimental peak shift, fwhm, and intensity ofamide III, II, and I modes are obtained from the multipeak Lorentzian fit to the infrared spectra38 shown in Figure 16 in the Supporting Information.Intensities are normalized with the frequency integrated intensity of amide I band.f Experimental amide A frequency shift is from ref 27.g Thecolumns represent the gas-phase frequency (gas), solvent peak shift (shift), fwhm (fwhm), and intensity (int) of the band in solution.
TABLE 7: Correlation Coefficients of Pairs of Frequencies and Anharmonicities (Eq 13)
ω1 ω2 ω3 ω4 ∆5 ∆6 ∆7 ∆8 ∆9 ∆10
ω1 (III) 1.00 0.60 -0.71 -0.53 -0.30 0.65 -0.10 0.84 0.63 0.11ω2 (II) 1.00 -0.16 -0.69 0.19 0.35 -0.33 0.38 0.09 -0.29ω3 (I) 1.00 0.15 0.22 -0.51 0.06 -0.74 -0.46 -0.07ω4 (A) 1.00 -0.04 -0.15 0.59 -0.24 0.10 0.52∆5 (III × 2) 1.00 0.03 0.07 -0.06 -0.16 -0.23∆6 (II × 2) - 1.00 0.23 0.73 0.64 0.27∆7 (I × 2) 1.00 0.08 0.61 0.75∆8 (III +II) 1.00 0.79 0.32∆9 (III +I) 1.00 0.77∆10 (II+I) 1.00
Figure 10. Normalized correlation functions of the 4 amide funda-mental states. Solid lines- real part, dashed lines- imaginary part.
Figure 11. Static distribution of the transition dipole moments for thefundamental transitions. Arrows represent the gas-phase transitiondipole. Average dipoles are 4.58 (amide III), 8.01 (amide II), 9.89(amide I), and 5.74 D (amide A). Variances are 0.282 (amide III), 0.410(amide II), 0.315 (amide I), and 1.012 (amide A). ∆ν ≡ ων1 + ων2 - ων (13)
9754 J. Phys. Chem. A, Vol. 109, No. 43, 2005 Hayashi et al.

whereν1 andν2 are the two fundamental states for the overtone(ν1 ) ν2) or combination states (ν1 * ν2). The static distributionsof the anharmonicities of 3 overtone and 3 combination statesare displayed in Figure 12. All states have a narrow (fwhm:5-15 cm-1) asymmetric distributions. Anharmonicities of theamide III and I overtones are a few cm-1 smaller in water thanin the gas phase, whereas the amide II overtone anharmonicitybecomes larger in water. The correlation functions of these 6anharmonicities are displayed in Figure 13. Scatter plots of theanharmonicities versus their fundamental frequencies are givenin Figure 14. The correlation between the two defined in thesame way as eq 11 is very weak, as shown in Table 7. Theamide I anharmonicity and fundamental have almost no cor-relation 0.06.
The 10 amide frequencies depend quadratically on the 19electrostatic componentsC in the DFT map (eq 9). We canextract the linear relationship between the frequency andelectrostatic fluctuations by linearizing the map around the
equilibrium electrostatic components⟨C⟩. A collective solventcoordinateΩν was constructed to describe the fluctuations ofeach of the 10 states. These are given by a linear combinationof the fluctuating part of the 19 electrostatic components
whereδC ) (δEx,‚‚‚,δExyz) andL ν ) (L1ν, ‚‚‚, L19
ν ) are definedas
The collective coordinates offer a simple physical picture forsolvent fluctuations and allow the high level simulation of lineshapes.42 The DFT map frequenciesωam
ν in eq 9 for the 4fundamentals are approximated by a quadratic polynomial inthe collective coordinateΩν
where the coefficient ofΩν is 1 by definition of the collectivecoordinate (eqs 14-16). The contribution of the electrostaticcomponentEi to the solvent shift is approximated as
The anharmonicities∆ν for the 3 overtone and the 3 combinationstates are also approximated as
Figure 12. Static distribution of the anharmonicity (eq 13) of 3overtone and 3 combination states. Arrows represent the gas-phaseanharmonicity.
Figure 13. Normalized correlation functions of 3 overtone and 3combination states. Solid lines- real part, dashed lines- imaginarypart.
Figure 14. Scatter plot of the amide III, II, and I anharmonicity versusthe fundamental frequency.
Ων ≡ ∑i)1
19
LiνδEi (14)
δC ) C - ⟨C⟩ (15)
L ν ) Oν(1) + Oν(2)†⟨C⟩ (16)
ωccν ) ωeq
ν + Ων + kΩν2 (17)
ωssνi ) Li
ν⟨Ei⟩ (18)
∆ccν ) ∆eq
ν + Ω′ν + kΩ′ν2 (19)
Complete Vibrational Amide Band of NMA J. Phys. Chem. A, Vol. 109, No. 43, 20059755

where Ω′ν ) Ων1 + Ων2 - Ων is the collective solventcoordinate for the anharmonicity∆ν. Here ν1 and ν2 are thetwo fundamental states for the overtone or combination state.The resulting collective coordinate frequency for the 3 overtoneand 3 combination states areωcc
ν ) ωccν1 + ωcc
ν2 - ∆ccν . The
contribution of each electrostatic component to the solvent shiftof the anharmonicity∆ss
ν is approximated as
whereLiν′ ) Li
ν1 + Liν2 - Li
ν. The collective coordinatesLi forthe 4 fundamentals, 3 overtones, and 3 combination states aregiven in Table 8. The contribution of each electrostaticcomponent to the solvent shift (∆ωi) is shown in Table 9. Thequadratic coefficients in eq 17 of all modes are tabulated inTable 10.Ex contributes most (49, 65, and 52%) to the solventpeak shift of amide I, III, and A. This is attributed to the factthat the hydrogen bonding to either O4 or H6 atoms is parallelto thex axis causing the positiveEx (corresponding to the large⟨Ex⟩), and the transition dipole moments in thex direction arelarge especially for amide I and A modes (corresponding to thelarge coefficientsLx in collective coordinates).Ey contributes25% and 13% to the amide I and A solvent shift. The second-order derivative tensors (Exxx, Eyyy, and Exyy) make strong
contributions (32, 67, and 27%) to the amide II solvent shift.They are also significant for amide I, III, and A. The diagonalelectric field gradient in the out-of-plane directionEzz isnegligible for all modes, which has a significant contributionin HOD in the D2O case.41 In pure water the two out-of-planehydrogen bonds to the HOD oxygen cause the diagonal electric
TABLE 8: Collective Solvent Coordinates for All 10 Amide States (4 Fundamentals, 3 Overtones, and 3 Combinations) incm-1 a
Liν Li
ν′
i III II I A III × 2 II × I × 2 III+II III +I II +I
x 2045 208 -2685 -3376 -624 234 -152 1491 825 188y -52 -313 -2422 -1482 271 -205 -287 -112 -702 -386z 0 0 0 0 0 0 0 0 0 0xx 378 -55 2392 -8436 -107 -229 -479 486 -19 -225yy -718 -111 -3182 1438 -132 -197 -671 291 -753 -162zz 876 1643 341 -798 -988 -193 18 651 593 251xy -1866 3671 3129 -6945 4515 -357 -703 68 -1022 -275xz 236 435 -35 -112 -33 -195 -20 39 204 -103yz 138 -1179 -223 -1288 -258 -384 15 81 -96 57xxx 3933 2560 -6978 -26844 -783 186 -1113 337 -994 -771yyy -840 -4189 -3896 -3931 -1835 -925 -614 -1367 -852 -7zzz 0 0 0 0 0 0 0 0 0 0xyy -7080 -3793 5368 616 250 -773 -2428 -1840 -4179 -845xxy 3711 1248 -3905 -16396 -979 -305 -1747 -719 -1595 -709xxz 0 0 0 0 0 0 0 0 0 0xzz 796 -355 -2632 7115 -1 33 -136 -70 -131 17yzz -547 -4675 -2692 1480 -123 -67 34 -153 33 42yyz 0 0 0 0 0 0 0 0 0 0xyz 0 0 0 0 0 0 0 0 0 0
a Linear coefficientsLiν (eq 14) are shown for fundamentals.Li
ν′ (eq 20) are tabulated for overtones and combinations.
TABLE 9: Contribution of Each Electrostatic Component to the Solvent Shift of 4 Amide Fundamental Statesa
amide III amide II amide I amide A
i ⟨Ei⟩a Lib ωss
i c Lib ωss
i c Lib ωss
i c Lib ωss
i c
x 0.0132 2045 64.9 208 26.2 -2685 48.5 -3376 51.7y 0.0076 -52 -1.0 -313 -22.6 -2422 25.2 -1482 12.6xx -0.0013 378 -1.2 -55 0.7 2392 4.3 -8436 -12.8yy 0.0011 -718 -2.0 -111 -1.2 -3182 5.0 1438 -1.9zz -0.0001 876 -0.3 1643 -2.2 341 0.1 -798 -0.2xy -0.0008 -1866 3.5 3671 -26.6 3129 3.3 -6945 -6.1xxx 0.0013 3933 12.5 2560 32.0 -6978 12.6 -26844 41.1yyy -0.0017 -840 3.4 -4189 66.6 -3896 -8.9 -3931 -7.6xyy -0.0008 -7080 12.9 -3793 27.2 5368 5.5 616 0.6xxy 0.0010 3711 8.8 1248 11.8 -3905 5.3 -16396 18.8xzz -0.0005 796 -1.0 -355 1.8 -2632 -1.8 7115 4.4yzz 0.0003 -547 -0.4 -4675 -13.1 -2692 1.1 1480 -0.6
a The units are a.u.-1. b The units are cm-1‚a.u..c These columns giveωssi normalized as∑iωss
i ) 100. Noncontributing electrostatic components(Ez, Exz, etc.) are not shown.
∆ssiν ) Li
ν′⟨Ei⟩ (20)
TABLE 10: Quadratic Polynomials of the CollectiveCoordinates for 10 Amide States: ωcc ) ωeq + Ω + kΩ2 forthe 4 Fundamental States and∆cc ) ∆eq + Ω′ + kΩ′2 forthe Anharmonicity of 3 Overtone and 3 Combination States
state ωeq (∆eq) k2 shifta fwhmb
1 1292.7 0.005301 +1.3 100.12 1516.2 -0.002990 +0.7 101.63 1670.0 -0.003862 +1.2 100.54 3449.9 -0.006801 -0.5 104.85 10.7 -0.0149466 13.0 0.0544897 14.3 -0.0260748 11.0 0.0196159 19.7 -0.023374
10 -3.1 -0.053952
a The differences of the solvent shifts in the infrared spectrumbetween collective coordinates and the DFT map are shown in cm-1.b The ratios of the fwhms from collective coordinates to the fwhmsfrom the DFT map are shown in %.
9756 J. Phys. Chem. A, Vol. 109, No. 43, 2005 Hayashi et al.

field gradient in the out-of-plane direction and lower the O-Hfrequency. In NMA, three hydrogen bonds to the carbonyloxygen and the amino hydrogen are all in theCs symmetry planeresulting in no significant field gradientEzz. The contributionsof the autocorrelation and crosscorrelation of electrostaticcomponents to the frequency variance⟨δω2⟩ are approximatedas
The contributions to the frequency variance of amide I, III, andA are shown in Table 12 of the Supporting Information.⟨ExEx⟩contributes most (37% and 48%) to amide I and III.⟨EyEy⟩ hasthe second largest contribution to the amide I. The second-orderderivatives (⟨ExExyy⟩ and⟨ExyyExyy⟩) are more important for amideIII.
Scatter plots ofωmap vs ωcc for the 4 fundamental states andanharmonicities of 3 overtone and the 3 combination states aregiven in Figures 15 and 16. Frequencies of all 4 fundamentalstates and anharmonicities41 from the collective coordinate agreevery well with the DFT map. The infrared spectrum calculated
using the collective coordinate using eq 17 is displayed in Figure17 of the Supporting Information. The difference of the solventpeak shift of the infrared band between the collective coordinateand DFT map calculations and the ratio of the collectivecoordinate fwhm with respect to the DFT map fwhm arereported in Table 10.
The collective solvent coordinates for the internal coordinatesare also defined in the same way as eq 14. The contributions ofeach electrostatic component to the solvent shifts of the internalcoordinates are listed in Table 11.
VI. Discussion
We have analyzed the solvent effects on the infrared spectrumof NMA using a DFT electrostatic map constructed at theBPW91/6-31G(d,p) level. The vibrational anharmonic Hamil-
Figure 15. Scatter plots of the fundamental frequencies from DFTmapωmapversus the approximate collective coordinate expressionsωcc
(eq 17). The blue lines have a unit slopeωmap ) ωcc.
⟨δω2⟩ = ∑i,j
LiLj⟨δEiδEj⟩ (21)
TABLE 11: Collective Solvent Coordinates for the Internal Coordinates
CdO C-N N-H C-N-H
i ⟨Ei⟩a Li′ b Rssi c Li′ b Rss
i c Li′ b Rssi c Li′ b Rss
i c
x 0.0132 0.811 71.3 -0.674 140.3 0.257 58.4 9.35 -48.6y 0.0073 0.173 8.4 0.877 -101.4 0.037 4.6 -24.24 70.0z 0.0004 -0.000 -0.0 -0.000 0.0 0.000 0.0 0.06 -0.0xx -0.0013 -0.523 4.5 0.495 10.2 0.177 -3.9 70.25 36.2yy 0.0012 0.611 4.7 -0.289 5.2 -0.052 -1.0 -78.81 35.8zz -0.0002 -0.034 0.0 -0.245 -0.6 -0.123 0.3 8.12 0.5xy -0.0008 -0.621 3.1 0.539 6.4 0.188 -2.4 -349.40 -103.7xz -0.0001 -0.000 0.0 -0.000 -0.0 -0.000 0.0 -0.04 -0.0yz 0.0000 0.000 -0.0 0.000 0.0 0.000 0.0 -0.01 -0.0xxx 0.0013 1.305 11.4 -0.272 5.6 0.666 15.1 66.58 -34.6yyy -0.0017 0.509 -5.6 2.624 68.8 -0.255 7.3 102.12 66.9zzz 0.0001 0.000 0.0 0.000 0.0 0.000 0.0 0.00 0.0xyy -0.0007 -0.734 3.6 -0.551 -6.5 -0.407 5.2 118.99 35.2xxy 0.0010 0.150 0.9 0.334 -5.2 0.604 10.2 -54.36 21.1xxz 0.0000 0.000 0.0 0.000 0.0 0.000 0.0 0.00 0.0xzz -0.0005 0.905 -3.1 -0.980 -8.1 -0.675 6.1 10.33 2.1yzz 0.0003 0.231 0.4 3.021 -14.7 0.000 0.0 -155.13 18.9yyz 0.0000 0.000 0.0 0.000 0.0 0.000 0.0 0.00 0.0xyz 0.0000 0.000 0.0 0.000 0.0 0.000 0.0 0.00 0.0
a The units for columns are a.u.-1. bThe units for columns are cm-1‚a.u..c These columns representRssi normalized as∑iRss
i ) 100.Noncontributing electrostatic components (Ez, Exz, etc.) are not shown.
Figure 16. Scatter plots of anharmonicities from the DFT map (∆map)versus the approximate collective coordinate expressions (∆cc in eq 19)for 3 overtone and 3 combination states. The blue lines have a unitslope∆map ) ∆cc.
Complete Vibrational Amide Band of NMA J. Phys. Chem. A, Vol. 109, No. 43, 20059757

tonian is expanded to sixth order in 5 normal coordinates locatedon the amide bond (a mixture of N-H bend and methyldeformation, amide III, II, I, and A modes) in the presence ofthe external electric field and its gradient-tensor. Calculationswere carried out using Gaussian 03 modified to allow geometryoptimizations in a spatially inhomogeneous electric field (seeAppendix A of ref 41). The vibrational eigenstates werecalculated using the Arnoldi algorithm for diagonalization ofthe Hamiltonian using the harmonic basis set.
The electrostatic potential generated by the solvent isexpanded to third order in Cartesian displacements, and the abinitio electrostatic map is constructed by expanding the frequen-cies of amide I, II, III, and A modes to second order in the 19electrostatic components. The coefficients are calculated bynumerical derivatives of the vibrational eigenstates of the sixth-order anharmonic vibrational Hamiltonian constructed aroundthe equilibrium geometries in the presence of spatially nonuni-form external electric fields. Therefore the DFT map implicitlyincludes the geometry changes of NMA19 due to the solvent-induced polarization.
The equilibrium geometry fluctuations of NMA were calcu-lated. The CdO and N-H stretch bond lengths are longer thanin the gas phase and the C-N stretch bond length is shorter.Negative correlation between the CdO and C-N bond lengthsis observed. This suggests that the relative contribution of theresonance N2+dC3-O4- form becomes larger and the N2-C3dO4 form becomes smaller in water than in the gas phase.The amide I and A frequencies are strongly correlated with theCdO and N-H stretch bond lengths, respectively.
The calculated amide I, II, and III gas-phase frequencies arein good agreement with experiment to within 3-27 cm-1 withno scaling. The calculated amide A mode is 70 cm-1 lowerthan experiment. The fundamental amide I, II, and III frequen-cies are lower by 9-12 cm-1 compared to the harmonicfrequencies. The fundamental amide A frequency is 155 cm-1
lower than the harmonic frequency. The BPW91 functional hasbeen known to give good harmonic frequencies of the NMAamide. The anharmonic effects on the amide fundamentalfrequencies are comparable to the difference between thecalculated frequency and experiment, suggesting the importanceof anharmonic effects when high level electron correlationcontributions are included. The fidelity of DFT functionals forvibrational spectroscopy should therefore be tested by comparingnot only the harmonic frequencies but also the actual vibrationaleigenstates with experiment.
Infrared absorption of the amide modes was calculated bycombining the ab initio electrostatic map and the trajectory ofthe 19 electrostatic components obtained by least-squares fits.Two sampling strategies for the inhomogeneous electric fieldobtained from the MD trajectory were employed to determinethese components. S1 uses 65 sampling points which cover thedominant areas of the transition charge densities (TCDs) ofamide modes. S2 uses 7 points (4 amide atoms, the origin ofthe coordinate, and 2 out of plane). S1 reproduces the globalelectric field structure, whereas S2 gives the electric field locallyat 4 atom positions in the amide group. Both S1 and S2reproduce the experimental solvent shift and line width of amideI and give a similar solvent shift and line width of amide A.However only S1 reproduces the experimental amide III solventshift and predicts the amide II blueshift, consistent withexperiment (S2 gives a redshift). Overall the global sampling(S1) performs better than the atom position sampling (S2). Theamide II and III modes cannot be parametrized by theelectrostatic potential at the atom positions alone. This can be
rationalized since the amide III TCD is more delocalized overthe amide group and their bonds to carbons in 2 methyl groups.The global electric field structure in the area where the TCDsof amide vibrations are significant is important to the infraredresponse. This map can be applied to larger peptides. Theelectrostatic potential is spatially nonuniform, and higher orderderivatives in the vicinity of NMA can improve the results forall amide modes. The amide modes are sensitive to intermo-lecular hydrogen bonding vibrations. The 660 cm-1 to 1100cm-1 frequencies of the damped oscillatory profiles in thefrequency autocorrelation functions of amide modes are closeto the two frequencies 674 cm-1 and 726 cm-1 bendingvibrations of hydrogen bonding to amide oxygen of NMAobtained from the normal mode calculation of the NMA-3H2Ocluster.
The scatter plots of fluctuating anharmonicity of amide III,II and I modes versus their fundamental frequencies shown inFigure 14 suggest that the amide III and I mode anharmonicitieshave almost no correlation with their fundamental frequencies,whereas the amide II anharmonicity has a weak positivecorrelation with its fundamental frequency.
The absence of correlation between the anharmonicities andfundamentals may be traced to their different dependence onthe electrostatic components of the solvent collective coordinates(Table 8). For example the anharmonicity and fundamentalamide I frequencies depend onEx andEy with the coefficienthaving the same sign but depend on some of the electric fieldgradient components with different signs. Therefore the electricfield shifts the anharmonicity and fundamental frequency in thesame direction (positive correlation), but some electric fieldgradient components cause opposite shifts (negative correlation),resulting in almost no correlation when all electrostatic com-ponents are included. The positive correlation due to the constantelectric field can be rationalized using the Morse potential modelin the presence of the dipole-constant external electric fieldinteraction. By neglecting the mechanical anharmonicity, thestabilization energysµ‚E becomes linear in the coordinate,which shifts the energy minimum and shifts the fundamentaland anharmonicity in the same direction. The interactions ofthe molecule with the electric field derivatives are complex andaffect the fundamental and anharmonicity in different ways.
The 4 amide fundamental frequencies and the anharmonicitiesof 3 overtones and 3 combination states can be reproduced bya quadratic dependence on 10 collective solvent coordinates.The frequencies from the DFT map and the collective coordi-nates are very close, and the linear-infrared spectra from theDFT map and the collective coordinates are virtually identical,suggesting the collective solvent coordinates provided a gooddescription of frequency fluctuations. Correlations between theanharmonicity of 6 overtone and combination states and theirfundamental frequencies are found to be very weak.Ex
contributes primarily to the collective coordinates for amide Iand III. The second-order derivatives of electric field (Exxx, Exyy,and Eyyy) contribute significantly to all modes, especially theamide II.
Finally, we summarize the procedure for calculating theinfrared spectrum of NMA amide modes and generating thediagonal frequency fluctuations of protein local amide modes.MD simulations should be performed for more than 1 ns to getenough statistics. The electric field and its derivatives arecalculated using least-squares fitting with sampling points S1described in section II. Collective coordinates for 4 amidefundamental states can be calculated using eq 14. The collectivecoordinates for the anharmonicity of the 3 overtone and 3
9758 J. Phys. Chem. A, Vol. 109, No. 43, 2005 Hayashi et al.

combination states are calculated by eq 20. All coefficients ofthe collective coordinates are presented in Table 8. Each amidefrequency is calculated as a quadratic polynomial of thecollective coordinate (eq 17 for fundamental and eq 19 foranharmonicities). The quadratic expansion coefficients areshown in Table 10. The spectrum of NMA can be calculatedusing CGF approximation (see eqs 20-23 of ref 41).
Acknowledgment. The support of the National Institutes ofHealth Grant No. (2 RO1 GM059230-05) and the NationalScience Foundation Grant No. (CHE-0446555) is gratefullyacknowledged. We wish to thank Prof. Timothy A. Keiderlingfor providing his experimental data.
Supporting Information Available: Tables 8-14 andFigures 15-17. This material is available free of charge viathe Internet at http://pubs.acs.org.
References and Notes
(1) Asbury, J. B.; Steinel, T.; Stromberg, C.; Gaffney, K. J.; Piletic, I.R.; Goun, A.; Fayer, M. D.Chem. Phys. Lett. 2003, 374, 362.
(2) Bredenbeck, J.; Hamm, P.J. Chem. Phys. 2003, 119, 1569.(3) Khalil, M.; Demirdoven, N.; Tokmakoff, A.J. Phys. Chem. A2003,
107, 5258.(4) Krummel, A. T.; Mukherjee, P.; Zanni, M. T.J. Phys. Chem. B
2003, 107, 9165.(5) Woutersen, S.; Pfister, R.; Hamm, P.; Mu, Y.; Kosov, D. S.; Stock,
G. J. Chem. Phys.2002, 117, 6833.(6) Golozka, O.; Khalil, M.; Demirdoven, N.; Tokmakoff, A.Phys.
Ref. Lett.2001, 86, 2154.(7) Thompson, D. E.; Merchant, K. A.; Fayer, M. D.J. Chem. Phys.
2001, 115, 317.(8) Woutersen, S.; Hamm, P.J. Chem. Phys. 2001, 115, 7737.(9) Woutersen, S.; Hamm, P.J. Chem. Phys. 2001, 114, 2727.
(10) Zanni, M. T.; Asplund, M. C.; Hochstrasser, R. M.J. Chem. Phys.2001, 114, 4579.
(11) Piryatinski, A.; Tretiak, S.; Chernyak, V.; Mukamel, S.J. RamanSpectrosc. 2000, 31, 125.
(12) Merchant, K. A.; Noid, W. G.; Akiyama, R.; Finkelstein, I. J.; Goun,A.; McClain, B. L.; Loring, R. F.; Fayer, M. D.J. Am. Chem. Soc.2003,125, 13804.
(13) Tanimura, Y.; Mukamel, S.J. Chem. Phys. 1993, 99, 9496.(14) Hamm, P.; Lim, M. H.; Hochstrasser, R. M.J. Phys. Chem. B1998,
102, 6123.(15) Scheurer, C.; Mukamel, S.Bull. Chem. Soc. Jpn.2002, 75, 989.(16) Moran, A. M.; Park, S.-M.; Mukamel, S.J. Chem. Phys. 2003,
118, 9971.(17) Cheatum, C. M.; Tokmakoff, A.; Knoester, J.J. Chem. Phys. 2004,
120, 8201.(18) Demirdoven, N.; Cheatum, C. M.; Chung, H. S.; Khalil, M.;
Knoester, J.; Tokmakoff, A.J. Am. Chem. Soc. 2003, 126, 7981.(19) Guo, H.; Karplus, M.J. Phys. Chem.1992, 96, 7273.(20) Ludwig, R.; Weinhold, F.; Farrar, T. C.J. Phys. Chem. A1997,
101, 8861.
(21) Ludwig, R.; Weinhold, F.; Farrar, T. C.J. Chem. Phys.1997, 107,499.
(22) Torii, H.; Tatsumi, T.; Tasumi, M.J. Raman Spectrosc.1998, 29,537.
(23) Chen, X. G.; Schweitzerstenner, R.; Asher, S. A.; Mirkin, N. G.,Krimms, S.J. Phys. Chem.1995, 99, 3074.
(24) Papamokos, G. V.; Demetropoulos, I. N.J. Phys. Chem. A2004,108, 7291.
(25) Renugopalakrishnan, V.; Madrid, G.; Cuevas, G.; Hagler, A. T.Proc. - Indian Acad. Sci., Chem. Sci.2000, 112, 35.
(26) Cuevas, G.; Renugopalakrishnan, V.; Madrid, G.; Hagler, A. T.Phys. Chem. Chem. Phys.2002, 4, 1490.
(27) Zhang, R.; Li, H. R.; Lei, Y.; Han, S. J.J. Mol. Struct.2004, 693,17.
(28) Moller, C.; Plesset, M. S.Phys. ReV. 1934, 46, 618.(29) Headgordon, M.; Pople, J. A.; Frisch, M.J. Chem. Phys. Lett.1988,
153, 503.(30) Frisch, M. J.; Headgordon, M.; Pople, J. A.Chem. Phys. Lett. 1990,
166, 281.(31) Perdew, J. P.; Chevary, J. A.; Vosko, S. H.; Jackson, K. A.;
Pederson, M. R.; Singh, D. J.; Fiolhais, C.Phys. ReV. B 1992, 46, 6671.(32) Becke, A. D.Phys. ReV. A 1988, 38, 3098.(33) Becke, A. D.J. Chem. Phys. 1993, 98, 1372.(34) Becke, A. D.J. Chem. Phys.1993, 98, 5648.(35) Tsuzuki, S.; Luthi, H. P.J. Chem. Phys. 2001, 114, 3949.(36) Onsager, L.Phys. ReV. 1938, 54, 554.(37) Wong, M. W.; Frisch, M. J., Wiberg, K. B.J. Am. Chem. Soc.
1991, 113, 4776.(38) Kubelka, J.; Keiderling, T. A.J. Phys. Chem. A2001, 105, 10922.(39) Kwac, K.; Cho, M. H.J. Chem. Phys. 2003, 119, 2247.(40) Kwac, K.; Cho, M. H.J. Chem. Phys.2003, 119, 2256.(41) Hayashi, T.; Jansen, T. l. C.; Zhuang, W.; Mukamel, S.J. Phys.
Chem. A2005, 109, 64.(42) Jansen, T. l. C.; Hayashi, T.; Zhuang, W.; Mukamel S.J. Chem.
Phys.In press.(43) Moran, A. M.; Mukamel, S.Proc. Natl. Acad. Sci. 2004, 101, 506.(44) Nose, S.J. Chem. Phys. 1984, 81, 511.(45) Berendsen, H. J. C.; Postma, J. P. M.; Gunsteren, W. F. v.; DiNola,
A.; Haak, J. R.J. Chem. Phys. 1984, 81, 3684.(46) Andersen, H. C.J. Comput. Phys. 1983, 52, 24.(47) Essmann, U.; Perera, L.; Berkowitz, M. L.; Darden, T.; Lee, H.;
Pedersen, L. G.J. Chem. Phys. 1995, 103, 8577.(48) Frisch, M. J. et al. Gaussian 03, revision c. 01, 2003.(49) Hayashi, T.; Mukamel, S.J. Phys. Chem. A2003, 107, 9113.(50) Lehoucq, R. B.; Sorensen, D. C.; Yang, C.ARPACK Users
Guide: solution of Large Scale EigenValue Problems with ImplicitlyRestarted Arnoldi Methods, 1998.
(51) Hayashi, T.; Mukamel, S.Bull. Korean Chem. Soc.2003, 24, 1097.(52) Mayne, L. C., Hudson, B.J. Phys. Chem.1991, 95, 2962.(53) Mukamel, S.Phys. ReV. A 1983, 28, 3480.(54) Mukamel, S.; Abramavicius, D.Chem. ReV. 2004, 104, 2073.(55) Allen, M. P.; Tildesley, D.Computer Simulation of Liquids; Oxford
University Press: Oxford, 1987.(56) Mukamel, S.Principles of Nonlinear Optical Spectroscopy; Oxford
University Press: New York, 1995.(57) Herrebout, W. A.; Clou, K.; Desseyn, H. O.J. Phys. Chem. A2001,
105, 4865.
Complete Vibrational Amide Band of NMA J. Phys. Chem. A, Vol. 109, No. 43, 20059759