Mineralization Potential of Electrospun PDO-Hydroxyapatite ...
Electrospun Polyurethane Fibers for Absorptionof Volatile Organic Compounds from Air
The MIT Faculty has made this article openly available. Please share how this access benefits you. Your story matters.
Citation Scholten, Elke, Lev Bromberg, Gregory C. Rutledge, and T. AlanHatton 2011Electrospun Polyurethane Fibers for Absorption ofVolatile Organic Compounds from Air. ACS Applied Materials &Interfaces 3(10): 3902–3909.
As Published http://dx.doi.org/10.1021/am200748y
Publisher American Chemical Society
Version Author's final manuscript
Citable link http://hdl.handle.net/1721.1/81271
Terms of Use Creative Commons Attribution-Noncommercial-Share Alike 3.0
Detailed Terms http://creativecommons.org/licenses/by-nc-sa/3.0/
1
Electrospun Polyurethane Fibers for Absorption of Volatile Organic Compounds from Air
Elke Scholten,† Lev Bromberg, Gregory C. Rutledge and T. Alan Hatton*
Massachusetts Institute of Technology, Department of Chemical Engineering,
77 Massachusetts Avenue, Cambridge, MA 02139 USA † Current Address: Food Physics Group, Department of Agrotechnology and Food Sciences, Wageningen University, Bomenweg 2, 6703 HD Wageningen, The Netherlands *Corresponding author: [email protected]; phone: 617 253 4588; fax: 617 253 8723
Abstract
Electrospun polyurethane fibers for removal of volatile organic compounds
(VOC) from air with rapid VOC absorption and desorption have been developed.
Polyurethanes based on 4,4-methylenebis(phenylisocyanate) (MDI) and aliphatic
isophorone diisocyanate as the hard segments and butanediol and tetramethylene glycol
as the soft segments were electrospun from their solutions in N,N-dimethylformamide to
form micron-sized fibers. Although activated carbon possessed a many-fold higher
surface area than the polyurethane fiber meshes, the sorption capacity of the polyurethane
fibers was found to be similar to that of activated carbon specifically designed for vapor
adsorption. Furthermore, in contrast to VOC sorption on activated carbon, where
complete regeneration of the adsorbent was not possible, the polyurethane fibers
demonstrated a completely reversible absorption and desorption, with desorption
obtained by a simple purging with nitrogen at room temperature. The fibers possessed a
high affinity toward toluene and chloroform, but aliphatic hexane lacked the attractive
interactions with the polyurethane chains and therefore was less strongly absorbed. The
selectivity of the polyurethane fibers toward different vapors, along with the ease of
regeneration, makes them attractive materials for VOC filtration.
Keywords: regenerable filter, electrospun polyurethane fibers, absorption capacity
2
1. Introduction
Significant quantities of volatile organic compounds (VOCs) are emitted into the
air, both indoors and outdoors, each year by various sources, including both deliberate
and fugitive emissions from industrial plants, vehicles and aircraft. The presence of
indoor VOCs is associated with odors and health effects such as sensory irritation and the
more complex set of symptoms known as Sick Building Syndrome (SBS). More recently,
a possible link between the increase in allergies and exposure to VOCs has been
suggested, and the number of complaints in aircraft of unpleasant odors and cabin
environment has increased significantly.1 VOC removal from a large diversity of sources
is thus desirable to decrease the negative health risks in both outdoor and indoor
environments.
Among the various methods for VOC abatement,2 adsorption has been regarded
as one of the most effective ways to decrease VOC levels and to improve air quality.
Activated carbons have generally been a logical choice for the removal of VOCs from air
streams as their high surface area and large pore volume enable their adsorption at low
concentrations. However, disadvantages in using activated carbons include high pressure
drops over the adsorbent bed, a decrease in adsorption capacity after the initial adsorption
(carbon fouling) and the difficulty of regeneration of the activated carbon on site.
Conventionally, activated carbons are regenerated3 by steam desorption of the adsorbed
VOC followed by optional drying and cooling steps. The steam-air-solvent vapor mixture
is then condensed and sent to appropriate separation devices. Water remaining in the bed
can be exhausted to the atmosphere. The two optional steps are required if water is
detrimental to the adsorption or if the hot carbon acts as a catalyst for the conversion of
the solvent. Due to these difficulties in regeneration of activated carbon, these filter types
are often discarded after a single cycle and are not reused.
In many of the applications for removal of trace organic compounds from
enclosed environments, it is desirable to be able to regenerate the adsorbents under
ambient conditions of temperature and pressure. To circumvent the problems associated
with carbon adsorbents, and to enable air filters to be used multiple times, alternative
3
approaches to increase the efficiency of the adsorption process and to enhance the
regeneration of the adsorbents have been considered.
The adsorbent materials (carbon) are usually obtained in a powder or granular
form, which in many cases may constrain their use. The inclusion of adsorbent materials
in other forms might be advantageous; for instance, the incorporation of activated carbon
in more flexible matrices to form activated carbon fabric (ACF) cloths allows the
pressure drop problems to be circumvented,4 but regeneration of the adsorbent is still an
unresolved issue. The large adsorption capacity of activated carbon can be ascribed to its
large internal pore surface area, which suggests that utilization of adsorbents in structures
with very small diameters (thus large surface areas) is of interest and is, indeed,
becoming more popular.5,6 One option is to increase the surface area of the adsorbent
material by its fabrication in the form of fibrous materials. In this paper we show that
electrospun polyurethane fibers have high sorption capacities and rapid sorption and
desorption rates for VOCs.
Polymer solutions have been used extensively for the spinning of variously sized
fibers,7-13 and over the past decade or so, much attention has been paid to the production
of core-shell,14,15 hollow, and porous16-18 electrospun fibers for applications in the field of
applied nanotechnology where they have also been surface-modified to provide specific
thermal, chemical and biomedical protection capabilities.19-21 Electrospun fibers have
been investigated widely22-24 for medical sensors and photonics,25 tissue engineering
scaffolds,26,27 wound dressing materials,28 waterproof breathable fabrics,29 vascular
graft30 and antimicrobial applications.31,32 Applications of polyurethane filters based on
nanofiber nonwoven meshes prepared by the electrospinning process in air filtration have
been implied.33 It is to be anticipated that these electrospun fibers with their very high
surface areas may enable efficient VOC filtration, but, to our knowledge, such fibers have
not been used for absorption purposes and no comparison of the capacities of activated
carbon and electrospun polymeric systems has been made. It is the goal of this work to
provide such an assessment.
Polyurethanes have been investigated in the form of foams or membranes for the
uptake or separation of organic liquids,34-39 organic vapors,40, 41 metal ions,42 and water.43,
44 Pinto and coworkers, in particular, have implemented polyurethane foams as an
4
adsorbent material, reporting that their interactions with various volatile organic
compounds enable their use for the adsorption of VOCs to increase the quality of indoor
air.41 Due to the high permeability of water vapor at high temperatures and considerably
lower permeability capacity at lower temperatures, these polyurethanes are being coated
onto various materials to produce breathable fabrics.43 Biofilters packed with
polyurethane foams inoculated with a mixed microbial population were used successfully
to adsorb and degrade toluene.45 Saeed showed that polyurethane foams also have strong
selectivity for specific metal ion adsorption and that this adsorption is an endothermic
process.42
These polyurethane systems are promising alternatives to activated carbon as
adsorbent materials, and should be particularly effective for VOC removal in the form of
non-woven fibrous mats. In the present work we have designed polyurethane fibers with
VOC removal efficiencies comparable to those of activated carbon, but with significantly
easier regeneration through complete desorption of the adsorbed VOC at room
temperature on purging with a neutral gas steam. The implementation of non-woven
polyurethane fiber mats might be able to overcome the problems related to the use of the
carbon powder.
In this paper, we focus on VOC filters consisting of polyurethane fibers. By
varying the ratio between rigid and flexible diol constituents within the polymers,
structural properties of the polyurethanes can be altered to vary the structures of
polyurethane fiber mats from rubber-like to crystalline 22,38,44,46-49
5
2. Experimental section
Chemicals
4,4-Methylenebis(phenyl isocyanate) (MDI, 98%), butanediol (BD), isophorone
diisocyanate (IPDI, 98%), and poly(tetramethylene glycol) (PTMG, MW 2000) were all
purchased from Sigma-Aldrich Chemical Co. and used as received. Organic solvents
N,N-dimetylformamide (DMF), tetrahydrofuran (THF), acetone, hexane, chloroform and
toluene were purchased from commercial sources and were of highest purity available.
The solvents were dried using molecular sieves (3Å) prior to the use. Granular activated
carbon (GC 4-10B, nominal surface area, 1000 m2/g, derived from bituminous coal) was
obtained from General Carbon Corporation (Paterson, NJ). This activated carbon was
designed for vapor phase applications including the absorption of organic contaminants
from vapor streams.
Polymer synthesis
The MDI-based polyurethane was synthesized by polycondensation as follows.
MDI solution (17.3 g,69.2 mmol) in 200 mL of anhydrous THF was mixed with PTMG
(27.7 g,13.8 mmol) and 0.1 mL of dibutylin dilaurate under anhydrous conditions. The
resulting mixture was kept at 70 ºC with reflux for 16 h, and then 5.0 g (55.4 mmol) of
BD were added. The above ratio between soft and hard segments was chosen based on its
reported spinnability.46 The resulting solution was kept at 70 ºC for 3 h, at which point
the viscosity of the solution did not change anymore, indicating that the reaction had been
completed. The viscous solution was allowed to equilibrate at room temperature and the
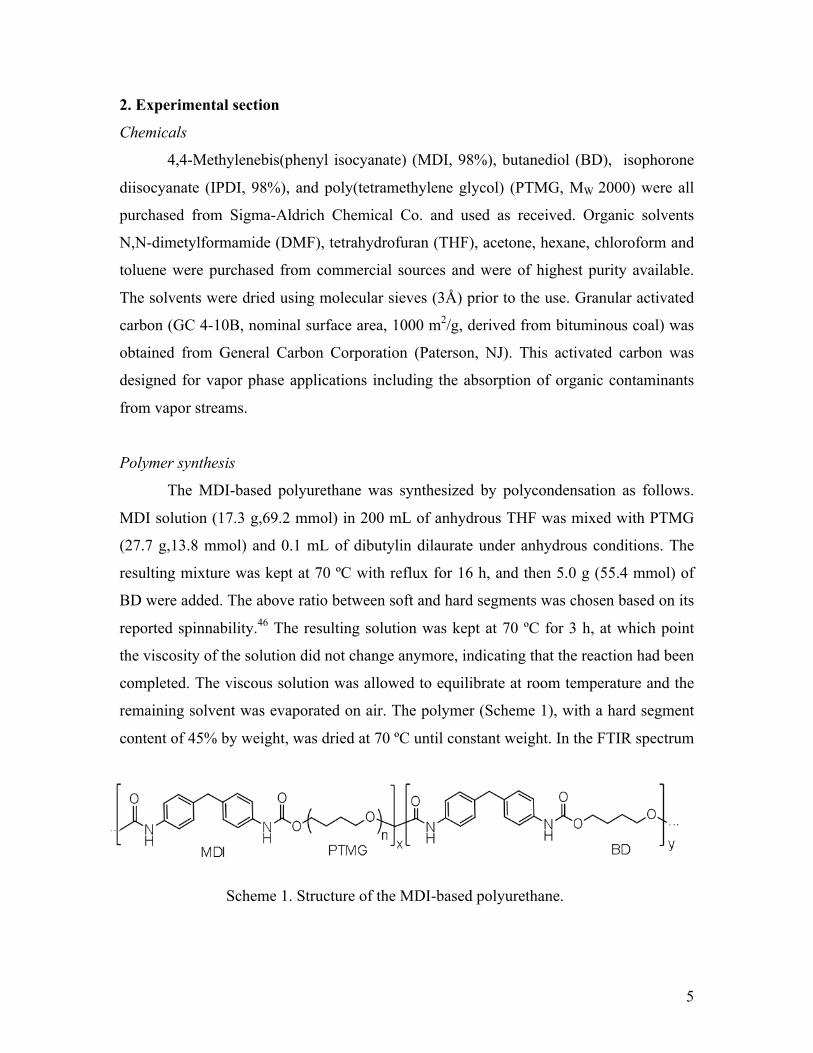
remaining solvent was evaporated on air. The polymer (Scheme 1), with a hard segment
content of 45% by weight, was dried at 70 ºC until constant weight. In the FTIR spectrum
Scheme 1. Structure of the MDI-based polyurethane.
6
of the polymer, the isocyanate signal at 2270 cm-1 disappeared and a band at 1730 cm-1
appeared instead, which is indicative of the >C=O stretch in formed urethane groups. A
model polyurethane-urea derivative of MDI was synthesized by polymerizing a 10 wt%
MDI solution in toluene with added 1.5 wt% triethanolamine and 1.5 wt% water at 70oC
for 3 days followed by removal of all solvents under vacuum until constant weight.
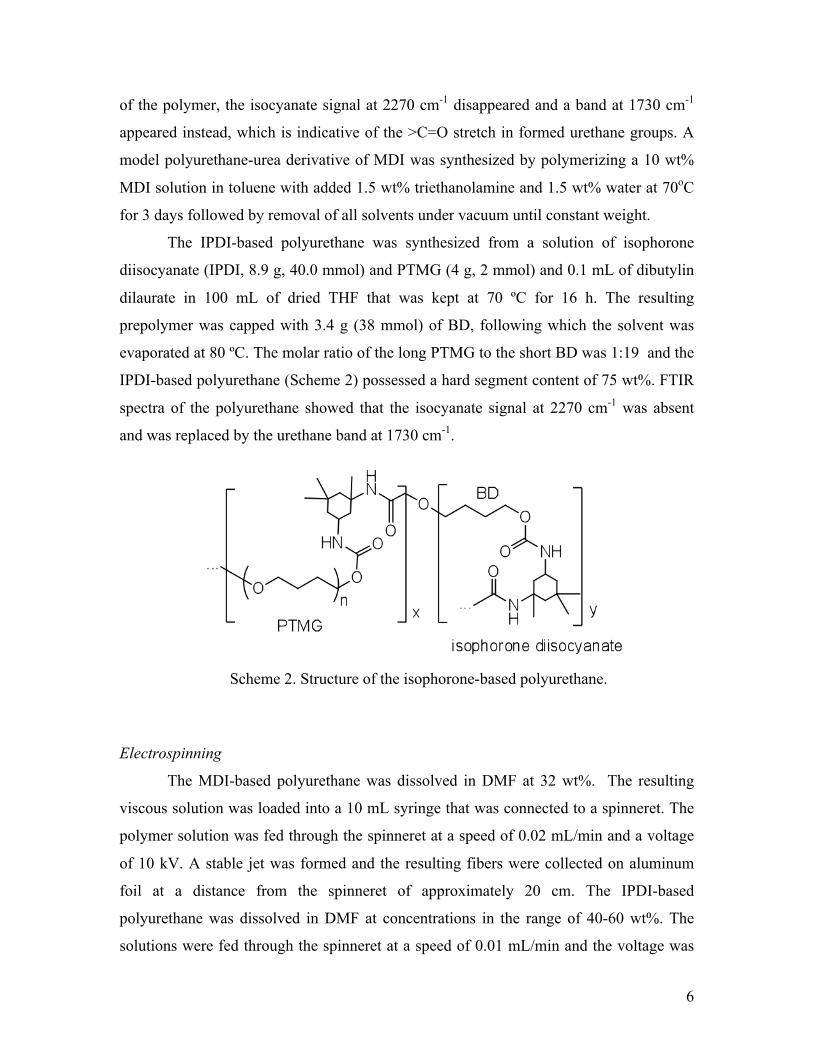
The IPDI-based polyurethane was synthesized from a solution of isophorone
diisocyanate (IPDI, 8.9 g, 40.0 mmol) and PTMG (4 g, 2 mmol) and 0.1 mL of dibutylin
dilaurate in 100 mL of dried THF that was kept at 70 ºC for 16 h. The resulting
prepolymer was capped with 3.4 g (38 mmol) of BD, following which the solvent was
evaporated at 80 ºC. The molar ratio of the long PTMG to the short BD was 1:19 and the
IPDI-based polyurethane (Scheme 2) possessed a hard segment content of 75 wt%. FTIR
spectra of the polyurethane showed that the isocyanate signal at 2270 cm-1 was absent
and was replaced by the urethane band at 1730 cm-1.
Electrospinning
The MDI-based polyurethane was dissolved in DMF at 32 wt%. The resulting
viscous solution was loaded into a 10 mL syringe that was connected to a spinneret. The
polymer solution was fed through the spinneret at a speed of 0.02 mL/min and a voltage
of 10 kV. A stable jet was formed and the resulting fibers were collected on aluminum
foil at a distance from the spinneret of approximately 20 cm. The IPDI-based
polyurethane was dissolved in DMF at concentrations in the range of 40-60 wt%. The
solutions were fed through the spinneret at a speed of 0.01 mL/min and the voltage was
Scheme 2. Structure of the isophorone-based polyurethane.
7
set at 30 kV. The fibers were collected at a distance of approximately 20 cm. The fiber
mats were removed from the foil and were dried in a vacuum oven at 3.7 kPa to prevent
the fibers from welding together by traces of solvent not yet removed during the
electrospinning process. The fibers were further dried at 10-3 Pa vacuum.
Thermal analysis
Glass transition and melting temperatures of the polyurethane fibers mats were
obtained using differential scanning calorimetry (DSC Model Q1000, TA Instruments,
Inc.). After equilibrating at -90 ºC for 3 minutes, the fiber mats loaded into aluminum
pans were heated to 180 ºC at 10 ºC/min and the heating thermograms were recorded.
Fiber morphology
The morphology of the electrospun polyurethane fibers was visualized using a
JEOL JEM-9310 scanning electron microscope (SEM). Small parts of the non-woven
fiber mats were transferred onto a SEM sample holder and were sputtered with gold or
palladium for 20 - 30 s. Surface area of the polyurethane fiber was measured using an
ASAP 2010 apparatus (Micromeritics Instrument Corp., Norcross, GA). The
polyurethane non-woven fiber mat was cut into small pieces of 5 x 5 mm in order to fill
the sample holder of the apparatus. The sample was first degassed by heating to
approximately 100 ºC at low pressure, and then transferred into a liquid nitrogen bath and
cooled down to -196 ºC. The adsorption and desorption curves were constructed via
changing the relative pressure inside the sample holder and recording the change of
adsorbed nitrogen on the polyurethane fibers.
Adsorption experiments
For the adsorption experiments with both polyurethane fiber mats and activated
carbon, we used a magnetic suspension balance (Rubotherm, Bochum, Germany) fed
through stainless steel tubing with a stream of nitrogen at a flow rate of 100 mL/min
(1.25 mg/min) regulated with a flow controller (Aalborg, Orangeburg, NY). The nitrogen
stream was first passed through a temperature-controlled chamber, where the gas was
allowed to reach its desired temperature (25ºC-45 ºC), and then entered the sample
8
chamber, where a small sample holder was filled with the non-woven fiber mat or
activated carbon. After the weight of the fibers in the sample stabilized, a pump was
turned on allowing the selected solvent to be injected into a heating chamber, where it
vaporized and was mixed with the flowing nitrogen stream. The VOC concentration in
the nitrogen stream was controlled by varying this pumping rate. The adsorbent was
challenged with the nitrogen/vapor mixture of known composition, during which its
weight increased and then plateaued, indicating that equilibrium had been reached. The
fiber absorption capacity was calculated as C = [(M/M0)-1] g/g fiber, where M and M0 are
the equilibrium and initial masses of the sample, respectively. Both the fibers and the
activated carbon were dried at 10-3 Pa and were transported in a closed system while
performing the absorption/desorption experiments.
9
3. Results and Discussion
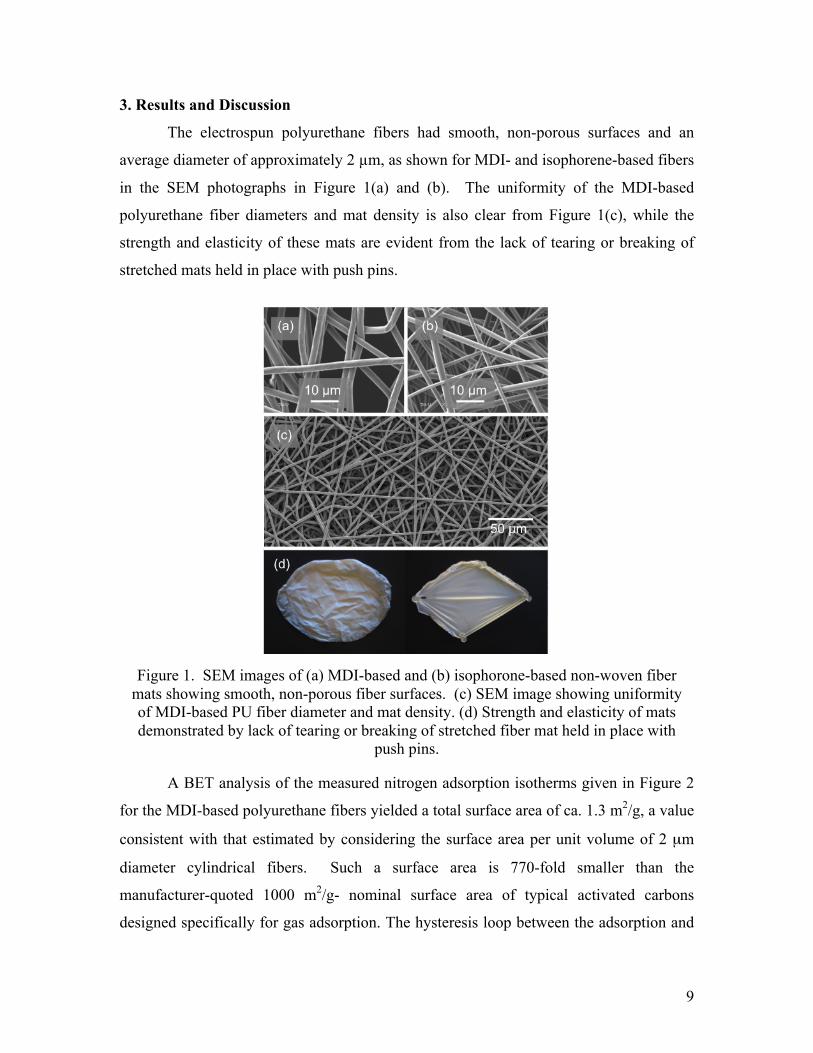
The electrospun polyurethane fibers had smooth, non-porous surfaces and an
average diameter of approximately 2 µm, as shown for MDI- and isophorene-based fibers
in the SEM photographs in Figure 1(a) and (b). The uniformity of the MDI-based
polyurethane fiber diameters and mat density is also clear from Figure 1(c), while the
strength and elasticity of these mats are evident from the lack of tearing or breaking of
stretched mats held in place with push pins.
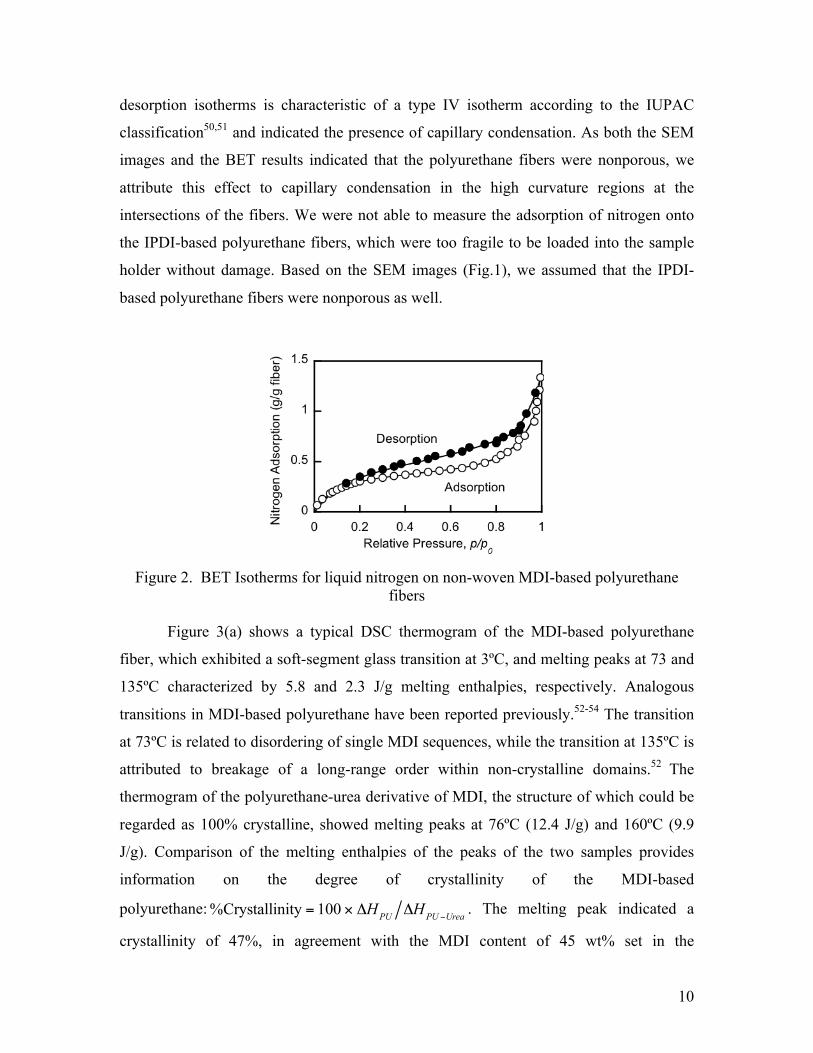
A BET analysis of the measured nitrogen adsorption isotherms given in Figure 2
for the MDI-based polyurethane fibers yielded a total surface area of ca. 1.3 m2/g, a value
consistent with that estimated by considering the surface area per unit volume of 2 µm
diameter cylindrical fibers. Such a surface area is 770-fold smaller than the
manufacturer-quoted 1000 m2/g- nominal surface area of typical activated carbons
designed specifically for gas adsorption. The hysteresis loop between the adsorption and
Figure 1. SEM images of (a) MDI-based and (b) isophorone-based non-woven fiber mats showing smooth, non-porous fiber surfaces. (c) SEM image showing uniformity of MDI-based PU fiber diameter and mat density. (d) Strength and elasticity of mats demonstrated by lack of tearing or breaking of stretched fiber mat held in place with
push pins.
10
desorption isotherms is characteristic of a type IV isotherm according to the IUPAC
classification50,51 and indicated the presence of capillary condensation. As both the SEM
images and the BET results indicated that the polyurethane fibers were nonporous, we
attribute this effect to capillary condensation in the high curvature regions at the
intersections of the fibers. We were not able to measure the adsorption of nitrogen onto
the IPDI-based polyurethane fibers, which were too fragile to be loaded into the sample
holder without damage. Based on the SEM images (Fig.1), we assumed that the IPDI-
based polyurethane fibers were nonporous as well.
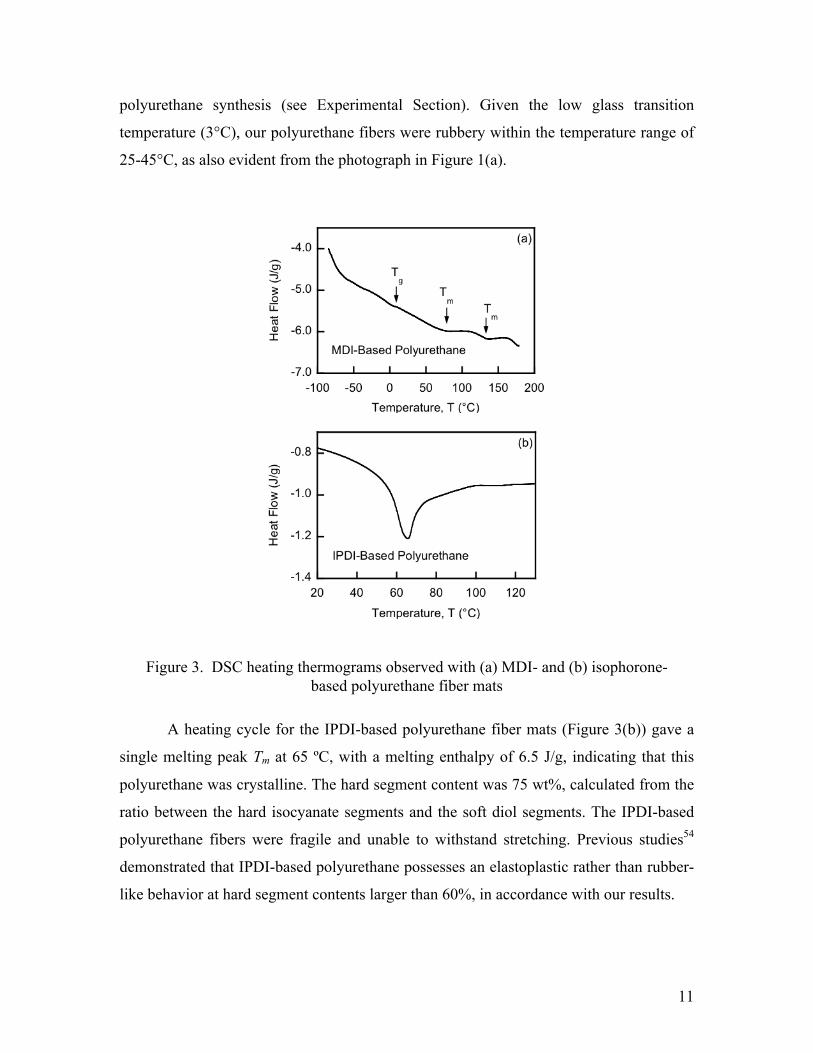
Figure 3(a) shows a typical DSC thermogram of the MDI-based polyurethane
fiber, which exhibited a soft-segment glass transition at 3ºC, and melting peaks at 73 and
135ºC characterized by 5.8 and 2.3 J/g melting enthalpies, respectively. Analogous
transitions in MDI-based polyurethane have been reported previously.52-54 The transition
at 73ºC is related to disordering of single MDI sequences, while the transition at 135ºC is
attributed to breakage of a long-range order within non-crystalline domains.52 The
thermogram of the polyurethane-urea derivative of MDI, the structure of which could be
regarded as 100% crystalline, showed melting peaks at 76ºC (12.4 J/g) and 160ºC (9.9
J/g). Comparison of the melting enthalpies of the peaks of the two samples provides
information on the degree of crystallinity of the MDI-based
polyurethane: %Crystallinity = 100 × ΔHPU ΔHPU −Urea . The melting peak indicated a
crystallinity of 47%, in agreement with the MDI content of 45 wt% set in the
Figure 2. BET Isotherms for liquid nitrogen on non-woven MDI-based polyurethane fibers
11
polyurethane synthesis (see Experimental Section). Given the low glass transition
temperature (3°C), our polyurethane fibers were rubbery within the temperature range of
25-45°C, as also evident from the photograph in Figure 1(a).
A heating cycle for the IPDI-based polyurethane fiber mats (Figure 3(b)) gave a
single melting peak Tm at 65 ºC, with a melting enthalpy of 6.5 J/g, indicating that this
polyurethane was crystalline. The hard segment content was 75 wt%, calculated from the
ratio between the hard isocyanate segments and the soft diol segments. The IPDI-based
polyurethane fibers were fragile and unable to withstand stretching. Previous studies54
demonstrated that IPDI-based polyurethane possesses an elastoplastic rather than rubber-
like behavior at hard segment contents larger than 60%, in accordance with our results.
Figure 3. DSC heating thermograms observed with (a) MDI- and (b) isophorone-based polyurethane fiber mats
12
Absorption characteristics of polyurethane fibers
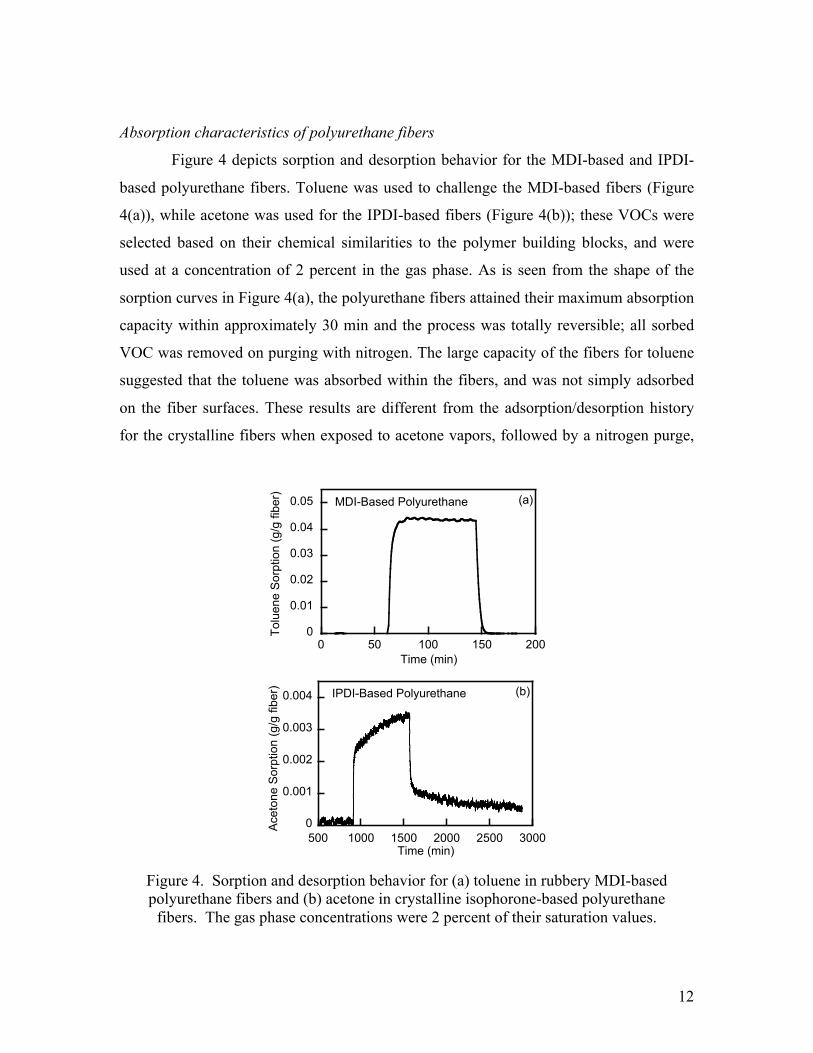
Figure 4 depicts sorption and desorption behavior for the MDI-based and IPDI-
based polyurethane fibers. Toluene was used to challenge the MDI-based fibers (Figure
4(a)), while acetone was used for the IPDI-based fibers (Figure 4(b)); these VOCs were
selected based on their chemical similarities to the polymer building blocks, and were
used at a concentration of 2 percent in the gas phase. As is seen from the shape of the
sorption curves in Figure 4(a), the polyurethane fibers attained their maximum absorption
capacity within approximately 30 min and the process was totally reversible; all sorbed
VOC was removed on purging with nitrogen. The large capacity of the fibers for toluene
suggested that the toluene was absorbed within the fibers, and was not simply adsorbed
on the fiber surfaces. These results are different from the adsorption/desorption history
for the crystalline fibers when exposed to acetone vapors, followed by a nitrogen purge,
Figure 4. Sorption and desorption behavior for (a) toluene in rubbery MDI-based polyurethane fibers and (b) acetone in crystalline isophorone-based polyurethane
fibers. The gas phase concentrations were 2 percent of their saturation values.
0
0.01
0.02
0.03
0.04
0.05
0 50 100 150 200
Tolu
ene
Sor
ptio
n (g
/g fi
ber)
Time (min)
MDI-Based Polyurethane (a)
0
0.001
0.002
0.003
0.004
500 1000 1500 2000 2500 3000
Ace
tone
Sor
ptio
n (g
/g fi
ber)
Time (min)
IPDI-Based Polyurethane (b)
13
as shown in Figure 4(b). The initial adsorption rate was rather fast but then leveled off to
a much slower rate, and even after several hours equilibrium had not been reached. The
mass of acetone adsorbed in the early stages was approximately equivalent to that of an
acetone monolayer on the outer surfaces of the fibers, assuming a VOC molecular
diameter of 7.5 Å, and a fiber density of 1 g/cm3. The significantly slower subsequent
adsorption rate was due to the diffusional resistances within the crystalline fibers
themselves. Due to the superior absorption behavior of the rubbery MDI-based
polyurethane fibers (Figure 4(a)), all further experiments concentrated on the absorption
characteristics of these fibers.
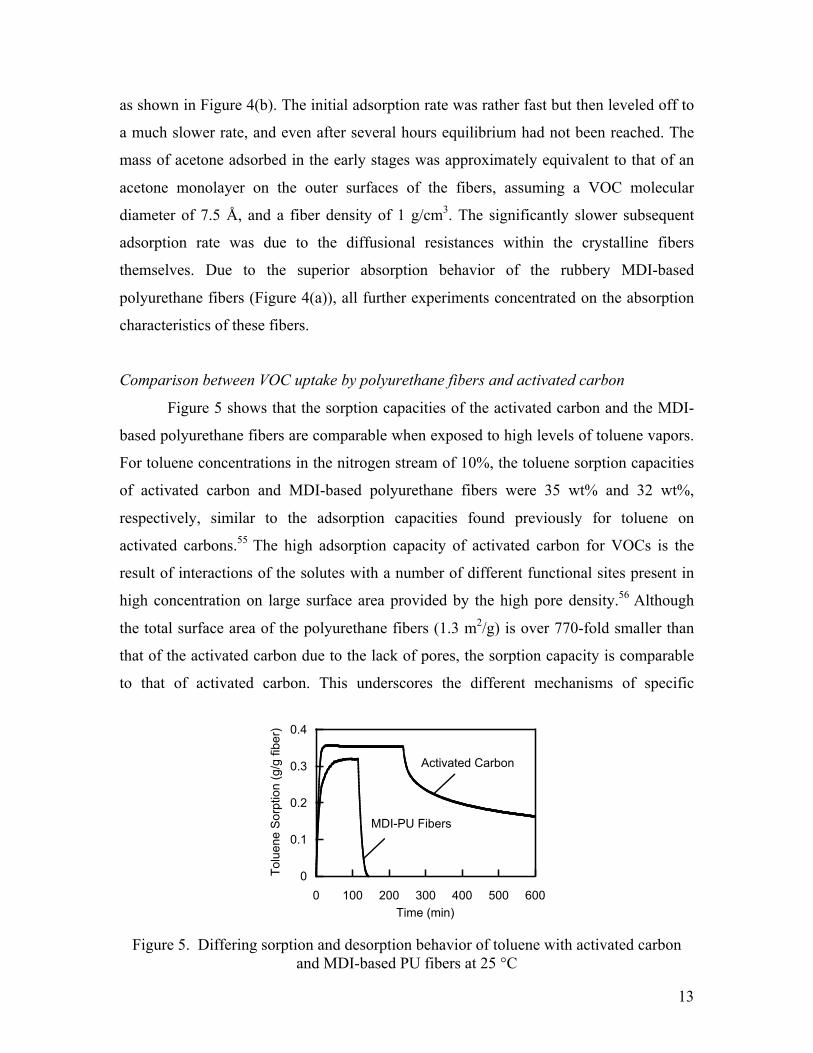
Comparison between VOC uptake by polyurethane fibers and activated carbon
Figure 5 shows that the sorption capacities of the activated carbon and the MDI-
based polyurethane fibers are comparable when exposed to high levels of toluene vapors.
For toluene concentrations in the nitrogen stream of 10%, the toluene sorption capacities
of activated carbon and MDI-based polyurethane fibers were 35 wt% and 32 wt%,
respectively, similar to the adsorption capacities found previously for toluene on
activated carbons.55 The high adsorption capacity of activated carbon for VOCs is the
result of interactions of the solutes with a number of different functional sites present in
high concentration on large surface area provided by the high pore density.56 Although
the total surface area of the polyurethane fibers (1.3 m2/g) is over 770-fold smaller than
that of the activated carbon due to the lack of pores, the sorption capacity is comparable
to that of activated carbon. This underscores the different mechanisms of specific
Figure 5. Differing sorption and desorption behavior of toluene with activated carbon and MDI-based PU fibers at 25 °C
0 100 200 300 400 500 600
0
0.1
0.2
0.3
0.4
Tolu
ene
Sor
ptio
n (g
/g fi
ber)
Time (min)
MDI-PU Fibers
Activated Carbon
14
sorption of toluene by the carbon and the polyurethane fibers. The large difference in the
total surface areas indicates that the VOC compounds were not only adsorbed onto the
surfaces of the polyurethane fibers (as in the case of activated carbon) but were also
absorbed within the polymer matrices themselves.
The different mechanisms of sorption in carbon particles and polyurethane fiber
mats are also reflected in the differences in their regeneration rates. As is seen in Figure
5, only about 40% of the solvent initially adsorbed by activated carbon desorbed after 5 h
of purging by nitrogen, in clear contrast to the behavior observed with the polyurethane
fibers, from which 100% of the absorbed toluene desorbed within 20 min of purging.
Using 7.5 Å for the molecular size of toluene, we calculated that the maximum
monolayer absorption of toluene onto carbon would be approximately 27wt%. Loadings
exceeding this value indicate multi-layer adsorption and/or capillary condensation. In the
desorption process, the physisorbed multilayers will be desorbed first, while the
remaining chemisorbed monolayer of toluene is strongly bound to the carbon pore
surfaces.
In the absence of heating, the total adsorbed VOC did not desorb from the
activated carbon, and even after 40 h (not shown), a large fraction of the VOC was still
present on the carbon adsorbent. When the activated carbon was reused in a second cycle
at a vapor phase concentration of 10%, the maximum adsorbed amount of toluene was
again 35%, but because the baseline was now at 10%, this represented a decrease in
working capacity to 25 wt% compared to the 35 wt% achieved in the first cycle with
fresh activated carbon (not shown).
For effective sorbents, facile desorption processes are important for solvent
recovery and recycling or disposal, as well as for adsorbent regeneration and reuse. The
inability to regenerate the activated carbon under mild, ambient conditions argues against
their use as adsorbents, and purging with a neutral gas is more economical than methods
such as steam or vacuum stripping and/or electrothermal treatment that are necessary to
regenerate the carbonaceous adsorbents.55-58 The ease of regeneration of the polyurethane
non-woven fibers combined with a capacity comparable to that of activated carbon,
suggests that they would be an attractive alternative to conventional VOC sorbents.
15
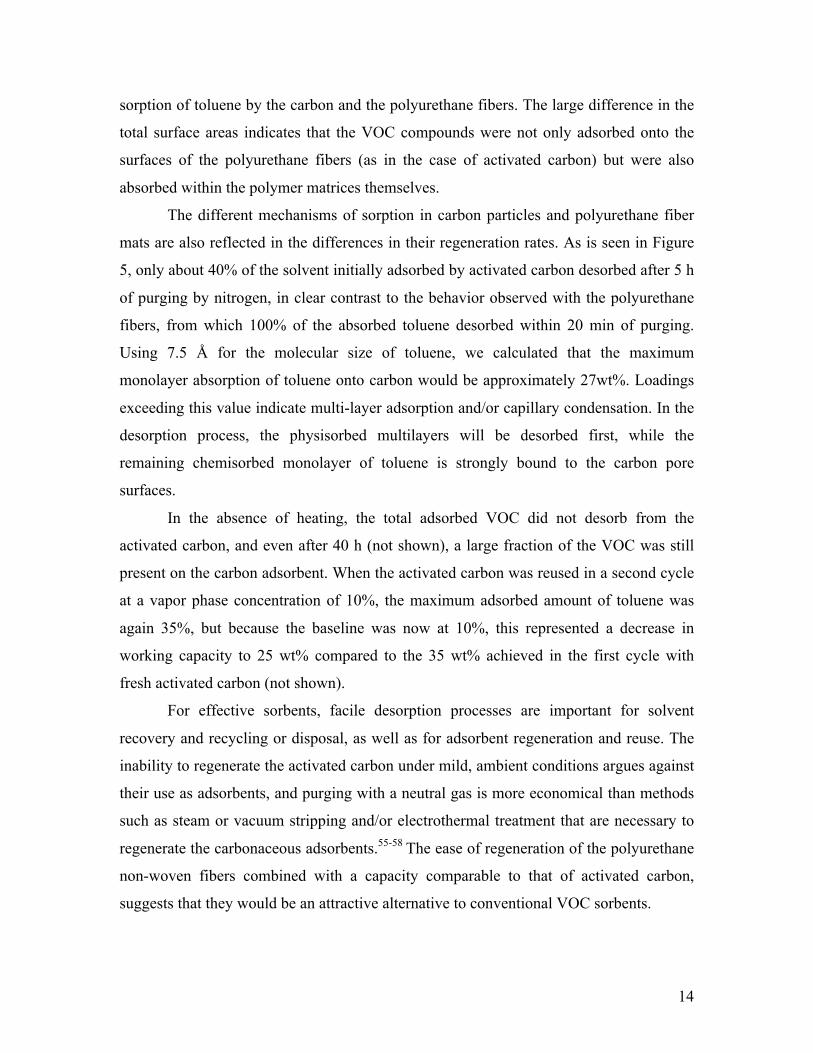
Fiber selectivity for organic vapors
The interaction of the polyurethane building blocks with the VOC compounds
determines their absorption capacity and selectivity towards different VOCs. The
selectivity of the fibers was demonstrated by challenging the fibrous mats with toluene,
chloroform and hexane at different vapor partial pressures and temperatures. Figure 6
presents the absorption of the different VOC vapors into the polyurethane fibers at
varying concentrations of VOC in nitrogen at a temperature of 25°C. Regardless of the
VOC nature, the absorption of the its vapor occurred within the time span of an hour. The
Figure 6. Absorption of (a) toluene, (b) chloroform and (c) hexane on MDI-based polyurethane fiber mats at varying VOC concentrations (wt %)
0
0.1
0.2
0.3
0.4
0 10 20 30 40 50 60 70
Abs
orpt
ion
(g/g
fibe
r)
Time (min)
10%
8%
6%
4%2%
Toluene(a)
0
0.1
0.2
0.3
0.4
0.5
0 10 20 30 40 50
Abs
orpt
ion
(g/g
fibe
r)
Time (min)
50%
40%
30%
20%
10%
Chloroform(b)
0
0.01
0.02
0.03
0.04
0.05
0 5 10 15 20 25
Abs
orpt
ion
(g/g
fibe
r)
Time (min)
35%
30%
25%
20%15%
Hexane(c)
10%
16
equilibrium uptake capacities for these compounds are similar to those obtained when
polyurethane foams and membranes were challenged with organic liquid mixtures34, 36, 38, 39
or vapors.40, 41 Our uptake rates were significantly better than those reported in the
literature, when available.
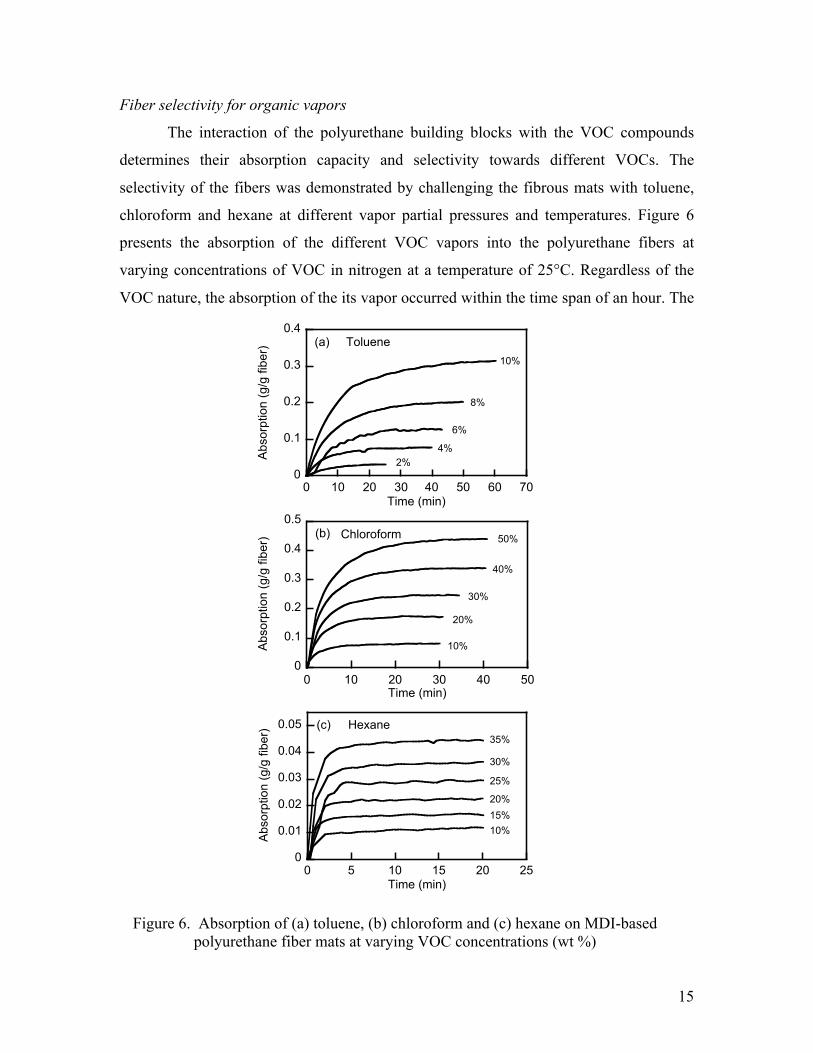
Comparison of the capacity of the fibers for different vapors was facilitated by
reporting the absorption, C, in terms of mmol/gfiber as a function of the fractional
approach to saturation in the vapor phase, expressed as partial pressure, p, relative to the
saturated vapor pressure, p0, at the temperature of interest. The results at 25 °C shown in
Figure 7 for the three compounds studied are comparable to the absorption curves for
several VOCs in polyurethane foams reported by Pinto and coworkers.41
While the absorption plots for chloroform and hexane were linear, i.e., these
systems exhibited ideal behavior over the whole concentration range, the absorption of
toluene was strongly non-ideal at higher concentrations. The relation between the
absorption and partial pressure in the linear regime can be described by Henry’s law,
given by:59,60
C = KH p (1)
where C is the capacity of the fibers at partial gas pressure of p, and HK is Henry’s Law
constant. Henry's law is a good representation of the behavior of gases dissolved in
liquids or solids at reasonably low concentrations. At higher concentrations, deviations
Figure 7. Absorption capacity of MDI-based polyurethane fibers for toluene, chloroform and hexane as affected by the VOC partial pressure at 25 °C
0
1
2
3
4
0 0.2 0.4 0.6 0.8 1
Abs
orpt
ion
(mm
ol/g
fibe
r)
Relative Partial Pressure, p/p0
Chloroform
Toluene
Hexane
17
from Henry’s law are more pronounced, as can be seen for the absorption of toluene
(Figure 7).
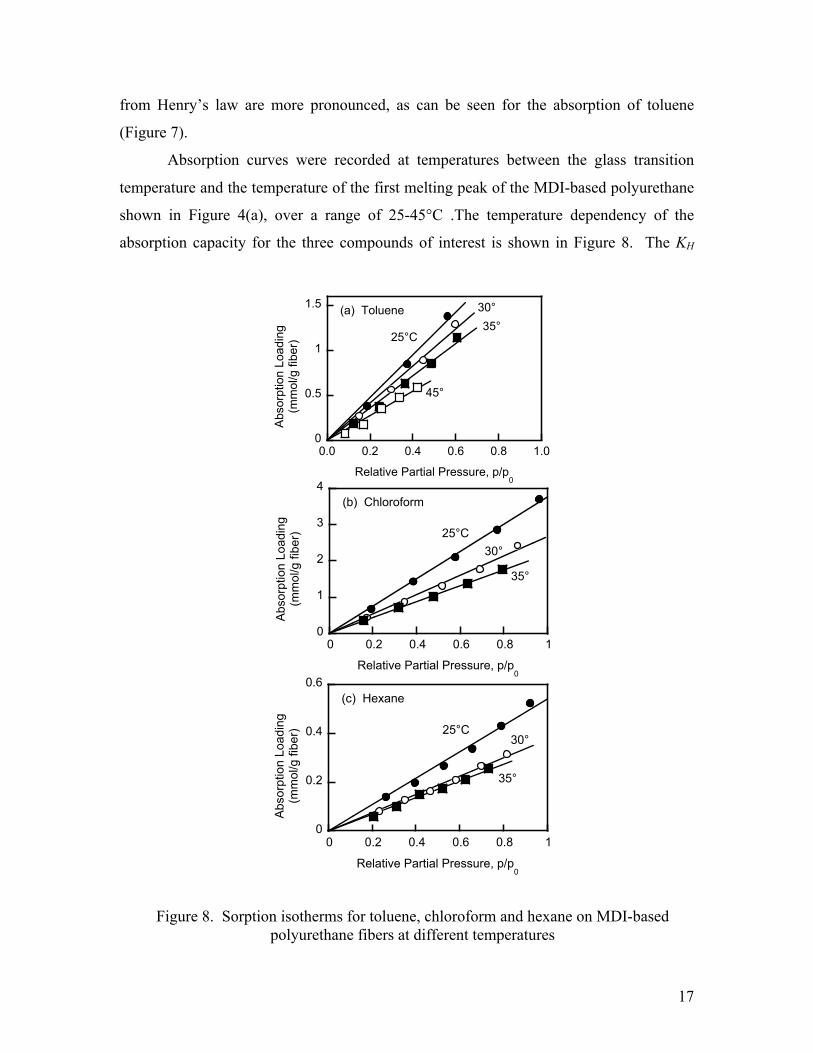
Absorption curves were recorded at temperatures between the glass transition
temperature and the temperature of the first melting peak of the MDI-based polyurethane
shown in Figure 4(a), over a range of 25-45°C .The temperature dependency of the
absorption capacity for the three compounds of interest is shown in Figure 8. The KH
Figure 8. Sorption isotherms for toluene, chloroform and hexane on MDI-based polyurethane fibers at different temperatures
0
1
2
3
4
0 0.2 0.4 0.6 0.8 1
Abs
orpt
ion
Load
ing
(mm
ol/g
fibe
r)
Relative Partial Pressure, p/p0
25°C
35°
30°
(b) Chloroform
0
0.2
0.4
0.6
0 0.2 0.4 0.6 0.8 1
Relative Partial Pressure, p/p0
25°C
35°
30°
(c) Hexane
Abs
orpt
ion
Load
ing
(mm
ol/g
fibe
r)
0
0.5
1
1.5
0.0 0.2 0.4 0.6 0.8 1.0
Relative Partial Pressure, p/p0
25°C35°
30°(a) Toluene
45°
Abs
orpt
ion
Load
ing
(mm
ol/g
fibe
r)
18
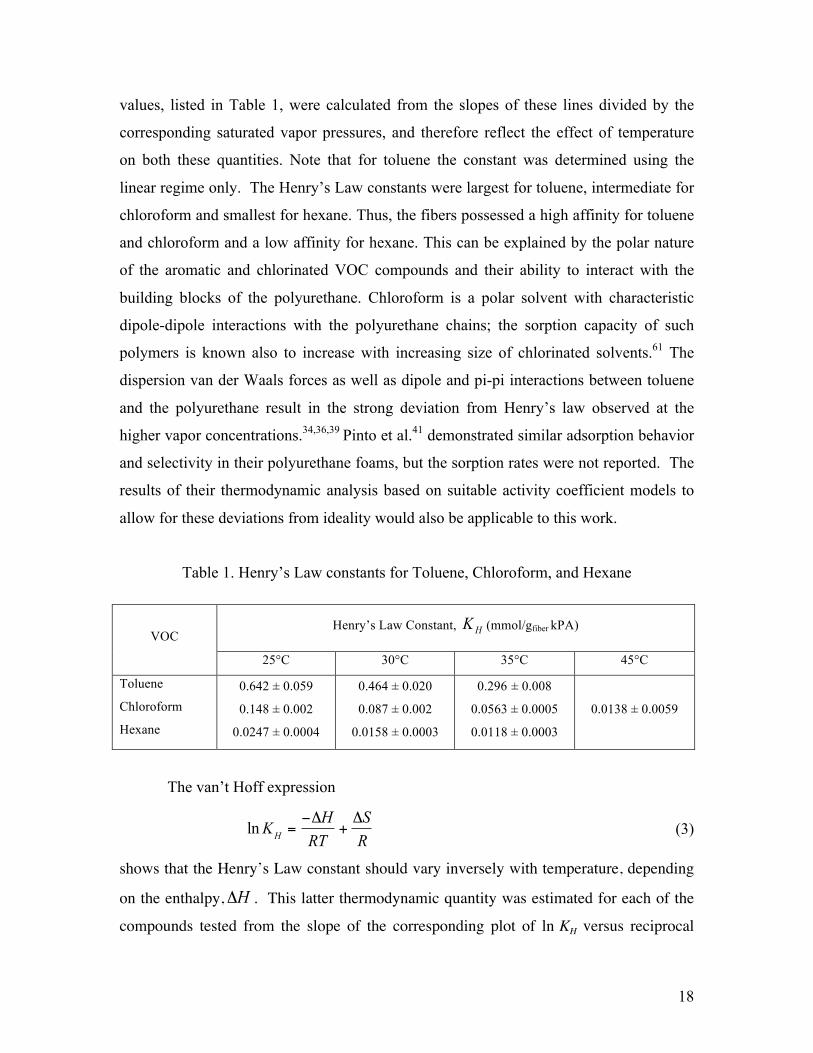
values, listed in Table 1, were calculated from the slopes of these lines divided by the
corresponding saturated vapor pressures, and therefore reflect the effect of temperature
on both these quantities. Note that for toluene the constant was determined using the
linear regime only. The Henry’s Law constants were largest for toluene, intermediate for
chloroform and smallest for hexane. Thus, the fibers possessed a high affinity for toluene
and chloroform and a low affinity for hexane. This can be explained by the polar nature
of the aromatic and chlorinated VOC compounds and their ability to interact with the
building blocks of the polyurethane. Chloroform is a polar solvent with characteristic
dipole-dipole interactions with the polyurethane chains; the sorption capacity of such
polymers is known also to increase with increasing size of chlorinated solvents.61 The
dispersion van der Waals forces as well as dipole and pi-pi interactions between toluene
and the polyurethane result in the strong deviation from Henry’s law observed at the
higher vapor concentrations.34,36,39 Pinto et al.41 demonstrated similar adsorption behavior
and selectivity in their polyurethane foams, but the sorption rates were not reported. The
results of their thermodynamic analysis based on suitable activity coefficient models to
allow for these deviations from ideality would also be applicable to this work.
Table 1. Henry’s Law constants for Toluene, Chloroform, and Hexane
VOC Henry’s Law Constant, HK (mmol/gfiber kPA)
25°C 30°C 35°C 45°C
Toluene
Chloroform
Hexane
0.642 ± 0.059
0.148 ± 0.002
0.0247 ± 0.0004
0.464 ± 0.020
0.087 ± 0.002
0.0158 ± 0.0003
0.296 ± 0.008 0.0563 ± 0.0005
0.0118 ± 0.0003
0.0138 ± 0.0059
The van’t Hoff expression
ln KH =
−ΔHRT
+ΔSR
(3)
shows that the Henry’s Law constant should vary inversely with temperature, depending
on the enthalpy, ΔH . This latter thermodynamic quantity was estimated for each of the
compounds tested from the slope of the corresponding plot of ln KH versus reciprocal
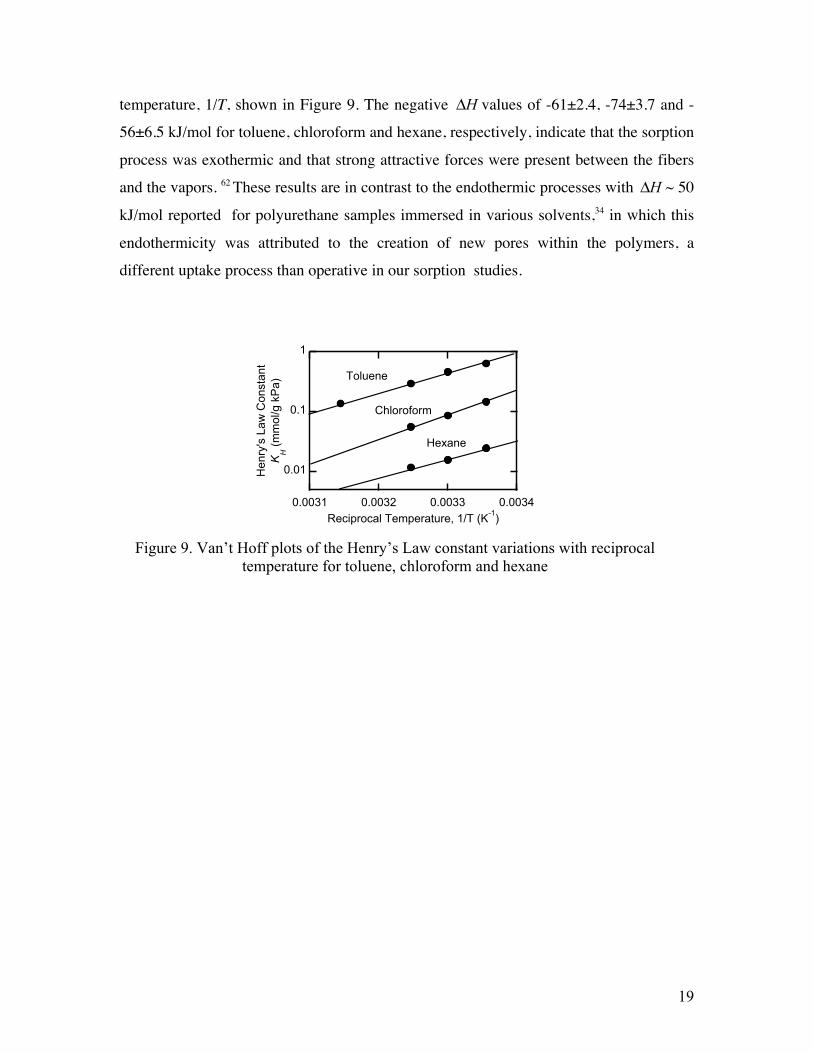
19
Figure 9. Van’t Hoff plots of the Henry’s Law constant variations with reciprocal temperature for toluene, chloroform and hexane
0.01
0.1
1
0.0031 0.0032 0.0033 0.0034
Hen
ry's
Law
Con
stan
tK
H (m
mol
/g k
Pa)
Reciprocal Temperature, 1/T (K-1)
Toluene
Chloroform
Hexane
temperature, 1/T, shown in Figure 9. The negative ΔH values of -61±2.4, -74±3.7 and -
56±6.5 kJ/mol for toluene, chloroform and hexane, respectively, indicate that the sorption
process was exothermic and that strong attractive forces were present between the fibers
and the vapors. 62 These results are in contrast to the endothermic processes with ΔH ~ 50
kJ/mol reported for polyurethane samples immersed in various solvents,34 in which this
endothermicity was attributed to the creation of new pores within the polymers, a
different uptake process than operative in our sorption studies.
20
4. Conclusion
We have demonstrated that suitably-selected polyurethanes can be electrospun to
prepare fiber mats with high sorption capacities for volatile organic solvents. These
fibrous mats can be regenerated readily by desorption under ambient conditions, which
contrasts favorably with the harsh thermal treatments for regeneration needed to remove
the chemisorbed monolayer on the exposed surfaces of activated carbon adsorbents.
Thus, fibrous adsorbent mats could find ready use in applications that require benign
operating conditions and repeated cycling of the sorbents with easy on-site regeneration
without extensive heating and washing processes. The MDI-based polyurethane fiber
mats used in this work are robust and elastic, which points to their being able to be
formed and used in any many process configurations, such as packed beds, spiral-wound
membrane systems, etc. Such polyurethane fibers can, in principle, be designed to adsorb
specific VOCs depending on the building blocks used in their synthesis.
5. Acknowledgements
This work was supported in part by the Boeing Corporation. ES thanks NWO
(Netherlands organization of Scientific Research) for support through a Talent
Scholarship.

21
References
1. Lindgren, T.; Norback, D. Indoor Air 2002, 12, 263-272.
2. Majumbar, S.; Bhaumik, D.; Sirkar, K. K.; Simes, G. Environmental Progress 2001,
20, 27-35.
3. Wankat, P. C.; Partin, L. R. Ind. Eng. Chem. Process Des. Dev. 1980, 79, 446-451.
4. Singh, K. P.; Mohan, D.; Tandon, G. S.; Gupta, G. S. D. Ind. Eng. Chem. Res. 2002,
41, 2480-2486.
5. Montefusco, F. Filtration & Separation 2005; 42, 30-31.
6. Duran, A. Filtration & Separation 2004, 41, 24-26.
7. Rutledge, G. C.; Fridrikh, S. V. Adv. Drug Deliv. Rev. 2007, 59, 1384-1391.
8. Frenot, A.; Chronakis, I. S. Curr. Opin. Colloid Interface Sci. 2003, 8, 64-75.
9. Chronakis, I. S. J. Mater. Process Tech. 2005, 167, 281-293.
10. Schiffmann, J. D.; Schauer, C. Polymer reviews 2008, 48, 317-352.
11. Dzenis, Y. Science 2004, 304, 1917-1919.
12. Subbiah, T.; Bhat, G. S.; Tock, R. W.; Parameswaran, S.; Ramkumar, S. S. J. Appl.
Polym. Sci. 2005, 96, 557-569.
13. Huang, Z. -M.; Zhang, Y. -Z.; Kotaki, M.; Ramakrishna, S. Compos. Sci. Technol.
2003, 63, 2223-2253.
14. Yu, J. H.; Fridrikh, S.; Rutledge, G. Adv. Mater. 2004, 16, 1562-1566.
15. McCann, J. T.; Li, D.; Xia, Y. J. Mater. Chem. 2005, 15, 735-738.
16. Bognitzki, M.; Czado, W.; Frese, T.; Schaper, A.; Hellwig, M.; Steinhart, M.;
Greiner, A.; Wendorff, J. Adv Mater. 2001, 13, 70-72.
17. Li, D.; Xia, Y. Adv. Mater 2004, 16, 1151-1170.
18. Yang, Y.; Centrone, A.; Chen, L.; Simeon, F.; Hatton, T. A.; Rutledge, G. C. Carbon
2011, 49, 3395-3403.
19. Chen, L.; Bromberg, L.; Schreuder-Gibson, H.; Walker, J.; Hatton, T. A.; Rutledge,
G. C. J. Mater. Chem. 2009, 19, 2432-2438.
20. Chen, L.; Bromberg, L.; Lee, J. A.; Zhang, H.; Schreuder-Gibson, H.; Gibson, P.;
Walker, J.; Hammond, P. T.; Hatton, T. A.; Rutledge, G. C. Chem. Mater. 2010, 22,
1429-1436.
21. Wang, M.; Hsieh, A. J.; Rutledge, G. C. Polymer 2005, 46, 3407-3418.
22
22. Demir, M. M.; Yilgor, I.; Yilgor, E.; Erman, B. Polymer 2002, 43, 3303-3309.
23. Zhuo, H.; Hu, J.; Chen, S.; Yeung, L. J. Appl. Polym. Sci. 2008, 109, 406-411.
24. Buruaga, L.; Sardon, H.; Irusta, L.; Gonzalez, A., Fernandez-Berridi, M. J.; Iruin, J. J.
J. Appl. Polym. Sci. 2009, 115, 1176-1179.
25. Dersch, R.; Steinhart, M.; Boudriot, U.; Greiner, A.; Wendorff, J. H. Polym. Adv.
Technol. 2005, 16, 276-282.
26. Pham, Q. P.; Sharma, U. M.; Mikos, A. G. Tissue Engineering 2006, 12, 1197-1211.
27. Caracciolo, P. C.; Buffa, F.; Thomas, V.; Vohra, Y. K.; Abraham, G. A. J. Appl.
Polym. Sci. 2011, 121, 3292-3299.
28. Yan, L.; Si, S.; Chen, Y., Yuan, T.; Fan, H.; Yao, Y.; Zhang, Q. Fibers and Polymers
2011, 12, 207-213.
29. Yoon, B.; Lee, S. Fibers and Polymers 2011, 12, 57-64.
30. Theron, J. P.; Knoetze, J. H.; Sanderson, R. D.; Hunter, R.; Mequanint, K.; Franz, T.;
Zilla, P.; Bezuidenhout, D. Acta Biomaterialia 2010, 6, 2434-2447.
31. Sheikh, F.; Barakat, N. A. M.; Kanjwal, M; Chaudhari, A. A.; Jung, I. –H.; Lee, J. H.;
Kim, H. Y. Macromol. Res. 2009, 17, 688-696.
32. Yao, C.; Li, X.; Neoh, K. G.; Shi, Z.; Kang, E. T. J. Membr. Sci. 2008, 320, 259-267.
33. Sambaer, W.; Zatloukal W.; Kimmer, D. Chem. Eng. Sci. 2011, 66, 613-623.
34. Kendaganna Swamy, B. K.; Siddaramaiah, J. Hazardous Mater. 2003, B99, 177-190.
35. Cunha, V. S.; Paredes, M. L.; Borges, C. P.; Habert, A. C.; Norbrega, R. J. Membr.
Sci. 2002, 206, 277-290.
36. Cunha, V. S.; Nobrega, R.; Habert, A. C. Braz. J. Chem. Eng. 1999, 16, 297-308.
37. Singh, R. S.; Rai, B. N.; Upadhyay, S. N. Process Safety and Environmental
Protection, 2010, 88, 366-371.
38. Kumar, H.; Siddaramaiah. Polymer 2005, 46, 7140-7155.
39. Lue, J. S.; Peng, S. H. J. Membr. Sci. 2003, 222, 203-217.
40. Kamprad, I.; Goss, K. -U. Anal. Chem. 2007, 79, 4222-4227.
41. Pinto, M. L.; Pires, J.; Carvallo, A. P.; de Carvalho, M. B.; Bordado, J. C. J. Phys.
Chem. B 2004, 108, 13813-13820.
42. Saeed, M. M. J. Radioanal. Nucl. Chem. 2003, 256, 73-80.
23
43. Cho, J. W.; Jung, Y. C.; Chun, B. C.; Chung, Y. -C. J. Appl. Polym. Sci. 2004, 92,
2812-2816.
44.. Ding, X. M.; Hu, J. L.; Tao, X. M.; Wang, Z. F.; Wang, B. J. Polym. Sci. B: Polym.
Phys. 2005, 43, 1865-1872.
45. Hayashi, J.; Yamamoto, N.; Horikawa, T.; Muroyama, K.; Gomes, V.G. J. Hazard.
Mater., 2009, 167, 275-281
46. Cha, D. I.; Kim, H. Y.; Lee, K. H.; Jung, Y. C.; Cho, J. W.; Chun, B. C. J. Appl.
Polym. Sci. 2005, 96, 460-465.
47. Lai, Y. -C.; Quinn, E. T.; Valint, P. L. J. Polym. Sci. 1995, 33, 1767-1722.
48. Laity, P. R.; Taylor, J. E.; Wong, S. S.; Khunkanchoo, P.; Cable, M.; Andrews, G. T.;
Johnson, A. F.; Cameron, R. E. J. Appl. Polym. Sci. 2006, 100, 779-790.
49. Lee, B. S.; Chun, B. C.; Chung, Y. -C.; Sul, K. I.; Cho, J. W. Macromolecules 2001,
34, 6431-6437.
50. Barton, T.; Bull, L. M.; Klemperer, W. G.; Loy, D. A.; McEnaney, B.; Misono, 49
M.; Monson, P. A.; Pez, G.; Scherer, G. W.; Vartuli, J. C.; Yaghi, O. M. Chem.
Mater. 1999, 11, 2633-2656.
51. Balbuena, P. B.; Gubbins, K. E. Langmuir 1993, 9, 1801-1814.
52. Finnigan, B.; Halley, P.; Jack, K.; McDowell, A.; Truss, R.; Casey, P.; Knott, R.;
Martin, D. J. Appl. Polym. Sci. 2006, 102, 128-139.
53. Yang, J. H.; Chun, B. C.; Chung, Y. -C.; Cho, J. H. Polymer 2003, 44, 3251-3258.
54. Kim, H. D.; Huh, J. H.; Kim, E. Y.; Park, C. C. J. Appl. Polym. Sci. 1998, 69, 1349-
1355.
55. Luo, L.; Ramirez, D.; Rood, M. J.; Grevillot, G.; Hay, K. J.; Thurston, D. L. Carbon
2006, 44, 2715-2723.
56. Fletcher, A.; Yuzak, Y.; Thomas, K. M. Carbon 2006, 44, 989-1004.
57. Maldonado, F. J.; Moreno-Castilla, C.; Carrasco-Marin, F.; Perez-Cadenas, A. F. J.
Hazardous Mater. 2007, 148, 548-552.
58. Tan, C. -S.; Lee, P. -L. Environ. Sci. Technol. 2008, 42, 2150-2154.
59. Shimotori, T.; Arnold, W. A. J. Chem. Eng. Data 2002, 49, 183-190.
60. Reza, J.; Trejo, A. Chemosphere 2004, 56, 537-547.
24
61. You, Y.; Youk, J. H.; Lee, S. W.; Min, B.-M.; Lee, S. J.; Park, W. H. Mater. Lett.
2006, 60, 757-760.
62. Kubilay, S.; Gurkan, R.; Savran, T. Adsorption 2007, 13, 41-51.
25
Table of Contents (TOC) Graphic