
Electrophysiological Studies of Human Face …bctill/papers/facerec/Allison415.pdfCT 06516 and...
16
This and the following two papers describe event-related potentials (ERPs) evoked by visual stimuli in 98 patients in whom electrodes were placed directly upon the cortical surface to monitor medically intractable seizures. Patients viewed pictures of faces, scrambled faces, letter-strings, number-strings, and animate and inanimate objects. This paper describes ERPs generated in striate and peri- striate cortex, evoked by faces, and evoked by sinusoidal gratings, objects and letter-strings. Short-latency ERPs generated in striate and peristriate cortex were sensitive to elementary stimulus features such as luminance. Three types of face-specific ERPs were found: (i) a surface-negative potential with a peak latency of ~200 ms (N200) recorded from ventral occipitotemporal cortex, (ii) a lateral surface N200 recorded primarily from the middle temporal gyrus, and (iii) a late positive potential (P350) recorded from posterior ventral occipitotemporal, posterior lateral temporal and anterior ventral temporal cortex. Face-specific N200s were preceded by P150 and followed by P290 and N700 ERPs. N200 reflects initial face-specific processing, while P290, N700 and P350 reflect later face processing at or near N200 sites and in anterior ventral temporal cortex. Face-specific N200 amplitude was not significantly different in males and females, in the normal and abnormal hemisphere, or in the right and left hemisphere. However, cortical patches generating ventral face-specific N200s were larger in the right hemisphere. Other cortical patches in the same region of extrastriate cortex generated grating-sensitive N180s and object- specific or letter-string-specific N200s, suggesting that the human ventral object recognition system is segregated into functionally discrete regions. Introduction The recognition of faces and other complex objects is so accurate and effortless that it is easy to discount the complexity of the neuronal mechanisms that are involved. These mech- anisms are revealed by brain damage that produces specific deficits of visual recognition. Perhaps the most striking and interesting of these is face agnosia, or prosopagnosia (Bodamer, 1947), the inability to recognize familiar faces [this has been reviewed by a number of authors (Hecaen and Angelergues, 1962; Meadows, 1974; Whitely and Warrington, 1977; Damasio et al., 1982, 1990; Farah, 1990)]. Prosopagnosia often occurs together with other visual deficits, but when it occurs in isolation it is difficult to avoid the inference that specialized brain regions or processes are involved in face recognition. Despite this, the evidence for specificity of face processing is equivocal, and other interpretations have been considered, including a face-specific memory impairment (Ellis and Young, 1988), right versus left hemisphere processing (Young, 1988), differences in depth of processing (Damasio et al., 1990), holistic versus feature-based processing (Farah, 1990), the development of perceptual expertise (Carey and Diamond, 1994), and local versus global processing (Rentschler et al., 1994). Evidence for face-specific processing also comes from single-cell recordings in monkeys, which demonstrate that some cells in the temporal lobe respond selectively to faces, to particular views of faces, to face parts, or to the direction of gaze [reviewed by Perrett et al. (Perrett et al., 1987, 1990), Desimone (Desimone, 1991), Gross (Gross, 1992) and Logothetis and Scheinberg (Logothetis and Scheinberg, 1996)]. The portion of the monkey temporal lobe in which face-specific cells are encountered comprises cortex of the upper wall, fundus, and lower wall of the superior temporal sulcus and contiguous inferotemporal cortex, and will be referred to hereafter as STS/IT cortex. Some cells in the amygdala (Rolls, 1992) and frontal lobe (Wilson et al., 1993; Ó Scalaidhe et al., 1997) are also face specific. In humans, scalp recordings of event-related potentials (ERPs) demonstrate neuronal activity sensitive to faces (Grüsser et al., 1990; Bentin et al., 1996; George et al., 1996; Jeffreys, 1996; Schendan et al., 1998), although this technique does not allow strong inferences about the locations of the active structures. This limitation can be partly overcome by recording directly from the surface of the human brain when such invasive recordings are clinically justified. ERPs have been recorded from the cortical surface or deep brain structures of patients with medically refractory epilepsy who were implanted with electrodes for seizure focus local- ization. We have used this technique to localize sensorimotor cortex (Wood et al., 1988), to determine the cytoarchitectonic areas generating specific somatosensory ERPs (Allison et al., 1991), and to record task-related ERPs generated in the anterior medial temporal lobe (McCarthy et al., 1989, 1995; Nobre and McCarthy, 1995). More recently electrodes have been placed on posterior regions of the brain to evaluate seizures of possible posterior temporal, parietal or occipital origin (Williamson et al., 1992). Recordings from the surface of occipitotemporal extra- striate cortex revealed that discrete regions were activated by faces but not by other categories of visual stimuli (Allison et al., 1994a,c), suggesting that faces are processed by a dedicated subsystem of the ventral visual pathway known to be involved in object recognition (Ungerleider and Mishkin, 1982; Merigan and Maunsell, 1993). The most consistent face-related activity was a surface-negative field potential with a peak latency of ∼200 ms (N200). Longer-latency face-specific potentials were also recorded from the ventral surface of the anterior temporal lobe, suggesting a posterior-to-anterior sequence of processing stages (Allison et al., 1994c) [for analogous evidence related to letter-string processing, see Nobre et al. (Nobre et al., 1994)]. The purpose of this and the following two papers is to provide a systematic account of these and other face-related ERPs, to compare face-related ERPs with ERPs evoked by non-face stimuli, and to review the implications of these recordings for under- standing the locations and properties of the systems involved in face perception. In addition to the papers cited, preliminary Cerebral Cortex Jul/Aug 1999;9:415–430; 1047–3211/99/$4.00 Electrophysiological Studies of Human Face Perception. I: Potentials Generated in Occipitotemporal Cortex by Face and Non-face Stimuli Truett Allison, Aina Puce 1 , Dennis D. Spencer and Gregory McCarthy 2 Neuropsychology Laboratory, VA Medical Center, West Haven, CT 06516 and Departments of Neurology and Neurosurgery, Yale University School of Medicine, New Haven, CT 06510, USA 1 Current address: Brain Sciences Institute, Swinburne University of Technology, PO Box 218, Hawthorn, Victoria 3122, Australia 2 Current address: Brain Imaging and Analysis Center, Box 3808, Duke University Medical Center, Durham, NC 27710, USA © Oxford University Press 1999
Transcript of Electrophysiological Studies of Human Face …bctill/papers/facerec/Allison415.pdfCT 06516 and...

This and the following two papers describe event-related potentials(ERPs) evoked by visual stimuli in 98 patients in whom electrodeswere placed directly upon the cortical surface to monitor medicallyintractable seizures. Patients viewed pictures of faces, scrambledfaces, letter-strings, number-strings, and animate and inanimateobjects. This paper describes ERPs generated in striate and peri-striate cortex, evoked by faces, and evoked by sinusoidal gratings,objects and letter-strings. Short-latency ERPs generated in striateand peristriate cortex were sensitive to elementary stimulusfeatures such as luminance. Three types of face-specific ERPswere found: (i) a surface-negative potential with a peak latency of~200 ms (N200) recorded from ventral occipitotemporal cortex,(ii) a lateral surface N200 recorded primarily from the middletemporal gyrus, and (iii) a late positive potential (P350) recordedfrom posterior ventral occipitotemporal, posterior lateral temporaland anterior ventral temporal cortex. Face-specific N200s werepreceded by P150 and followed by P290 and N700 ERPs. N200reflects initial face-specific processing, while P290, N700 and P350reflect later face processing at or near N200 sites and in anteriorventral temporal cortex. Face-specific N200 amplitude was notsignificantly different in males and females, in the normal andabnormal hemisphere, or in the right and left hemisphere. However,cortical patches generating ventral face-specific N200s were largerin the right hemisphere. Other cortical patches in the same region ofextrastriate cortex generated grating-sensitive N180s and object-specific or letter-string-specific N200s, suggesting that the humanventral object recognition system is segregated into functionallydiscrete regions.
IntroductionThe recognition of faces and other complex objects is so
accurate and effortless that it is easy to discount the complexity
of the neuronal mechanisms that are involved. These mech-
anisms are revealed by brain damage that produces specific
deficits of visual recognition. Perhaps the most striking and
interesting of these is face agnosia, or prosopagnosia (Bodamer,
1947), the inability to recognize familiar faces [this has been
reviewed by a number of authors (Hecaen and Angelergues,
1962; Meadows, 1974; Whitely and Warrington, 1977; Damasio
et al., 1982, 1990; Farah, 1990)]. Prosopagnosia often occurs
together with other visual deficits, but when it occurs in
isolation it is difficult to avoid the inference that specialized
brain regions or processes are involved in face recognition.
Despite this, the evidence for specificity of face processing
is equivocal, and other interpretations have been considered,
including a face-specific memory impairment (Ellis and Young,
1988), right versus left hemisphere processing (Young, 1988),
differences in depth of processing (Damasio et al., 1990),
holistic versus feature-based processing (Farah, 1990), the
development of perceptual expertise (Carey and Diamond,
1994), and local versus global processing (Rentschler et al.,
1994).
Evidence for face-specific processing also comes from
single-cell recordings in monkeys, which demonstrate that some
cells in the temporal lobe respond selectively to faces, to
particular views of faces, to face parts, or to the direction of gaze
[reviewed by Perrett et al. (Perrett et al., 1987, 1990), Desimone
(Desimone, 1991), Gross (Gross, 1992) and Logothetis and
Scheinberg (Logothetis and Scheinberg, 1996)]. The portion of
the monkey temporal lobe in which face-specific cells are
encountered comprises cortex of the upper wall, fundus, and
lower wall of the superior temporal sulcus and contiguous
inferotemporal cortex, and will be referred to hereafter as STS/IT
cortex. Some cells in the amygdala (Rolls, 1992) and frontal lobe
(Wilson et al., 1993; Ó Scalaidhe et al., 1997) are also face
specific. In humans, scalp recordings of event-related potentials
(ERPs) demonstrate neuronal activity sensitive to faces (Grüsser
et al., 1990; Bentin et al., 1996; George et al., 1996; Jeffreys,
1996; Schendan et al., 1998), although this technique does
not allow strong inferences about the locations of the active
structures. This limitation can be partly overcome by recording
directly from the surface of the human brain when such invasive
recordings are clinically justified.
ERPs have been recorded from the cortical surface or deep
brain structures of patients with medically refractory epilepsy
who were implanted with electrodes for seizure focus local-
ization. We have used this technique to localize sensorimotor
cortex (Wood et al., 1988), to determine the cytoarchitectonic
areas generating specific somatosensory ERPs (Allison et al.,
1991), and to record task-related ERPs generated in the anterior
medial temporal lobe (McCarthy et al., 1989, 1995; Nobre and
McCarthy, 1995). More recently electrodes have been placed on
posterior regions of the brain to evaluate seizures of possible
posterior temporal, parietal or occipital origin (Williamson et al.,
1992). Recordings from the surface of occipitotemporal extra-
striate cortex revealed that discrete regions were activated by
faces but not by other categories of visual stimuli (Allison et al.,
1994a,c), suggesting that faces are processed by a dedicated
subsystem of the ventral visual pathway known to be involved
in object recognition (Ungerleider and Mishkin, 1982; Merigan
and Maunsell, 1993). The most consistent face-related activity
was a surface-negative field potential with a peak latency of
∼200 ms (N200). Longer-latency face-specific potentials were
also recorded from the ventral surface of the anterior temporal
lobe, suggesting a posterior-to-anterior sequence of processing
stages (Allison et al., 1994c) [for analogous evidence related to
letter-string processing, see Nobre et al. (Nobre et al., 1994)].
The purpose of this and the following two papers is to provide
a systematic account of these and other face-related ERPs, to
compare face-related ERPs with ERPs evoked by non-face stimuli,
and to review the implications of these recordings for under-
standing the locations and properties of the systems involved in
face perception. In addition to the papers cited, preliminary
Cerebral Cortex Jul/Aug 1999;9:415–430; 1047–3211/99/$4.00
Electrophysiological Studies of HumanFace Perception. I: Potentials Generated inOccipitotemporal Cortex by Face andNon-face Stimuli
Truett Allison, Aina Puce1, Dennis D. Spencer and
Gregory McCarthy2
Neuropsychology Laboratory, VA Medical Center, West Haven,
CT 06516 and Departments of Neurology and Neurosurgery,
Yale University School of Medicine, New Haven, CT 06510, USA1Current address: Brain Sciences Institute, Swinburne
University of Technology, PO Box 218, Hawthorn, Victoria
3122, Australia2Current address: Brain Imaging and Analysis Center, Box
3808, Duke University Medical Center, Durham, NC 27710, USA
© Oxford University Press 1999

reports of other parts of this work have appeared (Allison et al.,
1994b, 1996a,b).
Materials and MethodsRecordings were obtained from 98 patients (44 males, 54 females, 10–55
years of age) with medically intractable epilepsy who were being evalu-
ated for possible surgery (Spencer et al., 1982). All patients were on
anticonvulsant medications during testing, but were in various stages of
dosage reduction to facilitate seizures. Their full-scale IQ was 89 ± 14. As
assessed by the Wada test, 80% were left-hemisphere dominant for
language, 11% were right-hemisphere dominant, and 9% were mixed
dominant. With two exceptions they scored within normal limits on the
Benton face-matching test (Benton et al., 1983). The protocols used in
this study were approved by the Human Investigation Committees of the
West Haven VA Medical Center and Yale University School of Medicine.
Informed consent was obtained.
Under general anesthesia, strips of electrodes were placed subdurally
on the cortical surface. In many patients 8 × 8 grids of electrodes were
also placed on the lateral surface. The exposed surface of each stainless
steel electrode was 2.2 mm in diameter; interelectrode spacing was 10
mm (5 mm in a few cases). The electrodes are maximally sensitive to field
potentials generated within the 3.8 mm2 area in contact with the brain,
but are less sensitive to activity generated in surface cortex more than a
few millimeters distant from the electrode, or to activity generated deep
within sulci. In addition to the subdural electrodes, multi-contact depth
probes were often targeted at the hippocampus and other temporal and
frontal lobe structures. The procedure used to determine and illustrate
surface electrode locations is shown in Figure 1. T1-weighted magnetic
resonance images (Fig. 1A) were obtained the day following implantation.
The location of each electrode was calculated in the coordinates of
Talairach and Tournoux (Talairach and Tournoux, 1988). However, only
the y-axis (anterior–posterior) coordinates were used to plot locations
in Figure 1 and similar maps. There is considerable inter- and intra-
hemispheric variation in the location and configuration of gyri and sulci,
hence the use of Talairach coordinates in the x-axis (medial–lateral) and
z-axis (inferior–superior) would lead to errors in apparent location. In
these axes, locations were plotted according to their position in relation
to sulci and gyri, as illustrated in Figure 1.
ERP recordings were obtained concurrently with EEG and behavioral
video recording used to determine the location and behavioral correlates
of seizure onset. The ERP recordings reported here were not obtained
immediately before or after seizures, and the EEG was usually normal at
recording sites of interest for these studies. ERPs were time-locked to
images displayed on a computer screen placed 60 cm from the patient’s
face. An experimenter sat at the patient’s bedside to monitor fixation and
alertness. Several experiments were used to search for face-specific
activity. In early experiments we used the following digitally scanned
Figure 1. Illustration of electrode localization. (A) Coronal slice of an MRI. An electrodestrip was inserted subdurally from the lower margin of the craniotomy and extendedacross the right ventral surface and onto the right mesial wall. Electrode 1 was justanterior to the marginal sulcus, electrodes 2–6 were on the precuneus, posteriorcingulate gyrus, and retrosplenial cortex, electrode 7 was on the lingual gyrus,electrode 8 was on the medial fusiform gyrus medial to the midfusiform sulcus, andelectrodes 9 and 10 were on the lateral fusiform gyrus. An 8 × 8 grid of electrodes wasplaced subdurally on the right parietal and temporal lobes; the electrodes of column 4are seen in this image. Electrodes 1 and 2 were on the inferior temporal gyrus,electrodes 3 and 4 were on the middle temporal gyrus, and electrodes 5–8 were on thesuperior temporal and angular gyri. The locations of these electrodes are shown onlateral (B), mesial (C) and inferior (D) views of a brain. The extent of the grid is indicatedby dashed lines in (B), and its inferior margin is indicated in (D). In this and later mapselectrodes were spaced 10 mm apart, but do not always appear to be linearly spaceddue to placement of each electrode in relation to sulci and gyri of the illustrative brain.The susceptibility artifact created by each electrode was larger than the electrode itself(4 mm diameter, 2.2 mm diameter in contact with the brain). Abbreviations: C, cuneus;CaS, calcarine sulcus; CoS, collateral sulcus; EC, entorhinal cortex; FOG, fourth occipitalgyrus of Duvernoy (Duvernoy, 1991); ILG, inferior lingual gyrus; ITG, inferior temporalgyrus; LFG, lateral fusiform gyrus; MFG, medial fusiform gyrus; MFS, midfusiform sulcus;MTG, middle temporal gyrus; OTS, occipitotemporal sulcus; PC, precuneus; PG,parahippocampal gyrus; POF, parieto-occipital fissure; SLG, superior lingual gyrus; STG,superior temporal gyrus.
416 Human Face Perception I • Allison et al.

grayscale photographs. (i) Faces from college yearbooks. Females and
clean-shaven males were equally represented, and none had extraneous
features such as spectacles or jewelry. (ii) Scrambled faces made by
rearranging each face such that all elements of the original image were
retained (thus the scrambled image was equiluminant with the original
image) but their location and orientation was modified until the face and
its parts were unrecognizable. This method of scrambling produces many
edges, and increases the high-frequency portion of the image spectrum.
(iii) The front ends of cars from automotive magazines. (iv) Cars
scrambled in the same manner as for faces. (v) Butterf lies from a field
guide.
Later experiments used improved grayscale stimuli. (i) Faces from
books prepared by model agencies. (ii) Phase-scrambled faces created by
computing a two-dimensional Fourier transform of each face, randomly
scrambling its phase spectrum while preserving its frequency spectrum,
and then performing an inverse transform and correcting for luminance.
This method of scrambling produces images with luminance and spatial
frequency comparable to the corresponding face. (iii) Flowers obtained
from digital stock images. (iv) Phase-scrambled f lowers made in the same
manner as for faces. (v) Letter-strings (concrete nouns) and Arabic
number-strings viewed as white characters against a black background.
(vi) Phase-scrambled nouns and numbers made in the same manner as for
faces. (vii) Blank gray rectangles of the same size and mean luminance of
the object or letter-string stimuli.
In all experiments stimulus duration was 250 or 500 ms and the inter-
stimulus interval varied randomly between 1.5 and 2.2 s. Stimulus order
was randomized. Face, object and scrambled images had a luminance of
29 ± 4 cd/m2 and subtended 8.4° × 8.4° of visual angle. Sinusoidal gratings
had a luminance of 31 ± 4 cd/m2 and subtended 7.3° × 7.3° of visual angle.
Nouns and Arabic numbers had a luminance of 11 ± 3 cd/m2, subtended
2.4–7.2° of visual angle horizontally and 1.5° vertically, and had a length
of 5.6 ± 1.4 characters. Butterf lies, f lowers or gray rectangles were targets
to which the patient pressed a button; faces were not task relevant and
were unfamiliar. The requirement to make button presses to the targets
provided a measure of the patient’s attention to the stimuli and allowed
assessment of the relationship, if any, between stimulus-related and
target-related ERPs. Each experiment consisted of 40–75 stimuli of each
category and 20–30 target stimuli (target probability 5–15%). Patients
performed target detection at >90% accuracy.
Local field potentials generated by these stimuli were recorded
simultaneously from 32 or 64 locations using a gain of 10 000, filter
settings of 0.1–100 Hz (–3 dB points), and digitized at a rate of 250 Hz.
Recordings were referential to a mastoid and were obtained 3–14 days
following implantation. A computer algorithm was written to identify and
measure amplitude, latency and area under the curve (AUC) of ERP peaks
and troughs within specified latency windows. The resulting measure-
ments for each ERP for each stimulus category were stored in a database
that also contained the Talairach coordinates of each electrode location. A
face-specific ERP was defined as one that was at least twice as large to
faces than to any other category of stimulus tested. This criterion is the
same as that used in some single-cell recordings of face-specific activity
(Perrett et al., 1982; Baylis et al., 1985; Leonard et al., 1985; Ó Scalaidhe
et al., 1997). A letter-string-specific ERP was defined as one that was at
least twice as large to letter-strings (in the experiments of this study,
concrete nouns) than to any other category of stimulus tested. An object-
specific site was defined as one at which the mean ERP amplitude across
object categories (any combination of cars, butterf lies, f lowers and faces)
was at least twice as large as the mean amplitude across scrambled object
categories (any combination of scrambled cars, f lowers and faces).
The inf luence of stimulus category upon the amplitude and latency of
face-specific ERPs was assessed by ANOVA. Because of volume
conduction, adjacent electrode sites may have partially sampled the same
neural activity. Therefore, if adjacent electrodes were determined to be
face specific, only measurements from the site having the largest
face-specific ERP were entered into the statistical analysis.
Because each electrode site entered into the ANOVA for a given
experiment experienced each of several stimulus categories, a repeated-
measures ANOVA design was employed. The significance of the stimulus
category factor is reported throughout as the overall ANOVA. Although a
significant overall ANOVA indicates that a difference in N200 amplitude
or latency existed among the categories, additional post-hoc contrasts
were also performed to determine which categories differed from each
other. Mixed ANOVA designs were used when the inf luence of stratifying
variables such as sex or hemisphere was evaluated. This same analytic
approach was used to evaluate other category-specific ERPs.
Results
ERPs Recorded from Striate and Peristriate Cortex
Although the focus of this paper is on face-specific ERPs, it is
useful to contrast the face-specific activity with earlier ERPs
recorded from electrodes on or near striate cortex. We encount-
ered 37 such sites that generated large ERPs, 14 in the right and
Figure 2. ERPs from striate and peristriate cortex. (A–D) examples of recordings. Inthese and following waveform plots: stimulus onset is at solid vertical line; stimulusoffset is at dashed vertical line; time and voltage calibrations apply to all waveformsunless separate calibrations are given; positive voltage is recorded upward; stimuluscategories and line types are identified by exemplars. (E,F) locations and centroids ofsites generating N100 and P100. Dorsal occipital pole sites were near the midline andare shown on the mesial maps. This and following maps were prepared as described inFigure 1; electrode locations are shown as solid circles or squares; centroids (geometricmeans) of locations are shown as black or white crosses.
Cerebral Cortex Jul/Aug 1999, V 9 N 5 417

23 in the left hemisphere. These ERPs often began with a
surface-negative potential (N100) with a latency of 90–120 ms.
(In this and following papers latency refers to peak latency
unless specified otherwise.) Representative recordings are
shown in Figure 2A,B. In other cases these ERPs began with an
initial positivity (P100) in the 90–120 ms latency range;
examples are shown in Figure 2C,D. P100 sites tended to be on
the dorsal surface of the occipital pole. The largest N100 and
P100 ERPs were evoked by scrambled faces, checkerboards or
other images with sharp edges (Fig. 2A–D). The locations of
these sites are shown in Figure 2E,F. The centroids of this and
other functionally active regions are listed in Table 1. The
preponderance of left hemisphere sites was due to increased
electrode coverage necessary for language mapping in the event
of resections of the left temporal lobe.
Many cells in V1 and V2 respond to stimulus offset (Hubel and
Wiesel, 1959; Duysens et al., 1996), and in humans visual ERPs
recorded from the occipital scalp contain an off-potential (Kriss
and Halliday, 1980). ERPs recorded from striate and peristriate
cortex contained an off-potential. That the later potentials were
off-potentials, rather than longer-latency potentials to stimulus
onset, was demonstrated by the fact that they were time-locked
to the offset of the stimulus, as in Figure 2A,B, in which stimulus
duration was 250 ms, and in Figure 2C,D, in which stimulus
duration was 500 ms.
An electrode located on left striate cortex just inferior to
the calcarine sulcus recorded much larger onset potentials to
checkerboards presented in the right than in the left visual field
(Fig. 3A). In an experiment using letter-strings and phase-
scrambled letter-strings, and larger and brighter non-letter-string
images, the latter images evoked a larger N100 (Fig. 3B). In an
experiment in which patients viewed gratings and an equi-
luminant blank field, gratings evoked a much larger N100 than
did non-patterned stimuli (Fig. 3C). Likewise, larger gratings
evoked a larger N100 than did smaller gratings (Fig. 3D). Thus
N100s and P100s recorded from striate and peristriate cortex
were not sensitive to stimulus category, but rather were sensitive
to stimulation of the contralateral visual field, luminance,
luminance contrast and size.
Ventral Face-specific N200 and Related ERPs
N200
N200 is the only face-specific ERP described previously in any
detail (Allison et al., 1994a,c), and it continues to be the most
Figure 3. ERPs from striate and peristriate cortex. Recordings from the left striatecortex to checkerboards (either white–black or gray–black) presented in the right andleft hemifields (A), to stimuli of varying luminance (B), to gratings and blank stimuli (C),and to gratings of varying size (D).
Table 1Centroids of face-specific and other active regions in the Talairach and Tournoux coordinatesystem (Talairach and Tournoux, 1988)
ERP Right hemisphere Left hemisphere
n x y z n x y z
N100/P100 14 6 –90 5 22 –14 –83 –3Ventral face-specific N200 41 37 –55 –14 34 –38 –53 –17Lateral face-specific N200 4 51 –64 9 3 –48 –73 7Ventral face-specific VP350 2 39 –45 –18 7 –25 –47 –13Lateral face-specific LP350 6 47 –67 8 8 –53 –55 12Anterior face-specific AP350 16 34 –10 –30 0Ventral gratings N180 5 22 –73 –8 7 –19 –79 –12Lateral gratings N180 1 34 –87 –3 1 –32 –88 –11Ventral object-specific N200 6 29 –63 –9 9 –33 –64 –18Lateral object-specific N200 3 32 –83 14 2 –49 –85 14Ventral letter-string-specific N200 7 33 –80 –4 11 –34 –78 –7Ventral non-specific N200 9 17 –54 –5 11 –28 –57 –13
418 Human Face Perception I • Allison et al.

common face-specific ERP encountered in these recordings. A
number of experiments included faces and other categories of
stimuli. To illustrate the major features of these recordings we
will describe the ERPs obtained in one such experiment.
In this experiment patients viewed faces, cars, scrambled
faces, nouns, Arabic numbers and (target) gray rectangles. There
were 21 face-specific N200 sites, 13 in the right and 8 in the left
hemisphere. Representative recordings are shown in Figure
4A,B. As illustrated in Figure 4B, the earlier portion of the wave-
form at face-specific sites was usually triphasic and consisted
of P150, N200 and P290 ERPs. Results for the right and left
hemisphere were similar and are combined in Figure 4C,D. The
overall ANOVA for N200 amplitude was significant [F(df 6,120)
= 20.9, P < 0.0001]. Faces evoked a significantly larger N200 than
did any other stimulus category (P < 0.0001 in each case). The
overall ANOVA for N200 latency was not significant. The degree
of specificity of N200 to faces was variable. For example, in the
recording of Figure 4B N200 amplitude to number-strings was
∼40% as large as to faces, whereas in the recording of Figure 4A
there was little response to the other stimulus categories.
P150 and P290
As illustrated in Figure 4B, N200 was often preceded by a
positivity with a mean latency of 154 ms (P150) and followed by
a positivity with a mean latency of 288 ms (P290). At all
face-specific N200 sites, P150 was rarely (7%) face specific, was
often (77%) present but not face specific, and was occasionally
(16%) absent. At the same sites, P290 was sometimes (12%) face
specific, often (67%) present but not face specific and some-
times (21%) absent. Thus face-specific N200s were often
preceded and followed by positivities of variable specificity.
P150 and P290 amplitude and latency often showed changes like
those seen for N200, but usually not as robust.
N700
P290 was often followed by one or two slow negative ERPs with
a mean latency of 690 ms (N700). In Figure 5 both the early
fraction (black arrow) and late fraction (gray arrow) were seen.
In some recordings only the early or late fraction was seen. One
or both fractions of N700 were face-specific at 49% of all
face-specific N200 sites. Face-specific N700s were also recorded
from 25 sites that did not generate a face-specific N200.
Summary of Responsiveness at Ventral Face-specific
N200 Sites
Overview
For all experiments designed to identify face-specific ERPs, a
total of 75 face-specific N200 sites were encountered on ventral
occipitotemporal cortex. The experiments used for this sum-
mary analysis had in common faces, objects (cars or f lowers),
scrambled or phase-scrambled faces, and targets (butterf lies or
gray rectangles). Results for the right and left hemisphere were
similar and are combined in Figure 6A–C. The overall ANOVA for
N200 amplitude was significant [F(df 3,213) = 150, P < 0.0001].
N200 amplitude was significantly larger to faces than to the other
stimulus categories (P < 0.0001 in each case), which did not
differ significantly among themselves. P150 and P290 amplitudes
were significantly larger to faces than to the other stimulus
categories (P < 0.01 in each case), which did not differ signi-
ficantly among themselves. Overall ANOVAs for P150, N200 and
P290 latency were not significant. N700 was sometimes com-
posed of more than one fraction (Fig. 5), hence peak amplitude
Figure 5. N700 at a ventral face-specific N200 site. The early fraction of N700 isindicated by the black arrow, the late fraction by the gray arrow.
Figure 4. ERPs at ventral face-specific N200 sites. (A,B) Examples of recordings.(C,D) Summaries of amplitude and latency. These and following histogram plots showmeans ± SEM; histograms for each stimulus category are in the same order as theexemplars at top.
Cerebral Cortex Jul/Aug 1999, V 9 N 5 419
was a poor measure of this activity. The AUC was a better
estimate. Calculated AUCs could be positive or negative; a
negative AUC means that net voltage was negative in the latency
range within which AUC was determined. N700 AUC measure-
ments were made within a latency range of 450–924 ms, which
captured most of this activity. N700 at face-specific N200 sites
was present only to faces, whereas the other stimulus categories
evoked a broad late potential that on average remained positive
(Fig. 6C). The overall ANOVA for N700 AUC was significant [F(df
3,99) = 20.9, P < 0.0001]. N700 to faces was significantly larger
than to the other stimulus categories (P < 0.001 in each case),
which did not differ significantly among themselves.
The locations of the ventral face-specific N200 sites are shown
in Figure 6D. There were 41 right and 34 left hemisphere sites.
Fifty-three sites were on the temporal lobe and 22 were on the
occipital lobe, defined as sites posterior to the occipitotemporal
notch. Most (75%) sites were on the fusiform or fourth occipital
gyri, and 25% were on the inferior temporal or occipital gyri just
lateral to the occipitotemporal or inferior occipital sulci. Within
the fusiform gyrus 73% of the sites were on the lateral fusiform
gyrus and 27% were on the medial fusiform gyrus medial to the
midfusiform sulcus. Across patients the most anterior site was at
y = –24 and the most posterior site was at y = –91, spanning the
posterior two-thirds of the fusiform gyrus and extending into
the fourth occipital gyrus. The most medial site was at Talairach
|x| = 15, and the most lateral site (excluding the lateral face
area, see below) was at |x| = 57. For convenience the region
encompassing these face-specific N200 sites will be referred to
as the ventral face area.
Intrahemispheric Comparisons
There could be processing stages within the large ventral face
area that might be ref lected by systematic changes in face-
specific N200 amplitude or latency. For each hemisphere, N200
amplitude and latency were plotted as a function of Talairach x
and y coordinates. In no case was the linear trend significant,
and in no case did changes in amplitude or latency account for
>6% of the variance in these measures. Thus there was no
evidence of anterior–posterior or medial–lateral differences in
N200 amplitude and latency within the ventral face area of either
hemisphere.
Figure 6. ERPs at ventral face-specific N200 sites. (A–C) Summaries of amplitude,latency and N700 AUC. (D) Locations and centroids of ventral face-specific N200 sites.
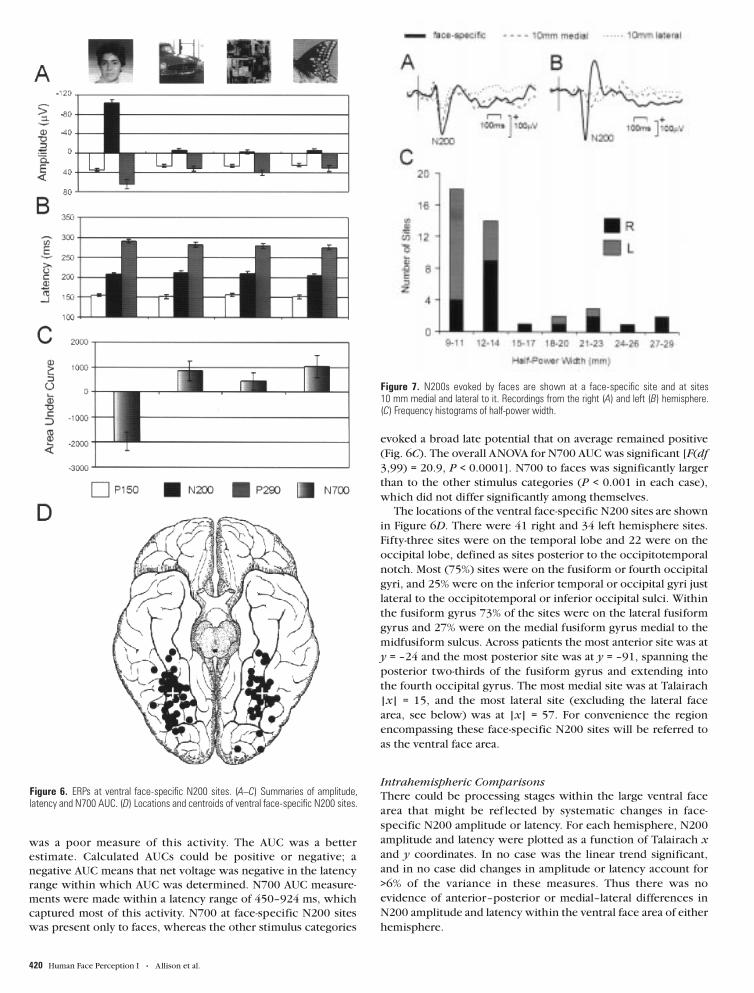
Figure 7. N200s evoked by faces are shown at a face-specific site and at sites10 mm medial and lateral to it. Recordings from the right (A) and left (B) hemisphere.(C) Frequency histograms of half-power width.
420 Human Face Perception I • Allison et al.

Interhemispheric Comparisons
The right hemisphere is considered to be more important than
the left hemisphere in processing facial information. Behavioral
studies show a right hemisphere advantage for face recognition
[reviewed by Sergent (Sergent, 1988) and Rhodes (Rhodes,
1993)]. Prosopagnosia always involves the right hemisphere, and
can sometimes be produced by damage to the right hemi-
sphere alone (Landis et al., 1986; Sergent and Villemure, 1989;
Damasio et al., 1990; DeRenzi et al., 1994; Puce et al., 1997).
Positron emission tomography (Horwitz et al., 1992; Sergent et
al., 1992, 1994; Haxby et al., 1995) and functional magnetic
resonance imaging (fMRI) (Puce et al., 1996; Kanwisher et al.,
1997; McCarthy et al., 1997) studies demonstrate that the right
hemisphere is more strongly activated by faces than is the left
hemisphere. In scalp-recorded ERPs evoked by faces, a face-
specific N170 was usually larger over the right than the left
posterior temporal region (Bentin et al., 1996; George et al.,
1996). We therefore predicted that face-specific N200 sites
would generate larger N200s, or would be more numerous, in
the right than in the left hemisphere.
Faces evoked no significant differences between the right and
left hemisphere for P150, N200 and P290 amplitude and latency
or for N700 AUC. To determine whether the 41 right hemisphere
and 34 left hemisphere face-specific N200 sites were secondary
to better right hemisphere coverage we counted the total
number of electrodes on ventral cortex posterior to the most
anterior N200 site; there were 720 right and 785 left hemisphere
sites. Although there were proportionally more face-specific
N200 sites in the right than in the left ventral face area, the
difference in laterality was not significant (χ2 = 1.20, P = 0.15).
The Size of Ventral Face-responsive Cortex
Figure 6D demonstrated that a large region of ventral occipito-
temporal cortex can be involved in face processing. However,
those results tell us little about the size and shape of cortex
activated by faces in individual hemispheres. Medial and lateral
to ventral face-specific N200 sites were sites that were not face
specific by our amplitude criterion but were responsive to faces.
Face-specific and adjacent cortex will be referred to as
face-responsive cortex. Of the 75 ventral face-specific N200
sites, 41 (20 right, 21 left hemisphere) had enough electrodes
both lateral and medial to the face-specific site to allow deter-
mination of the falloff of N200 amplitude about the peak. A
recording from the right hemisphere is shown in Figure 7A and
from the left hemisphere in Figure 7B. A common measure of
bandwidth is the half-power (0.707 amplitude) width. As calcu-
lated from recordings like those in Figure 7A,B, the half-power
width was 16.2 ± 5.9 mm (mean ± SD) in the right hemisphere
and 11.8 ± 3.2 mm in the left hemisphere; this difference was
significant (P < 0.02). Frequency histograms of half-power width
are shown in Figure 7C and indicate, in addition to a main peak
at ∼12 mm, a smaller peak at ∼20 mm, and a tendency for the
right hemisphere to have larger and more variable half-power
widths.
The length of face-responsive cortex in the anteroposterior
dimension was difficult to assess because in most hemispheres
only a single electrode strip was placed appropriately to record a
face-specific N200. However, exceptions to this rule provided
some insight into the possible length and number of face-
responsive regions. In Figure 8A,B, face-specific sites 15–25 mm
apart were found. Figure 8C shows the largest putative face-
specific cortex we encountered. In both hemispheres anterior
face-specific sites were separated from posterior face-specific
sites by 23 mm (right hemisphere) and 36 mm (left hemisphere).
In these recordings the half-power widths ranged from 10 to 14
mm, suggesting face-responsive regions ∼10–15 mm wide and
∼35–48 mm long. However, this conclusion assumes that cortex
between the anterior and posterior face-specific sites was also
face specific. The recordings of Figure 8D–F suggest that this is
not necessarily a valid assumption; the anterior and posterior
face-specific N200 sites were separated by cortex unresponsive
to faces, suggesting the presence of anatomically separate
face-specific regions.
Sex Differences
There is little evidence that females and males respond
differently to faces, although females may be better than males in
face recognition memory [reviewed by Shepherd (Shepherd,
1981)] and discrimination of facial expression [reviewed by
Vermeire and Hamilton (Vermeire and Hamilton, 1998)]. To test
for possible ERP differences we queried the 75 ventral face-
specific N200 sites, 45 in females and 30 in males. Results for the
right and left hemisphere were similar and were combined for
statistical analysis. P150, N200 and P290 amplitudes, P150 and
P290 latency, and N700 AUC were not significantly different for
males and females. N200 latency was significantly (P < 0.05) later
Figure 8. Locations of ventral face-specific N200 sites (solid circles) and other sites(open circles) in six patients (A–F).
Cerebral Cortex Jul/Aug 1999, V 9 N 5 421

in males than in females; the ratio of male/female latency was
1.06. Male/female latency ratios of 1.06 or less can be attributed
to male/female differences in brain size and corresponding
differences in pathway length (Allison et al., 1983). Thus the
sex difference in N200 latency was probably secondary to
the sex difference in brain size.
ERPs Recorded from the Normal and Abnormal Hemisphere
All the patients of this study had seizures not adequately
controlled by anticonvulsant medication, and most had epilepsy
of >5 years duration. The question arises whether their ERPs are
representative of those that would be recorded from normal
brains. The most direct approach to this question is to determine
whether there were systematic differences in ERP amplitude or
latency in the normal compared to the abnormal hemisphere,
defined as the presence of a unilateral epileptogenic focus as
determined by intracranial EEG recording and, in the great
majority of patients, subsequent resection of the abnormal
tissue.
Fifty-three face-specific N200 sites were in the abnormal
hemisphere, and 18 were in the normal hemisphere. (This bias
ref lects the fact that previous information often suggested
which hemisphere was abnormal prior to electrode implanta-
tion. Four sites were in patients with bilateral abnormality and
were not included in this analysis.) Faces evoked no significant
differences between the normal and abnormal hemisphere for
P150, N200 and P290 amplitude and latency or for N700 AUC.
Thus the patients’ epilepsy did not significantly affect the
face-specific N200 and related ERPs described in this study.
Figure 9. ERPs at lateral face-specific N200 sites. (A,B) Examples of recordings.(C–E) Summaries of amplitude, latency and N700 AUC. (F) Locations of lateral N200sites in the left hemisphere (solid squares projected onto a right hemisphere view) andright hemisphere (solid circles), and centroid of left and right hemisphere sitescombined.
Figure 10. Simultaneous recording of face-specific N200s from ventral and lateralsites. (A) Recording from the right hemisphere. (B) Ventral view of locations. (C) Coronalview of locations. Electrode 5 was on the border of the middle temporal gyrus and themiddle occipital gyrus (MOG). FG, fusiform gyrus; ITS, inferior temporal sulcus; LOS,lateral occipital sulcus.
422 Human Face Perception I • Allison et al.

Lateral Face-specific N200 and Related ERPs
Seven face-specific N200 sites were encountered on the lateral
surface of the temporal lobe, four in the right and three in the
left hemisphere. Representative recordings are shown in Figure
9A,B. Results for the right and left hemisphere were similar and
are combined in Figure 9C–E. The overall ANOVA for N200
amplitude was significant [F(df 3,15) = 9.59, P < 0.001]. N200
amplitude to faces was significantly larger than to the other
stimulus categories (P < 0.02 in each case), which did not differ
significantly among themselves. P290 amplitude was also
significantly larger to faces than to the other stimulus categories
(P < 0.02 in each case), which did not differ significantly among
themselves. The overall ANOVAs for P150 amplitude and P150,
N200 and P290 latency were not significant. N700 AUC was
marginally larger to faces than to the other stimulus categories
(P < 0.06 in each case), which did not differ significantly among
themselves. Thus the responsiveness of lateral face-specific
N200 and related ERPs to face and non-face stimuli was similar to
that at ventral sites. P150 latency was significantly (P < 0.02)
earlier at lateral compared to ventral sites. N200 latency to faces
at lateral sites was 16 ms earlier than at ventral N200 sites, but
this difference did not reach significance (P < 0.11). The loca-
tions of these sites are shown in Figure 9F; they were centered
on the middle temporal gyrus. This area will be referred to as the
lateral face area.
The lateral and ventral face areas were anatomically separate
(Fig. 10). From electrode 1 a ventral face-specific N200 was
recorded from the lateral fusiform gyrus, no face-specific ERPs
were recorded from electrodes 2–4, and a lateral face-specific
N200 was recorded from electrode 5 located on the middle
temporal or middle occipital gyrus. This recording also demon-
strates that face-specific N200s were focal in the medial–lateral
dimension; in this case they were recorded from a single
electrode, and they were never recorded from more than two
adjacent electrodes. Lateral face-specific N200 sites were
encountered during the final portion of this study, when we
recorded more systematically from the lateral temporal lobe;
they were found in 6 of the last 13 patients studied. It is therefore
highly probable that the lateral face area generates face-specific
N200s more frequently than the overall results would suggest.
P350
A face-specific positivity with a mean latency of 344 ms (P350)
was recorded from 39 sites, 24 in the right and 15 in the left
hemisphere. P350 was recorded in several experiments that
included faces, objects (cars or f lowers), scrambled or phase-
scrambled faces, and targets (butterf lies or gray rectangles).
Representative recordings are shown in Figure 11A,B. P350 was
a broad potential sometimes containing subpeaks (e.g. Fig. 11B),
hence AUC measurement was used over the latency range
200–600 ms, which captured most of the P350 waveform.
Results for the right and left hemisphere were similar and are
combined in Figure 11C. The overall ANOVA for P350 AUC was
significant [F(df 3,84) = 33.2, P < 0.0001]. P350s evoked by faces
were significantly larger than to any other stimulus category (P <
0.0001 in each case). P350s were recorded from three regions
(Fig. 11D,E); bilaterally from the ventral face area, bilaterally
from the lateral face area, and in the right hemisphere from the
anterior ventral temporal lobe. P350s recorded from these
regions will be referred to respectively as VP350, LP350 and
AP350.
AP350s were recorded only from the right hemisphere (Fig.
11D); this region will be referred to as the anterior face area. To
determine whether this laterality might be secondary to better
electrode coverage in the right hemisphere, we counted all
Figure 11. ERPs at face-specific P350 sites. (A,B) Examples of recordings. (C) P350AUC. (D) Locations and centroids of VP350 and AP350 sites. (E) Locations of LP350sites in the right hemisphere (solid squares projected onto a left hemisphere view) andleft hemisphere (solid circles), and centroid of right and left hemisphere sites combined.
Cerebral Cortex Jul/Aug 1999, V 9 N 5 423

electrode sites on the ventral surface of the temporal lobe
anterior to the most posterior AP350 site (Talairach coordinate
y = –23). There were 485 right and 623 left hemisphere sites,
thus AP350 was lateralized to the right hemisphere. There was
no anatomical overlap between AP350 and VP350 sites. In two
recordings (not shown) N350s were recorded from depth probes
superior to the medial ventral surface; they were probably the
polarity-inverted counterparts of AP350.
Negative Recording Sites
Not shown in the maps of Figures 6D, 9F and 11D,E are negative
sites, i.e. locations recorded from that did not generate a face-
specific ERP. Such sites numbered >7000 and covered the
ventral, lateral and mesial surfaces of the brain. No face-specific
ERPs were recorded from mesial temporal lobe structures,
including the hippocampus and parahippocampus, nor from
white matter of the temporal and occipital lobes. It is unlikely
that additional recordings will reveal any appreciable expansion
of the ventral and anterior face areas beyond the regions shown.
The lateral face area could be larger than indicated by Figure 9F
and may approximate the region shown in Figure 11E.
A total of ∼7500 locations were recorded from in the experi-
ments of this study, and each experiment contained 4–8 stimulus
categories. It is possible that some N200s were adventitious
and ref lected random EEG changes. To determine the number
of apparent category-specific N200s recorded by chance, we
searched all locations for N200s evoked by scrambled faces,
which would not be expected to generate scrambled face-
specific activity; three such sites were found. This result
provides strong evidence that the N200s described in this and
the following papers ref lect valid category-specific neuronal
activity rather than biological or non-biological noise.
Grating-sensitive ERPs
Following initial processing in areas V1 and V2, subsequent
stages of form processing occur in areas including V4 and
STS/IT. Some cells in these areas respond to complex features
that do not form identifiable objects (Desimone and Schein,
1987; Gallant et al., 1993; Tanaka, 1993; Ghose and Ts’o, 1997).
ERP recordings to test the responsiveness of face-specific sites to
complex non-objects and to search for form processing sites
were based on a study by Gallant et al. (Gallant et al.. 1993). We
used the following grayscale subset of their sinusoidally
modulated gratings: Cartesian horizontal and vertical; polar
concentric, radial and spiral; and hyperbolic. Targets were gray
circles of the same size and mean luminance as the gratings.
There were 11 ventral face-specific N200 sites, 6 in the right
and 5 in the left hemisphere. Results for the right and left
hemisphere were similar and were combined for statistical
analysis The overall ANOVA for N200 amplitude was significant
[F(df 7, 63) = 21.4, P < 0.0001]. N200 amplitude was significantly
larger to faces than to any grating (P < 0.0004 in each case),
which did not differ significantly among themselves. Gratings
evoked N200s that were 9–18% as large as to faces. There were
three lateral face-specific N200 sites; their responsiveness was
similar to that at ventral sites.
The site in each hemisphere that generated the largest ERPs to
gratings was determined. There were 14 such sites, 6 in the right
and 8 in the left hemisphere. Representative recordings are
shown in Figure 12A,B. Waveforms were triphasic and consisted
of a positivity with a mean latency of 117 ms (P120), a negativity
at 179 ms (N180) and a positivity at 258 ms (P260). Results for
the right and left hemisphere were similar and are combined in
Figure 12C,D. The overall ANOVA for N180 amplitude was
significant [F(df 6,78) = 5.61, P < 0.0001]. All types of non-
Cartesian gratings evoked N180s that were significantly larger
than those evoked by (target) gray circles (P < 0.02 in each case);
this was not the case for either type of Cartesian grating. N180
amplitude was significantly smaller to Cartesian gratings than to
any type of non-Cartesian grating (P < 0.02 in each case), which
did not differ significantly among themselves. The locations of
Figure 12. ERPs at sites that generated the largest N180 to gratings. (A,B) Examplesof recordings. (C,D) Summaries of amplitude and latency. Cartesian vertical gratings(not shown) evoked ERPs similar to those evoked by Cartesian horizontal gratings.Gratings are, from left to right, Cartesian horizontal, hyperbolic, polar, radial and spiral.(E,F) locations and centroids of N180 sites; in the lateral view a right hemisphere site(solid square) is projected onto the left hemisphere.
424 Human Face Perception I • Allison et al.

these sites are shown in Figure 12E,F, and summarized in
Table 1.
Object-specific N200 and Related ERPs
To determine whether occipitotemporal cortex contains sites
responsive to recognizable complex objects in addition to their
possible responsiveness to faces, we searched for sites that were
object-specific using the amplitude criterion defined in Materials
and Methods. There were 24 object-specific sites, 11 in the right
and 13 in the left hemisphere. Representative recordings are
shown in Figure 13A,B. Object-specific waveforms consisted of
P150, N200 and P290 ERPs. Results for the right and left
hemisphere were similar and are combined in Figure 13C,D.
N200 amplitude to objects was significantly larger than to
scrambled objects (P < 0.001). P150 and P290 amplitude, and
P150, N200 and P290 latency were not significantly different to
objects than to scrambled objects. The locations of these sites
are shown in Figure 13E,F, and summarized in Table 1. They
occupied the inferior lingual, fusiform and inferior occipital gyri
and extended laterally onto the surface of the occipital pole.
Cars are commonly viewed complex objects. Front views of
cars are similar to faces in the arrangement of their component
parts (eye-like headlights, etc.) and are easy to anthropomorph-
ize, as in cartoons. Cars thus provide a useful inanimate control
for faces. At face-specific N200 sites, cars evoked small N200s
(e.g. Fig. 4). Averaged over all experiments in which cars were
used, N200 amplitude to cars was 12% as large as to faces. Thus
cars did not evoke appreciable activity at face-specific N200
sites. Two car-specific N200 sites were found; this number did
not exceed the number of scrambled face-specific sites (see
above), hence there was no evidence that cars evoked category-
specific N200s.
Occipitotemporal lesions reveal a dichotomy in the recogni-
tion of living versus non-living objects (Warrington and Shallice,
1984; Farah et al., 1991; Newcombe et al., 1994), and some of
the factors that produce this effect have been investigated
(Tranel et al., 1997b; Caramazza and Shelton, 1998). It is poss-
ible that putative face-specific N200 sites are responsive to other
living things as well.
Butterf lies served as a category of animate living things
because animal recognition appears to be particularly affected
(Newcombe et al., 1994; Caramazza and Shelton, 1998). Aver-
aged over all experiments in which butterf lies were used, N200
amplitude to butterf lies was 5% as large as to faces at face-
specific N200 sites. In these experiments butterf lies were
targets to which the patient pressed a button. In none of the
experiments described in this paper were faces explicitly
attended, whereas attended target stimuli did not evoke an N200
but evoked target-related P300s [reviewed by Donchin and Coles
(Donchin and Coles, 1988)] at some sites, demonstrating that
attention to a stimulus did not per se evoke an N200.
Flowers were used to determine responsiveness to a category
of inanimate living things. At face-specific N200 sites, and aver-
aged over all experiments in which f lowers were used, N200
amplitude to f lowers was 4% as large as to faces. Thus living
objects per se did not evoke appreciable N200s at face-specific
N200 sites. Three f lower-specific N200 sites were found, not
enough to suggest f lower-specific processing.
Letter-string-specific N200 and Related ERPs
Some ventral sites generate letter-string-specific N200s that are
larger to nouns, pseudowords and other types of letter-strings
than to faces and other categories of stimuli (Allison et al.,
1994c; Nobre et al., 1994). In this study some experiments
contained faces, f lowers, letter-strings, phase-scrambled letter-
strings and (target) gray rectangles. There were 18 letter-string-
specific sites, 7 in the right and 11 in the left hemisphere.
Representative recordings are shown in Figure 14A,B. The
waveform at letter-string-specific sites consisted of P150, N200,
Figure 13. ERPs at object-specific N200 sites. (A,B) Examples of recordings. (C,D)Summaries of amplitude and latency combined across all object and all scrambled-object categories. (E,F) Ventral and lateral locations and centroids of object-specificsites.
Cerebral Cortex Jul/Aug 1999, V 9 N 5 425
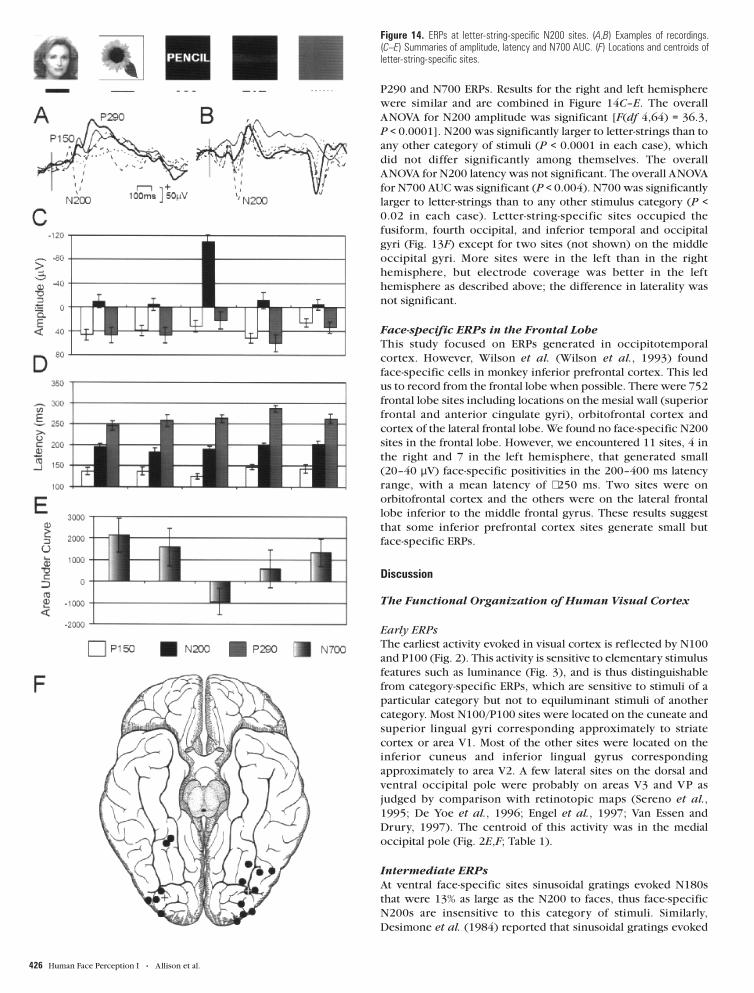
P290 and N700 ERPs. Results for the right and left hemisphere
were similar and are combined in Figure 14C–E. The overall
ANOVA for N200 amplitude was significant [F(df 4,64) = 36.3,
P < 0.0001]. N200 was significantly larger to letter-strings than to
any other category of stimuli (P < 0.0001 in each case), which
did not differ significantly among themselves. The overall
ANOVA for N200 latency was not significant. The overall ANOVA
for N700 AUC was significant (P < 0.004). N700 was significantly
larger to letter-strings than to any other stimulus category (P <
0.02 in each case). Letter-string-specific sites occupied the
fusiform, fourth occipital, and inferior temporal and occipital
gyri (Fig. 13F) except for two sites (not shown) on the middle
occipital gyri. More sites were in the left than in the right
hemisphere, but electrode coverage was better in the left
hemisphere as described above; the difference in laterality was
not significant.
Face-specific ERPs in the Frontal Lobe
This study focused on ERPs generated in occipitotemporal
cortex. However, Wilson et al. (Wilson et al., 1993) found
face-specific cells in monkey inferior prefrontal cortex. This led
us to record from the frontal lobe when possible. There were 752
frontal lobe sites including locations on the mesial wall (superior
frontal and anterior cingulate gyri), orbitofrontal cortex and
cortex of the lateral frontal lobe. We found no face-specific N200
sites in the frontal lobe. However, we encountered 11 sites, 4 in
the right and 7 in the left hemisphere, that generated small
(20–40 µV) face-specific positivities in the 200–400 ms latency
range, with a mean latency of ∼250 ms. Two sites were on
orbitofrontal cortex and the others were on the lateral frontal
lobe inferior to the middle frontal gyrus. These results suggest
that some inferior prefrontal cortex sites generate small but
face-specific ERPs.
Discussion
The Functional Organization of Human Visual Cortex
Early ERPs
The earliest activity evoked in visual cortex is ref lected by N100
and P100 (Fig. 2). This activity is sensitive to elementary stimulus
features such as luminance (Fig. 3), and is thus distinguishable
from category-specific ERPs, which are sensitive to stimuli of a
particular category but not to equiluminant stimuli of another
category. Most N100/P100 sites were located on the cuneate and
superior lingual gyri corresponding approximately to striate
cortex or area V1. Most of the other sites were located on the
inferior cuneus and inferior lingual gyrus corresponding
approximately to area V2. A few lateral sites on the dorsal and
ventral occipital pole were probably on areas V3 and VP as
judged by comparison with retinotopic maps (Sereno et al.,
1995; De Yoe et al., 1996; Engel et al., 1997; Van Essen and
Drury, 1997). The centroid of this activity was in the medial
occipital pole (Fig. 2E,F; Table 1).
Intermediate ERPs
At ventral face-specific sites sinusoidal gratings evoked N180s
that were 13% as large as the N200 to faces, thus face-specific
N200s are insensitive to this category of stimuli. Similarly,
Desimone et al. (1984) reported that sinusoidal gratings evoked
Figure 14. ERPs at letter-string-specific N200 sites. (A,B) Examples of recordings.(C–E) Summaries of amplitude, latency and N700 AUC. (F) Locations and centroids ofletter-string-specific sites.
426 Human Face Perception I • Allison et al.

little or no response from monkey face-specific STS/IT cells. By
contrast, gratings evoked large N180s from sites that were on
average posterior to ventral face-specific N200 sites. N180 was
generally larger to non-Cartesian than to Cartesian gratings,
responded well to all types of gratings, but occasionally
responded better to one type of grating, results similar to those
reported by Gallant et al. (Gallant et al., 1993). Thus these sites
are probably involved in a stage of form processing similar to
that in monkey area V4 (Desimone and Schein, 1987; Gallant et
al., 1993; Ghose and Ts’o, 1997). The latencies of the P120–
N180–P260 ERPs generated at grating sites were on average
20–30 ms earlier than the P150–N200–P290 ERPs generated at
face-specific, object-specific and letter-string-specific sites, and
were later than the N100 and P100 ERPs initially generated in
striate and peristriate cortex. These results suggest that grating
ERPs ref lect processing that is temporally intermediate between
initial processing in V1 and V2 and category-specific processing.
Face-specific ERPs
Face-specific processing occurs in three cortical regions: the
ventral face area, which generates N200, its related P150, P290
and N700 ERPs, and VP350 (Figs 6D, 11D); the lateral face area,
which generates N200, its related P150, P290 and N700 ERPs,
and LP350 (Figs 9F, 11E); and the anterior face area, which
generates AP350 (Fig. 11D). N200s ref lect the earliest clear
evidence of face-specific processing, and may ref lect postulated
early stages of face processing such as ‘template formation’
(Damasio et al., 1982) or ‘structural encoding’ (Bruce and
Young, 1986; Perrett et al., 1987). Some P150s were face speci-
fic, suggesting that face-specific processing could begin as early
as P150 onset, 130–140 ms after stimulus onset and 40–50 ms
after onset of activation of striate cortex at ∼90 ms. This estimate
differs from that of Seeck et al. (Seeck et al., 1997), who
concluded that face-specific processing begins as early as 50 ms
after stimulus onset.
Ventral face-specific N200 sites are located primarily in the
lateral fusiform and adjacent inferior temporal gyri, and less
frequently in the medial fusiform and fourth occipital gyri.
The fusiform gyrus is ∼20 mm wide (Lang and Belz, 1981),
suggesting (together with the results of Fig. 7) that a typical
face-responsive patch of cortex occupies the lateral 50–75% of
the fusiform gyrus, or the lateral half of the fusiform gyrus and
adjacent inferior temporal gyrus. Face-specific VP350s ref lect a
later and presumably different type of neuronal activity than
N200, yet they were recorded from the same ventral area from
which face-specific N200s were recorded. In some cases VP350
sites were adjacent to N200 sites, suggesting that later face
processing may be carried out near the initial processing
ref lected by face-specific N200s. Face-specific processing as
assessed by fMRI was also localized primarily to the lateral
fusiform gyrus (Kanwisher et al., 1997; McCarthy et al., 1997;
Halgren et al., 1999). fMRI studies suggest that cortex within the
midfusiform and occipitotemporal sulci is also activated by faces
(Clark et al., 1996; Puce et al., 1996; Halgren et al., 1999). This
cortex probably generates face-specific ERPs, but cortical
surface recordings are relatively insensitive to generators within
sulci.
The lateral face area is centered in the middle temporal gyri.
Like the ventral face area, the lateral face area generates early
(N200) and late (P350) face-specific ERPs. Activation of this
region by faces, as detected by fMRI (Puce et al., 1996), is
probably the summation of neuronal activity ref lected by
face-specific N200 and related ERPs, and by LP350.
The anterior face area consists of the anterior fusiform gyrus,
cortex of the ventral temporal pole and entorhinal cortex (Fig.
11D). McCarthy et al. (McCarthy et al., 1995) found that words
evoked P400s from the surface of this region and N400s from
depth probes superior to it. This spatial distribution of voltage
suggested generators mainly in the collateral sulcus and anterior
fusiform gyrus. Face-specific AP350s showed a similar spatial
distribution, suggesting similar generators.
Object-specific ERPs
Object-specific N200s were evoked by complex objects but not
by scrambled objects (Fig. 13). This activity may ref lect general
object processing. Object-specific N200s were recorded from
sites that extended from the inferior lingual gyrus medially to the
middle occipital gyrus laterally (Fig. 13E,F). Not enough object-
specific sites were encountered to draw strong conclusions
about the borders of the object-related region; it included, but
was not confined to, the ‘lateral occipital complex’ (LO)
activated by objects and faces in the fMRI study of Malach et al.
(Malach et al., 1995). Ventrally the centroid of this activity was
in the posterolateral fusiform gyrus; the lateral surface sites were
centered in the middle occipital gyrus (Fig. 13E,F; Table 1).
Cars did not evoke large N200s or related ERPs at face-specific
N200 sites despite the fact that front views of cars resemble faces
in the arrangement of headlights (‘eyes’), grill (‘nose’) and
bumper (‘mouth’). Butterf lies and f lowers did not evoke an
appreciable N200 or related ERPs at face-specific N200 sites.
These results demonstrate that face-specific N200 sites are not
responsive to complex inanimate and living objects per se, but
are responsive only to faces.
Letter-string-specific ERPs
Letter-string-specific N200s were evoked by nouns but not by
phase-scrambled nouns or other categories of stimuli (Fig. 14).
Letter-string-specific N200s suggest a separate subsystem for
letter-string recognition that may be involved in the prelexical
grouping of letters into recognizable word forms (Nobre et al.,
1994). The centroids of this activity were in the fourth occipital
gyri near the occipitotemporal sulci (Fig. 14F).
Laterality of Face-specific ERPs
Face-specific N200s and related ERPs were recorded bilaterally
from the ventral face area, and their amplitude, latency and AUC
did not differ significantly between hemispheres. Thus the right
and left hemisphere are engaged more or less equally in the
initial stages of face processing. This conclusion is similar to that
of Moscovitch et al. (Moscovitch et al., 1976), who argued from
behavioral results that hemispheric differences are not seen in
the early stages of face processing, but rather are seen in
higher-order mnemonic processes. However, two differences
were found. (i) Face-responsive cortex was significantly wider in
the right than in the left ventral face area (Fig. 7). More
face-specific N200 sites were encountered in the right than the
left ventral face area (Fig. 6D) despite better electrode coverage
in the left hemisphere. This result is probably secondary to the
larger face-responsive patches of cortex in the right hemisphere;
a particular electrode is somewhat more likely to be placed over
face-specific cortex in the right than in the left hemisphere. (ii)
Comparison of right and left hemisphere sites shows that N200
latency to faces in the right hemisphere was on average 5.6 ms
earlier than in the left hemisphere. Conversely, N200 latency to
objects was on average 11.8 ms earlier in the left than in the right
hemisphere; this interaction was significant [F(df 1,59) = 4.04,
Cerebral Cortex Jul/Aug 1999, V 9 N 5 427

P < 0.05]. These differences are small, but if one assumes that
the hemisphere that first responds to a stimulus pre-empts
processing in the other, such differences may be amplified when
both faces and objects are simultaneously present in the visual
scene. Greater right hemisphere lateralization for face proces-
sing and left hemisphere lateralization for object processing may
result when face and object stimuli are presented in competition
than in isolation (McCarthy et al., 1997).
Face-specific AP350s were encountered only in the right
hemisphere (Fig. 11D). This was unexpected because Nobre et
al. (Nobre et al., 1994) encountered word-specific P400 sites
bilaterally (five in the right and six in the left hemisphere).
However, in their study P400s were identified by their sensitivity
to semantic priming, not by category specificity. To assess
word-specific P400s using the same criterion used in this study
to define face-specific P350s (i.e. the P400 to words was at least
twice as large as to faces and other stimuli in a screening
experiment, independent of its responsiveness in priming
experiments) we reviewed all recordings made since the Nobre
et al. study. We found 4 right hemisphere and 14 left hemisphere
sites. Thus we reach the surprising conclusion that face-specific
AP350s are lateralized to the right hemisphere, whereas
word-specific P400s are less strongly lateralized (by the current
definition) to the left hemisphere. This difference was signi-
ficant (χ2 = 21.2, P < 0.0005) and may be part of the reason for
the superiority of the right and left hemisphere in processing
information about faces and words respectively (Young, 1988).
Relevance to Prosopagnosia
These ERP results are pertinent to the difficult question of the
neuroanatomical correlates of prosopagnosia. Damasio et al.
(Damasio et al., 1990) distinguish between ‘apperceptive’,
‘associative’ and ‘amnesic associative’ types of prosopagnosia.
In their view apperceptive prosopagnosia is due to right
hemisphere damage involving both ventral and lateral occipito-
temporal cortex; in our terminology both the right ventral and
lateral face areas would be involved. Prosopagnosia of the
associative type is thought to be due to bilateral damage to
ventral occipitotemporal cortex; in our terminology both ventral
face areas would be involved. Prosopagnosia of the amnesic
associative type is thought to be due to damage to the anterior
temporal lobe; in our terminology the anterior face area would
be involved. Perhaps prosopagnosia of the amnesic type could
also be produced by lesions that disconnected the ventral and
anterior face areas. Prosopagnosic patient 2 of Clarke et al.
(Clarke et al., 1997) might be an example of such a case,
although the lesion also involved part of the anterior face area.
Damasio et al. (Damasio et al., 1990) concluded that the
associative types of prosopagnosia require bilateral lesions,
although this conclusion is controversial (De Renzi et al., 1994;
Landis et al., 1986; Sergent and Villemure, 1989). If the anterior
face area is as highly lateralized as our results suggest, damage to
the right anterior face area alone might be sufficient to produce
an amnesic associative prosopagnosia. Tranel et al. (Tranel et
al., 1997a) found that brain-damaged patients with defective
recognition of famous faces had right hemisphere lesions that
maximally involved the right anterior ventral temporal pole. This
region appears to be coextensive with the anterior face area.
Furthermore, these regions are roughly coextensive with
anterior ventromedial temporal (aVMT) cortex, which has been
implicated in object recognition and memory in monkeys and
humans [reviewed by Nakamura and Kubota (Nakamura and
Kubota, 1996)]. Thus converging lines of evidence implicate
aVMT cortex, particularly in the right hemisphere, in the
retrieval of knowledge about faces and other objects.
Most prosopagnosics can recognize facial expressions despite
their inability to recognize familiar faces (Sergent and Villemure,
1989). Conversely, patients with right hemisphere lesions who
are deficient in discriminating facial expressions are not neces-
sarily prosopagnosic (Humphreys et al., 1993). Thus Bruce and
Young (Bruce and Young, 1986) proposed parallel systems for
recognition of facial identity and facial expression. Our results
also suggest parallel pathways to the ventral and lateral face
areas, which may be involved preferentially in recognition of
face identity and expression, respectively. P150 was significantly
earlier (P < 0.02), and N200 latency marginally earlier (P = 0.11),
in the lateral face area than in the ventral face area, hence the
assumption of a serial pathway from the ventral to the lateral face
area is not tenable. Lateral face-specific N200 and LP350 may
ref lect activity in the ‘expression analysis’ and ‘facial speech
analysis’ stages of face processing in the model of Bruce and
Young (Bruce and Young, 1986).
Conclusions
This paper has described some of the complex neuronal events
that occur in human visual cortex following the onset of
complex visual stimuli. Initial activation of striate and peristriate
cortex is followed by category-specific processing, detected by
the presence of a surface-negative field potential with a peak
latency of ∼200 ms (N200). Three types of category-specific
processing can be inferred that deal with faces, objects and
letter-strings. Face processing, the focus of this study, is complex
and is ref lected by at least four types of ERPs (N200, P290, N700
and P350). The earliest face-specific activity is bilateral and
appears to perform the same neuronal operations in both hemi-
spheres, whereas one later type of activity (AP350) was recorded
only from the right hemisphere. The description of these ERPs
sets the stage for the additional studies of their response
properties described in the following two papers.
NotesWe thank F. Favorini, J. Jasiorkowski, M. Jensen, M. Luby and K. McCarthy
for assistance, and Dr A.C. Nobre for her collaboration in the early
portion of these studies. We also thank three anonymous reviewers for
their helpful criticism of earlier versions of these papers. We are grateful
to Dr S.S. Spencer and the staff of the Yale Epilepsy Surgery Program for
their cooperation in the recordings described here. This work was
supported by the Veterans Administration and by NIMH grant MH-05286.
Address correspondence to Gregory McCarthy, Brain Imaging and
Analysis Center, Box 3808, Duke University Medical Center, Durham, NC
27710, USA. Email: [email protected].
ReferencesAllison T, Wood CC, Goff WR (1983) Brain stem auditory, pattern-reversal
visual, and short-latency somatosensory evoked potentials: latencies
in relation to age, sex, and brain and body size. Electroenceph Clin
Neurophysiol 55:619–636.
Allison T, McCarthy G, Wood CC, Williamson PD, Spencer DD (1989)
Human cortical potentials evoked by stimulation of the median nerve.
II. Cytoarchitectonic areas generating long-latency activity. J
Neurophysiol 62:711–722.
Allison T, McCarthy G, Wood CC, Jones SJ (1991) Potentials evoked in
human and monkey cerebral cortex by stimulation of the median
nerve: a review of scalp and intracranial recordings. Brain
114:2465–2503.
Allison T, Ginter H, McCarthy G, Nobre A, Puce A, Luby M, Spencer DD
(1994a) Face recognition in human extrastriate cortex. J Neurophysiol
71:821–825.
Allison T, McCarthy G, Belger, A, Puce A, Luby M, Spencer DD, Bentin S
428 Human Face Perception I • Allison et al.

(1994b) What is a face? Electrophysiological responsiveness of human
extrastriate visual cortex to human faces. Soc Neurosci Abstr 20:316.
Allison T, McCarthy G, Nobre A, Puce A, Belger, A (1994c) Human
extrastriate visual cortex and the perception of faces, words,
numbers, and colors. Cereb Cortex 5:544–554.
Allison T, Lieberman D, McCarthy G (1996a) Here’s not looking at you
kid: an electrophysiological study of a region of human extrastriate
cortex sensitive to head and eye aversion. Soc Neurosci Abstr 22:400.
Allison T, Puce A, Nobre A, Spencer D, McCarthy G (1996b) Electro-
physiological evidence for anatomical segregation of regions of
extrastriate visual cortex responsive to faces, letterstrings, and colors.
NeuroImage 3:S263.
Baylis GC, Rolls ET, Leonard CM (1985) Selectivity between faces in the
response of a population of neurons in the cortex in the superior
temporal sulcus of the monkey. Brain Res 342:91–102.
Bentin S, Allison T, Puce A, Perez A, McCarthy G (1996) Electro-
physiological studies of face perception in humans. J Cogn Neurosci
8:551–565.
Benton AL, Hamsher KS, Varney NR, Spreen O (1983) Contributions to
neuropsychological assessment. New York: Oxford University Press.
Bodamer J (1947) Die Prosop-Agnosie. Arch Psychiat Nervenkr 179:6–54.
Bruce V, Young A (1986) Understanding face recognition. Br J Psychol
77:305–327.
Caramazza A, Shelton JR (1998) Domain-specific knowledge systems in
the brain: the animate–inanimate distinction. J Cogn Neurosci
10:1–34.
Carey S, Diamond R (1994) Are faces perceived as configurations more by
adults than by children? Vis Cogn 1:253–274.
Clark DL, Rosner BS (1973) Neurophysiologic effects of general anes-
thetics: I. The electroencephalogram and sensory evoked responses.
Anesthesiology 38:564–582.
Clark VP, Keil K, Maisog JM, Courtney S, Ungerleider LG, Haxby JV (1996)
Functional magnetic resonance imaging of human visual cortex
during face matching: a comparison with positron emission
tomography. NeuroImage 4:1–15.
Clarke S, Lindemann A, Maeder P, Borraut F-X, Assal G (1997) Face
recognition and posterio-inferior hemispheric lesions. Neuro-
psychologia 35:1555–1563.
Damasio AR, Damasio H, Van Hoesen GW (1982) Prosopagnosia:
anatomic basis and behavioral mechanisms. Neurology 32:331–341.
Damasio AR, Tranel D, Damasio H (1990) Face agnosia and the neural
substrates of memory. Annu Rev Neurosci 13:89–109.
De Renzi E, Perani D, Carlesimo, GA, Silveri MC, Fazio F (1994)
Prosopagnosia can be associated with damage confined to the right
hemisphere — an MRI and PET study and a review of the literature.
Neuropsychologia 32:893–902.
De Yoe EA, Carman GJ, Bandettini P, Glickman S, Wieser J, Cox R, Miller
D, Neitz J (1996) Mapping striate and extrastriate visual areas in
human cerebral cortex. Proc Natl Acad Sci USA 93:2382–2386.
Desimone R (1991) Face-selective cells in the temporal cortex of
monkeys. J Cogn Neurosci 3:1–8.
Desimone R, Schein SJ (1987) Visual properties of neurons in area V4
of the macaque: sensitivity to stimulus form. J Neurophysiol 57:
835–868.
Desimone R, Albright, TD, Gross CG, Bruce C (1984) Stimulus-selective
properties of inferior temporal neurons in the macaque. J Neurosci
4:2051–2062.
Donchin E, Coles MGH (1988) Is the P300 component a manifestation of
context updating? Behav Brain Sci 11:357–374.
Duvernoy H (1991) The human brain. New York: Springer-Verlag.
Duysens J, Schaafsma SJ, Orban GA (1996) Cortical off response tuning
for stimulus duration. Vis Res 36:3243–3251.
Ellis AW, Young AW (1988) Human cognitive neuropsychology. Hillsdale,
NJ: Lawrence Erlbaum.
Engel SA, Glover GH, Wandell BA (1997) Retinotopic organization in
human visual cortex and the spatial precision of functional MRI.
Cereb Cortex 7:181–192.
Farah MJ (1990) Visual agnosia. Cambridge, MA: MIT Press.
Farah MJ, McMullen PA, Meyer MM (1991) Can recognition of living
things be selectively impaired? Neuropsychologia 29:185–193.
Gallant JL, Braun J, Van Essen DC (1993) Selectivity for polar, hyper-
bolic, and cartesian gratings in macaque visual cortex. Science
259:100–103.
George N, Evans J, Fiori N, Davidoff J, Renault B (1996) Brain events
related to normal and moderately scrambled faces. Cogn Brain Res
4:65–76.
Ghose GM, Ts’o DY (1997) Form processing modules in primate area V4.
J Neurophysiol 77:2191–2196.
Gross CG (1992) Representation of visual stimuli in inferior temporal
cortex. Phil Trans R Soc Lond B 335:3–10.
Grüsser OJ, Kirchhoff N, Naumann A (1990) Brain mechanisms for
recognition of faces, facial expression, and gestures: Neuro-
psychological and electroencephalographic studies in normals,
brain-lesioned patients, and schizophrenics. In: Vision and the brain
(Cohen B, Bodis-Wollner I, eds), pp. 165–193. New York: Raven Press.
Halgren E, Dale AM, Sereno MI, Tootell RBH, Marinkovic K, Rosen BR
(1999) Location of human face-selective cortex with respect to
retinotopic areas. Hum Brain Map 7:29–37.
Haxby JV, Ungerleider LG, Horwitz B, Rapoport SI, Grady CL (1995)
Hemispheric differences in neural systems for face working memory:
a PET–rCBF study. Hum Brain Map 3:68–82.
Hecaen H, Angelergues R (1962) Agnosia for faces (prosopagnosia). Arch
Neurol 7:24–32.
Horwitz B, Grady CL, Haxby JV, Schapiro MB, Rapoport SI, Ungerleider
LG, Mishkin M (1992) Functional associations among human posterior
extrastriate brain regions during object and spatial vision. J Cogn
Neurosci 4:311–322.
Hubel DH, Wiesel TN (1959) Receptive fields of single neurones in the
cat’s striate cortex. J Physiol 148:574–591.
Humphreys GW, Donnelly N, Riddoch MJ (1993). Expression is computed
separately from facial identity, and it is computed separately for
moving and static faces: Neuropsychological evidence. Neuro-
psychologia 31: 173–181.
Jeffreys DA (1996) Evoked potential studies of face and object processing.
Vis Cogn 3:1–38.
Kanwisher N, McDermott J, Chun MM (1997) The fusiform face area: a
module in human extrastriate cortex specialized for face perception.
J Neurosci 17:4302–4311.
Kriss A, Halliday AM (1980) A comparison of occipital potentials evoked
by pattern onset, offset and reversal by movement. In: Evoked
potentials (Barber C, ed.), pp. 205–212. Baltimore, MD: University
Park Press.
Landis T, Cummings JL, Christen L, Bogen JE, Imhof HG (1986) Are
unilateral right posterior cerebral lesions sufficient to cause proso-
pagnosia? Clinical and radiological findings in six additional patients.
Cortex 22:243–252.
Lang J, Belz J (1981) Form und Maße der Gyri und Sulci an der Facies
Superolateralis und Facies Inferior Hemispherii. J Hirnforsch
22:517–533.
Leonard CM, Rolls ET, Wilson FAW, Baylis GC (1985) Neurons in the
amygdala of the monkey with responses selective for faces. Behav
Brain Res 15:159–176.
Logothetis NK, Sheinberg DL (1996) Visual object recognition. Annu Rev
Neurosci 19:577–621.
Malach R, Reppas JB, Benson RR, Kwong KK, Jiang H, Kennedy WA,
Ledden PJ, Brady TJ, Rosen BR, Tootell RBH (1995) Object-related
activity revealed by functional magnetic resonance imaging in human
occipital cortex. Proc Natl Acad Sci USA 92:8135–8139.
McCarthy G, Wood CC, Williamson PD, Spencer DD (1989) Task-
dependent field potentials in human hippocampal formation. J
Neurosci 9:4253–4268.
McCarthy G, Nobre, A, Bentin S, Spencer DD (1995) Language-related
field potentials in the anterior-medial temporal lobe: I. Intracranial
distribution and neural generators. J Neurosci 15:1080–1089.
McCarthy G, Puce A, Gore JC, Allison T (1997) Face-specific processing
in the human fusiform gyrus. J Cogn Neurosci 9:605–610.
Meadows JC (1974) The anatomical basis of prosopagnosia. J Neurol
Neurosurg Psychiat 37:489–501.
Merigan WH, Maunsell JHR (1993) How parallel are the primate visual
pathways? Annu Rev Neurosci 16:369–402.
Moscovitch M, Scullion D, Christie D (1976) Early versus late stages of
processing and their relation to functional hemispheric asymmetries
in face recognition. J Exp Psychol 2:401–416.
Nakamura K, Kubota K (1996) The primate temporal pole: its putative
role in object recognition and memory. Behav Brain Res 77:53–77.
Newcombe F, Mehta Z, de Haan EHF (1994) Category specificity in visual
recognition. In: The neuropsychology of high-level vision (Farah MJ,
Ratcliff G, eds), pp. 103–132. Hillsdale, NJ: Lawrence Erlbaum.
Cerebral Cortex Jul/Aug 1999, V 9 N 5 429

Nobre AC, Allison T, McCarthy G (1994) Word recognition in the human
inferior temporal lobe. Nature 372:260–263.
Nobre, A, McCarthy G (1995) Language-related field potentials in the
anterior-medial temporal lobe: II. Effects of word type and semantic
priming. J Neurosci 15:1090–1098.
Ó Scalaidhe SP, Wilson FAW, Goldman-Rakic PS (1997) Areal segregation
of face-processing neurons in prefrontal cortex. Science 278:
1135–1138.
Perrett DI, Rolls ET, Caan W (1982) Visual neurones responsive to faces in
the monkey temporal cortex. Exp Brain Res 47:329–342.
Perrett DI, Mistlin AJ, Chitty AJ (1987) Visual neurones responsive to
faces. Trends Neurosci 10:358–364.
Perrett DI, Harries MH, Mistlin AJ, Hietanen JK, Benson PJ, Bevan R,
Thomas S, Oram MW, Ortega J, Brierly K (1990) Social signals
analyzed at the cell level: someone is looking at me, something
touched me, something moved! Int J Comp Psychol 4:25–54.
Puce A, Allison T, Asgari M, Gore JC, McCarthy G (1996) Differential
sensitivity of human visual cortex to faces, letterstrings, and textures:
a functional magnetic resonance imaging study. J Neurosci 16:
5205–5215.
Puce A, Allison, T, Spencer SS, Spencer DD, McCarthy G (1997)
Comparison of cortical activation evoked by faces measured by
intracranial field potentials and functional MRI: two case studies. Hum
Brain Map 5:298–305.
Rentschler I, Treutwein B, Landis T (1994) Dissociation of local and global
processing in visual agnosia. Vis Res 34:963–971.
Rhodes G (1993) Configural coding, expertise, and the right hemisphere
advantage for face recognition. Brain Cogn 22:19–41.
Rolls ET (1992) Neurophysiology and functions of the primate amygdala.
In: The amygdala (Aggleton JP, ed.), pp. 143–165. New York: Wiley.
Schendan HE, Ganis G, Kutas M (1998) Neurophysiological evidence for
visual perceptual categorization of words and faces within 150 ms.
Psychophysiology 35:240–251.
Seeck M, Michel CM, Mainwaring N, Cosgrove R, Blume H, Ives J,
Landis T, Schomer DL (1997) Evidence for rapid face recognition from
human scalp and intracranial electrodes. NeuroReport 8:2749–2754.
Sereno MI, Dale AM, Reppas JB, Kwong KK, Belliveau JW, Brady TJ,
Rosen BR, Tootell RBH (1995) Borders of multiple visual areas in
humans revealed by functional magnetic resonance imaging. Science
268:889–893.
Sergent J (1988) Face perception and the right hemisphere. In: Thought
without language (Weiskrantz L, ed.), pp. 108–131. Oxford: Oxford
University Press.
Sergent J, Villemure JG (1989) Prosopagnosia in a right hemispherect-
omized patient. Brain 112:975–995.
Sergent J, Ohta S, MacDonald B (1992) Functional neuroanatomy of face
and object processing: a positron emission tomography study. Brain
115:15–36.
Sergent J, Ohta S, MacDonald B, Zuck E (1994) Segregated processing of
facial identity and emotion in the human brain: a PET study. Vis Cogn
1:349–369.
Shepherd J (1981) Social factors in face recognition. In: Perceiving and
remembering faces (Davies G, Ellis H, Shepherd J, eds), pp. 55–79.
London: Academic Press.
Spencer SS, Spencer DD, Williamson PD, Mattson RH (1982) The
localizing value of depth electroencephalography in 32 refractory
patients. Ann Neurol 12:248–253.
Talairach J, Tournoux P (1988) Co-planar stereotaxic atlas of the human
brain. New York: Thieme.
Tanaka K (1993) Neuronal mechanisms of object recognition. Science
262:685–688.
Tranel D, Damasio H, Damasio AR (1997a) A neural basis for the retrieval
of conceptual knowledge. Neuropsychologia 35:1319–1327.
Tranel D, Logan CG, Frank RJ, Damasio AR (1997b) Explaining
category-related effects in the retrieval of conceptual and lexical
knowledge for concrete entities: Operationalization and analysis of
factors. Neuropsychologia 35:1329–1339.
Ungerleider LG, Mishkin M (1982) Two cortical visual systems. In:
Analysis of visual behavior (Ingle DJ, Goodale MA, Mansfield RJW,
eds), pp. 549–586. Cambridge, MA: MIT Press.
Van Essen DC, Drury HA (1997) Structural and functional analyses of
human cerebral cortex using a surface-based atlas. J Neurosci
17:7079–7102.
Vermeire BA, Hamilton CR (1998) Effects of facial identity, facial expres-
sion, and subject’s sex on laterality in monkeys. Laterality 3:1–19.
Warrington EK, Shallice T (1984) Category specific semantic impair-
ments. Brain 107:829–854.
Whitely AM, Warrington EK (1977) Prosopagnosia: a clinical, psycho-
logical, and anatomical study of three patients. J Neurol Neurosurg
Psychiat 40: 395–403.
Williamson PD, Thadani VM, Darcey TM, Spencer DD, Spencer SS,
Mattson RH (1992) Occipital lobe epilepsy: clinical characteristics,
seizure spread patterns, and results of surgery. Ann Neurol 31:3–13.
Wilson FAW, Ó Scalaidhe SP, Goldman-Rakic PS (1993) Dissociation of
object and spatial processing domains in primate prefrontal cortex.
Science 260:1955–1958.
Wood CC, Spencer DD, Allison T, McCarthy G, Williamson PD, Goff WR
(1988) Localization of human sensorimotor cortex during surgery by
cortical surface recording of somatosensory evoked potentials. J
Neurosurg 68:99–111.
Young AW (1988) Functional organization of visual recognition. In:
Thought without language (Weiskrantz L, ed.), pp. 78–107. Oxford:
Oxford University Press.
430 Human Face Perception I • Allison et al.