![THE FACTS ABOUT MOLY ppt [Kompatibilitätsmodus]schaefferoil.de/sheets/praesentationen/factmoly_en.pdf · MOLYBDENUM DISULFIDE (Mos 2) The first recorded use of Molybdenum Disulfide](https://static.fdocuments.in/doc/165x107/5a70544d7f8b9a93538be93b/the-facts-about-moly-ppt-kompatibilittsmodusschaefferoildesheetspraesentationenfactmolyenpdfpdf.jpg)
ElectronicSupplementaryInformations* · ! 1!...
13
1 Introduction of disulfide bridges within silica nanoparticles to control their intracellular degradation S. Quignard, S. Masse, G. Laurent and T. Coradin Electronic Supplementary Informations ESI1 : Detailed experimental protocols ESI2 : TEM images of x%SS nanoparticles (scale bar = 100nm) and corresponding size distribution ESI3 (a) { 1 H} 13 C and (b) { 1 H} 29 Si HETCOR ssNMR spectra of 30%SS without APTES ESI4 : Dissolution of x%SS particles at pH 7.4 and 37°C ESI5 : Fluorescence optical imaging of human dermal fibroblast cells after 24 h (left hand column) and 7 days (righthand column) contact with x%SS nanoparticles. WGA AlexaFluor555 and Lysosensor yellowblue were used for red staining of the membrane and blue staining of the endosomes, respectively. Green fluorescence corresponds to FITC. ESI6 : TEM images of x%SS silica nanoparticles after 7 days of contact with HDFa (left hand column scale bar = 1 mm ; right hand column scale bar = 100 nm) ESI7 : TEM images of x%SS silica nanoparticles with HDFa after 7 days of contact followed by washing and further 7 days in culture (left hand column scale bar = 1 mm ; right hand column scale bar = 100 nm) ESI8 : Cytotoxicity of x%SS silica nanoparticles as monitored by the Alamar blue test Electronic Supplementary Material (ESI) for Chemical Communications This journal is © The Royal Society of Chemistry 2013
Transcript of ElectronicSupplementaryInformations* · ! 1!...

1
Introduction of disulfide bridges within silica nanoparticles to control their intra-‐cellular
degradation
S. Quignard, S. Masse, G. Laurent and T. Coradin
Electronic Supplementary Informations
ESI-1 : Detailed experimental protocols
ESI-2 : TEM images of x%SS nanoparticles (scale bar = 100nm) and corresponding size distribution
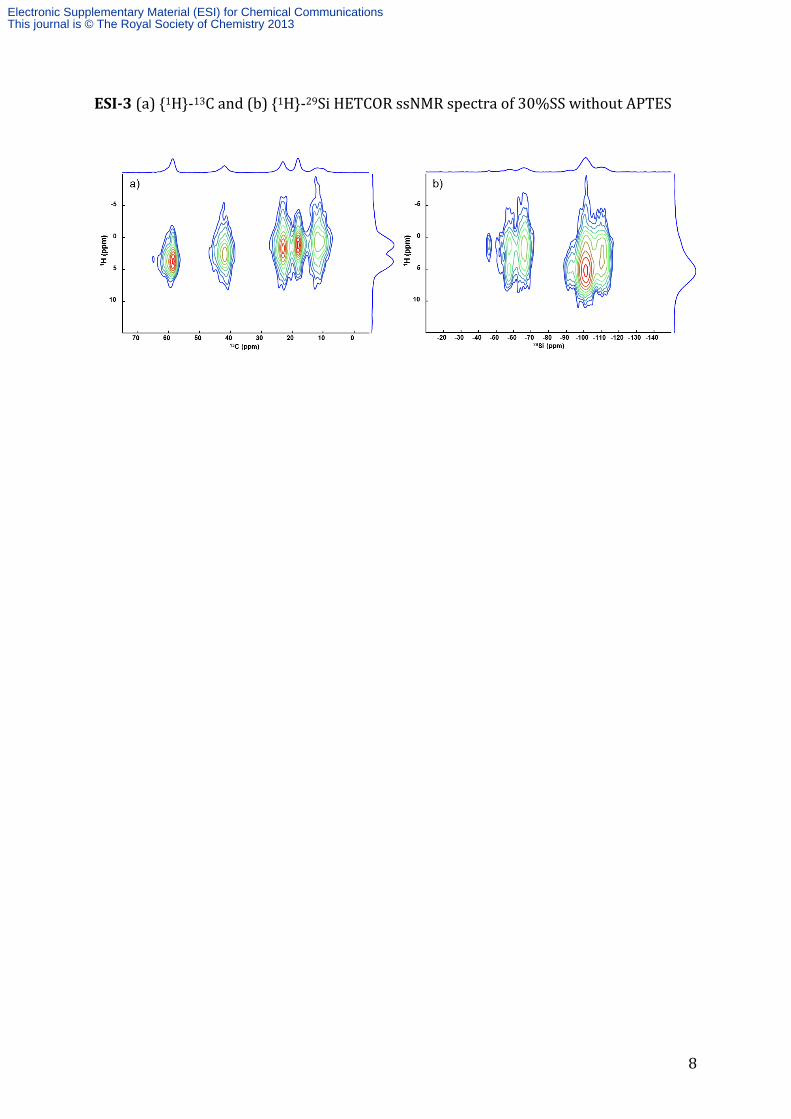
ESI-3 (a) {1H}-‐13C and (b) {1H}-‐29Si HETCOR ssNMR spectra of 30%SS without APTES
ESI-4 : Dissolution of x%SS particles at pH 7.4 and 37°C
ESI-5 : Fluorescence optical imaging of human dermal fibroblast cells after 24 h (left-‐hand column) and 7 days (right-‐hand column) contact with x%SS nanoparticles. WGA-‐AlexaFluor555 and Lysosensor yellow-‐blue were used for red staining of the membrane and blue staining of the endosomes, respectively. Green fluorescence corresponds to FITC.
ESI-6 : TEM images of x%SS silica nanoparticles after 7 days of contact with HDFa (left hand column scale bar = 1 mm ; right hand column scale bar = 100 nm)
ESI-7 : TEM images of x%SS silica nanoparticles with HDFa after 7 days of contact followed by washing and further 7 days in culture (left hand column scale bar = 1 mm ; right hand column scale bar = 100 nm)
ESI-8 : Cytotoxicity of x%SS silica nanoparticles as monitored by the Alamar blue test
Electronic Supplementary Material (ESI) for Chemical CommunicationsThis journal is © The Royal Society of Chemistry 2013
2
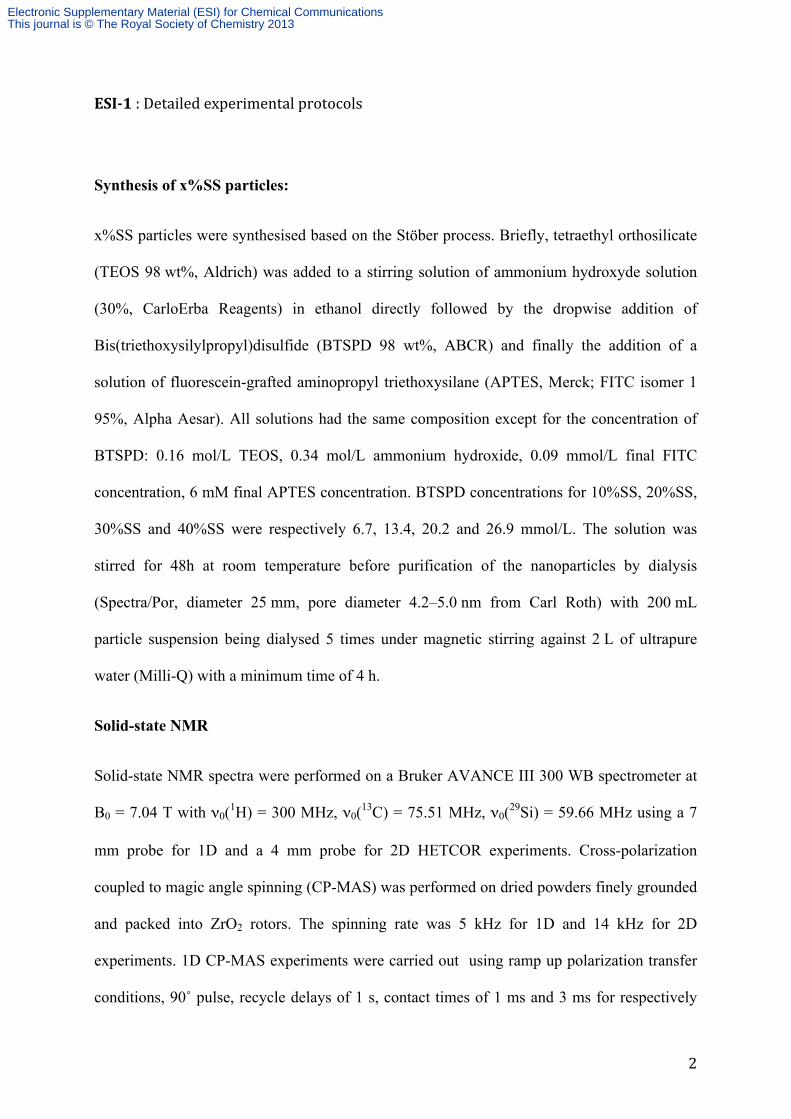
ESI-1 : Detailed experimental protocols
Synthesis of x%SS particles:
x%SS particles were synthesised based on the Stöber process. Briefly, tetraethyl orthosilicate
(TEOS 98 wt%, Aldrich) was added to a stirring solution of ammonium hydroxyde solution
(30%, CarloErba Reagents) in ethanol directly followed by the dropwise addition of
Bis(triethoxysilylpropyl)disulfide (BTSPD 98 wt%, ABCR) and finally the addition of a
solution of fluorescein-grafted aminopropyl triethoxysilane (APTES, Merck; FITC isomer 1
95%, Alpha Aesar). All solutions had the same composition except for the concentration of
BTSPD: 0.16 mol/L TEOS, 0.34 mol/L ammonium hydroxide, 0.09 mmol/L final FITC
concentration, 6 mM final APTES concentration. BTSPD concentrations for 10%SS, 20%SS,
30%SS and 40%SS were respectively 6.7, 13.4, 20.2 and 26.9 mmol/L. The solution was
stirred for 48h at room temperature before purification of the nanoparticles by dialysis
(Spectra/Por, diameter 25 mm, pore diameter 4.2–5.0 nm from Carl Roth) with 200 mL
particle suspension being dialysed 5 times under magnetic stirring against 2 L of ultrapure
water (Milli-Q) with a minimum time of 4 h.
Solid-state NMR
Solid-state NMR spectra were performed on a Bruker AVANCE III 300 WB spectrometer at
B0 = 7.04 T with ν0(1H) = 300 MHz, ν0(13C) = 75.51 MHz, ν0(29Si) = 59.66 MHz using a 7
mm probe for 1D and a 4 mm probe for 2D HETCOR experiments. Cross-polarization
coupled to magic angle spinning (CP-MAS) was performed on dried powders finely grounded
and packed into ZrO2 rotors. The spinning rate was 5 kHz for 1D and 14 kHz for 2D
experiments. 1D CP-MAS experiments were carried out using ramp up polarization transfer
conditions, 90˚ pulse, recycle delays of 1 s, contact times of 1 ms and 3 ms for respectively
Electronic Supplementary Material (ESI) for Chemical CommunicationsThis journal is © The Royal Society of Chemistry 2013

3
{1H}-13C CP-MAS and {1H}-29Si CP-MAS experiments, recording 4.096 scans. 2D
HETCOR-MAS experiments were carried out using tangent ramp polarization transfer
conditions, recycle delays of 1 s, spectral width of 14 kHz, contact times of 1 ms and 3 ms for
respectively {1H}-13C HETCOR and {1H}-29Si HETCOR experiments, recording 32 slices (f1
dimension) and 1.680 scans for {1H}-13C HETCOR and 6.800 scans for {1H}-29Si HETCOR
experiments. For both 1D and 2D experiments, a line broadening of 30 Hz was applied for
{1H}-13C and 50 Hz for {1H}-29Si experiments using an exponential apodization function on
the f2 dimension. For 2D experiments, a cosine apodization function was applied on the f1
dimension.
Refocused {1H}-29Si INEPT sequence (Insensitive Nuclei Enhanced by Polarization Transfer)
was carried out using a 4 mm probe heated at 353 K, spinning at 8 kHz, with a recycling
delay of 2 s, recording 72.240 scans and using 10 ms for both evolution and refocalisation
delays. A line broadening of 10 Hz was applied.
Dissolution and reduction by DTT
Dissolution of x%SS particles was assessed at pH 7.4 in Tris-HCl buffer (50 mM with 10 mM
KCl) and at pH 4.5 in acetate buffer (50 mM with 10 mM KCl) with the silicomolybdate
method as described in [13].
Reduction of the disulfide by dithiothreitol (DTT) was monitored by UV-visible spectroscopy
through the absorbance at 290 nm of the cyclic compound resulting from the oxidation of
DTT. x%SS particles were suspended in Tris-HCl buffer pH 7.4 at 0.6 mg/mL and dioxygen
was removed by flowing nitrogen in the solution for 5 minutes and thus avoid oxidation of
DTT by oxygen. Subsequently, DTT solution in phosphate buffer (0.2 M) was added to obtain
Electronic Supplementary Material (ESI) for Chemical CommunicationsThis journal is © The Royal Society of Chemistry 2013

4
a final concentration of 1.3 mM and the solution was kept at 37˚C in oxygen-free atmosphere.
At determined times, 1 mL solution was removed, centrifuged 15 minutes at 6,000 rpm and
absorbance at 290 nm was recorded.
Cells and treatments with nanoparticles
Normal human dermal fibroblasts (from Promocell) were grown in Dulbecco's Modified
Eagle Culture Medium (DMEM, Gibco BRL) supplemented with fetal Calf Serum (10%,
from Gibco BRL), penicillin (100 units mL−1), streptomycin (100 µg mL−1, from Gibco BRL)
and fungizone (0.25 µg mL−1, from Gibco BRL). The culture flasks (75 cm2) were kept at
37 °C in 95% humidity and 5% CO2 atmosphere. At confluence, fibroblasts were removed
from cultured flasks by treatment with 0.1% trypsin and 0.02% EDTA. Cells were rinced and
resuspended in the supplemented DMEM media. Fibroblasts were used at passage 7-8 for the
experiments.
Uptake of silica nanoparticles was determined by fluorescence spectroscopy and TEM. The
cells were seeded at a density of 30,000 cells per well in 24-well plate with round glass
coverslips at the bottom of the wells. The cells were kept 24h with culture medium at 37 °C in
95% humidity and 5% CO2 atmosphere previous to incubation with 0.6 mg mL−1 of x%SS
nanoparticles for different times (from 4 hours to 14 days) with replacement of the
supernatant by fresh medium on day 7.
Nanoparticle internalization
For fluorescence microscopy, coverslips with the cells were removed at determined intervals
of time, washed three times with PBS 1X, and fixed with 4% paraformaldehyde (1 h, 4 °C).
Staining of the membranes with wheat germ agglutinin Alexa Fluor 555 conjugate
(Invitrogen) and the endosomes with Blue/Yellow Lysosensor (Invitrogen) were used to
Electronic Supplementary Material (ESI) for Chemical CommunicationsThis journal is © The Royal Society of Chemistry 2013

5
investigate the internalization and location of the nanoparticles within the cells. Briefly, the
coverslips were incubated 15 min at room temperature with Lysosensor, rinsed with HBSS
1X and then incubated for 10 min with the other marker before observation under a
fluorescent microscope (Axio 100, Carl Zeiss).
For TEM, cells were fixed at determined intervals of time using 3.63% glutaraldehyde in
0.05 M sodium cacodylate buffer with 0.3 M saccharose for 1 h at 4 °C. Following this
fixation step, samples were washed three times before post-fixing with 2% osmium tetraoxide
for 1 h at 4 °C. After the washing steps, the cells were detached from the culture flasks and
centrifuged. The pellets were dehydrated with an ascending ethanol series ending with
propylene oxide and embedded in araldite. Ultra thin sections were prepared with an Ultracut
ultramicrotome (Reichert, France). Slides were analyzed with a FEI Tecnai electron
microscope operating at 120 kV. Images were obtained for at least 10 cells for each sample.
Exocytosis and intracellular dissolution
To assess the possible exocytosis of internalized particles, cells were exposed to a suspension
of 0.6 mg mL−1 nanoparticles for 7 days in culture medium as described for the uptake
experiments. Culture medium was then removed and cells rinsed before adding fresh medium.
The fluorescence intensity of medium was analyzed both directly and after centrifugation in a
Nanosep® 3kD centrifugal device to remove particles and have access to the proportion of
released FITC over time. As a reference, a suspension of 0.6 mg/mL nanoparticles in culture
medium was kept at 37 °C under mechanical stirring. All experiments were performed in
triplicate.
Toxicological assay
Electronic Supplementary Material (ESI) for Chemical CommunicationsThis journal is © The Royal Society of Chemistry 2013

6
Cellular activity of cells in 24-well plate was evaluated with Alamar Blue assay (n = 6). Cells
were rinced with medium and incubated, at 37 °C in a humidified 5% CO2 air atmosphere, for
4 h with a 10% solution of alamar blue in phenol red-free culture medium. Absorbance of the
medium at 570 nm and 600 nm was recorded with a UV–visible spectrometer and cellular
activity was calculated. Incubation of the particles with Alamar Blue gave negligible
absorbance values.
Electronic Supplementary Material (ESI) for Chemical CommunicationsThis journal is © The Royal Society of Chemistry 2013

7
ESI-2 : TEM images of x%SS nanoparticles (scale bar = 100nm) and corresponding size distribution
Electronic Supplementary Material (ESI) for Chemical CommunicationsThis journal is © The Royal Society of Chemistry 2013
8
ESI-3 (a) {1H}-‐13C and (b) {1H}-‐29Si HETCOR ssNMR spectra of 30%SS without APTES
Electronic Supplementary Material (ESI) for Chemical CommunicationsThis journal is © The Royal Society of Chemistry 2013
9
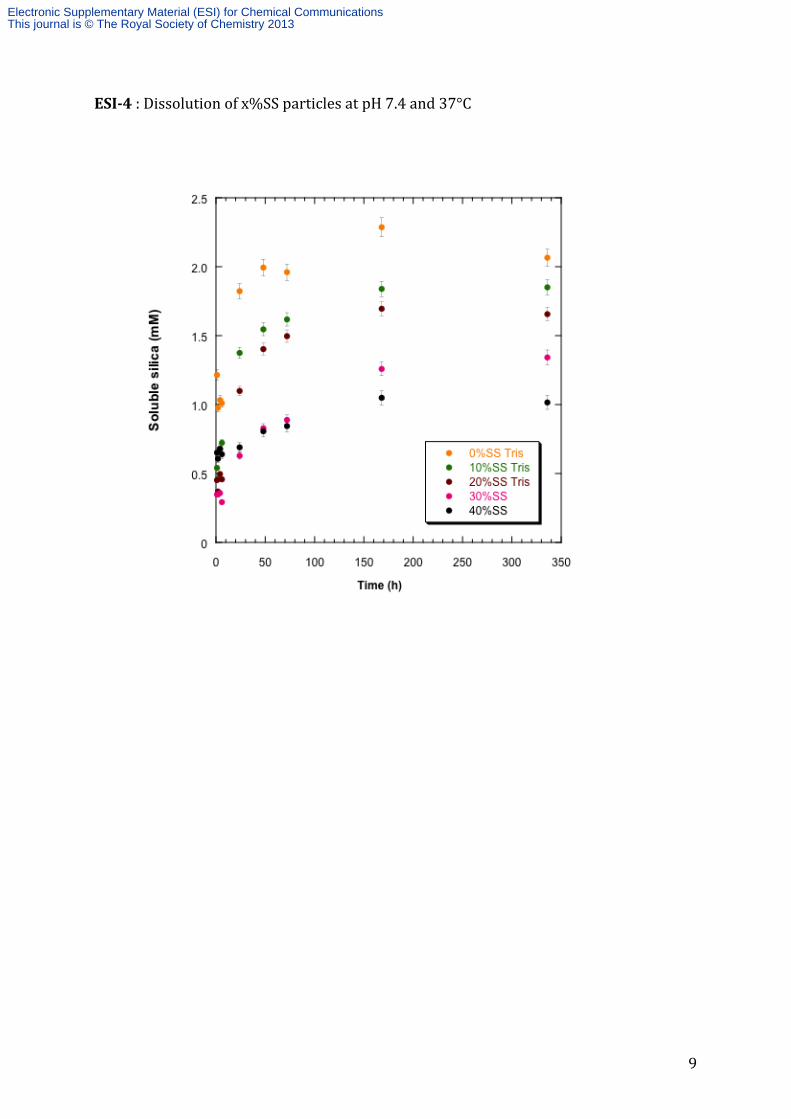
ESI-4 : Dissolution of x%SS particles at pH 7.4 and 37°C
Electronic Supplementary Material (ESI) for Chemical CommunicationsThis journal is © The Royal Society of Chemistry 2013

10
ESI-5 : Fluorescence optical imaging of human dermal fibroblast cells after 24 h (left-hand column) and 7 days (right-hand column) contact with x%SS nanoparticles. WGA-AlexaFluor555 and Lysosensor yellow-blue were used for red staining of the membrane and blue staining of the endosomes, respectively. Green fluorescence corresponds to FITC.
Electronic Supplementary Material (ESI) for Chemical CommunicationsThis journal is © The Royal Society of Chemistry 2013

11
ESI-6 : TEM images of x%SS silica nanoparticles after 7 days of contact with HDFa (left hand column scale bar = 1 µm ; right hand column scale bar = 100 nm)
Electronic Supplementary Material (ESI) for Chemical CommunicationsThis journal is © The Royal Society of Chemistry 2013

12
ESI-7 : TEM images of x%SS silica nanoparticles with HDFa after 7 days of contact followed by washing and further 7 days in culture (left hand column scale bar = 1 µm ; right hand column scale bar = 100 nm)
Electronic Supplementary Material (ESI) for Chemical CommunicationsThis journal is © The Royal Society of Chemistry 2013

13
ESI-8 : Cytotoxicity of x%SS silica nanoparticles as monitored by the Alamar blue test
Electronic Supplementary Material (ESI) for Chemical CommunicationsThis journal is © The Royal Society of Chemistry 2013