Electronics Imaging System for the Synchrotron...
53
Electronics Imaging System for the Synchrotron Light Source Walter Y. Mok [email protected] Alan Fisher, Weixing Chen, Jeff Corbett
Transcript of Electronics Imaging System for the Synchrotron...

Electronics Imaging System for
the Synchrotron Light Source
Walter Y. Mok
Alan Fisher, Weixing Chen, Jeff Corbett
PI-MAX Data Acquisition
• Major components of the Intensified-CCD
• PI-Max Data Acquisition system
• Operation of PI-Max Data Acquisition
system
• Application in synchrotron light imaging.
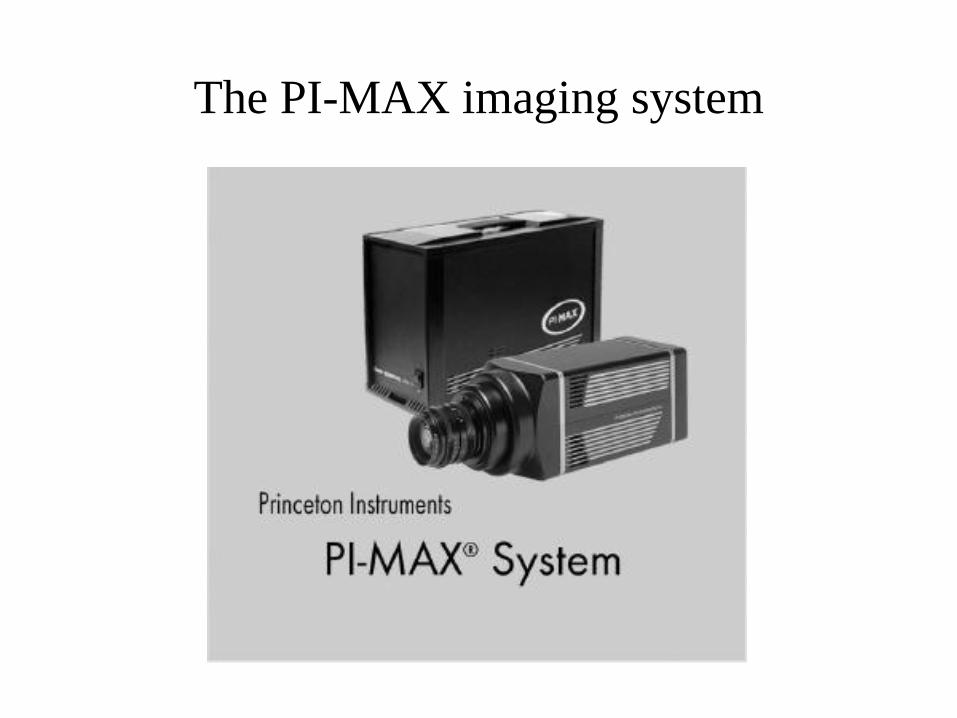
The PI-MAX imaging system

ICCD camera

The image intensifier
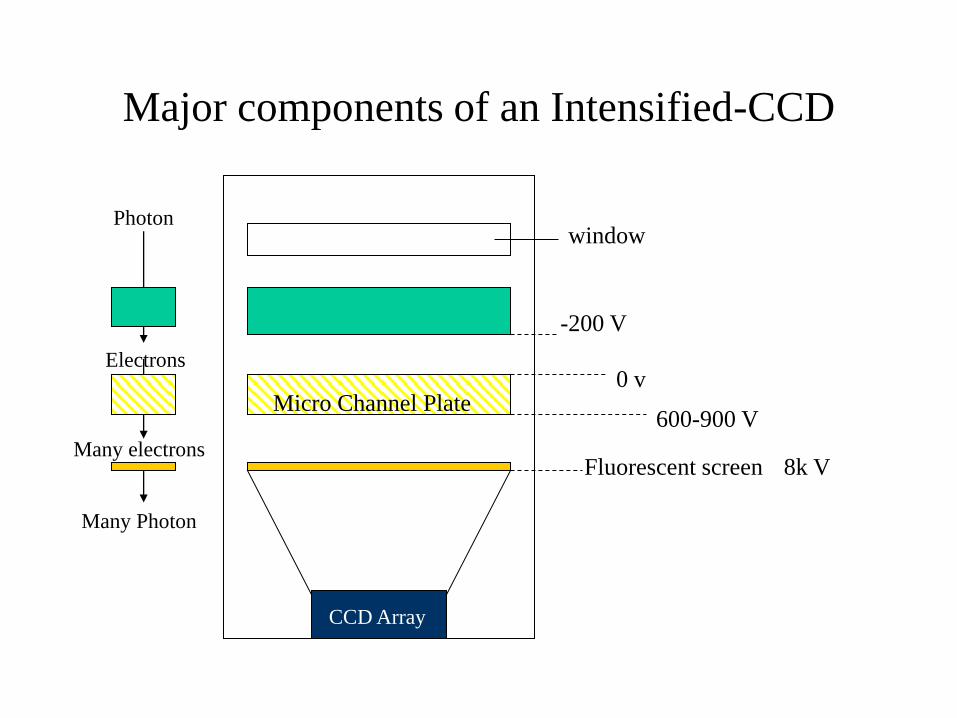
Major components of an Intensified-CCD
Fluorescent screen
Photo-cathode
Micro Channel Plate
CCD Array
-200 V
0 v
600-900 V
8k V
windowPhoton
Many Photon
Electrons
Many electrons

Voltage Bias of
An Intensifier-CCD
-200 v0 v
600-900 v
8 kV
Photo-
Cathode
MCP
Phosphor
Fiber
BundleCCD
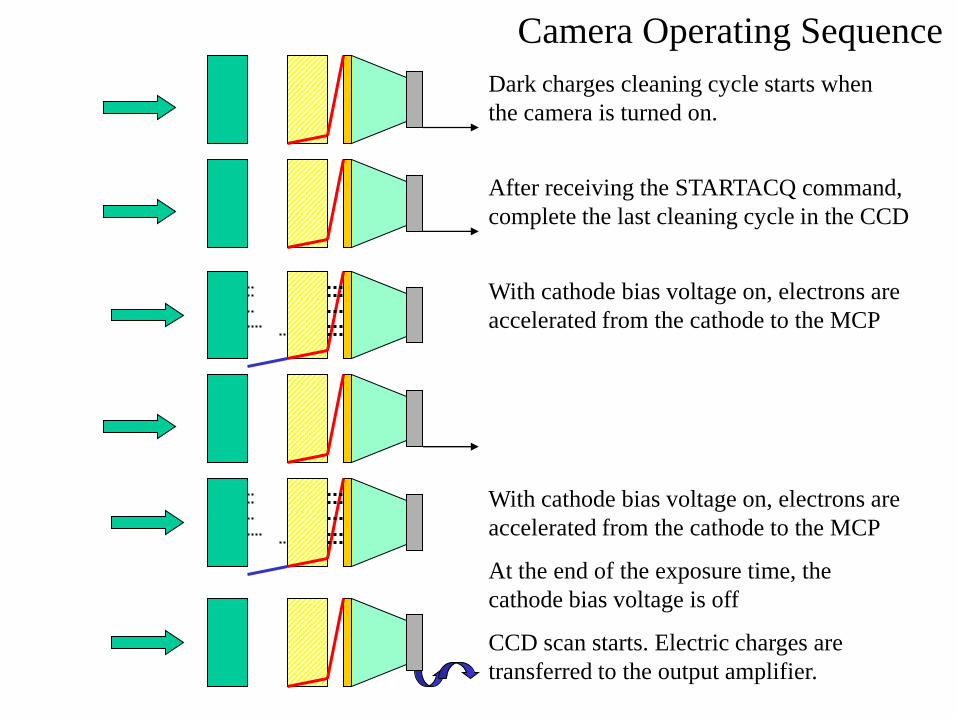
Camera Operating Sequence
Dark charges cleaning cycle starts when
the camera is turned on.
After receiving the STARTACQ command,
complete the last cleaning cycle in the CCD
With cathode bias voltage on, electrons are
accelerated from the cathode to the MCP
At the end of the exposure time, the
cathode bias voltage is off
CCD scan starts. Electric charges are
transferred to the output amplifier.
With cathode bias voltage on, electrons are
accelerated from the cathode to the MCP

Different mode of operation of the camera by
controlling the cathode and MCP bias
Mode of
operation
Cathode
bias
MCP Read out
Safe off on Continuously
free running
Shutter On/off on At the end of
the exposure
time
Gate On/off on After the last
gate pulse
Pre-pulse On/off On/off

Shutter Mode

GATE mode

Shutter
Mode
Gate Mode
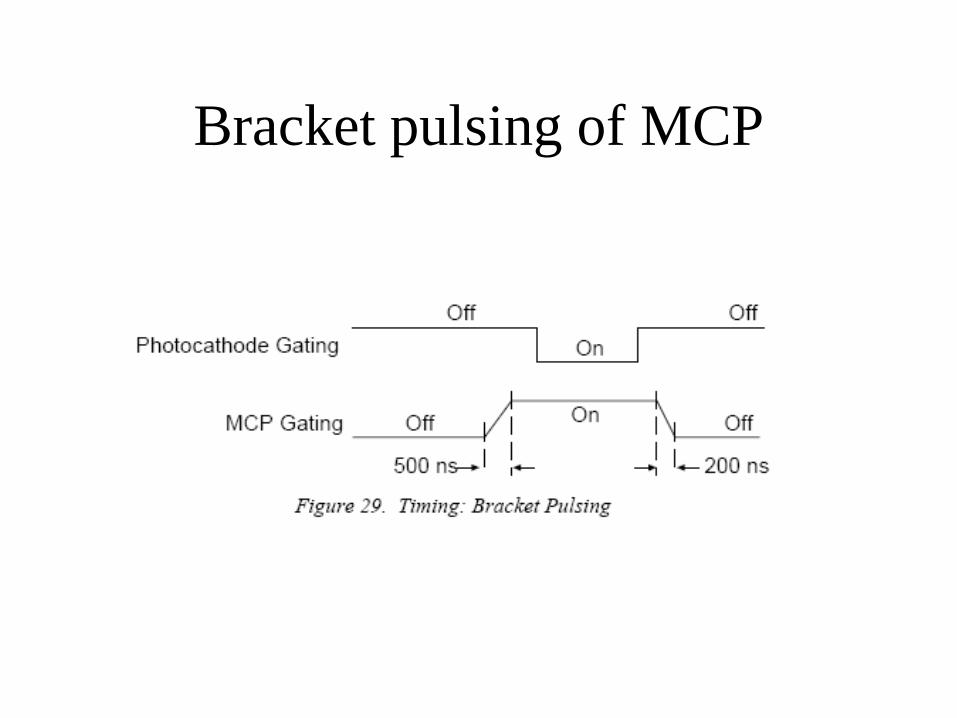
Bracket pulsing of MCP

Interface the camera controller
with the outside world
• Input to the PI-MAX camera –
External events initiate the PI-MAX operation
• Output from the PI-MAX camera to
synchronize external events –
PI-MAX initiates the external event
• Connecting the PI-MAX

Input to the PI-MAX camera
• Start the PI-MAX camera operation
• The cathode bias voltage…..[ Ext. trigger in ]
• The charges read out… [Ext. Syn. In ]
• The bias of MCP with a bracket pulse.. [Pre
Trigger in ]

Ext. Trigger
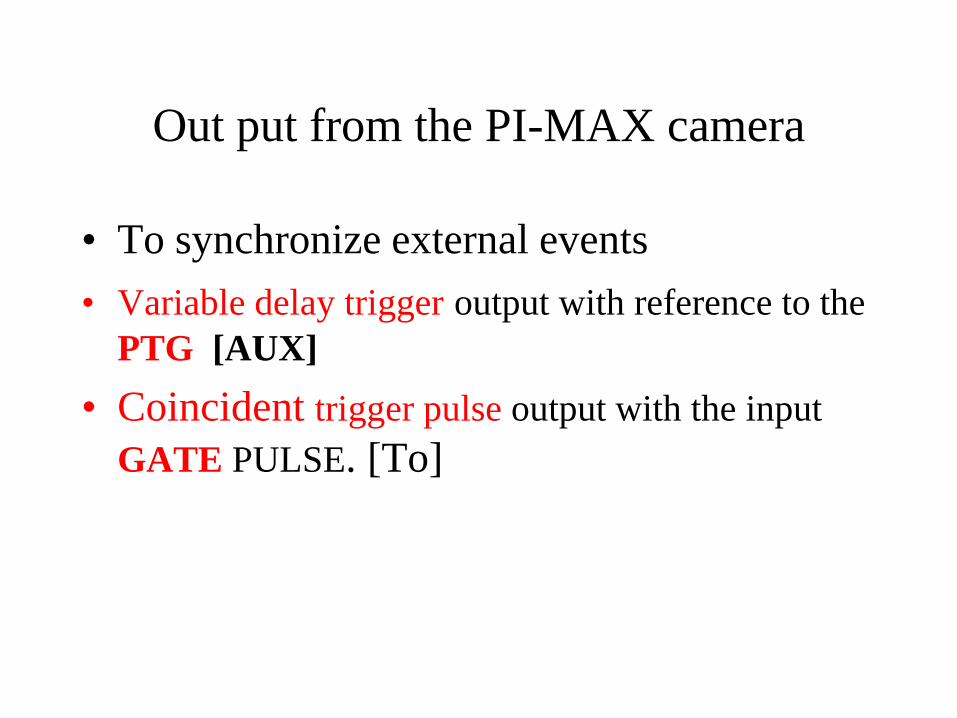
Out put from the PI-MAX camera
• To synchronize external events
• Variable delay trigger output with reference to the
PTG [AUX]
• Coincident trigger pulse output with the input
GATE PULSE. [To]

TO
AUX TRIG
OUT

Connecting the PI-MAX
• Timing Cable [ 9 pin connector]
• Communicating with the computer [serial
com, 9 pin connector ]
• Data transfer + bias +control [32 pin
connector]


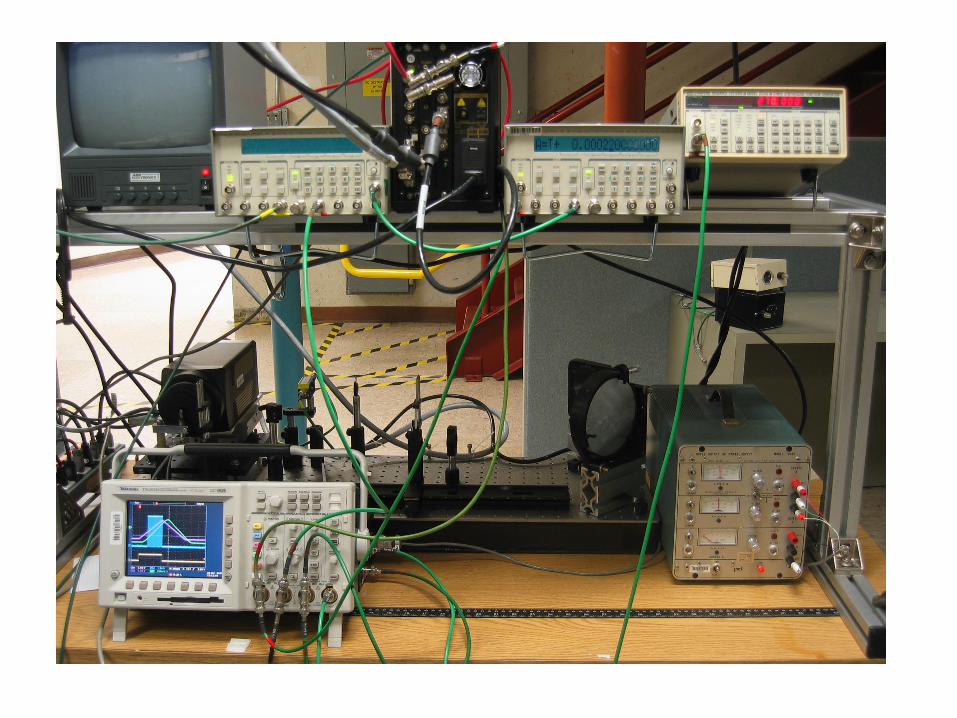
Simulating the synchrotron light
imaging experiment
Objective: Imaging light pulse from the same bucket
after a number of turns
• It takes about 1 micro-second for the bunch
to circulate the orbit once. We see the light
pulses separated by an interval of 1
microsecond.
• We want to look at the light from the bucket
after a number of turns.

Turn 1 2 3 4 5th
Rotating
Mirror
Cathode bias on
SPEAR 3
1 2 3 4 5th turn
Operation
Principles

Some design considerations on imaging synchrotron light
Synchrotron Light Characteristics
• Pulse width = 5- 30 pico second.
• Pulse to pulse separation = approx. 2-3 nano-sec.
• Cycle time = 1 micro-sec.
Design consideration of the scanning system
• In order to capture a single shot of the light with minimum
smear, the gate width << pulse separation.
• The temporal separation between gate pulses is long
enough so that the images on the sensor do not overlap.

To trigger inhibit, no trigger after
400 micro seconds
The cathode is triggered at a rate of 1 Mega Hertz
for 80 x 5 micro-seconds to capture 80 pulses
Pulsed LED to simulate
SL , 1 pulse / 5 sec.
Look at the same bucket
at every fifth round
5μs
5μs
80 pulses
Gate
on
Gate off
–read
out data
1μs
Synchrotron Light
400μs

Design considerations for simulating the synchrotron light
imaging with a scanning mirror and ICCD
• Synchrotron light – LED
– Rep rate = 1 mega hertz,
– Pulse width = approx. 15 ns.
• Imaging Sensor gating requirements
– Images of the SL from the same bunch are recorded at a designated
number of turns.
– The images of the SL shots separate from each other
– Ability to take multiple images in each frame
– Read out the data only after each frame is completed
– Ability to accumulate many frames
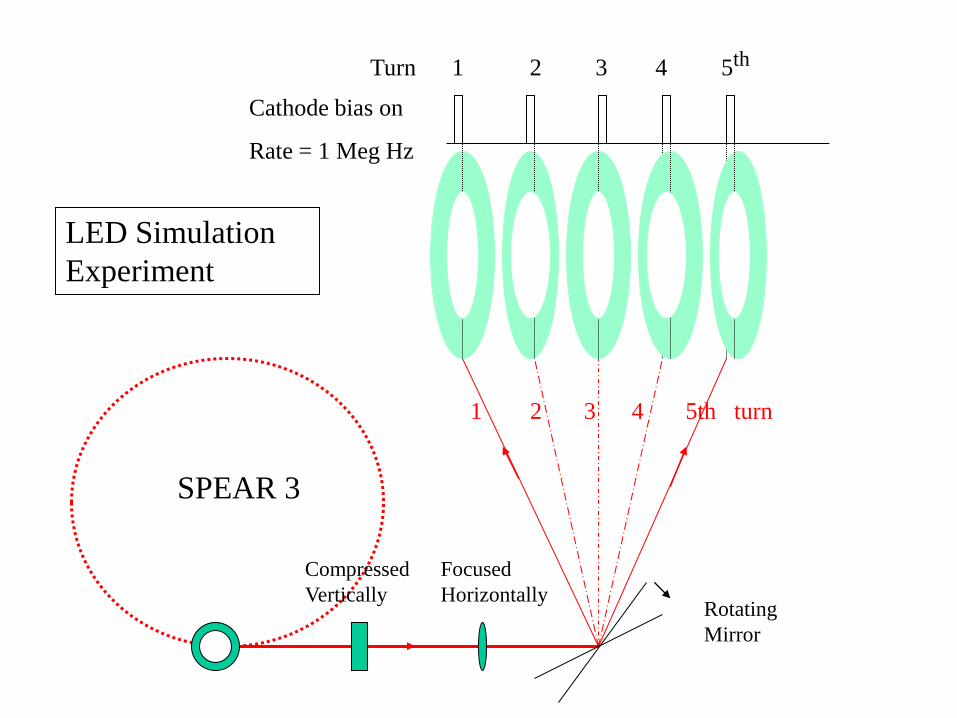
Turn 1 2 3 4 5th
Rotating
Mirror
Cathode bias on
Rate = 1 Meg Hz
SPEAR 3
1 2 3 4 5th turn
LED Simulation
Experiment
Compressed
Vertically
Focused
Horizontally

Would the scanning mirror cause
image smear?
• Question for the class


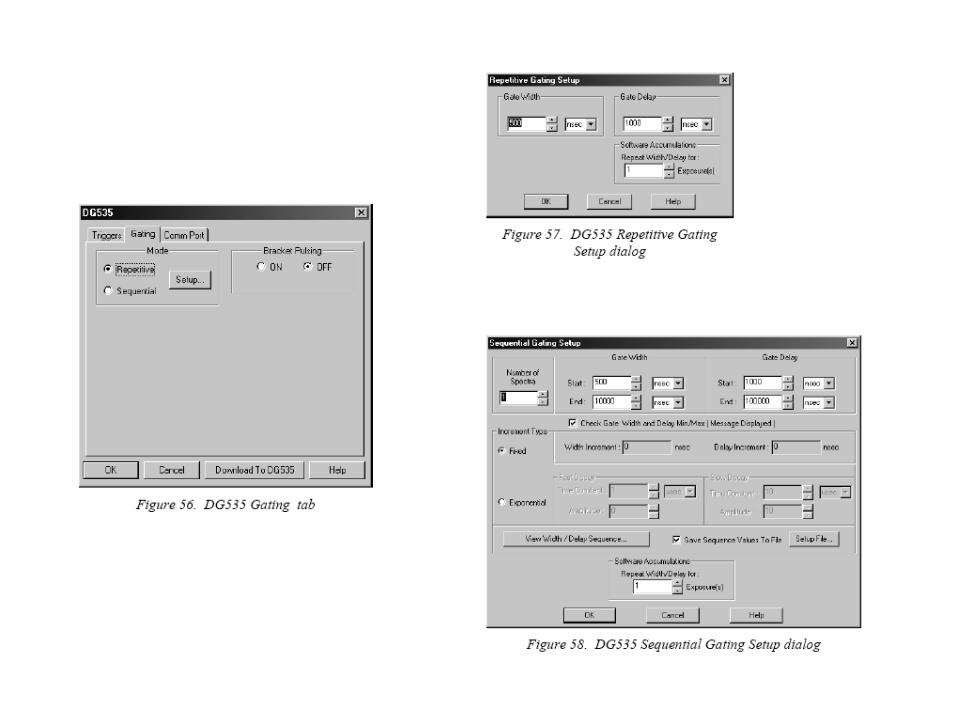
Driver requirements
1 Hz. Pulse
generator DG535
Driver of the
scanner DS345
1 Meg. Hz pulse
generator DG535
Scanner LED PIMAX

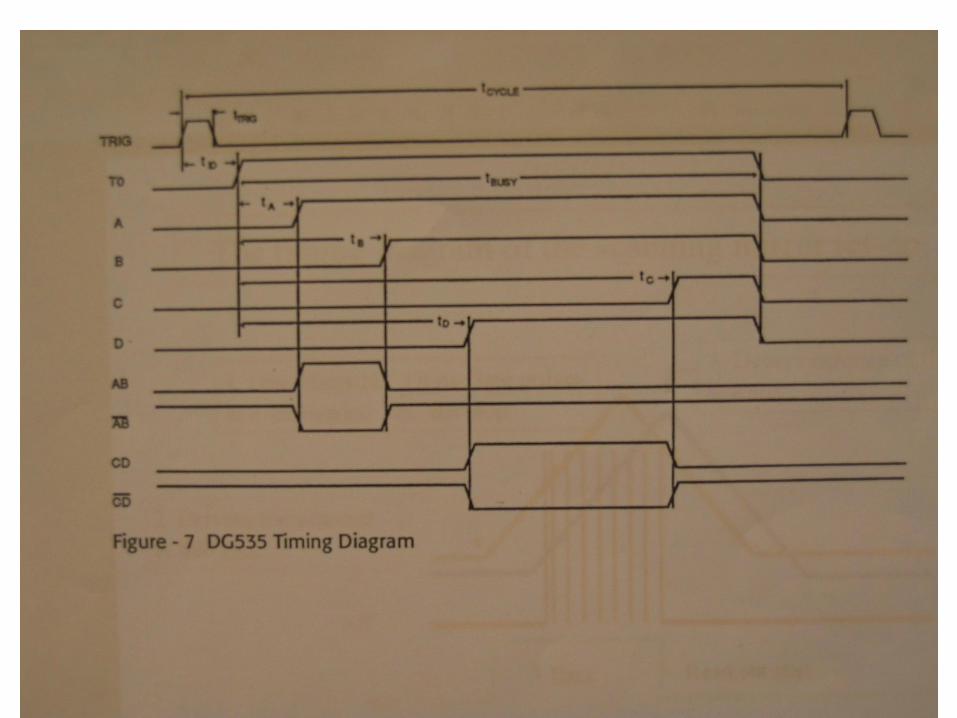


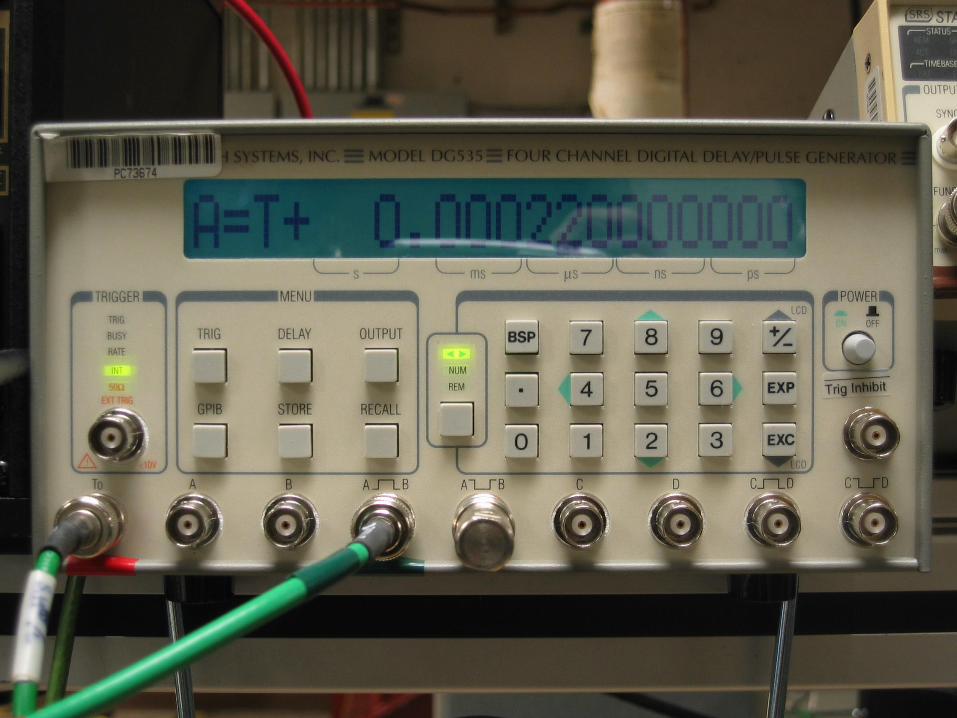

Timing sequence of DS 535
• Repetition rate = 1 Hz.
• A=T + 220 micro-sec
• B=A + 410 micro-sec.
• C=A + 70 ns
• D=c + 7.6 ns
• TO terminates at the
slowest of A,B,C or D.
• The new cycle starts at
800 ns. later
• Rep. Rate = 1 Mega Hz.
• A=T + 100 ns
• B=A + 18 ns
• C=A- 50ns
• D=T + 3.5 micro sec.
• TO terminates at the
slowest of A,B,C or D.
• The new cycle starts at
800 ns. later
Class activity:
Do the timing diagram of
DSG 535
Triggering at1 Meg. Hz operation

A= T + 100 ns
B= A + 18 ns
C= A – 50 ns
D= T + 3.5 micro-sec
1 Mega-Hertz trigger pulse
All stop at the slowest of A,B,C or D + 800 ns.
Next cycle starts again at the next trigger pulse
C=A-50 ns
A=T + 100 ns
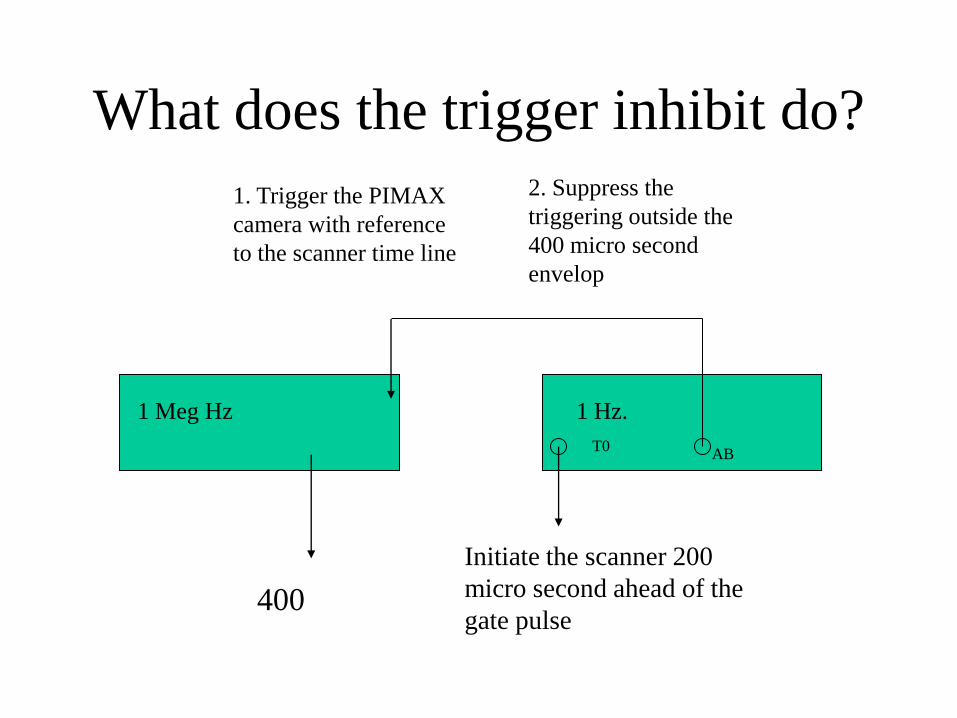
What does the trigger inhibit do?
1 Hz.
T0
1 Meg Hz
AB
1. Trigger the PIMAX
camera with reference
to the scanner time line
2. Suppress the
triggering outside the
400 micro second
envelop
Initiate the scanner 200
micro second ahead of the
gate pulse400

Pulse Width = 400 micro-sec, at 200 micro-sec
after trigger
Pulse Width = (200 + 400) micro-sec.
Triangular wave at 800 Hz. Phase = 270 degree
Open before LED1 Meg Hz. In 400 micro-sec

The timing diagram of the scanning mirror set-up
1. Total length of event
400 + 200 micro-sec.
2. Driving the scanner
at 800 Hez. .
3. Delay response of the
scanner4. One Mega.Hz. 18 ns.Gate pulses
in a 400 mciro. sec. envelop
1 Herz Read out start
TO
AB`


Data acquisition control by
PRIMAX

GATE mode

THz Bursting Regime and Gated Camera
- movie -

- movie -
Scanning Mirror Experiment Optical Lay out
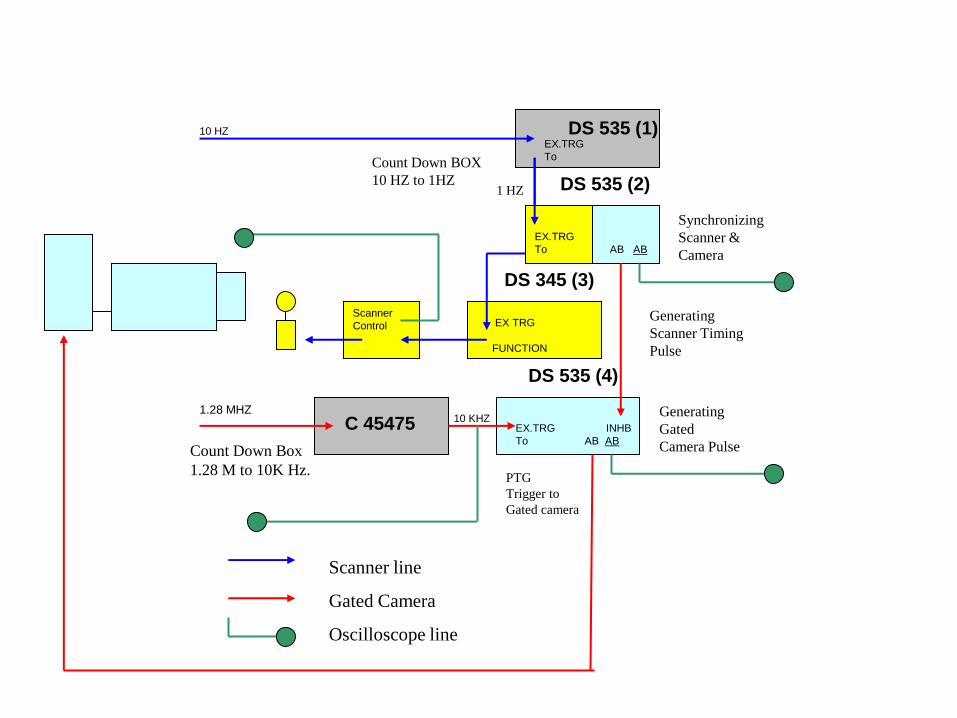
EX.TRG
To
EX.TRG INHB
To AB AB
EX TRG
FUNCTION
Scanner
Control
10 HZ
1.28 MHZ10 KHZ
Count Down BOX
10 HZ to 1HZ
Synchronizing
Scanner &
Camera
Generating
Scanner Timing
Pulse
Generating
Gated
Camera Pulse
1 HZ
Count Down Box
1.28 M to 10K Hz.
EX.TRG
To AB AB
PTG
Trigger to
Gated camera
DS 535 (1)
DS 535 (2)
DS 345 (3)
DS 535 (4)
C 45475
Scanner line
Gated Camera
Oscilloscope line
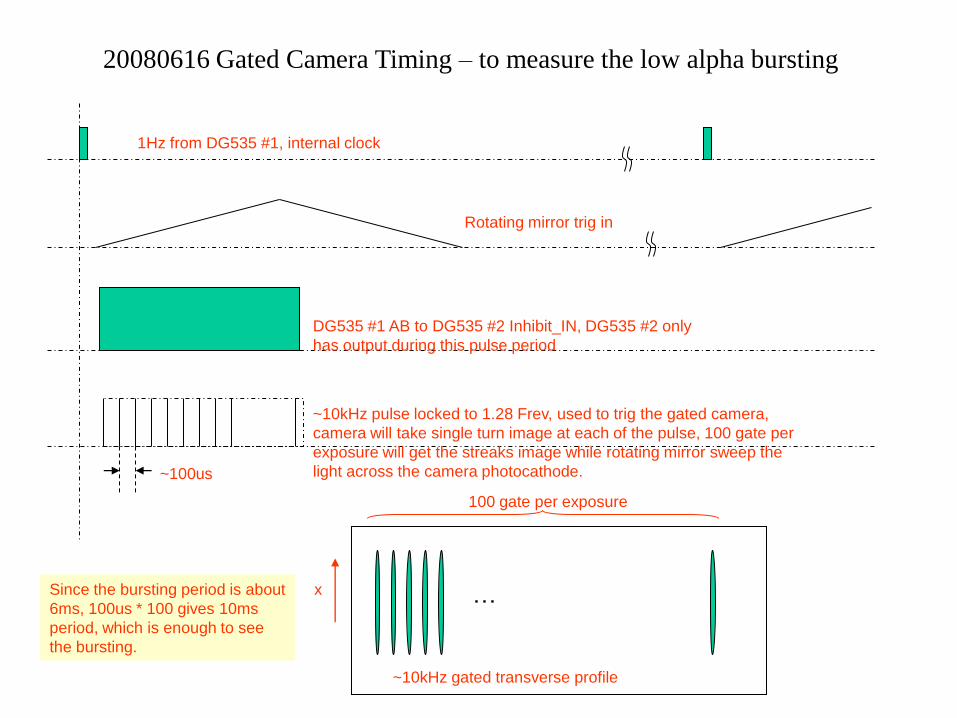
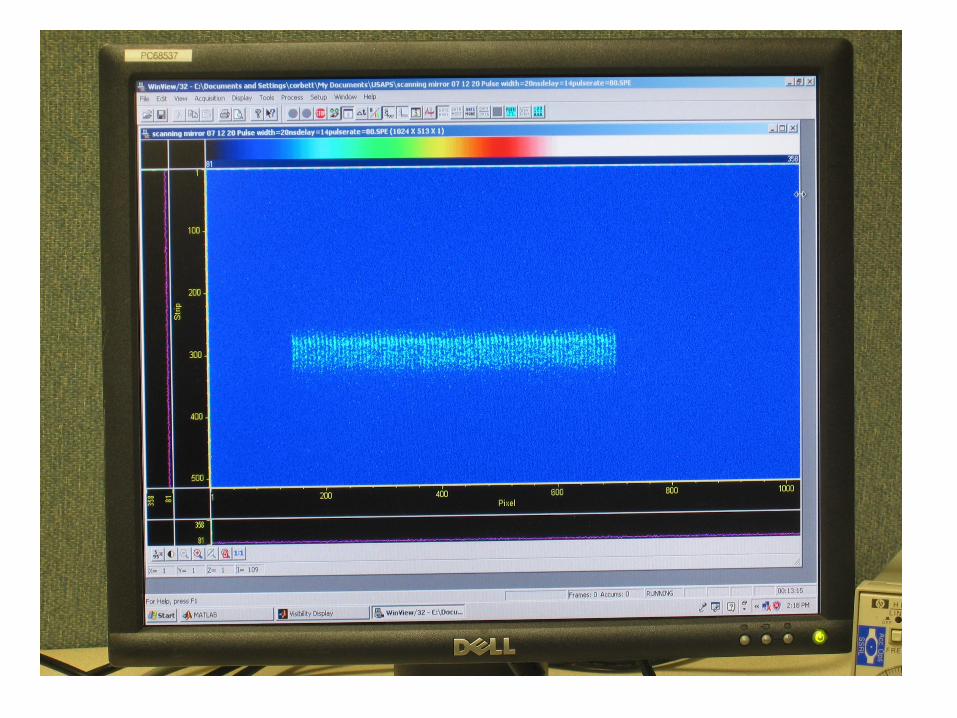
20080616 Gated Camera Timing – to measure the low alpha bursting
1Hz from DG535 #1, internal clock
Rotating mirror trig in
DG535 #1 AB to DG535 #2 Inhibit_IN, DG535 #2 only
has output during this pulse period
~10kHz pulse locked to 1.28 Frev, used to trig the gated camera,
camera will take single turn image at each of the pulse, 100 gate per
exposure will get the streaks image while rotating mirror sweep the
light across the camera photocathode.
…x
~10kHz gated transverse profile
~100us
Since the bursting period is about
6ms, 100us * 100 gives 10ms
period, which is enough to see
the bursting.
100 gate per exposure

Horizontal single turn profile Gaussian fit (4.7mA, Alpha/21 bursting)
pixels (13um*13um pixel size)
pix
els
100 200 300 400 500 600 700 800 900 1000
100
200
300
400
500
0 10 20 30 40 50 60 70 80 90 100200
400
600
800
Fitte
d a
mp (
a.u
.)
0 10 20 30 40 50 60 70 80 90 100500
1000
1500
2000
Fitte
d s
igm
a x
at
sourc
e p
oin
t(um
)
Gate number (~200us per gate)
4.7mA, Alpha/21
Gate trig freq: ~5kHz
100 gates per exposure
~ 6ms period
Damping down to smaller
sigma_x, higher intensity at streak
camera
Sigma_x blow up, loss intensity at
streak camera
x