Electronic vs Pyrotechnic Detonators (v2 Email)
19
Electronic Electronic vs vs Pyrotechnic Detonators Pyrotechnic Detonators Presented by Philipa Lamb RedBull Powder Company Ltd
-
Upload
dinoyancachajlla -
Category
Documents
-
view
50 -
download
11
description
Detonadores
Transcript of Electronic vs Pyrotechnic Detonators (v2 Email)
Electronic Electronic vs vs Pyrotechnic DetonatorsPyrotechnic Detonators
Presented by Philipa Lamb
RedBull Powder Company Ltd
OverviewOverview
CapacitorFuseHead
PrimaryCharge
BaseCharge
MicrochipEarthSpike
LeadWire
Electronic Delay Detonator
• Background
• Methodology
• Case Studies
• Conclusions Shock Tube
Bushing
Crimp
IsolationCup
Sealer Crimp
Delay Train
PrimaryCharge
BaseCharge
Pyrotechnic Detonator
BackgroundBackground
0.1
1
10
100
1000
10000
1860 1910 1925 1950 1965 1990 1990
Lo
g S
catt
er
(ms)
Historic Review of Scatter
Safety Fuse 1 meter
ElectricDetonators
PyrotechnicDetonators
FirstGenerationElectronic
DelayDetonators
1950 1965 2003
Methodology Methodology –– First ExampleFirst Example
0 20 40 60 80-20 100-40 120
Probability and Consequence
Rela
tive E
ffect
Inter Shot Interval (ms)
Relative Rock Response
25 ms
40%
20%
60%
80%
100%
0 20 40 60 80-20 100-40 120
Probability and Consequence
Rela
tive E
ffect
Inter Shot Interval (ms)
Relative Rock Response
40%
20%
60%
80%
100%
RelativePyrotechnic Timing
Probabiliy
0 20 40 60 80-20 100-40 120
Probability and Consequence
Rela
tive E
ffect
Inter Shot Interval (ms)
Relative Rock Response
40%
20%
60%
80%
100%
RelativePyrotechnic Timing
Probabiliy
66% ConfidenceInterval forPyrotechnic
0 20 40 60 80-20 100-40 120
Probability and Consequence
Rela
tive E
ffect
Inter Shot Interval (ms)
Relative Rock Response
40%
20%
60%
80%
100%
RelativePyrotechnic Timing
Probabiliy
66% ConfidenceInterval forPyrotechnic
Relative ElectronicTiming Probability
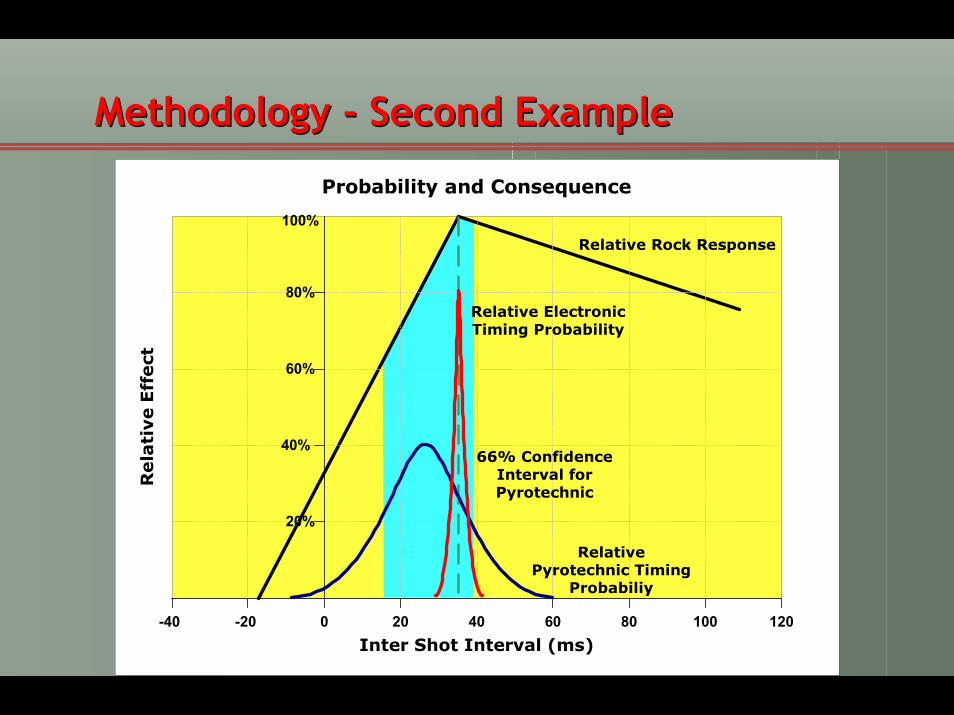
Methodology Methodology -- Second ExampleSecond Example
0 20 40 60 80-20 100-40 120
Probability and Consequence
Rela
tive E
ffect
Inter Shot Interval (ms)
Relative Rock Response
100%
80%
60%
40%
20%
35 ms
0 20 40 60 80-20 100-40 120
Probability and Consequence
Rela
tive E
ffect
Inter Shot Interval (ms)
Relative Rock Response
100%
80%
60%
40%
20%
RelativePyrotechnic Timing
Probabiliy
0 20 40 60 80-20 100-40 120
Probability and Consequence
Rela
tive E
ffect
Inter Shot Interval (ms)
Relative Rock Response
100%
80%
60%
40%
20%
RelativePyrotechnic Timing
Probabiliy
66% ConfidenceInterval forPyrotechnic
0 20 40 60 80-20 100-40 120
Probability and Consequence
Rela
tive E
ffect
Inter Shot Interval (ms)
Relative Rock Response
100%
80%
60%
40%
20%
RelativePyrotechnic Timing
Probabiliy
66% ConfidenceInterval forPyrotechnic
Relative ElectronicTiming Probability
Methodology ConclusionMethodology Conclusion
• Electronic detonators improve timing accuracy:
Increases fragmentation
Improves production rates
Increases overall efficiency
• Stock inventory decreases, as any delay time can be chosen
Case Studies using Electronic DetonatorsCase Studies using Electronic Detonators
Manukau Quarry, Auckland - Basalt Quarry
Controlling Vibration
Reliable Way Quarry, Auckland - Basalt Quarry
Controlling Vibration
Martha Gold Mine, Waihi, New Zealand - Open Cast Gold Mine
Controlling Vibration and Increasing Production
Trapper Coal Mine, Colorado, USA - Open Cast Coal Mine
Controlling High Wall Stability
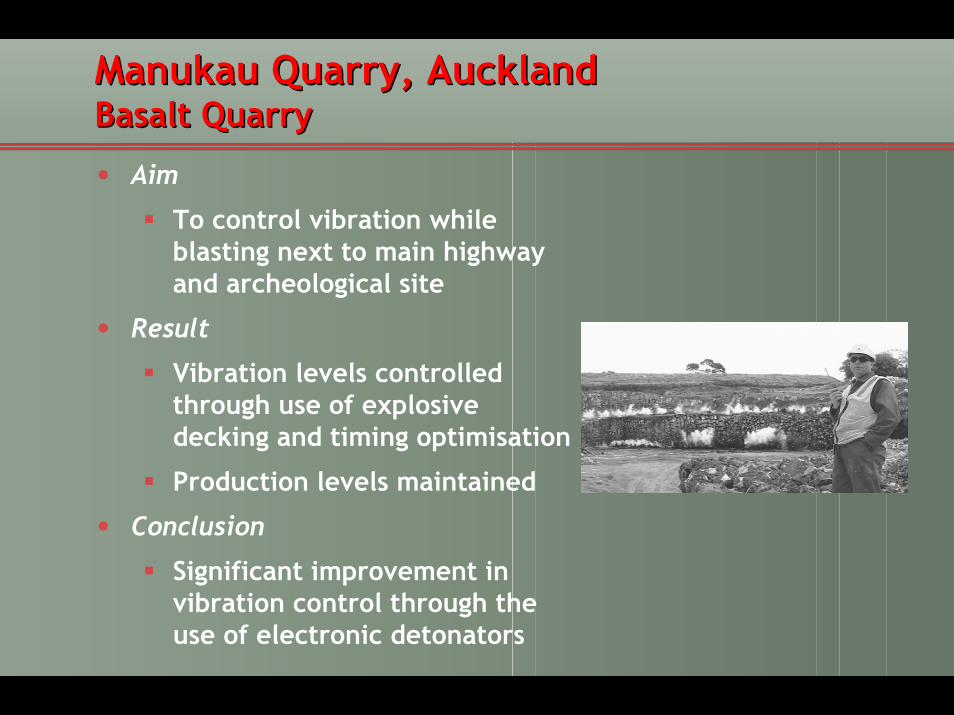
Manukau Manukau Quarry, AucklandQuarry, AucklandBasalt QuarryBasalt Quarry
• Aim
To control vibration while blasting next to main highway and archeological site
• Result
Vibration levels controlled through use of explosive decking and timing optimisation
Production levels maintained
• Conclusion
Significant improvement in vibration control through the use of electronic detonators
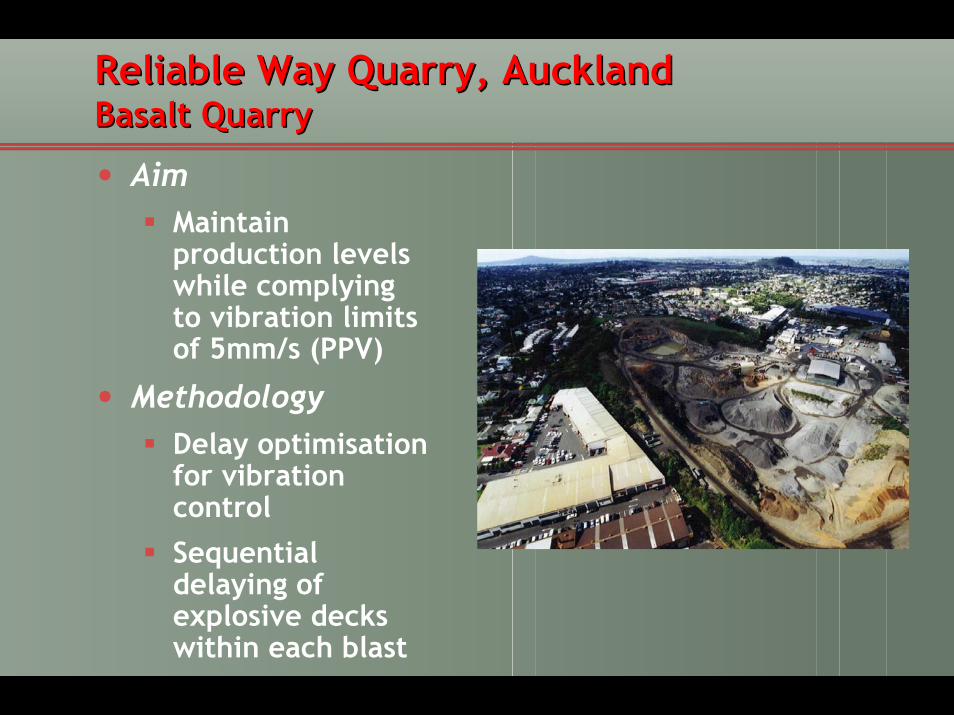
Reliable Way Quarry, Auckland Reliable Way Quarry, Auckland Basalt QuarryBasalt Quarry
• AimMaintain production levels while complying to vibration limits of 5mm/s (PPV)
• MethodologyDelay optimisation for vibration controlSequential delaying of explosive decks within each blast

Reliable Way Quarry, Auckland Reliable Way Quarry, Auckland Basalt QuarryBasalt Quarry
Delay Sequence of Explosive Decks within a Blast
70ms
0ms 35ms
140ms
105ms
245ms
210ms
385ms
175ms
350ms
280ms
455ms
420ms
595ms
Reliable Way Quarry, Auckland Reliable Way Quarry, Auckland Basalt QuarryBasalt Quarry
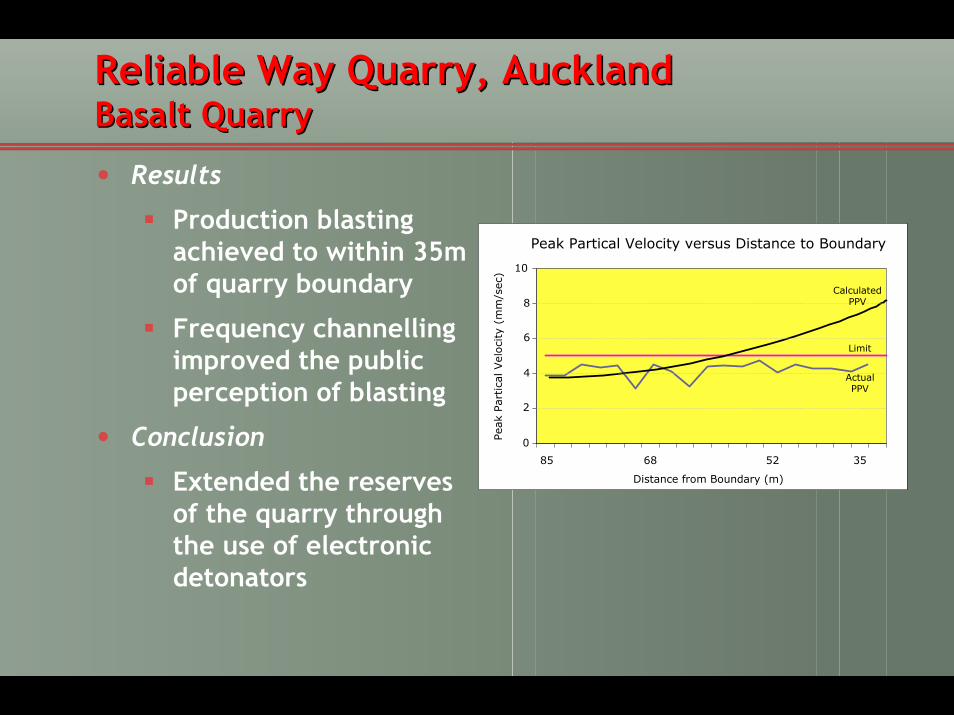
• Results
Production blasting achieved to within 35m of quarry boundary
Frequency channellingimproved the public perception of blasting
• Conclusion
Extended the reserves of the quarry through the use of electronic detonators
85 68 52 35
2
4
6
8
10
0Peak
Par
tica
l Vel
oci
ty (
mm
/sec
)
Distance from Boundary (m)
Peak Partical Velocity versus Distance to Boundary
ActualPPV
Limit
CalculatedPPV
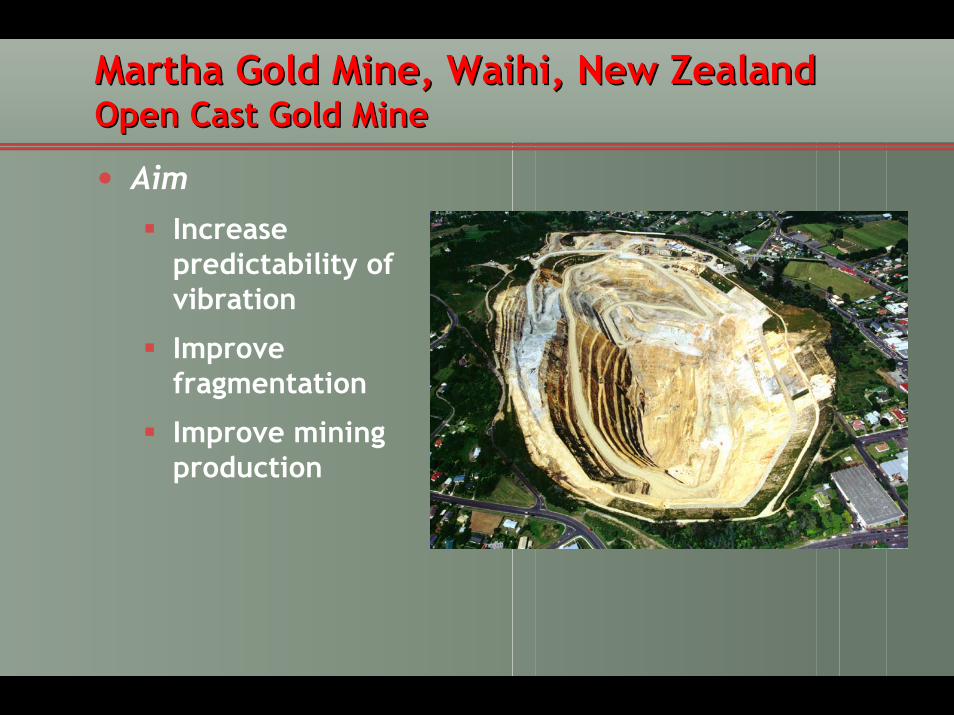
Martha Gold Mine, Martha Gold Mine, WaihiWaihi, New Zealand, New ZealandOpen Cast Gold MineOpen Cast Gold Mine
• Aim
Increase predictability of vibration
Improve fragmentation
Improve mining production
Martha Gold Mine, Martha Gold Mine, WaihiWaihi, New Zealand, New ZealandOpen Cast Gold MineOpen Cast Gold Mine
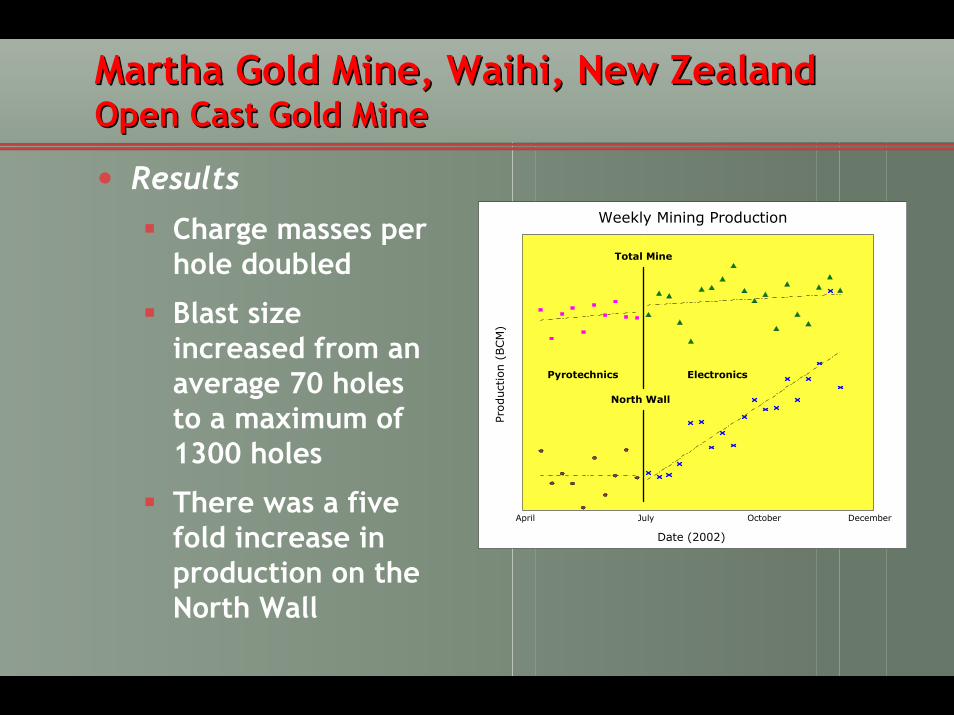
• Results
Charge masses per hole doubled
Blast size increased from an average 70 holes to a maximum of 1300 holes
There was a five fold increase in production on the North Wall
Product
ion (
BCM
)
Weekly Mining Production
April July October December
Total Mine
North Wall
Pyrotechnics Electronics
Date (2002)
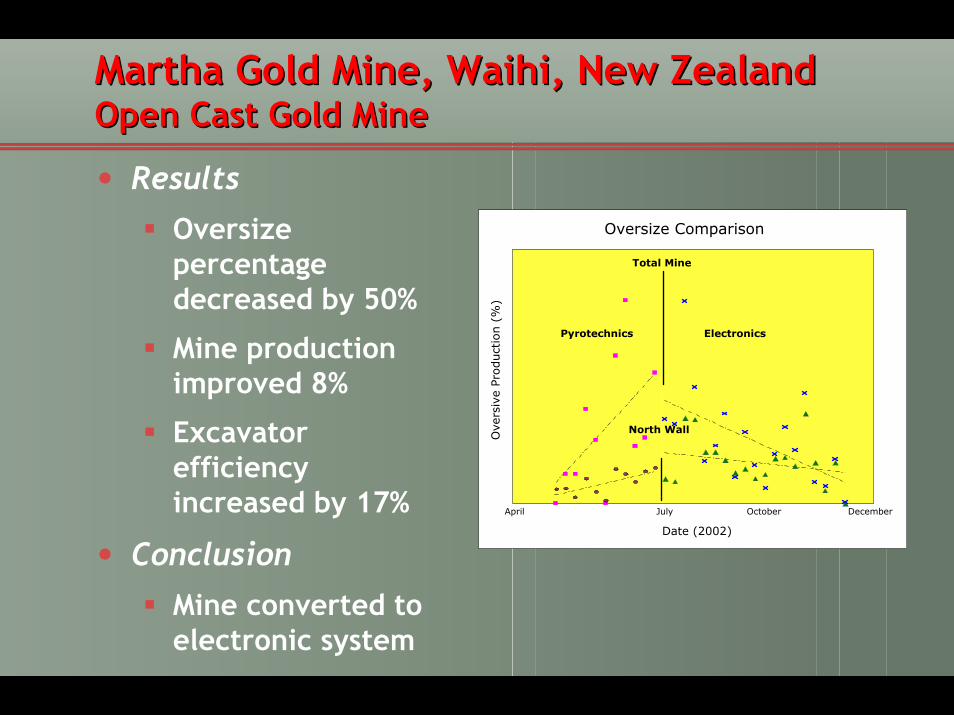
Martha Gold Mine, Martha Gold Mine, WaihiWaihi, New Zealand, New ZealandOpen Cast Gold MineOpen Cast Gold Mine
• Results
Oversize percentage decreased by 50%
Mine production improved 8%
Excavator efficiency increased by 17%
• Conclusion
Mine converted to electronic system
Ove
rsiv
e Pr
oduct
ion (
%)
Oversize Comparison
April July October December
Total Mine
North Wall
Pyrotechnics Electronics
Date (2002)

Trapper Coal Mine, Colorado, USATrapper Coal Mine, Colorado, USAOpen Cast CoalOpen Cast Coal
• AimTo improve the stability of high wallsTo improve cast, fragmentation and dragline production
• MethodologyTo use the flexibility of electronic timing to reduce the vibration that affects the high walls stability
Trapper Coal Mine, Colorado USATrapper Coal Mine, Colorado USAOpen Cast CoalOpen Cast Coal
• Results
High walls stable where previously pyrotechnic presplit had failed
Improved fragmentation
• Conclusion
Mine converted to electronic system
Case Study ConclusionCase Study Conclusion
• Electronic systems have been successful at the four sites discussed
• Electronic Delay Detonators have:
Improved production rates
Improved overall efficiency
Minimised vibration
Improved fragmentation
Improved face conditions
Increased safety
Conclusive Benefits of Electronic over Conclusive Benefits of Electronic over Pyrotechnic DetonatorsPyrotechnic Detonators
• Significantly improved cost efficiencies and output
• Electronic detonators have extended the life of quarries and mines
• Greater flexibility for blast design
• Despite higher unit cost of electronic detonators production output and cost efficiencies more than offset this cost.
• True comparison of cost is not of using an electronic system, but rather not using one!