Electronic Supplementary Information - Royal Society of … · · 2012-01-09Electronic...
15
Electronic Supplementary Information Electronic Supplementary Material (ESI) for Energy & Environmental Science This journal is © The Royal Society of Chemistry 2012
Transcript of Electronic Supplementary Information - Royal Society of … · · 2012-01-09Electronic...

Electronic Supplementary Information
Electronic Supplementary Material (ESI) for Energy & Environmental ScienceThis journal is © The Royal Society of Chemistry 2012

Table S1. Catalytic activity of different Faujasite (USY) and Beta zeolites synthesized in F– medium
(Beta (F–)) and in alkaline medium (Beta (OH–)) for the hydroxyalkylation/alkylation of Sylvan (1) with
butanal (2a).
Reaction conditions: Sylvan (3.00 g) and butanal (1.30g; molar ratio 2 : 1) were mixed, a 50‐mg
sample of the catalyst was added and the reaction mixture stirred magnetically and heated to 50 ºC
for 8 h.
Si/Al ratioa BETb V0c Initial activityd Yielde TONf
Entry Catalyst [mol/mol] [m2g–1] [cm3g–1] [mmol g–1 h–1] [%] [mol/mol]
1 USY 2.5 554 0.240 14 4 3
2 USY 6.0 562 0.213 65 9 14
3 USY 15.0 641 0.233 115 18 69
4 USY 20.0 673 0.229 331 53 241
5 USY 27.5 551 0.180 144 36 230
6 Beta (F–) 13 517 0.24 29 16 49
7 Beta (F–) 27 519 0.23 39 33 197
8 Beta (F–) 47 486 0.22 37 18 191
9 Beta (F–) 103 471 0.22 35 11 246
10 Beta (F–) 457 0.22 0 0 0
11 Beta (comm.)g 13 607 0.18 101 67 202
12 Beta (nano)h 15 590 0.24 111 59 199
13 Beta (OH–) 13 580 0.24 72 34 102
14 Beta (OH–) 26 576 0.26 10 9 50
15 Beta (OH–) 0 0 0
a Silicon to aluminum ratio in the zeolite. b BET surface area. c Microporous volume. d Initial activity in
mmol of product/g of catalyst/h; measured after 15 min reaction time. e Yield of 2,2'‐
butylidenebis[5‐methylfuran] (3a) with a purity of at least 93% after 8 h reaction time. f mol of
product obtained per mol of Al. g Commercial sample from Zeolyst. h Nanocrystalline sample.
Electronic Supplementary Material (ESI) for Energy & Environmental ScienceThis journal is © The Royal Society of Chemistry 2012

Scheme S1. Transformation of ketone 5h into triketone 6h by hydrolysis of the furan ring.
Alternatively, the initial water attack may also occur to the other furan double bond.
Scheme S2. Proposed mechanism for the hydrolysis of Sylvan (1) to 4‐oxopentanal (2f).
Scheme S3. Possible pathways for the by‐product formation in the hydrodeoxygenation (hdo) of
difuran 3a.
Electronic Supplementary Material (ESI) for Energy & Environmental ScienceThis journal is © The Royal Society of Chemistry 2012

Figure S1. Yield of difuran 3a when synthesized in the presence of USY and H‐Beta (F–) zeolite sample
with different Si/Al ratios.
Figure S2. Molecular dimensions of diesel precursor 3a (left hand side) and the pore diameter of
Beta zeolite (right hand side).
0 20 40 60 80 100 1200
10
20
30
40
50
60
yiel
d o
f 3
a/%
Si/Al ratio
USY
Beta(F–)
Electronic Supplementary Material (ESI) for Energy & Environmental ScienceThis journal is © The Royal Society of Chemistry 2012

Figure S3. TEM image of catalyst Beta (Zeolyst) with ratio of Si/Al = 13.
6.7 Å
7.7 Å
Electronic Supplementary Material (ESI) for Energy & Environmental ScienceThis journal is © The Royal Society of Chemistry 2012
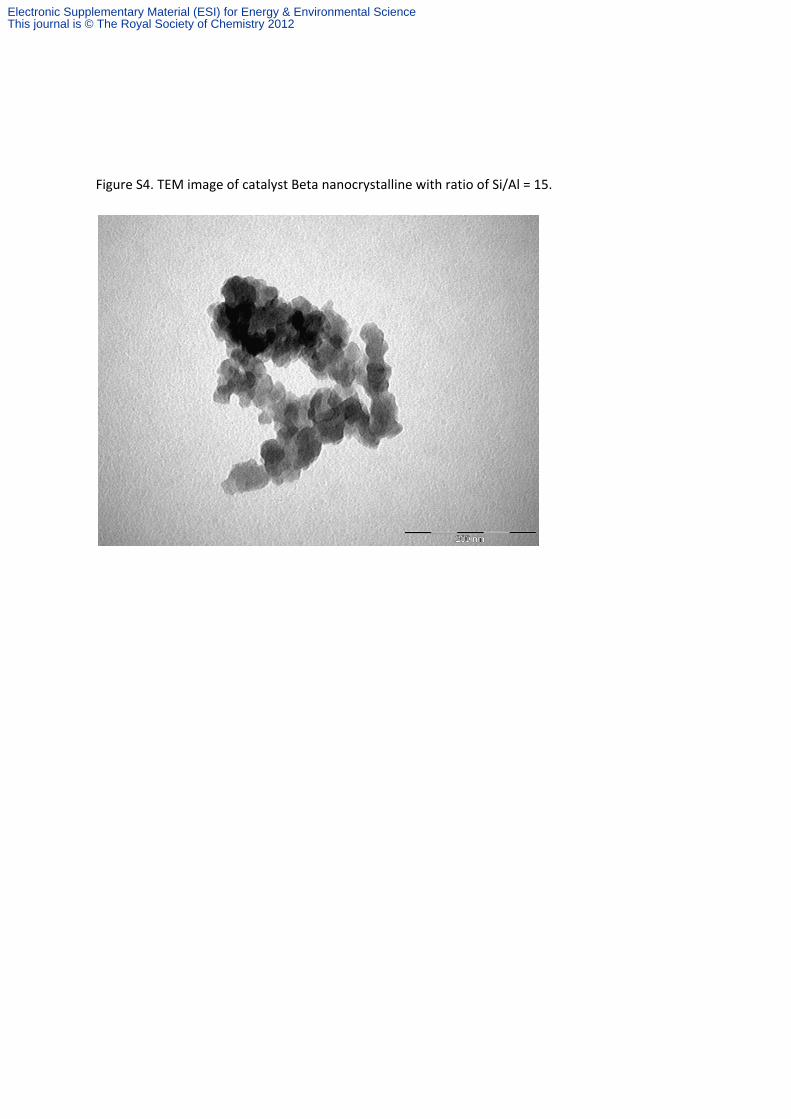
Figure S4. TEM image of catalyst Beta nanocrystalline with ratio of Si/Al = 15.
Electronic Supplementary Material (ESI) for Energy & Environmental ScienceThis journal is © The Royal Society of Chemistry 2012

Figure S5. SEM image of catalyst Beta (OH–) with ratio of Si/Al = 13.
Figure S6. SEM image of catalyst Beta (F–) with ratio of Si/Al = 13.
3 µm
Electronic Supplementary Material (ESI) for Energy & Environmental ScienceThis journal is © The Royal Society of Chemistry 2012

3 µm
Electronic Supplementary Material (ESI) for Energy & Environmental ScienceThis journal is © The Royal Society of Chemistry 2012

Figure S7. Yields (wt%) of aqueous and organic phase in the recycling reactions of the aqueous acidic
phase in the trimerization of Sylvan. After each cycle the aqueous phase is recovered by decantation,
lost liquid replaced and submitted to the next cycle with fresh Sylvan.
Figure S8. Product distribution of the organic liquid phase obtained by catalytic hydrodeoxygenation
of difuran 3a during 140 h time on stream.
0
10
20
30
40
50
60
70
80
90
100
1 2 3 4 5 6 7 8 9 10 11 12
reaction cycles for the acid
reco
vere
d in
wt%
aqueous acidic phase organic phase
Electronic Supplementary Material (ESI) for Energy & Environmental ScienceThis journal is © The Royal Society of Chemistry 2012

Figure S9. Conversion and product yield for the hydrogenation of 2‐methyltetrahydrofuran in the
liquid phase carried out at 350ºC in a fixed‐bed continuous‐flow reactor equipped with a Pt/C
catalyst. In the liquid phase 35 wt% to 50 wt% of the feed were recovered.
Figure S10. 1H NMR spectrum of 6‐(5‐methyl‐2‐furanyl)‐6‐methyl‐2,5‐nonadione (4g).
0
10
20
30
40
50
60
70
0 30 60 90 120 150time on stream/h
cont
ent i
n th
e cr
ud
e re
actio
n m
ixtu
re/%
6-propylundecane
nonane
alkanes C10-C13
oxygenated
250 275 300 325 3500
10
20
30
40
50
60
70
80
90
100
conv
ersi
on o
r yi
eld/
%
Temperature/ºC
conversion 2-pentanone 2-pentanol 1-pentanol other
Electronic Supplementary Material (ESI) for Energy & Environmental ScienceThis journal is © The Royal Society of Chemistry 2012

Figure S11. 13C NMR spectrum of 6‐(5‐methyl‐2‐furanyl)‐6‐methyl‐2,5‐nonadione (4g).
Electronic Supplementary Material (ESI) for Energy & Environmental ScienceThis journal is © The Royal Society of Chemistry 2012

Figure S12. 13C NMR and DEPT (upper line) spectra of 6‐propylundecane (7a).
Figure S13. 1H NMR spectrum of 6‐propyl‐2,10‐undecanedione (9a).
Electronic Supplementary Material (ESI) for Energy & Environmental ScienceThis journal is © The Royal Society of Chemistry 2012

Figure S14. 13C NMR and DEPT (upper line) spectra of 6‐propyl‐2,10‐undecanedione (9a).
Electronic Supplementary Material (ESI) for Energy & Environmental ScienceThis journal is © The Royal Society of Chemistry 2012

Figure S15. 1H NMR spectrum of 6‐propyl‐2,7‐undecanedione (10a).
Figure S16. 13C NMR and DEPT (upper line) spectra of 6‐propyl‐2,7‐undecanedione (10a).
Electronic Supplementary Material (ESI) for Energy & Environmental ScienceThis journal is © The Royal Society of Chemistry 2012

Figure S17. 13C NMR spectrum of 6‐propyl‐5‐undecanone (8a).
10152025303540455055f1 (ppm)
205210215f1 (ppm)
Electronic Supplementary Material (ESI) for Energy & Environmental ScienceThis journal is © The Royal Society of Chemistry 2012