Electronic Supplementary Information for Highly Sensitive ... · Electronic Supplementary...
16
Electronic Supplementary Information for Signal Enhancement of Sensing Nitroaromatics Based On Highly Sensitive Polymer Dots Jin Huang, a,b Jiangjing Gu, a,b Zhen Meng, b Xudong Jia* a,b and Kai Xi* b a State Key Laboratory of Coordination Chemistry, Nanjing National Laboratory of Microstructures, Nanjing University, Nanjing 210093, PR China b Department of Polymer Science & Engineering, Nanjing University, Nanjing 210093, PR China Contents 1. Materials and Instrument. 2. The Synthesis and Characterization Compounds and Pdots. 3. The Pdots-based Detection for Nitroaromatics in Solution. 4. The Pdots-based Detection for Nitroaromatics with Pdots/Fiber Composite Fluorescent Test Strips. 1. Materials and Instrument. 1.1 Materials 9,9’-((2,7-dibromo-9H-fluorene-9,9-diyl)bis(decane-10,1-diyl))bis(9H-carbazole) and 9,9-didecyl- 2,7-diethynyl-9H-fluorene were prepared according to our reported procedures 1 . 4,7-bis(2- bromothiophenyl)benzo[c][1,2,5]thiadiazole (98%), bis(triphenylphosphine) palladium (II) chloride (98%), cuprous iodide (99%) and 4,7-dibromobenzo[c][1,2,5]thiadiazole (98%) were purchased from TCI (Shanghai) Chemical Industry Development Co., Ltd. A comb-like polymer, polystyrene graft ethylene oxide functionalized with carboxy groups (PS-PEG-COOH, main chain M n = 6500 Da, graft chain M n = 4600 Da, total chain M n = 36500 Da, polydispersity 1.3), was purchased from Polymer Source Inc. (Quebec, Canada). TNP and TNT (2,4,6-trinitrotoluene) were supplied by Xiya Reagent and were recrystallized with ethanol before use. Other nitroaromatics were purchased from Aladdin Chemistry Co., Ltd. (China). The nitroaromatics were dissolved in the mixed solvent of ethanol and acetonitrile (volume ratio of 4:1) to obtain Electronic Supplementary Material (ESI) for Nanoscale. This journal is © The Royal Society of Chemistry 2015
-
Upload
trinhthien -
Category
Documents
-
view
219 -
download
0
Transcript of Electronic Supplementary Information for Highly Sensitive ... · Electronic Supplementary...
Electronic Supplementary Information for
Signal Enhancement of Sensing Nitroaromatics Based On
Highly Sensitive Polymer DotsJin Huang,a,b Jiangjing Gu,a,b Zhen Meng,b Xudong Jia*a,b and Kai Xi*b
aState Key Laboratory of Coordination Chemistry, Nanjing National Laboratory of
Microstructures, Nanjing University, Nanjing 210093, PR China
bDepartment of Polymer Science & Engineering, Nanjing University, Nanjing 210093, PR China
Contents1. Materials and Instrument.
2. The Synthesis and Characterization Compounds and Pdots.
3. The Pdots-based Detection for Nitroaromatics in Solution.
4. The Pdots-based Detection for Nitroaromatics with Pdots/Fiber Composite Fluorescent Test
Strips.
1. Materials and Instrument.
1.1 Materials
9,9’-((2,7-dibromo-9H-fluorene-9,9-diyl)bis(decane-10,1-diyl))bis(9H-carbazole) and 9,9-didecyl-
2,7-diethynyl-9H-fluorene were prepared according to our reported procedures1. 4,7-bis(2-
bromothiophenyl)benzo[c][1,2,5]thiadiazole (98%), bis(triphenylphosphine) palladium (II)
chloride (98%), cuprous iodide (99%) and 4,7-dibromobenzo[c][1,2,5]thiadiazole (98%) were
purchased from TCI (Shanghai) Chemical Industry Development Co., Ltd. A comb-like polymer,
polystyrene graft ethylene oxide functionalized with carboxy groups (PS-PEG-COOH, main chain
Mn = 6500 Da, graft chain Mn = 4600 Da, total chain Mn = 36500 Da, polydispersity 1.3), was
purchased from Polymer Source Inc. (Quebec, Canada). TNP and TNT (2,4,6-trinitrotoluene)
were supplied by Xiya Reagent and were recrystallized with ethanol before use. Other
nitroaromatics were purchased from Aladdin Chemistry Co., Ltd. (China). The nitroaromatics
were dissolved in the mixed solvent of ethanol and acetonitrile (volume ratio of 4:1) to obtain
Electronic Supplementary Material (ESI) for Nanoscale.This journal is © The Royal Society of Chemistry 2015
1mg/mL stock solutions before use. All organic solvents were purchased from commercial sources
and were carefully dried and distilled prior to use.
1.2 Instrument
1.2.1 Characterization Compounds.
Infrared spectra were obtained with a Bruker VECTOR 22 Fourier-transform infrared (FT-IR)
spectrometer. The 1H NMR and 13C NMR spectra were recorded in trichloromethane-d using
tetramethylsilane as internal standard on a Bruker 500 (500 MHz). Elemental Analysis data were
obtained using a CHN-O-Rapid elemental analyzer (Foss. Heraeus, Germany). Molecular weight
of polymers was measured on gel permeation chromatography (GPC) apparatus equipped with
UV-vis detection and Waters 1515 HPLC pump. Tetrahydrofuran was used as a carrier solvent at
a flow rate of 1.0 mL/min at 25 °C. A calibration curve was made to determine Mn and Mw/Mn
values with polystyrene standards, Mw=900~1.74×10⁶ g/mol, D<1.1. Simultaneous TG-DTA
Netzsch STA 449F3 was used to investigate the thermal stability of the polymers in nitrogen
atmosphere from ambient temperature to 700 °C at a heating rate of 10 °C min-1.
1.2.2 Morphological Characterizations.
Transmission electron microscopy (TEM) images were taken by a JEM-1011 electron
microscope (JEOL, Japan) at an accelerating voltage of 100 kV. Dynamic light scattering (DLS)
result was obtained by a Malvern MasterSizer 2000. Scanning electron microscope (SEM) images
were taken by Hitachi S-4800 at an accelerating voltage of 10 kV, 10 UA current, and the working
distance was 8.1 mm. 15 nm thick layers of gold plating were obtained on the sample surface by
SCD-500 (BAL-TEC) vacuum sputtering coating machine with 15 mA current gold-plated 100 s,
in order to reduce the charged phenomenon in the process of scanning electron microscope
observation.
1.2.3 Spectral Measurements.
Ultraviolet-visible (UV-vis) absorption spectra of the obtained polymers solution were carried
on a UV-1800 (PC) UV-vis spectrophotometer (Mapada, China). All solution fluorescence spectra
of the compound were measured with a FluoroMax-4 spectrofluorometer (HORIBA Scientific,
Japan) with slit width of 5 nm for both excitation and emission. The solid state emission spectra
were recorded on a FluoroMax-4 spectrofluorometer using a front face sample holder with slit
width of 5 nm for excitation and slit width of 2 nm for emission. The photoluminescence QYs
were determined on the spectrophotometer (FP-6600, Jasco Inc.) with an integrating sphere (ISF-
513).
2. The Synthesis and Characterization Compounds and Pdots
2.1 The Synthesis and Characterization of Polymers
The synthesis of P1. 9,9-didecyl-2,7-diethynyl-9H-fluorene (124 mg, 0.25 mmol), 9,9’-((2,7-
dibromo-9H-fluorene-9,9-diyl)bis(decane-10,1-diyl))bis(9H-carbazole) (234 mg, 0.25 mmol),
tetrakis(triphenylphosphine) palladium(0) (6 mg, 2 mol %), copper iodide (3 mg, 5 mol %), N,N-
diisopropylamine (3 mL), and toluene (6 mL) were added into a Schlenk flask in a nitrogen-filled
glove box. After stirring at 80 °C for 48 h, the mixture was filtered and precipitated into methanol.
The solid was then filtered and washed in a Soxhlet extractor with methanol followed by acetone
to remove residual catalyst and low-molecular-weight material. The yield was 76% as an orange
solid. Mw = 4.29×10⁴, Mn = 1.64×10⁴, PDI = 2.62, (GPC, polystyrene); FT-IR (cm-1, KBr): 2923,
2852 (s; CH), 2142 (w; C≡C), 1627, 1604, (m; Ar); 1H NMR (500 MHz, CDCl3, δ): 8.08 (br, Ar–
H), 7.66–7.38 (br, Ar–H), 7.21 (br, Ar–H), 4.25 (br, N–CH2), 1.95–0.58 (br, (CH2)10 and
(CH2)9CH3).
The general procedure for P2 and P3 synthesis.
9,9-didecyl-2,7-diethynyl-9H-fluorene (124 mg, 0.25 mmol), 9,9’-((2,7-dibromo-9H-fluorene -
9,9-diyl)bis(decane-10,1-diyl))bis(9H-carbazole) (187 mg, 0.20 mmol), dibromo comonomer (BT
and DBT) (0.05 mmol), tetrakis(triphenylphosphine) palladium (0) (6 mg, 2 mol %), copper
iodide (3 mg, 5 mol %), N,N-diisopropylamine (3 mL), and toluene (6 mL) were added into a
Schlenk flask in a nitrogen-filled glove box. After stirring at 80 °C for 48 h, the mixture was
filtered and precipitated into methanol. The solid was then filtered and washed in a Soxhlet
extractor with methanol followed by acetone to remove residual catalyst and low-molecular-
weight material.
P2. Yield was 71% as a yellow solid. Mw = 1.63×10⁴, Mn = 9.72×10³, PDI = 1.68, (GPC,
polystyrene); FT-IR (cm-1, KBr): 2946, 2871 (s; CH), 2135 (w; C≡C), 1681, 1597, (m; Ar); 1H
NMR (500 MHz, CDCl3, δ): 8.01 (br, Ar–H), 7.81–7.32 (br, Ar–H), 7.13 (br, Ar–H), 4.18 (br, N–
CH2), 1.92–0.54 (br, (CH2)10 and (CH2)9CH3).
P3. Yield was 63% as a red solid. Mw = 2.95×10⁴, Mn = 1.30×10⁴, PDI = 2.27, (GPC, polystyrene);
FT-IR (cm-1, KBr): 2939, 2866 (s; CH), 2129 (w; C≡C), 1662, 1615, (m; Ar); 1H NMR (500
MHz, CDCl3, δ): 8.07 (br, Ar–H), 7.81–7.36 (br, Ar–H), 7.20 (br, Ar–H), 4.27 (br, N–CH2), 1.97–
0.59 (br, (CH2)10 and (CH2)9CH3).
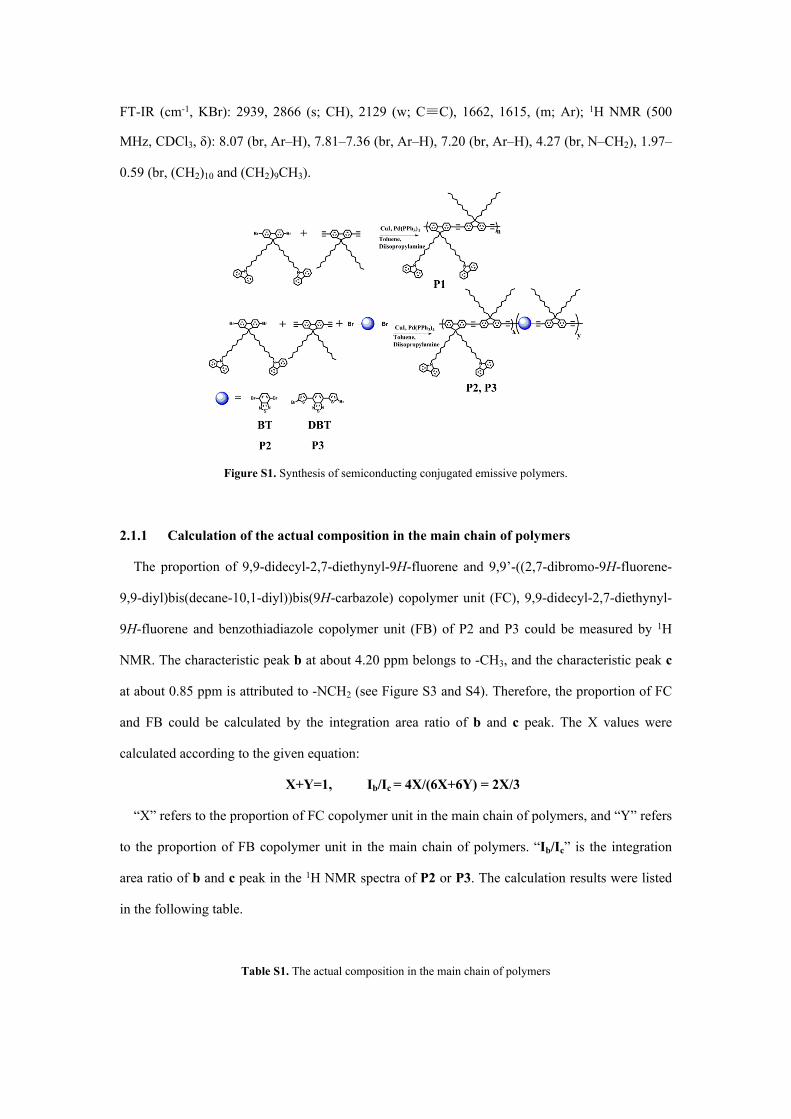
Figure S1. Synthesis of semiconducting conjugated emissive polymers.
2.1.1 Calculation of the actual composition in the main chain of polymers
The proportion of 9,9-didecyl-2,7-diethynyl-9H-fluorene and 9,9’-((2,7-dibromo-9H-fluorene-
9,9-diyl)bis(decane-10,1-diyl))bis(9H-carbazole) copolymer unit (FC), 9,9-didecyl-2,7-diethynyl-
9H-fluorene and benzothiadiazole copolymer unit (FB) of P2 and P3 could be measured by 1H
NMR. The characteristic peak b at about 4.20 ppm belongs to -CH3, and the characteristic peak c
at about 0.85 ppm is attributed to -NCH2 (see Figure S3 and S4). Therefore, the proportion of FC
and FB could be calculated by the integration area ratio of b and c peak. The X values were
calculated according to the given equation:
X+Y=1, Ib/Ic = 4X/(6X+6Y) = 2X/3
“X” refers to the proportion of FC copolymer unit in the main chain of polymers, and “Y” refers
to the proportion of FB copolymer unit in the main chain of polymers. “Ib/Ic” is the integration
area ratio of b and c peak in the 1H NMR spectra of P2 or P3. The calculation results were listed
in the following table.
Table S1. The actual composition in the main chain of polymers
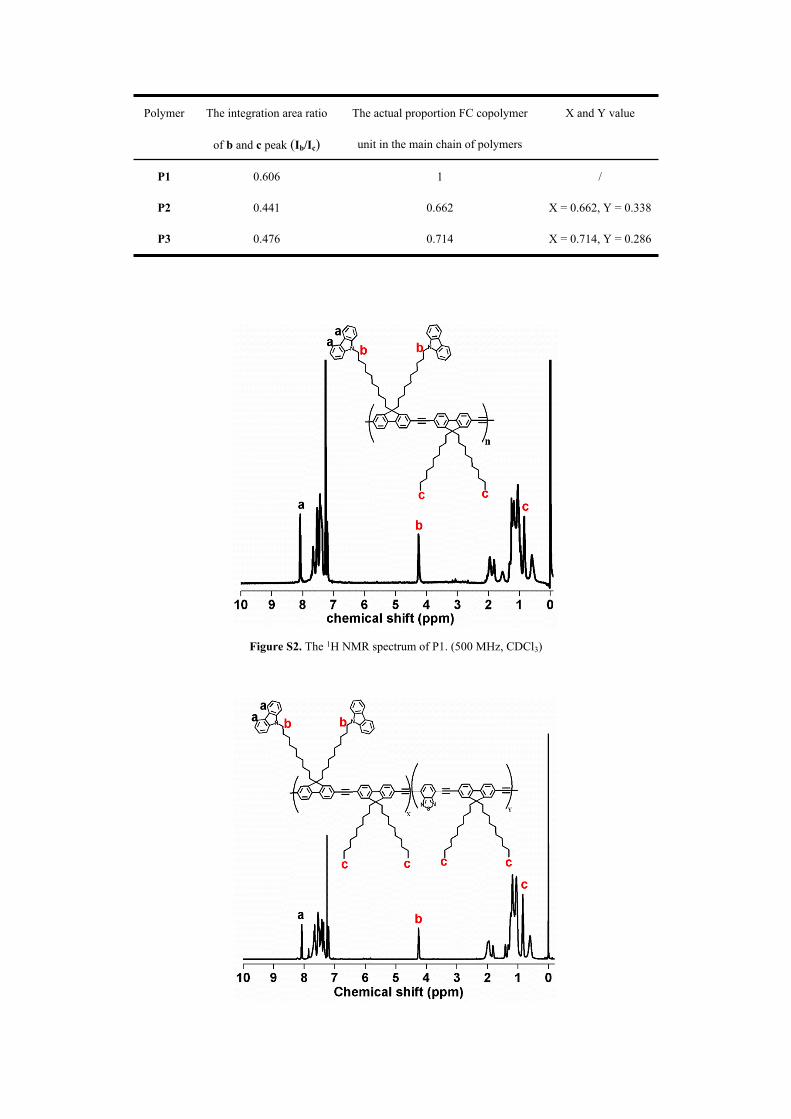
Polymer The integration area ratio
of b and c peak (Ib/Ic)
The actual proportion FC copolymer
unit in the main chain of polymers
X and Y value
P1 0.606 1 /
P2 0.441 0.662 X = 0.662, Y = 0.338
P3 0.476 0.714 X = 0.714, Y = 0.286
Figure S2. The 1H NMR spectrum of P1. (500 MHz, CDCl3)
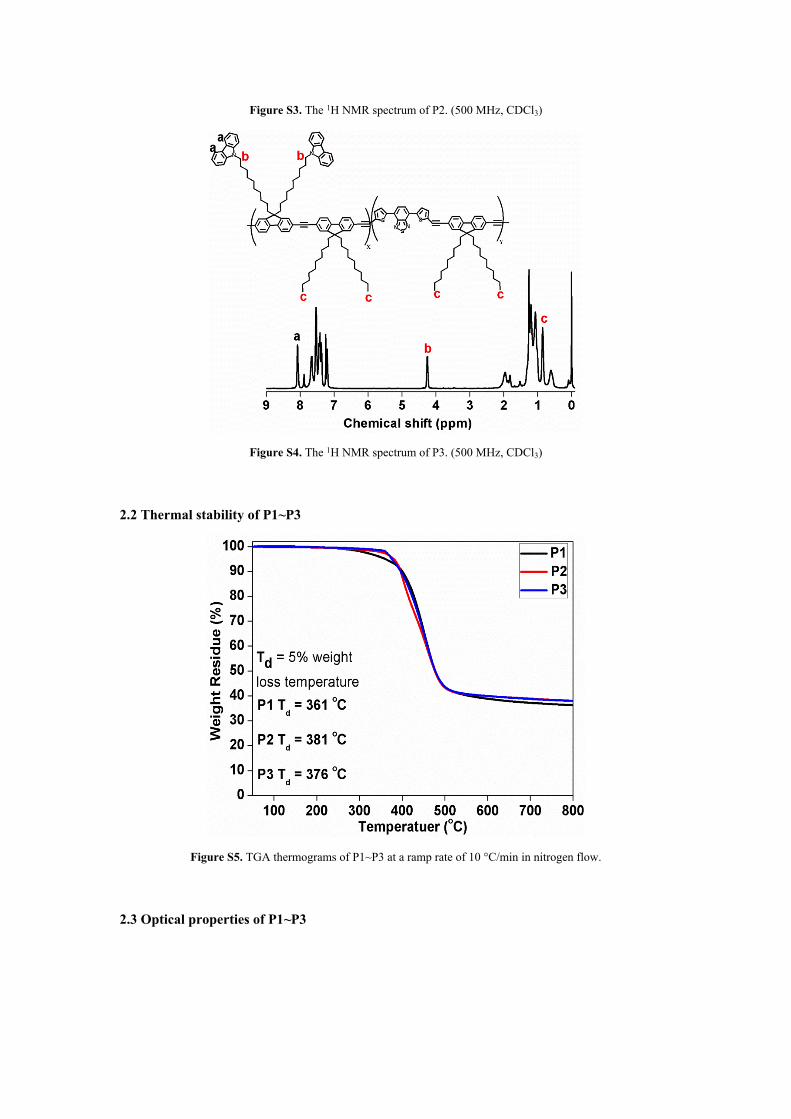
Figure S3. The 1H NMR spectrum of P2. (500 MHz, CDCl3)
Figure S4. The 1H NMR spectrum of P3. (500 MHz, CDCl3)
2.2 Thermal stability of P1~P3
Figure S5. TGA thermograms of P1~P3 at a ramp rate of 10 °C/min in nitrogen flow.
2.3 Optical properties of P1~P3
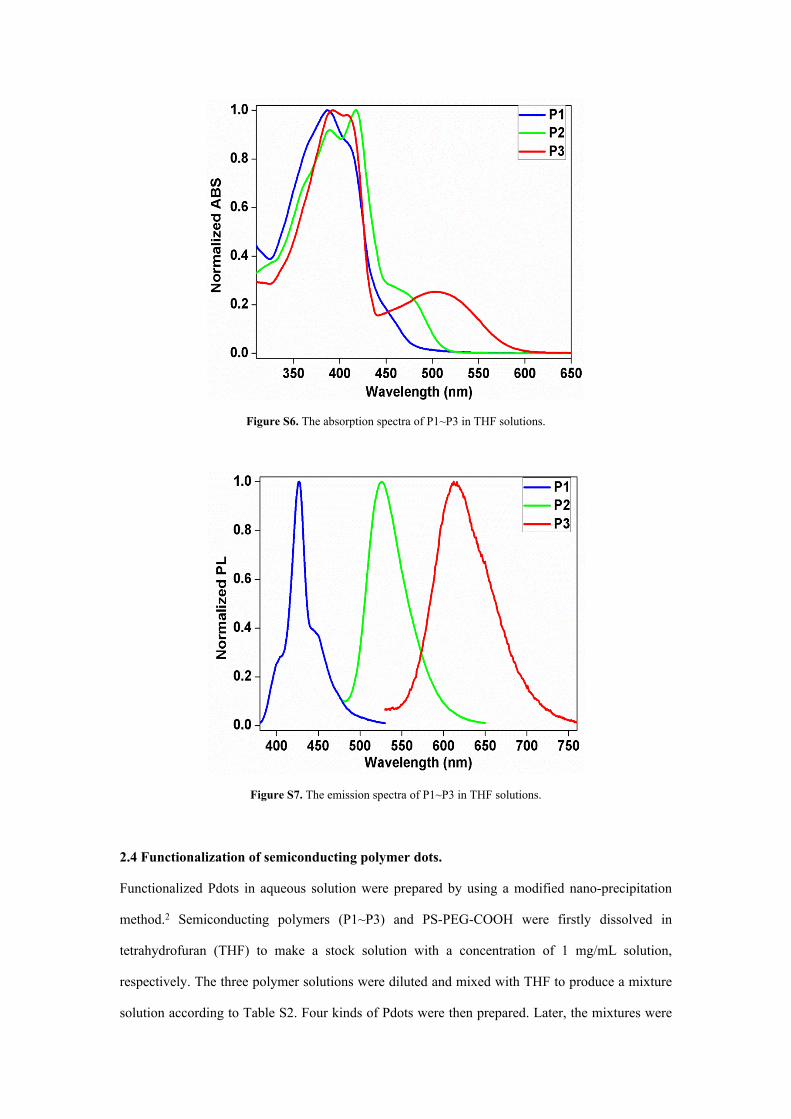
Figure S6. The absorption spectra of P1~P3 in THF solutions.
Figure S7. The emission spectra of P1~P3 in THF solutions.
2.4 Functionalization of semiconducting polymer dots.
Functionalized Pdots in aqueous solution were prepared by using a modified nano-precipitation
method.2 Semiconducting polymers (P1~P3) and PS-PEG-COOH were firstly dissolved in
tetrahydrofuran (THF) to make a stock solution with a concentration of 1 mg/mL solution,
respectively. The three polymer solutions were diluted and mixed with THF to produce a mixture
solution according to Table S2. Four kinds of Pdots were then prepared. Later, the mixtures were
sonicated to form homogeneous solutions. 10 mL of the as-prepared solutions were quickly added
to 12 mL of MilliQ water in a vigorous bath sonicator, which were concentrated by continuous
nitrogen stripping to 10 mL at 70 ºC, followed by filtration through 0.22 micron filters. In the
process of concentrating, a small amount of Pdots would aggregate, so it was necessary to
remeasure the actual mass concentrations of Pdots in the solution by freeze-drying method. The
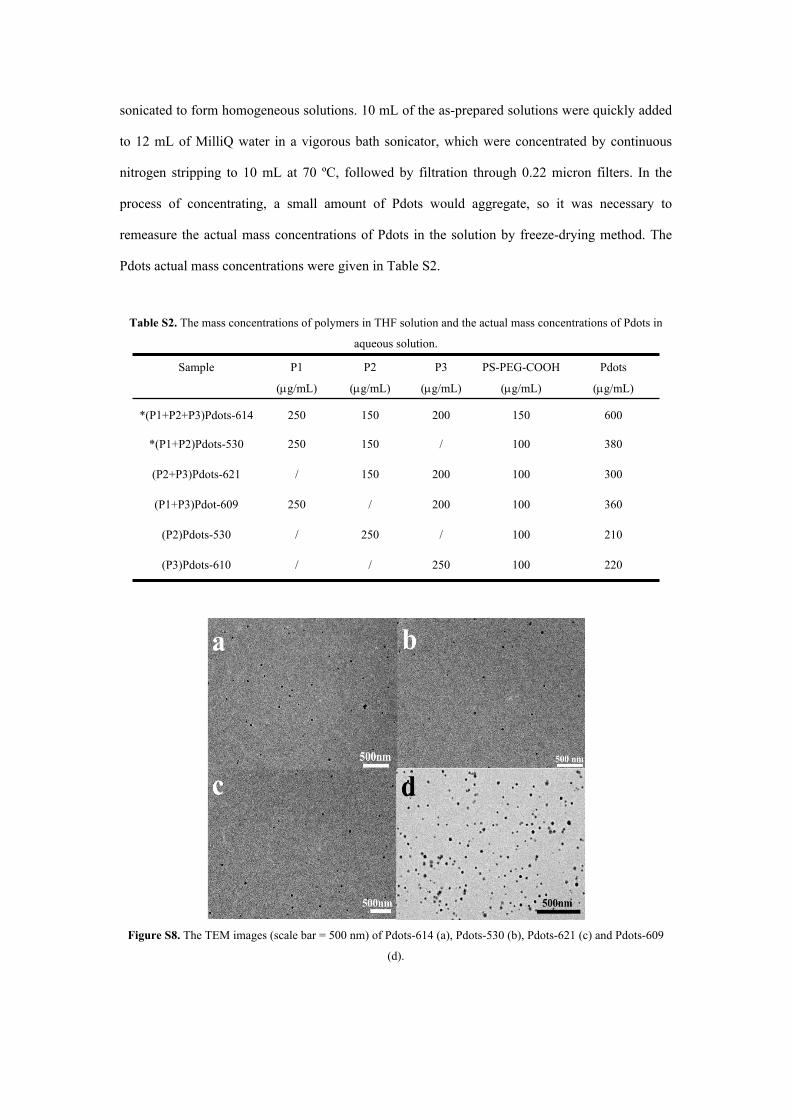
Pdots actual mass concentrations were given in Table S2.
Table S2. The mass concentrations of polymers in THF solution and the actual mass concentrations of Pdots in
aqueous solution.
Sample P1
(g/mL)
P2
(g/mL)
P3
(g/mL)
PS-PEG-COOH
(g/mL)
Pdots
(g/mL)
*(P1+P2+P3)Pdots-614 250 150 200 150 600
*(P1+P2)Pdots-530 250 150 / 100 380
(P2+P3)Pdots-621 / 150 200 100 300
(P1+P3)Pdot-609 250 / 200 100 360
(P2)Pdots-530 / 250 / 100 210
(P3)Pdots-610 / / 250 100 220
Figure S8. The TEM images (scale bar = 500 nm) of Pdots-614 (a), Pdots-530 (b), Pdots-621 (c) and Pdots-609
(d).

Figure S9. The hydrodynamic diameter of Pdots-530 measured by dynamic light scattering.
2.5 Fluorescence Quantum Yield (Ø) Measurements
Fluorescence quantum yields (Ø) of P1~P3 and Pdots were obtained by the following steps.
4-(dicyanomethylene)-2-methyl-6-(p-dimethylaminostyryl)-4H-pyran (DCM) was dissolved in
acetonitrile (literature quantum yield 0.60 at 430 nm) as reference for P3, Pdots-614, Pdots-620
and Pdots-609.3 Fluorescein was dissolved in methanol (literature quantum yield 0.79 at 425 nm)
as reference for P2 and Pdots-530.4 Quinine sulfate was dissolved in 0.1 M sulphuric acid
(literature quantum yield 0.54 at 360 nm) as reference for P1.5 Then UV-vis absorption and PL
emission spectra were measured for P3, Pdots-614, Pdots-620 and Pdots-609 with 430 nm
excitation, P2 and Pdots-530 with 425 nm excitation, and P1 with 360 nm excitation, respectively.
The accurate Ø values were calculated according to the given equation:
∅𝑠𝑎𝑚 = ∅𝑟𝑒𝑓
Isam 𝐴𝑟𝑒𝑓 𝑛 2𝑠𝑎𝑚
𝐼𝑟𝑒𝑓 𝐴𝑠𝑎𝑚 𝑛 2𝑟𝑒𝑓
“Sam” and “ref” refer to sample and reference respectively. “Ø” means quantum yield.
“I”is the integrated emission intensity, and could be calculated from the emission spectra at 430
nm for P3, Pdots-609, Pdots-614 and Pdots-621 or 425 nm for P2 and Pdots-530 or 360 nm for P1
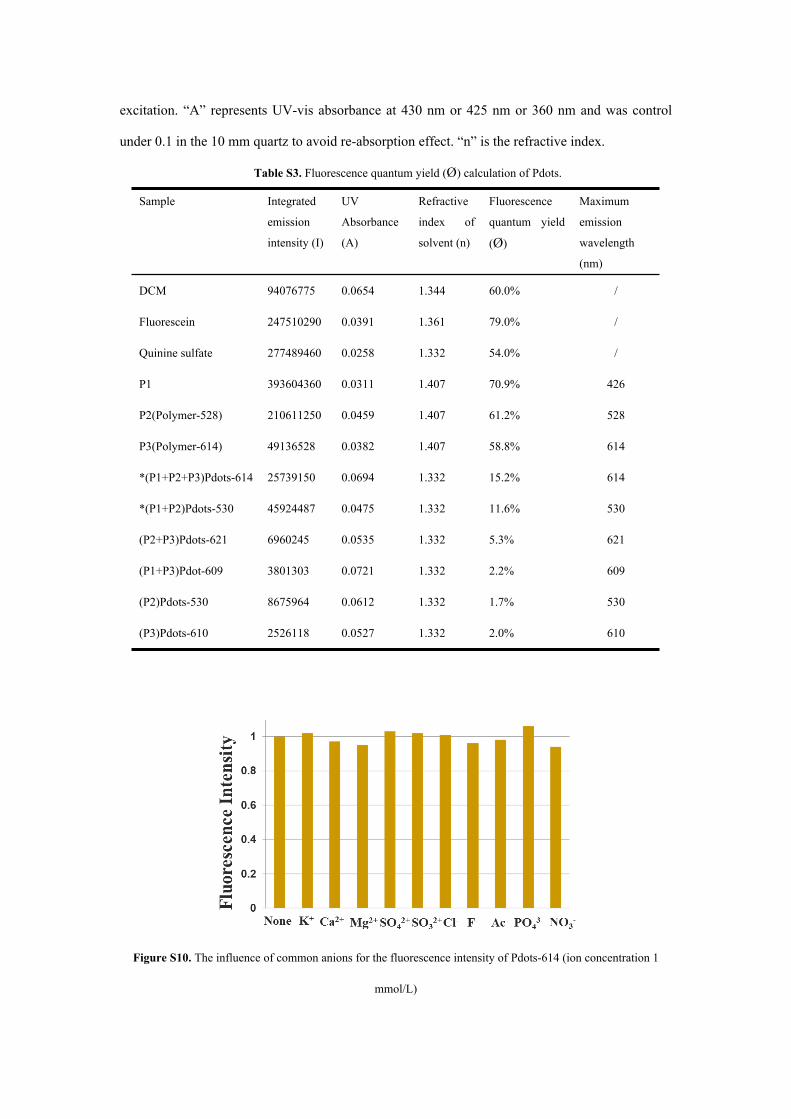
excitation. “A” represents UV-vis absorbance at 430 nm or 425 nm or 360 nm and was control
under 0.1 in the 10 mm quartz to avoid re-absorption effect. “n” is the refractive index.
Table S3. Fluorescence quantum yield (Ø) calculation of Pdots.
Sample Integrated
emission
intensity (I)
UV
Absorbance
(A)
Refractive
index of
solvent (n)
Fluorescence
quantum yield
(Ø)
Maximum
emission
wavelength
(nm)
DCM 94076775 0.0654 1.344 60.0% /
Fluorescein 247510290 0.0391 1.361 79.0% /
Quinine sulfate 277489460 0.0258 1.332 54.0% /
P1 393604360 0.0311 1.407 70.9% 426
P2(Polymer-528) 210611250 0.0459 1.407 61.2% 528
P3(Polymer-614) 49136528 0.0382 1.407 58.8% 614
*(P1+P2+P3)Pdots-614 25739150 0.0694 1.332 15.2% 614
*(P1+P2)Pdots-530 45924487 0.0475 1.332 11.6% 530
(P2+P3)Pdots-621 6960245 0.0535 1.332 5.3% 621
(P1+P3)Pdot-609 3801303 0.0721 1.332 2.2% 609
(P2)Pdots-530 8675964 0.0612 1.332 1.7% 530
(P3)Pdots-610 2526118 0.0527 1.332 2.0% 610
Figure S10. The influence of common anions for the fluorescence intensity of Pdots-614 (ion concentration 1
mmol/L)
3. The Pdots-based Detection for Nitroaromatics in Solution
3.1 Nitroaromatics Analysis in Solution.
100 L of the Pdots-614 aqueous solutions (0.6 mg/mL) were mixed with 40 L of the stock
solution of nitroaromatics (1 mg/mL), which were then diluted to 2.0 mL with
Na2CO3−NaHCO3−NaOH (pH, 9.0, 0.02 mol/L) buffer solution. The fluorescence spectra of the
mixture solution were measured using an excitation wavelength of 430 nm for Pdots-614. The
Pdots-530 as a fluorescent sensor for the detection of nitroaromatics was also tested according to
above-mentioned method (excitation wavelength 425 nm). As the control groups, the
corresponding polymers (Polymer-614 and Polymer-528) were used to detection nitroaromatics in
THF solution. Firstly, the THF solution of Polymer-614 was prepared. The mass concentration
was the same as that of the aqueous solution of Pdots-614 (600 g/mL), and so was the THF
solution of Polymer-528 (380 g/mL). Later, 100 L of Polymer-614 or Polymer-528 THF
solutions and 40 L of stock solutions of nitroaromatics (1 mg/mL) were mixed, which were then
diluted to 2.0 mL with THF. The concentrations of nitroaromatics were 20 g/mL. The Polymers-
mixture-614 (P1+P2+P3+PS-PEG-COOH) and the Polymers-mixture-528 (P1+P2+PS-PEG-
COOH) were also applied on the detection of nitroaromatics in organic phase in the same way.
The mass concentrations of Polymers-mixture-614 and Polymers-mixture-528 THF solutions were
600 g/mL and 380 g/mL respectively, which were the same as those of Pdots-614 and Pdots-
530 aqueous solutions. The constituents of Polymers-mixture-528 and Polymers-mixture-614 in
THF solution, which were based on the constituents for the synthesis of Pdots, were shown in
Table S4
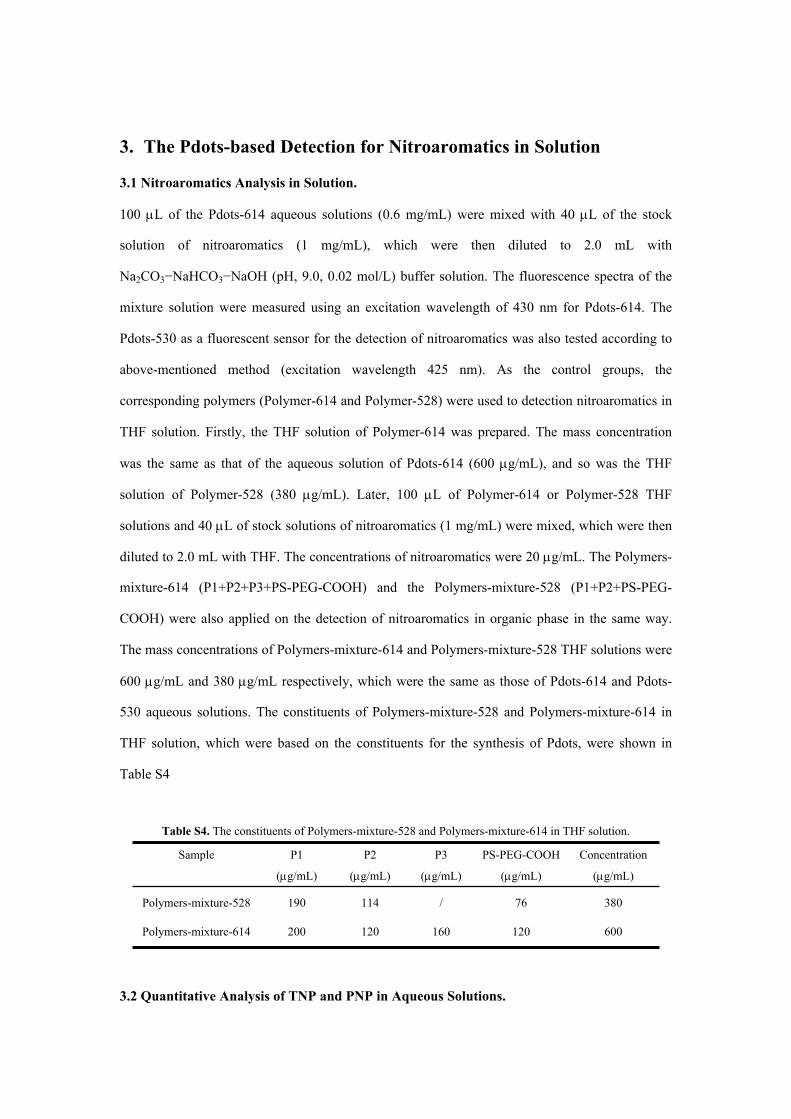
Table S4. The constituents of Polymers-mixture-528 and Polymers-mixture-614 in THF solution.
Sample P1
(g/mL)
P2
(g/mL)
P3
(g/mL)
PS-PEG-COOH
(g/mL)
Concentration
(g/mL)
Polymers-mixture-528 190 114 / 76 380
Polymers-mixture-614 200 120 160 120 600
3.2 Quantitative Analysis of TNP and PNP in Aqueous Solutions.
100 L of the Pdots-614 aqueous solutions (0.6 mg/mL) were mixed with different volumes of the
stock solution of TNP and PNP (1 mg/mL), which were then diluted to 2.0 mL with
Na2CO3−NaHCO3−NaOH (pH, 9.0, 0.02 mol/L) buffer solutions. The fluorescence spectra of the
mixture solution were measured within 30 second using an excitation wavelength of 430 nm for
Pdots-614.
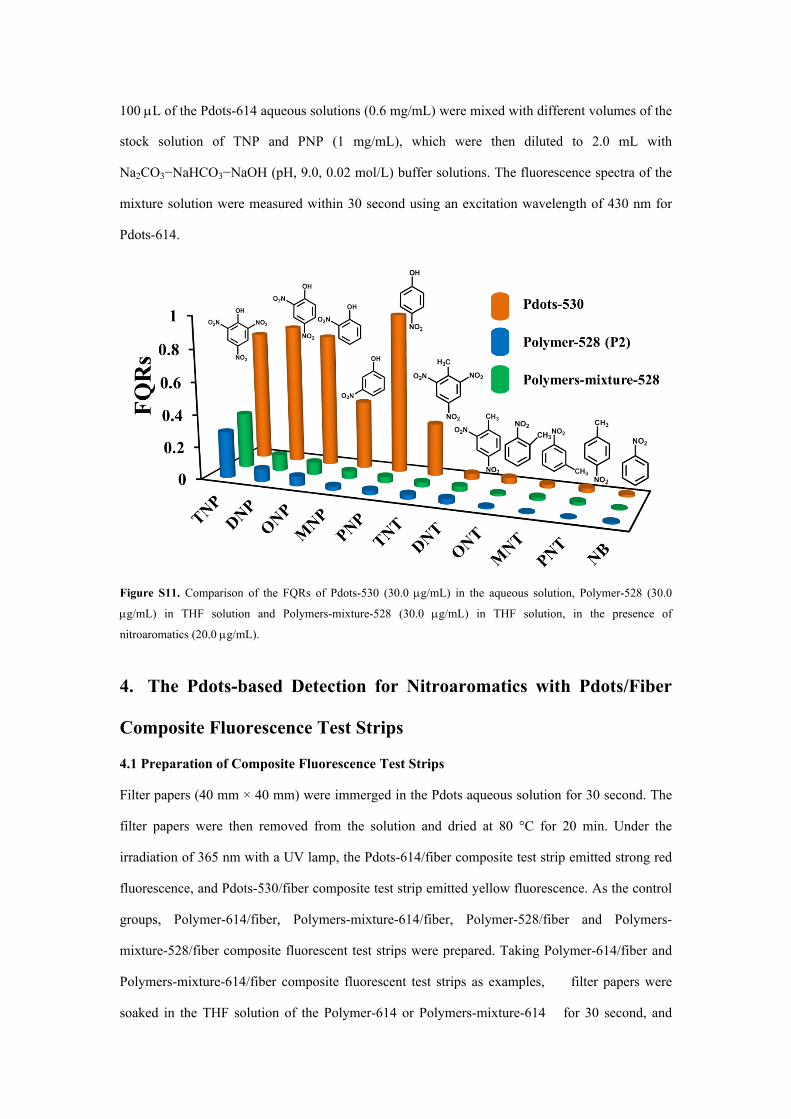
Figure S11. Comparison of the FQRs of Pdots-530 (30.0 g/mL) in the aqueous solution, Polymer-528 (30.0
g/mL) in THF solution and Polymers-mixture-528 (30.0 g/mL) in THF solution, in the presence of
nitroaromatics (20.0 g/mL).
4. The Pdots-based Detection for Nitroaromatics with Pdots/Fiber
Composite Fluorescence Test Strips
4.1 Preparation of Composite Fluorescence Test Strips
Filter papers (40 mm × 40 mm) were immerged in the Pdots aqueous solution for 30 second. The
filter papers were then removed from the solution and dried at 80 °C for 20 min. Under the
irradiation of 365 nm with a UV lamp, the Pdots-614/fiber composite test strip emitted strong red
fluorescence, and Pdots-530/fiber composite test strip emitted yellow fluorescence. As the control
groups, Polymer-614/fiber, Polymers-mixture-614/fiber, Polymer-528/fiber and Polymers-
mixture-528/fiber composite fluorescent test strips were prepared. Taking Polymer-614/fiber and
Polymers-mixture-614/fiber composite fluorescent test strips as examples, filter papers were
soaked in the THF solution of the Polymer-614 or Polymers-mixture-614 for 30 second, and
then the solvent was evaporated under 60 °C for 5 min. The control groups of Pdots-530 were
prepared according to the aforementioned method.
4.2 Qualitative Detection of Nitroaromatic by Emission Quenching with Test Strips.
The test strips were dipped into the nitroaromatic analyte solution (20 g/mL, 40 L stock
solution of nitroaromatic in 1.96 mL aqueous solution, PH=9), and the solvents were allowed to
evaporate. The emission spectra were collected by a front face technique using a film sample
holder. The emission spectrum of a blank sample was monitored by dipped into the water alone.
And then fluorescence quenching rates were calculated.
4.3 Contact Mode Visual Detection of Nitroaromatics.
The analyte solutions (0.01 g/mL, 1 g/mL and 10 g/mL, PH=9) of TNP (2,4,6-trinitrophenol),
TNT (2,4,6-trinitrotoluene), PNP (p-nitrophenol), NB (nitrobenzene) as ink were spotted onto the
test strips, respectively (4 L of the analyte were dropped onto the test strips with a spot area of
0.5 cm2). After solvent evaporation, the emission was collected by a front face technique using a
film sample holder.
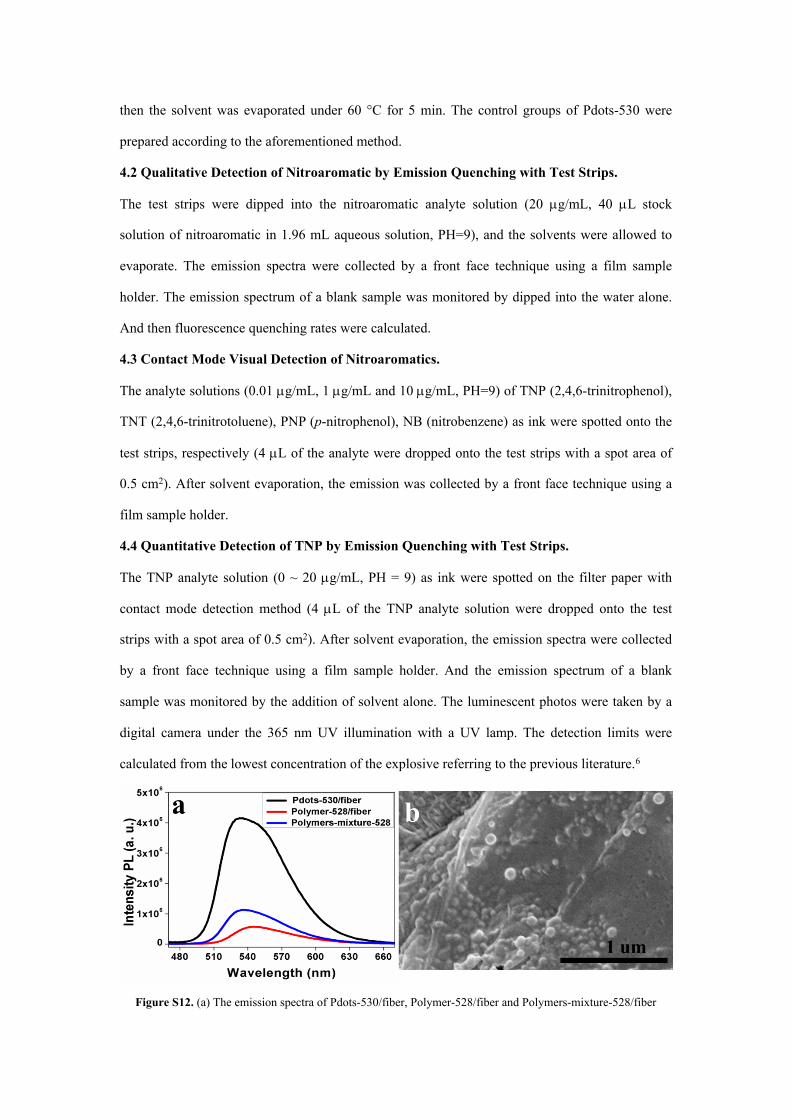
4.4 Quantitative Detection of TNP by Emission Quenching with Test Strips.
The TNP analyte solution (0 ~ 20 g/mL, PH = 9) as ink were spotted on the filter paper with
contact mode detection method (4 L of the TNP analyte solution were dropped onto the test
strips with a spot area of 0.5 cm2). After solvent evaporation, the emission spectra were collected
by a front face technique using a film sample holder. And the emission spectrum of a blank
sample was monitored by the addition of solvent alone. The luminescent photos were taken by a
digital camera under the 365 nm UV illumination with a UV lamp. The detection limits were
calculated from the lowest concentration of the explosive referring to the previous literature.6
Figure S12. (a) The emission spectra of Pdots-530/fiber, Polymer-528/fiber and Polymers-mixture-528/fiber

composite fluorescent test strips. (b) The SEM image of Pdots-530/fiber composite fluorescent test strips.
Figure S13. The emission spectra of Pdots-614/fiber composite fluorescent test strips, after washing twice with
water and then twice with ethanol: acetonitrile = V/V 4:1.
5. Proof of the mechanism via hydrogen bonding interaction
between Pdots and nitroaromatics
In this system, hydrogen bond was derived from -COOH in PS-PEG-COOH, which not only
contributed to recognize nitrophenol, but also enhanced the stability of the Pdots in water. To
clarify the influence of hydrogen bond on the Pdots based nitroaromatic sensors, the PS-PEG-
COCH3 was synthesized (Figure S14a). The PS-PEG-COOH could be reacted with thionyl
chloride in the methanol solution at 70 oC for 4h. Pdots-red was then composited with PS-PEG-
COCH3, which was referred to the synthesis of Pdots-614. It was found that Pdots-red was
instable in water, and could easily aggregate and form large particles (Figure S14b). Next the
Pdots-red was applied on sensing TNP at PH=9. The results were shown in the Figure S15.
Compared with Pdots-614, the FQRs (fluorescence quenching rates) of Pdots-red were greatly
reduced. The result could further confirm the proposed mechanism.
In addition, the mechanism of interaction between Pdots-614 sensor and nitroaromatic was
similar to that of interaction between p-phenyl-enevinylene based sensor and nitroaromatic, which
was reported in the previous literature (Figure S16).7
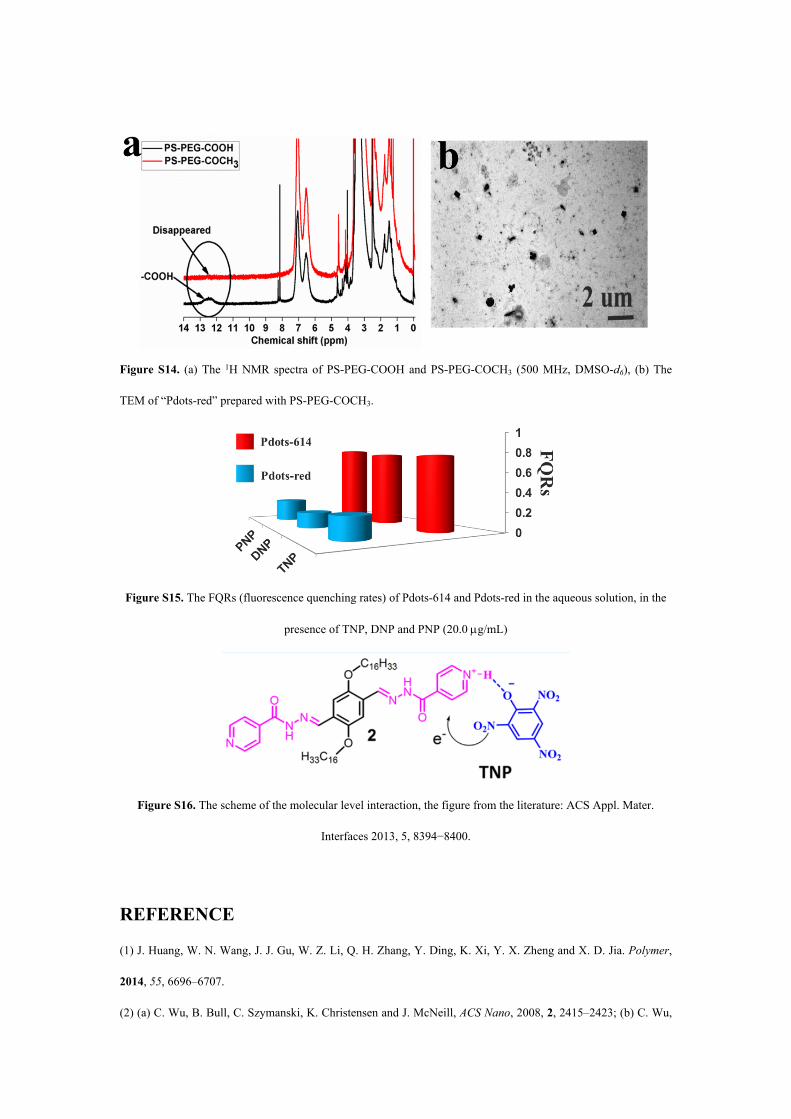
Figure S14. (a) The 1H NMR spectra of PS-PEG-COOH and PS-PEG-COCH3 (500 MHz, DMSO-d6), (b) The
TEM of “Pdots-red” prepared with PS-PEG-COCH3.
Figure S15. The FQRs (fluorescence quenching rates) of Pdots-614 and Pdots-red in the aqueous solution, in the
presence of TNP, DNP and PNP (20.0 g/mL)
Figure S16. The scheme of the molecular level interaction, the figure from the literature: ACS Appl. Mater.
Interfaces 2013, 5, 8394−8400.
REFERENCE
(1) J. Huang, W. N. Wang, J. J. Gu, W. Z. Li, Q. H. Zhang, Y. Ding, K. Xi, Y. X. Zheng and X. D. Jia. Polymer,
2014, 55, 6696–6707.
(2) (a) C. Wu, B. Bull, C. Szymanski, K. Christensen and J. McNeill, ACS Nano, 2008, 2, 2415–2423; (b) C. Wu,

S. J. Hansen, Q. Hou, J. Yu, M. Zeigler, Y. Jin, D. R. Burnham, J. D. McNeill, J. M. Olson and D. T. Chiu, Angew.
Chem. Int. Ed., 2011, 50, 3430–3434.
(3) J. Bourson and B. Valeur, J. Phys. Chem., 1989, 93, 3871–3876.
(4) R. E. Kellogg and R. G. Bennett, J. Phys. Chem., 1964, 41, 3042–3045.
(5) J. Olmsted, The Journal of Physical Chemistry, 1979, 83, 2581–2584.
(6) K. K. Kartha, S. S. Babu, S. Srinivasan and A. Ajayaghosh, J. Am. Chem. Soc., 2012, 134, 4834−4841.
(7) N. Dey, S. K. Samanta and S. Bhattacharya, ACS Appl. Mater. Interfaces, 2013, 5, 8394−8400.