Electronic Supplementary Information for … Electronic Supplementary Information for Insights into...
18
1 Electronic Supplementary Information for Insights into the effect of nanoconfinement on molecular interactions Yang Chen, † Shuangshou Wang, † Jin Ye, † Zhen Liu, *,† Xingcai Wu *,‡ † State Key Laboratory of Analytical Chemistry for Life Science, School of Chemistry and Chemical Engineering, Nanjing University, Nanjing 210093, China ‡ Key Laboratory of Mesoscopic Chemistry of Ministry of Education, School of Chemistry and Chemical Engineering, Nanjing University, Nanjing 210093, China Email: [email protected] (Z. Liu) and [email protected] (X.C. Wu). Electronic Supplementary Material (ESI) for Nanoscale. This journal is © The Royal Society of Chemistry 2014
Transcript of Electronic Supplementary Information for … Electronic Supplementary Information for Insights into...

1
Electronic Supplementary Information for
Insights into the effect of nanoconfinement on molecular
interactions
Yang Chen,† Shuangshou Wang,† Jin Ye,† Zhen Liu,*,† Xingcai Wu*,‡
† State Key Laboratory of Analytical Chemistry for Life Science, School of Chemistry
and Chemical Engineering, Nanjing University, Nanjing 210093, China
‡ Key Laboratory of Mesoscopic Chemistry of Ministry of Education, School of
Chemistry and Chemical Engineering, Nanjing University, Nanjing 210093, China
Email: [email protected] (Z. Liu) and [email protected] (X.C. Wu).
Electronic Supplementary Material (ESI) for Nanoscale.This journal is © The Royal Society of Chemistry 2014

2
EXPERIMENTAL SECTION
Reagents and materials. Horseradish peroxidase (HRP), RNase A, RNase B, 4-
carboxyphenylboronic acid (CPBA), 3-aminopropyltrimethoxysilane (APTMS),
tetraethoxy silane (TEOS), 1-ethyl-3-(3-dimethylaminopropyl)carbodiimide
hydrochloride (EDC), N-hydroxysuccinimide (NHS) were obtained from Sigma (St.
Louis, MO, USA). Adenosine and deoxyadenosine were purchased from Alfa Aesar
China (Tianjin, China). 3,3,5’,5’-Tetramethylbenzidine dihydrochloride substrate
solutions (A, B two components) were obtained from Zhongkai Keyue Biotech
(Beijing, China). All other chemical reagents were of analytical grade and obtained
from Sinopharm Chemical Reagent (Shanghai, China). Water used in all the
experiments was purified by a Milli-Q Advantage A10 ultrapure water purification
system (Millipore, Milford, MA, USA).
Instruments. Transmission electron microscopy (TEM) characterization was carried
out on a Tecnai G2 F30 S-Twin electron microscope (FEI Company, Hillsboro, OR,
USA) operated at 300 kV. The X-ray diffraction (XRD) patterns of samples were
acquired on an ARL XTRA diffractometer (Thermo Fisher Scientific, Waltham, MA,
USA) with Cu Kα radiation in the 2θ range of 0.5-6°. The adsorption isotherm
measurement was performed with a NanoDrop 2000/2000C spectrophotometer
(Thermo Fisher Scientific, Waltham, MA, USA). The digitalization analysis of TEM
images was implemented using an Image Processing Program kindly provided by
Wayne Rasband (Research Services Branch, National Institute of Mental Health,
USA). Nitrogen adsorption-desorption measurements were conducted at 77 K on an
ASAP2020 instrument (Micromeritics, Norcross, GA, USA).
Synthesis of CPBA-mesoporous silica nanoparticles. The CPBA-mesoporous silica
was synthesized via a method by Lin and co-workers1 with slight modification.
Briefly, 1.00 g of N-cetyltrimethylammonium bromide (CTAB) or 0.85 g N-

3
dodecantrimethylaminium bromide (DTAB) was dissolved in 480 mL water. 3.50 mL
of sodium hydroxide aqueous solution (2.00 M) was introduced to the surfactant
solution and the temperature of the mixture was adjusted to 80 C. 5.00 mL of TEOS
(22.4 mmol) was added dropwise to the surfactant solution under vigorous stirring.
The mixture was allowed to react for 2 h to produce white precipitate. The solid crude
product was filtered, washed with water and methanol, and dried under high vacuum
to yield the as-synthesized material (M-1). To remove the surfactant template, 1.50 g
of M-1 was refluxed for 6 h in a methanolic acidic solution containing 1.50 mL HCl
(37.2%) and 150 mL methanol. The resulting material was filtered and extensively
washed with water and methanol. The surfactant-free M-1 was placed under high
vacuum with heating at 60 C to remove the remaining solvent from the mesopores to
get M-2. M-2 (1.00 g) was refluxed for 20 h in 80.0 mL of anhydrous toluene with
1.00 mL (5.67 mmol) of APTMS to yield the 3-aminopropyl-functionalized M-2 (M-
3). The purified M-3 (400 mg) was dispersed in 20 mL dimethyl sulfoxide (DMSO).
0.15 g (0.90 mmol) CPBA was reacted with 0.10 g (0.87 mmol) NHS and 0.20 g (1.04
mmol) EDC in 5.0 mL DMSO, stirring at room temperature for 30 min before adding
to the M-3 suspension. The mixture was stirred at room temperature for another 24 h,
followed by filtration and washing with DMSO, water and methanol and dried to get
M-4. Due to the different size of the surfactant templates, the obtained mesopore size
was different.2 The average pore size for CTAB-templated CPBA-functionalized
mesoporous silica was measured to be 2.6 nm by TEM (Figure S1Aa), which was
exactly the same as the literature value for CTAB-templated mesoporous silica and
the average pore size for DTAB-templated CPBA-functionalized mesoporous silica
was measured to be 2.1 nm by TEM (Figure S1Ba).
Synthesis of CPBA-nonporous silica sphere. Synthesis of CPBA-nonporous silica
was carried out according to the reported seed-growth methods3 with slight
modification. 100 mL of ethanol, 5 mL of water, and 5 mL of NH3·H2O (35.3%) were
added consequently into a 250-mL flask and heated gradually to 40 C under constant
vigorous stirring. A mixed solution of 2 mL of TEOS and 8 mL of ethanol was added

4
to the solution quickly. After maintaining solution temperature at 40 C for 5 h, the
colloidal suspension was obtained, which was used as the seeds for subsequent
particle growth. To obtain larger particles, 10 mL of the colloidal suspension from the
first step was mixed with 50 mL of ethanol, 10 mL of water, and 10 mL of NH3·H2O
in a 250-mL flask. A mixture of 1 mL TEOS and 9 mL ethanol was added dropwise to
the flask, followed by continuous stirring for 8 h. After centrifugation of the solution
mixture, the precipitate, i.e., SiO2 particles, was washed with ethanol four times and
dried under vacuum. The enlarged SiO2 spheres (S-1) were stored until needed. The
obtained S-1 (1.00 g) was refluxed for 20 h in 80.0 mL of anhydrous toluene with 0.2
mL (1.1 mmol) of APTMS to yield the 3-aminopropyl-functionalized S-1 (S-2). S-2
(400 mg) was dispersed in 20 mL DMSO. 0.3 g (0.18 mmol) CPBA was reacted with
0.2g (0.17 mmol) NHS and 0.4 g (0.2 mmol) EDC in 5.0 mL DMSO, stirring at room
temperature for 30 min before adding to the S-2 suspension. The mixture was stirred
at room temperature for another 24 h, followed by filtration and washing with DMSO,
water and methanol and dried to get CPBA-nonporous silica (S-3).
Characterization. For TEM analysis, 1 mg material was added to 1 mL solution of 1
mg/mL of different molecules in 30 mM phosphate buffer (pH 8.5). The tubes were
shaken on a rotator for 6 h at room temperature. Then the mixture was diluted by 10
times with the same buffer. Drop-and-dry method was used to prepare the samples for
TEM. For XRD analysis, 30 mg material was added to 30 mL solution of 3 mg/mL of
different molecules. The tubes were shaken on a rotator for 6 h at room temperature.
The solution was vacuum freeze dried and the obtained powder was used for XRD
characterization.
The selectivity of CPBA-mesoporous and CPBA-nonporous silica spheres. For
the extraction by CPBA-mesoporous silica, 2 mg material was added to 900 μL
solution of 1 mg/mL adenosine or deoxyadenosine. The tubes were shaken on a
rotator for 1 h at room temperature. The CPBA-mesoporous silica were then collected
by centrifuge and rinsed with 500 μL of 30 mM sodium phosphate buffer (pH 8.5) for

5
3 times each. After washing, the CPBA-mesoporous silica was resuspended and
eluted in 100 μL 100 mM acetic acid solution for 1 h on a rotator. Finally, the CPBA-
mesoporous silica was centrifuged again and the eluates were collected by pipetting
carefully. The eluates were used for UV absorbance measurement. The same
procedure was carried out for CPBA-nonporous silica.
Digitalization analysis of TEM images. The digitalization analysis of TEM images
was implemented using an Image Processing Program kindly provided by Wayne
Rasband (Research Services Branch, National Institute of Mental Health, USA). More
specifically, for each TEM image, the normalized pixel intensity was calculated
through the following equation:
𝑁𝑜𝑟𝑚𝑎𝑙𝑖𝑧𝑒𝑑 𝑝𝑖𝑥𝑒𝑙 𝑖𝑛𝑡𝑒𝑛𝑠𝑖𝑡𝑦 = 𝐴𝑣𝑒𝑟𝑎𝑔𝑒𝑑 𝑖𝑛𝑡𝑒𝑛𝑠𝑖𝑡𝑦 𝑓𝑜𝑟 𝑠𝑒𝑙𝑒𝑐𝑡𝑒𝑑 𝑝𝑖𝑥𝑒𝑙𝑠𝐴𝑣𝑒𝑟𝑎𝑔𝑒 𝑖𝑛𝑡𝑒𝑛𝑠𝑖𝑡𝑦 𝑓𝑜𝑟 𝑏𝑎𝑐𝑘𝑔𝑟𝑜𝑢𝑑
The intensity of 20 randomly selected pixels in the background area and within the
images for the mesoporous silica nanoparticle and the nonporous silica nanoparticle
were read out and averaged. For mesoporous silica nanoparticles, pixels in dark spots
within the image were selected.
Nitrigen adsorption/desorption isotherms. The surface areas were calculated by the
Brunauer–Emmett–Teller (BET) equation. The pore size distribution was calculated
by the Barrett-Joyner-Halenda (BJH) equation.
Protein stability test by fluorescence spectrum and UV-vis absorbance. In the
above adsorption isotherm measurement, to ensure an equilibrium between the free
interacting molecule outside of mesoporous silica and the bound interacting molecule
inside of mesoporous silica, a long equilibrium time (12 h at room temperature) under
shaking condition was applied. To ensure such condition will not result in apparent
denaturation or conformational change of proteins under test, fluorescence spectrum
(excited at 295 nm) was used to evaluate the denaturation degree of proteins under
different conditions. According to the fluorescence method,4-5 if a protein is denatured,

6
the fluorescence peak for tryptophan will apparently red-shift. Different protein
solutions were prepared for fluorescence spectrum measurement. For native protein
solutions, protein lyophilized powders (1 mg/mL) were dissolved in freshly prepared
with 30 mM phosphate buffer (pH 8.5) and the fluorescence spectra were instantly
recorded. Then, the native protein solutions were shaken on a rotator for 12 h at room
temperature, which was the same conditions for the extraction, and the fluorescence
spectra were recorded. For denatured protein solutions, the native protein solutions
were heated to 100 C and kept for 10 min, and after cooling to room temperature
fluorescence spectra were recorded. To further verify our results, TMB colorimetric
method was used to test the catalytic activity of HRP that under long-time shaking,
which is highly related to the conformation of HRP. Briefly, 5 μL HRP solutions (1
ng/mL) under test were mixed with 100 μL TMB stock solution (A:B, 1:1 v/v), and
after shaken for 1 min the absorbance at 650 nm was recorded.
Adsorption isotherms and Scatchard analysis. Equivalent CPBA-mesoporous silica
(2 mg) was added to solutions (900 μL) of glycoprotein or adenosine at different
concentrations in 1.5-mL plastic microcentrifugal tubes. The tubes were shaken on a
rotator for 12 h at room temperature. The washing and elution procedures were the
same as those described above. The amounts of glycoprotein or adenosine extracted
by the CPBA-mesoporous silica were determined by measuring the glycoprotein or
adenosine in the eluates with the Nanodrop-2000C UV-Vis spectrophotometer. UV
absorbance was adopted at 260 nm for adenosine, 403 nm for HRP, 280 nm for
RNase B and RNase A. The same procedure was carried out for CPBA-nonporous
silica. Three parallel measurements were carried out for each experimental
point.The amount of glycoprotein or adenosine bound to CPBA-mesoporous silica or
CPBA-nonporous silica was plotted according to the Scatchard equation to estimate
the binding properties of the materials. The Scatchard relationship can be established
using the following equation:
e max e d/ [ ] ( ) /Q S Q Q K
Where Qe, [S], Qmax and Kd are the amount of glycoprotein or adenosine bound to

7
CPBA-mesoporous silica or CPBA-nonporous silica at equilibrium, the free
concentration at adsorption equilibrium, the saturated adsorption capacity and the
dissociation constant, respectively. By plotting Qe/[S] versus Qe, Kd and Qmax can be
calculated from the slope and the intercept, respectively.
References:
(1) Zhao, Y.N.; Trewyn, B.G.; Slowing, I.I.; Lin, V.S.-Y. J. Am. Chem. Soc. 2009,
131, 8398-8400.
(2) Itof, T.; Yano, K.; Inada, Y.; Fukushma, Y. J. Mater. Chem. 2002, 12, 3275-3277
(3) Chang, S. M.; Lee, M.; Kim, W.-S. J. Col. Interf. Sci. 2005, 286, 536-542.
(4) Abou-Zied O.K., Al-Shihi. O.I.K. J. Am. Chem. Soc. 2008, 130, 10793-10801.
(5) Lakowicz, J. R. Principles of Fluorescence Spectroscopy; Springer: New York, 2006.

8
Fig. S1. TEM images for A, B) the CPBA-mesoporous silica nanoparticles with
CTAB as template; C, D) the CPBA-mesoporous silica nanoparticles with DTAB as
template; and E, F) the CPBA-nonporous silica sphere. Based on the TEM images, the
pore size of the CPBA-mesoporous silica nanoparticles with CTAB and DTAB as
templates were measured to be 2.6 ± 0.25 and 2.1 ± 0.2 nm, respectively. The
diameters for these mesoporous silica nanoparticles and the nonporous silica sphere
were measured to be 83 ± 10, 80 ± 5 and 117 ± 4 nm, respectively.

9
0
1
2
3
Abso
rptio
n at
260
nm
Adenosine Deoxyadenosine
mesoporous silica nonporous silica
Fig. S2. Selectivity of the CPBA-functionalized mesoporous (pore size 2.6 nm) and
nonporous silica toward adenosine against deoxyadenosine.

10
0.0 0.2 0.4 0.6 0.8 1.0
0
200
400
600
Qua
ntity
Ads
orbe
d / c
m3 /g
Relative Pressure P/P0
CPBA-mesoporous silica
A
0.0 0.2 0.4 0.6 0.8 1.0
0
100
200
300
400
500
600B
CPBA-nonporous silicaQua
ntity
Ads
orbe
d / c
m3 /g
Relative Pressure P/P0
0.0 0.2 0.4 0.6 0.8 1.00
100
200
300
400
500
600
C
CPBA-mesoporous silica incubated with adenosine
Qua
ntity
Ads
orbe
d / c
m3 /g
Relative Pressure P/P0
0.0 0.2 0.4 0.6 0.8 1.00
100
200
300
400
500
600
D
CPBA-mesoporous silica incubated with HRPQ
uant
ity A
dsor
bed
/ cm
3 /g
Relative Pressure P/P0
0.0 0.2 0.4 0.6 0.8 1.00
100
200
300
400
500
600
E
CPBA-mesoporous silica incubated with RNase AQ
uant
ity A
dsor
bed
/ cm
3 /g
Relative Pressure P/P0
0.0 0.2 0.4 0.6 0.8 1.00
100
200
300
400
500
600
F
CPBA-mesoporous silica incubated with RNase BQ
uant
ity A
dsor
bed
/ cm
3 /g
Relative Pressure P/P0
Fig. S3. BET nitrogen adsorption/desorption isotherms for A) CPBA-mesoporous
silica, B) CPBA-nonporous silica, C-F) interacting species-bound CPBA-mesoporous
silica. Interacting species: C) Adenosine, D) HRP, E) RNase A, and F) RNase B. The
absorbed amount of N2 by interacting species-incubated CPBA-mesoporous silica is
apparently lower than that by bare CPBA-mesoporous silica. This can be attributed to
that the mesopores were occupied by the interacting species with molecular size less
than the mesopore (adenosine, RNase A and RNase B) or covered by the interacting
species with molecular size larger than the mesopore (HRP).
11
2 4 6 8 10
0.00
0.25
0.50
0.75
1.00A
Pore
Vol
ume
/ cm
3 /g
Pore Diameter / nm
mesoporous silica
2 4 6 8 10
0.0
0.2
0.4
0.6
0.8
1.0B nonporous silica
Pore
Vol
ume
/ cm
3 /g
Pore Diameter / nm
2 4 6 8 10
0.00
0.25
0.50
0.75
1.00C
Pore
Vol
ume
/ cm
3 /g
Pore Diameter / nm
mesoporous silica incubated with adenosine
2 4 6 8 10
0.00
0.25
0.50
0.75
1.00D
Pore
Vol
ume
/ cm
3 /g
Pore Diameter / nm
mesoporous silica incubated with HRP
2 4 6 8 10
0.00
0.25
0.50
0.75
1.00E
Pore
Vol
ume
/ cm
3 /g
Pore Diameter / nm
mesoporous silica incubated with RNase A
2 4 6 8 10
0.00
0.25
0.50
0.75
1.00F
Pore
Vol
ume
/ cm
3 /g
Pore Diameter / nm
mesoporous silica incubated with RNase B
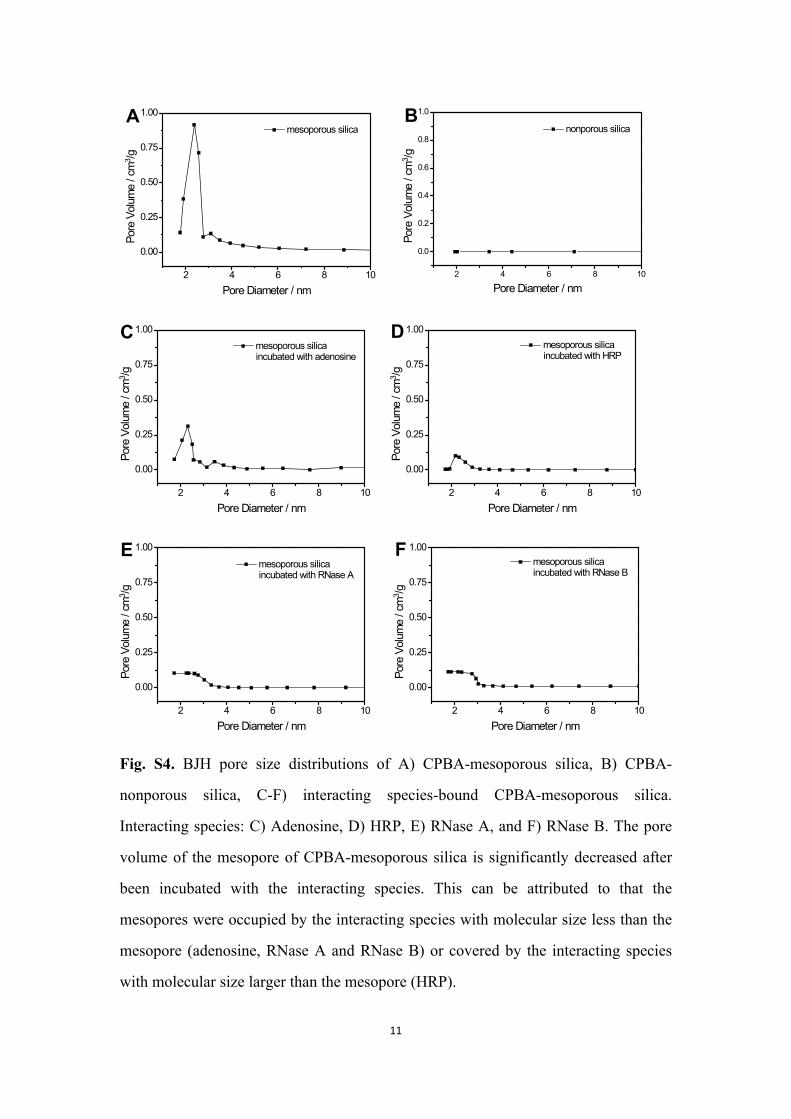
Fig. S4. BJH pore size distributions of A) CPBA-mesoporous silica, B) CPBA-
nonporous silica, C-F) interacting species-bound CPBA-mesoporous silica.
Interacting species: C) Adenosine, D) HRP, E) RNase A, and F) RNase B. The pore
volume of the mesopore of CPBA-mesoporous silica is significantly decreased after
been incubated with the interacting species. This can be attributed to that the
mesopores were occupied by the interacting species with molecular size less than the
mesopore (adenosine, RNase A and RNase B) or covered by the interacting species
with molecular size larger than the mesopore (HRP).

12
350 400 450 500
0
50
100
inte
nsity
wavelength
native RNase A RNase A after shaken for 12 h denatured RNase A
A
350 400 450 500
0
50
100
150
200
inte
nsity
wavelength
native RNase B RNase B after shaken for 12 h denatured RNase B
B
350 400 450 500
0
100
200
300
inte
nsity
wavelength
native HRP HRP after shaken for 12 h denatured HRP
C
0.0
0.1
0.2
0.3
0.4
0.5
abso
rban
ce a
t 650
nm
native HRP denatured HRPHRP after shaken for 12 h
D
Fig. S5. A-C) Fluorescence spectra for the test proteins at different status (native,
denatured, and after shaken for 12 h at room temperature) and D) UV-vis absorbance
of HRP at different status after TMB staining. Since the peaks for tryptophan of the
test proteins after shaken for 12 h at room temperature were all the same as those for
native proteins, it can be concluded that all the test proteins did not experience
apparent conformational change or denaturation during the shaking procedure.
Besides, the TMB staining test also confirmed that HRP did not experience apparent
conformational change or denaturation.

13
0.0 0.4 0.8 1.2 1.6 2.0
0
4
8
12
16
20
nonporous silicamesoporous silica
Qe
/ g/
mg
Concentration of Adenosine / mg/mL
A
20 30 40 50 60 7020
40
60
80
100
120
Kd = (3.60.73)M
R2 = 0.89Qmax = (4.90.21)mol/g
Kd = (0.710.11)M
R2 = 0.98Qmax = (62.71.5)mol/g
Qe/[S
] / m
L/g
Qe / mol/g
B
1000 1500 2000 2500 3000 3500 4000 45000.5
0.6
0.7
0.8
0.9
1.0
1.1
1.2
1.3
1.4
Kd = (5.30.2)mM
R2 = 0.98Qmax = (7.10.6)mol/g
Qe/[S
] / m
L/g
Qe / nmol/g
C
Fig. S6. A) Binding isotherms for the binding of adenosine with CPBA-mesoporous
(pore size 2.6 nm) and CPBA-nonporous silica in 30 mM phosphate buffer pH 8.5; B)
Scatchard plots for the bindings of adenosine with CPBA-mesoporous silica (pore
size 2.6 nm); C) Scatchard plots for the binding of adenosine with CPBA-nonporous
silica.

14
0.0 0.2 0.4 0.6 0.8 1.0
0.0
0.5
1.0
1.5
2.0
2.5
3.0
3.5
4.0
4.5
mesoporous silicanonporous silica
Qe /
g/
mg
Concentration of RNase A / mg/mL
A
0 100 200 300 400 500 600 700 800
0
200
400
600
800
1000
Qe/[S
] / m
L/g
Qe / nmol/g
Kd = (0.90.07)M
R2 = 0.92Qmax = (0.90.13)mol/g
B
0 5 10 15 20 25 30 35 400.5
0.6
0.7
0.8
0.9
1.0
1.1
1.2
1.3
Kd = (64.11.6)M
R2 = 0.99Qmax = (0.0750.014)mol/g
Qe/
[S] /
mL/
g
Qe / nmol/g
C
Fig. S7. A) Binding isotherms for the binding of RNase A with CPBA-mesoporous
silica (pore size 2.6 nm) and CPBA-nonporous silica in 30 mM phosphate buffer pH
8.5; B) Scatchard plots for the binding of RNase A with CPBA-mesoporous silica

15
(pore size 2.6 nm); C) Scatchard plots for the binding of RNase A with CPBA-
nonporous silica.
0.0 0.2 0.4 0.6 0.8 1.0
0
5
10
15
20
25
30
mesoporous silica nonporous silica
Qe /
g/
mg
Concentration of RNase B / mg/mL
A
0 200 400 600 800 1000 1200 1400 1600
100
200
300
400
500
600
700
800
900
Qe/[S
] / m
L/g
Qe / nmol/g
Kd = (1.370.15)M
R2 = 0.95Qmax = (0.990.06)mol/g
Kd = (10.41.3)M
R2 = 0.92Qmax = (0.210.07)mol/g
B

16
5 10 15 20 25 30 350.5
0.6
0.7
0.8
0.9
1.0
1.1
1.2
Kd=(63.35.1)M
R2=0.94Qmax=(0.080.02)mol/g
Qe/
[S] /
mL/
gQe / nmol/g
C
Fig. S8. A) Binding isotherms for the binding of RNase B with CPBA-mesoporous
silica (pore size 2.6 nm) and CPBA-nonporous silica in 30 mM phosphate buffer
containing 500mM NaCl pH 8.5; B) Scatchard plots for the bindings of RNase B with
CPBA-mesoporous silica (pore size 2.6 nm); C) Scatchard plots for the binding of
RNase B with CPBA-nonporous silica.
0.0 0.2 0.4 0.6 0.8 1.00
10
20
30
40
50
60
70
mesoporous silicanonporous silica
Qe /
g/
mg
Concentration of HRP / mg/mL
A

17
800 1000 1200 1400 160050
100
150
200
250
300
Qe/[S
] / m
L/g
Qe / nmol/g
BKd = (4.30.26)M
R2 = 0.97Qmax = (1.80.21)mol/g
10 20 30 40 50 60 70 80 90 100
4
5
6
7
8
Kd = (34.61.7)M
R2 = 0.96Qmax = (0.260.1)mol/g
Qe/[S]
/ m
L/g
Qe / nmol/g
C
Fig. S9. A) Binding isotherms for the binding of HRP with CPBA-mesoporous silica
(pore size 2.6 nm) and CPBA-nonporous silica in 30 mM phosphate buffer pH 8.5; B)
Scatchard plots for the binding of HRP with CPBA-mesoporous silica (pore size 2.6
nm); C) Scatchard plots for the binding of HRP with CPBA-nonporous silica.
0.0 0.1 0.2 0.3 0.4 0.5 0.6
0
5
10
15
20
25
30
35
mesoporous silica
Qe /
g/
mg
concentration of RNase B / mg/mL
A
18
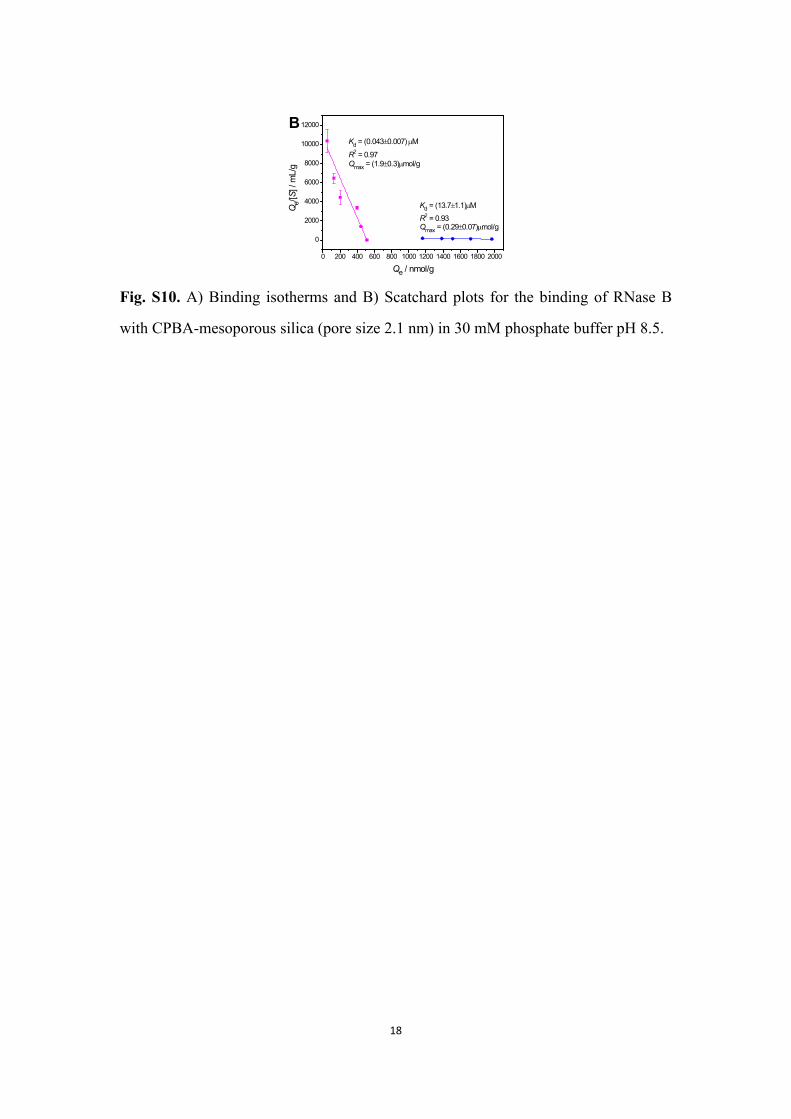
0 200 400 600 800 1000 1200 1400 1600 1800 2000
0
2000
4000
6000
8000
10000
12000
Kd = (13.71.1)M
R2 = 0.93Qmax = (0.290.07)mol/g
Kd = (0.0430.007)M
R2 = 0.97Qmax = (1.90.3)mol/g
Qe/[S]
/ m
L/g
Qe / nmol/g
B
Fig. S10. A) Binding isotherms and B) Scatchard plots for the binding of RNase B
with CPBA-mesoporous silica (pore size 2.1 nm) in 30 mM phosphate buffer pH 8.5.