Electronic Supplementary Information (ESI) for Nanoporous covalent ...

1
Electronic Supplementary Information (ESI)
One-pot synthesis of carbon-coated Ni5P4 nanoparticles and
CoP nanorods for high-rate and high-stability lithium-ion
batteries
Jun Jiang,a,b,c,d Chunde Wang,a,b,c,d Wei Li,a,b,c,d Qing Yang*,a,b,c,d
a Hefei National Laboratory of Physical Sciences at the Microscale (HFNL), University
of Science and Technology of China (USTC), Hefei 230026, Anhui, P. R. China. b Department of Chemistry, USTC, Hefei 230026, Anhui, P. R. China. c Laboratory of Nanomaterials for Energy Conversion (LNEC), USTC, Hefei 230026,
Anhui, P. R. China. d Synergetic Innovation Center of Quantum Information & Quantum Physics, USTC,
Hefei 230026, Anhui, P. R. China.
* Corresponding author. E-mail: [email protected]; Fax: +86-551-63606266; Tel:
+86-551-63600243.
Electronic Supplementary Material (ESI) for Journal of Materials Chemistry A.This journal is © The Royal Society of Chemistry 2015
2
1. EDX spectra for the as-prepared Ni5P4@C nanoparticles and CoP@C
nanorods.
Fig. S1. (a) EDX spectra for the as-prepared Ni5P4@C nanoparticles, and (b) EDX
spectra for the as-prepared CoP@C nanorods. The signal of Cu arises from the TEM
grids.
2. Table S1. C, H and N contents of the as-prepared Ni5P4@C and CoP@C
nanocomposites.
Sample C-content
(wt. %)
H-content
(wt. %)
N-content
(wt. %)
Ni5P4@C 18.65 1.24 0.07
CoP@C 9.72 1.70 0.08
3
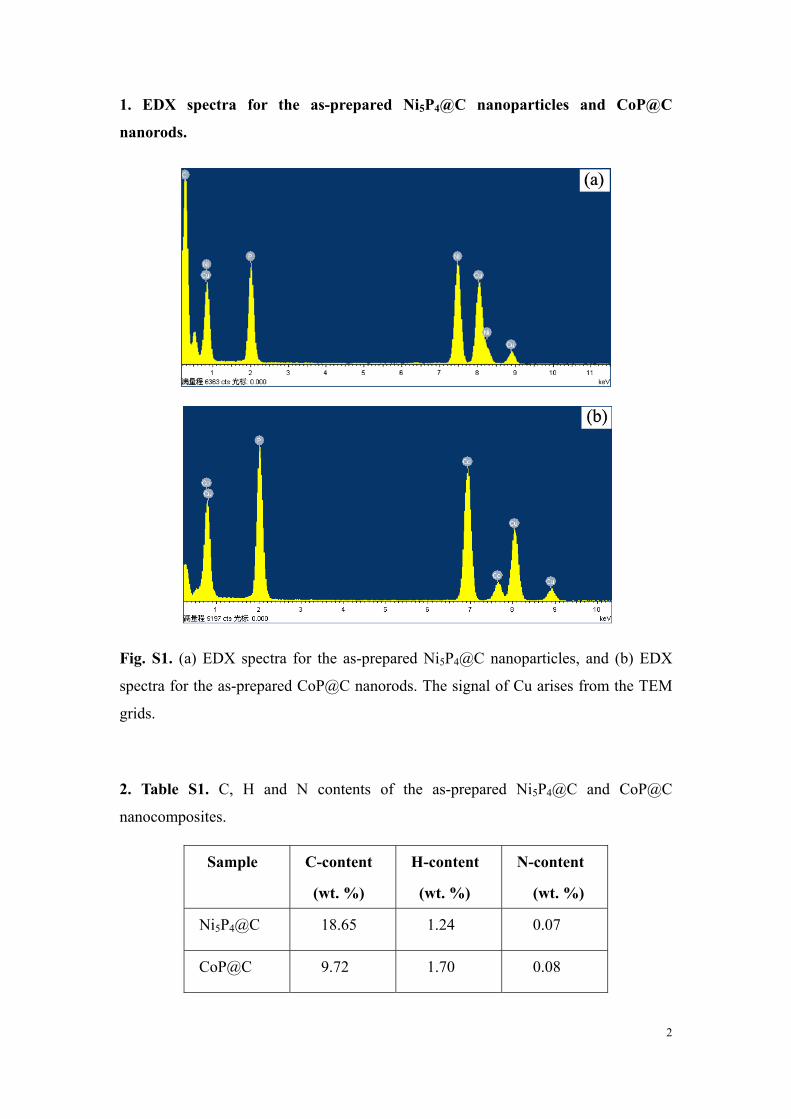
3. XPS for the as-prepared Ni5P4@C nanoparticles.
Fig. S2. (a) Survey, (b) Ni 2p, (c) P 2p and (d) C 1s XPS spectra collected for
Ni5P4@C nanoparticles.
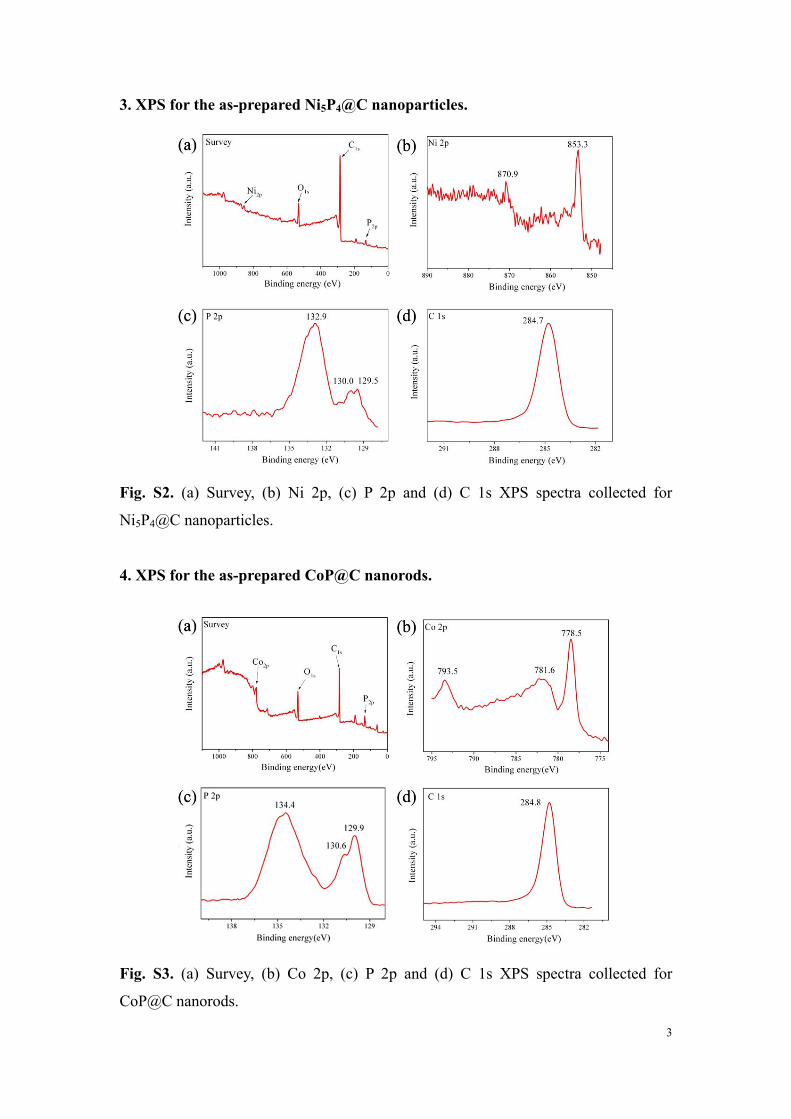
4. XPS for the as-prepared CoP@C nanorods.
Fig. S3. (a) Survey, (b) Co 2p, (c) P 2p and (d) C 1s XPS spectra collected for
CoP@C nanorods.
4
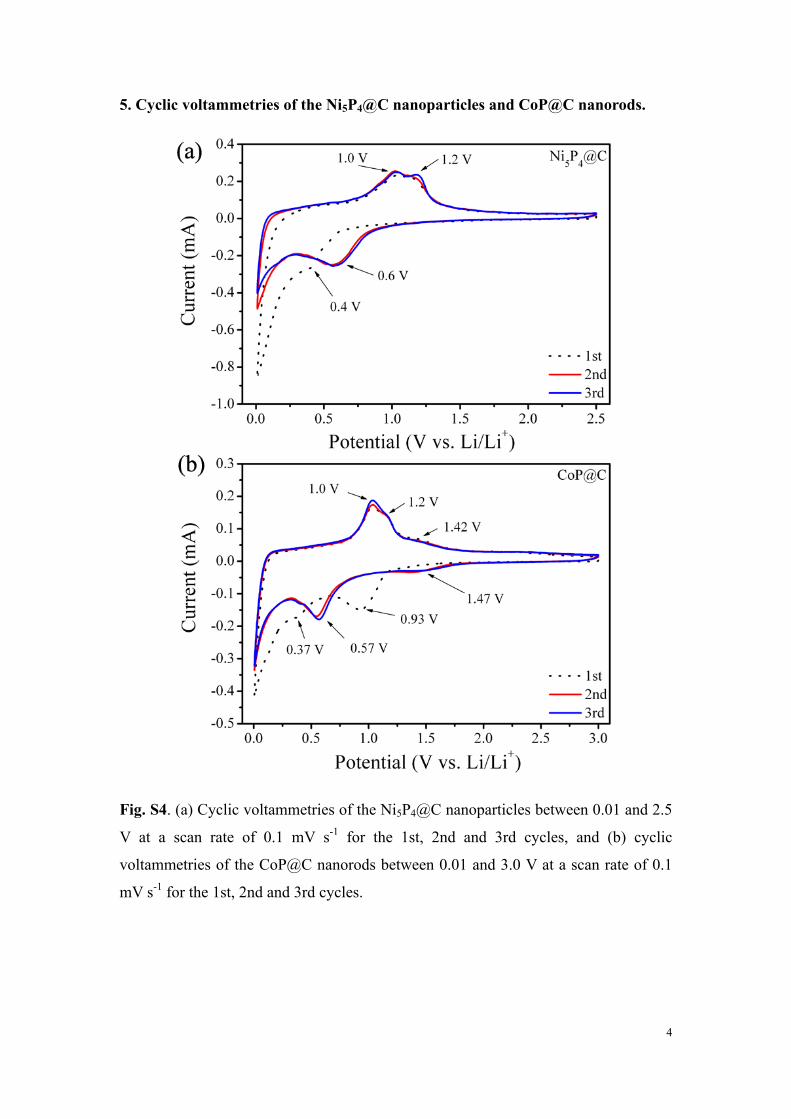
5. Cyclic voltammetries of the Ni5P4@C nanoparticles and CoP@C nanorods.
Fig. S4. (a) Cyclic voltammetries of the Ni5P4@C nanoparticles between 0.01 and 2.5
V at a scan rate of 0.1 mV s-1 for the 1st, 2nd and 3rd cycles, and (b) cyclic
voltammetries of the CoP@C nanorods between 0.01 and 3.0 V at a scan rate of 0.1
mV s-1 for the 1st, 2nd and 3rd cycles.

5
6. Table S2. Comparison the as-prepared Ni5P4@C nanoparticles and CoP@C
nanorods with previously reported transition-metal phosphide (TMP) structures.
Material Rate Reversible capacity based on the total mass of MP@C/mA h g−1
Reversible capacity based on the mass of MP/mA h g−1
Ref.
Ni5P4@C NPs 0.2C 1C 5C
490/100th cycle 370/200th cycle 339
612/100th cycle 462/200th cycle 424
This work
Ni5P4/C MPs 0.1C 3C
- -
644/50th cycle 357
16
CoP@C NRs 0.2C 1C 5C
579/100th cycle 469/200th cyce 340
654/100th cycle 530/200th cycle 384
This work
CoP@C NPs 0.2C 1C 5C
- - -
630/100th cycle 352 256
18
7. The phase stability of the Ni5P4@C nanoparticles and CoP@C nanorods at
high temperature.
In order to test the phase stability of the as-prepared products, we load the
as-prepared products in the sealed quartz tube and then annealing at 600 oC for 2h.
Fig. S5. XRD of the Ni5P4@C and CoP@C nanocomposites before/after annealing. (a)
Ni5P4@C at 600 oC, (b) Ni5P4@C at 370 oC, and (c) CoP@C at 600 oC, (d) CoP@C at
400 oC.
6
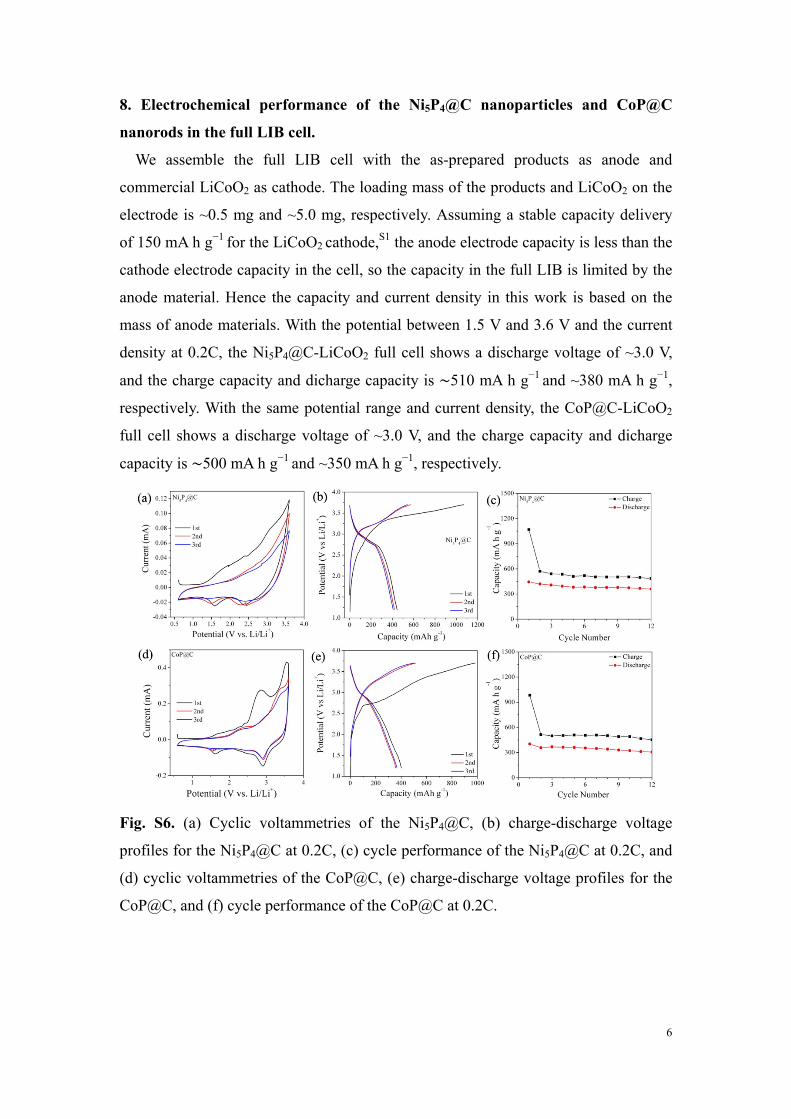
8. Electrochemical performance of the Ni5P4@C nanoparticles and CoP@C
nanorods in the full LIB cell.
We assemble the full LIB cell with the as-prepared products as anode and
commercial LiCoO2 as cathode. The loading mass of the products and LiCoO2 on the
electrode is ~0.5 mg and ~5.0 mg, respectively. Assuming a stable capacity delivery
of 150 mA h g−1 for the LiCoO2 cathode,S1 the anode electrode capacity is less than the
cathode electrode capacity in the cell, so the capacity in the full LIB is limited by the
anode material. Hence the capacity and current density in this work is based on the
mass of anode materials. With the potential between 1.5 V and 3.6 V and the current
density at 0.2C, the Ni5P4@C-LiCoO2 full cell shows a discharge voltage of ~3.0 V,
and the charge capacity and dicharge capacity is 510 mA h g−1 and ~380 mA h g−1,
respectively. With the same potential range and current density, the CoP@C-LiCoO2
full cell shows a discharge voltage of ~3.0 V, and the charge capacity and dicharge
capacity is 500 mA h g−1 and ~350 mA h g−1, respectively.
Fig. S6. (a) Cyclic voltammetries of the Ni5P4@C, (b) charge-discharge voltage
profiles for the Ni5P4@C at 0.2C, (c) cycle performance of the Ni5P4@C at 0.2C, and
(d) cyclic voltammetries of the CoP@C, (e) charge-discharge voltage profiles for the
CoP@C, and (f) cycle performance of the CoP@C at 0.2C.
7
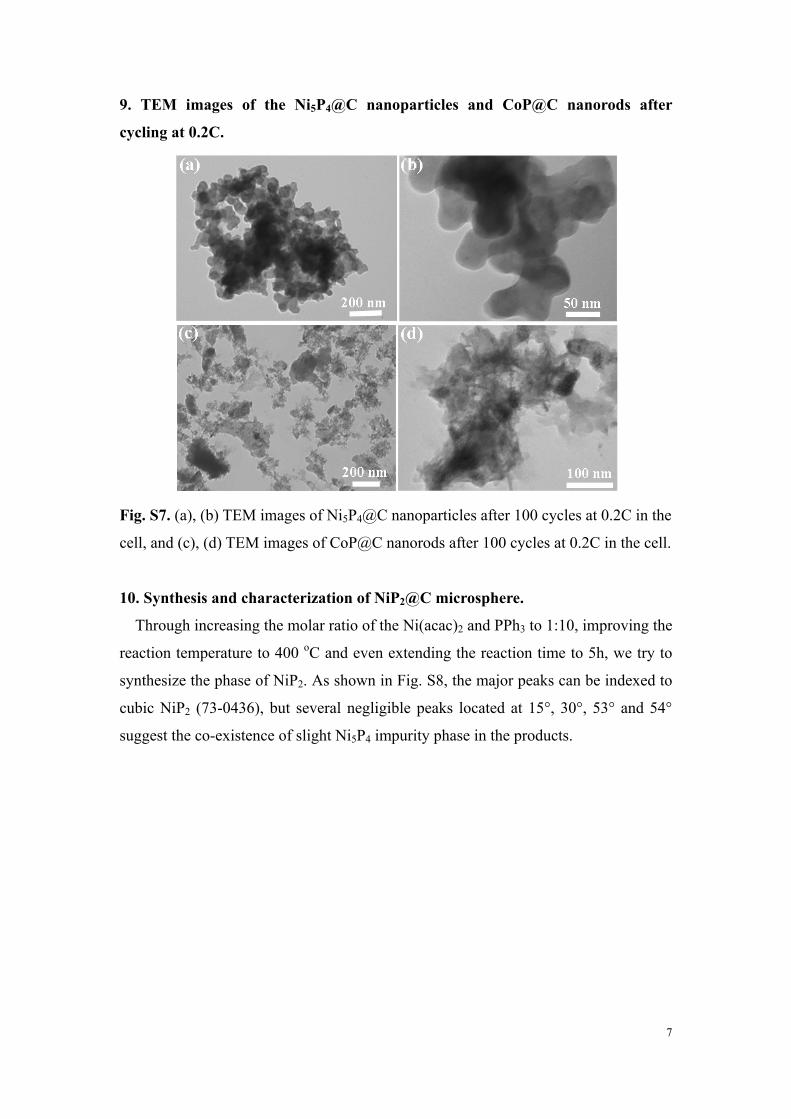
9. TEM images of the Ni5P4@C nanoparticles and CoP@C nanorods after
cycling at 0.2C.
Fig. S7. (a), (b) TEM images of Ni5P4@C nanoparticles after 100 cycles at 0.2C in the
cell, and (c), (d) TEM images of CoP@C nanorods after 100 cycles at 0.2C in the cell.
10. Synthesis and characterization of NiP2@C microsphere.
Through increasing the molar ratio of the Ni(acac)2 and PPh3 to 1:10, improving the
reaction temperature to 400 oC and even extending the reaction time to 5h, we try to
synthesize the phase of NiP2. As shown in Fig. S8, the major peaks can be indexed to
cubic NiP2 (73-0436), but several negligible peaks located at 15°, 30°, 53° and 54°
suggest the co-existence of slight Ni5P4 impurity phase in the products.

8
Fig. S8. (a) XRD, (b) Raman spectra, (c) SEM image and (d) TEM image of the
as-prepared NiP2@C composites.
Reference
S1. J. Liang, X. Li, Z. Hou, T. Zhang, Y. Zhu, X. Yan and Y. Qian, Chem. Mater. 2015,
27, 4156-4164.