Electronic Supplementary Information · 2018-07-27 · S1 Electronic Supplementary Information to...
14
S1 Electronic Supplementary Information to the manuscript AS1411-decorated niosomes as effective nanocarriers for Ru(III)-based drugs in anticancer strategies Claudia Riccardi, a Carme Fàbrega, b Santiago Grijalvo, b Giuseppe Vitiello, c,d Gerardino d’Errico, a,c Ramon Eritja, b,* Daniela Montesarchio a,* a Department of Chemical Sciences, University of Naples Federico II, Via Cintia 21, I-80126, Napoli, Italy b Institute for Advanced Chemistry of Catalonia (IQAC-CSIC), Jordi Girona 18-26, E-08034 Barcelona, Spain. Networking Center on Bioengineering, Biomaterials and Nanomedicine (CIBER- BBN), Jordi Girona 18-26, E-08034 Barcelona, Spain. c CSGI – Center for Colloids and Surface Science, Italy d Department of Chemical Engineering, of Materials and Industrial Production, University of Naples Federico II, Piazzale Tecchio 80, I-80125 Napoli,Italy *Corresponding authors. E-mail addresses: [email protected] (R. Eritja); [email protected] (D. Montesarchio) Electronic Supplementary Material (ESI) for Journal of Materials Chemistry B. This journal is © The Royal Society of Chemistry 2018
Transcript of Electronic Supplementary Information · 2018-07-27 · S1 Electronic Supplementary Information to...
S1
Electronic Supplementary Information
to the manuscript
AS1411-decorated niosomes as effective nanocarriers for
Ru(III)-based drugs in anticancer strategies
Claudia Riccardi,a Carme Fàbrega,b Santiago Grijalvo,b
Giuseppe Vitiello,c,d Gerardino d’Errico,a,c Ramon Eritja,b,* Daniela Montesarchioa,*
aDepartment of Chemical Sciences, University of Naples Federico II, Via Cintia 21, I-80126,
Napoli, Italy
bInstitute for Advanced Chemistry of Catalonia (IQAC-CSIC), Jordi Girona 18-26, E-08034
Barcelona, Spain. Networking Center on Bioengineering, Biomaterials and Nanomedicine (CIBER-
BBN), Jordi Girona 18-26, E-08034 Barcelona, Spain.
cCSGI – Center for Colloids and Surface Science, Italy
dDepartment of Chemical Engineering, of Materials and Industrial Production, University of
Naples Federico II, Piazzale Tecchio 80, I-80125 Napoli,Italy
*Corresponding authors. E-mail addresses:
[email protected] (R. Eritja);
[email protected] (D. Montesarchio)
Electronic Supplementary Material (ESI) for Journal of Materials Chemistry B.This journal is © The Royal Society of Chemistry 2018

S2
Table of contents
Scheme S1. Synthesis and characterization of HoThyRu pag. S3
Scheme S2. Synthesis and characterization of BnO-HEG acetic acid pag. S5
Table S1. Concentration of niosome and AS1411 oligonucleotide in AS1411/niosome
formulations at different N/P charge ratios pag. S6
Table S2. Zeta potential values (mV) of AS1411/niosome formulations at different
N/P charge ratios pag. S7
Table S3. Z-average size (r., nm) and associated polydispersity index (PdI) values
determined for AS1411/niosome formulations at different N/P charge ratios pag. S8
Table S4. Concentration of all the components in niosome formulations at the
selected 1:12 N/P charge ratio pag. S9
Figure S1. Size distribution by intensity of HoThyRu in PBS solution pag. S10
Figure S2. TEM images of unfunctionalized niosomes pag. S11
Figure S3. Molecular structures of (a) 5-DSA and (b) 16-DSA spin probes used in
EPR analyses pag. S12
Table S5. Z-average size (r., nm) and corresponding PdI, reported as a function of
time for all the formulations at the different concentrations analyzed pag. S13
Figure S4. Normalized cell viability of HoThyRu, AS1411 and unfunctionalized
niosome in HEK293T, HeLa, HCC2998 and HTB-38 cancer cell lines at different
concentrations pag. S14

S3
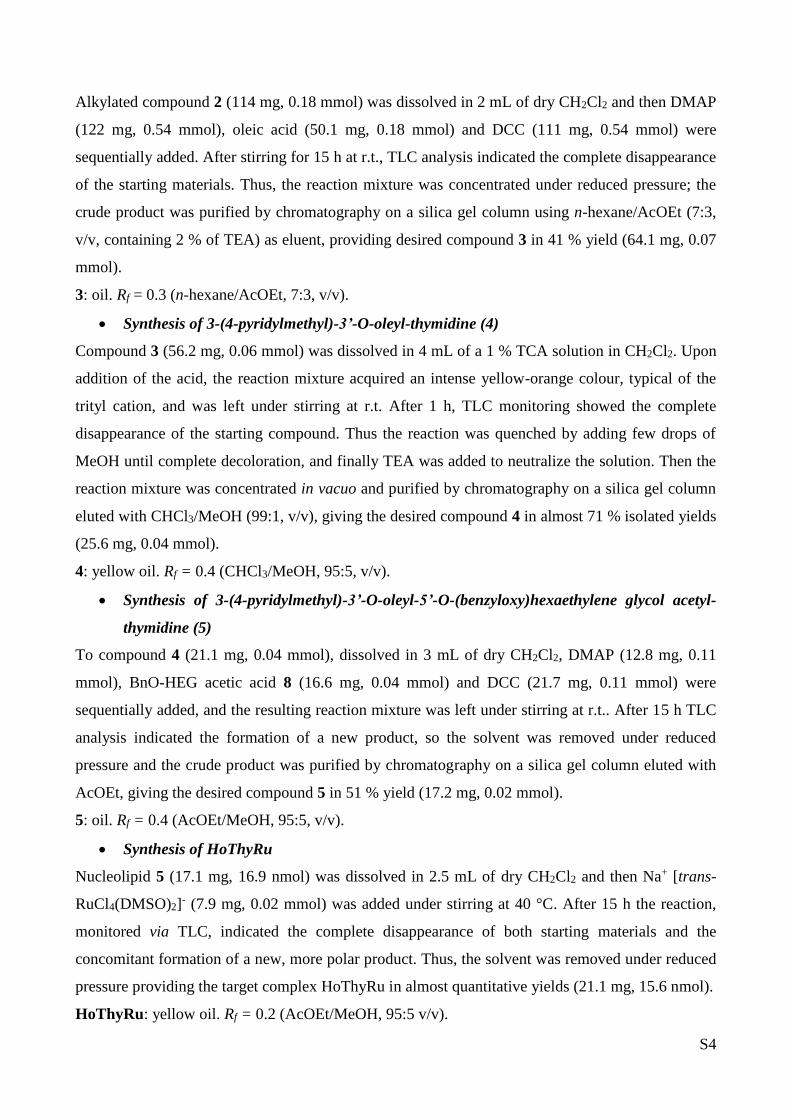
Synthesis and characterization of HoThyRu
Scheme S1. Synthetic procedure for the preparation of the nucleolipidic Ru(III)-complex
HoThyRu. For all the synthesized compounds, the spectroscopic (1H and 13C) and spectrometric
(ESI-MS) data were in perfect agreement with literature data (G. Mangiapia, G. D’Errico, L.
Simeone, C. Irace, A. Radulescu, A. Di Pascale, A. Colonna, D. Montesarchio and L. Paduano,
Biomaterials, 2012, 33, 3770–3782).
Synthesis of 3-(4-pyridylmethyl)-5’-O-(4,4′-dimethoxytriphenylmethyl)-thymidine (2)
5’-O-(4,4′-dimethoxytriphenylmethyl)thymidine 1 (148 mg, 0.27 mmol) was dissolved in 6 mL of
dry DMF. Cs2CO3 (531 mg, 1.63 mmol) and 4-(bromomethyl)pyridine hydrobromide (275 mg, 1.08
mmol) were then added to the reaction mixture, left at 60 °C under stirring. After 20 h, TLC
analysis indicated the presence of the desired product and the reaction was quenched by removing
the solvent under reduced pressure. First, a CH2Cl2/H2O extraction was performed to remove the
excess reagents. Then, the crude product was purified by chromatography on a silica gel column
using AcOEt/MeOH (97:3, v/v, containing 2 % of TEA), as eluent, giving desired compound 2 in
67 % yield (114 mg, 0.18 mmol).
2: oil. Rf = 0.5 (AcOEt/MeOH, 95:5, v/v).
Synthesis of 3-(4-pyridylmethyl)-3’-O-oleyl-5’-O-(4,4′-dimethoxytriphenylmethyl)-
thymidine (3)
S4
Alkylated compound 2 (114 mg, 0.18 mmol) was dissolved in 2 mL of dry CH2Cl2 and then DMAP
(122 mg, 0.54 mmol), oleic acid (50.1 mg, 0.18 mmol) and DCC (111 mg, 0.54 mmol) were
sequentially added. After stirring for 15 h at r.t., TLC analysis indicated the complete disappearance
of the starting materials. Thus, the reaction mixture was concentrated under reduced pressure; the
crude product was purified by chromatography on a silica gel column using n-hexane/AcOEt (7:3,
v/v, containing 2 % of TEA) as eluent, providing desired compound 3 in 41 % yield (64.1 mg, 0.07
mmol).
3: oil. Rf = 0.3 (n-hexane/AcOEt, 7:3, v/v).
Synthesis of 3-(4-pyridylmethyl)-3’-O-oleyl-thymidine (4)
Compound 3 (56.2 mg, 0.06 mmol) was dissolved in 4 mL of a 1 % TCA solution in CH2Cl2. Upon
addition of the acid, the reaction mixture acquired an intense yellow-orange colour, typical of the
trityl cation, and was left under stirring at r.t. After 1 h, TLC monitoring showed the complete
disappearance of the starting compound. Thus the reaction was quenched by adding few drops of
MeOH until complete decoloration, and finally TEA was added to neutralize the solution. Then the
reaction mixture was concentrated in vacuo and purified by chromatography on a silica gel column
eluted with CHCl3/MeOH (99:1, v/v), giving the desired compound 4 in almost 71 % isolated yields
(25.6 mg, 0.04 mmol).
4: yellow oil. Rf = 0.4 (CHCl3/MeOH, 95:5, v/v).
Synthesis of 3-(4-pyridylmethyl)-3’-O-oleyl-5’-O-(benzyloxy)hexaethylene glycol acetyl-
thymidine (5)
To compound 4 (21.1 mg, 0.04 mmol), dissolved in 3 mL of dry CH2Cl2, DMAP (12.8 mg, 0.11
mmol), BnO-HEG acetic acid 8 (16.6 mg, 0.04 mmol) and DCC (21.7 mg, 0.11 mmol) were
sequentially added, and the resulting reaction mixture was left under stirring at r.t.. After 15 h TLC
analysis indicated the formation of a new product, so the solvent was removed under reduced
pressure and the crude product was purified by chromatography on a silica gel column eluted with
AcOEt, giving the desired compound 5 in 51 % yield (17.2 mg, 0.02 mmol).
5: oil. Rf = 0.4 (AcOEt/MeOH, 95:5, v/v).
Synthesis of HoThyRu
Nucleolipid 5 (17.1 mg, 16.9 nmol) was dissolved in 2.5 mL of dry CH2Cl2 and then Na+ [trans-
RuCl4(DMSO)2]- (7.9 mg, 0.02 mmol) was added under stirring at 40 °C. After 15 h the reaction,
monitored via TLC, indicated the complete disappearance of both starting materials and the
concomitant formation of a new, more polar product. Thus, the solvent was removed under reduced
pressure providing the target complex HoThyRu in almost quantitative yields (21.1 mg, 15.6 nmol).
HoThyRu: yellow oil. Rf = 0.2 (AcOEt/MeOH, 95:5 v/v).

S5
Synthesis and characterization of BnO-HEG acetic acid
OH
O
OO
OO
OO
O
OHO
OO
OO
O
O
OO
OO
OO
O
OHO
OO
OO
HO
O
NaH, BnBr, THF, 12 h, r.t.
NaH, BrCH2COOt-Bu, THF, 12 h, r.t.
HCOOH, 2 h, r.t.
6
7
8
Scheme S2. Synthetic procedure for the preparation of BnO-HEG acetic acid (Bn = benzyl group).
For all the synthesized compounds, the spectroscopic (1H and 13C) and spectrometric (ESI-MS) data
were in perfect agreement with literature data (G. Mangiapia, et al. Biomaterials, 2012, 33, 3770–
3782).
Synthesis of (monobenzyloxy)hexaethylene glycol (6)
Hexaethylene glycol (2.0 g, 7.10 mmol) was dissolved in 8 mL of dry THF and NaH 60 % p.p. (170
mg, 4.25 mmol) and then benzylbromide (3.37 mL, 22.8 mmol) were sequentially added. The
reaction mixture was stirred at r.t. for 12 h, then MeOH (1 mL) was added and the solvent removed
in vacuo. The crude product was dissolved in CHCl3, filtered on celite and then purified by
chromatography on a silica gel column using AcOEt/MeOH (9:1, v/v) as eluent, yielding the
desired compound 6 in 65 % yields (1.7 g, 4.60 mmol).
6: oil. Rf = 0.5 (AcOEt/MeOH, 9:1, v/v).
Synthesis of tert-butyl (monobenzyloxy)hexaethylene glycol acetate (7)
Alcohol 6 (155 mg, 0.42 mmol) was dissolved in 1 mL of dry THF and NaH 60 % p.p. (33.0 mg,
0.83 mmol) and tert-butyl bromoacetate (154 μL, 1.01 mmol) were sequentially added. The reaction
mixture was stirred at r.t. for 12 h, then few drops of MeOH were added and the solvent removed in
vacuo. The crude product was dissolved in CHCl3, filtered on celite and then purified by
chromatography on a silica gel column eluted with AcOEt, yielding the desired compound 7 in 86
% yields (175 mg, 0.36 mmol).
7: oil. Rf = 0.6 (AcOEt/MeOH, 95:5, v/v).
Synthesis of (monobenzyloxy)hexaethylene glycol acetic acid (8)
Ester 7 (95.0 mg, 0.19 mmol) was dissolved in 1.5 mL of HCOOH and stirred at r.t. for 2 h. The
solvent was then removed in vacuo and the residue was coevaporated three times with CHCl3 (3 x 3
mL), yielding the desired compound 8 in almost quantitative yields (82.0 mg, 0.19 mmol).
8: oil. Rf = 0.2 (AcOEt/MeOH, 95:5, v/v).
S6
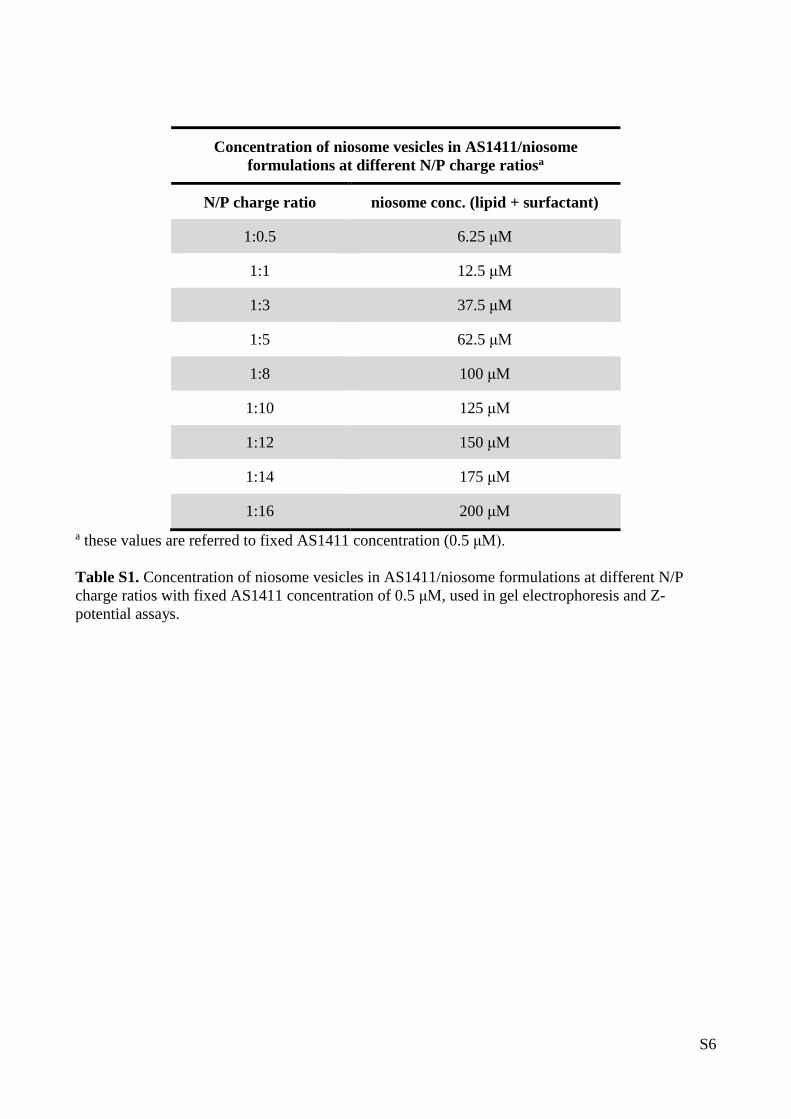
Concentration of niosome vesicles in AS1411/niosome
formulations at different N/P charge ratiosa
N/P charge ratio niosome conc. (lipid + surfactant)
1:0.5 6.25 μM
1:1 12.5 μM
1:3 37.5 μM
1:5 62.5 μM
1:8 100 μM
1:10 125 μM
1:12 150 μM
1:14 175 μM
1:16 200 μM
a these values are referred to fixed AS1411 concentration (0.5 μM).
Table S1. Concentration of niosome vesicles in AS1411/niosome formulations at different N/P
charge ratios with fixed AS1411 concentration of 0.5 μM, used in gel electrophoresis and Z-
potential assays.

S7
N/P charge ratio Z-potential (mV) ± SD
AS1411 -10.0± 1.5
1:0.5 -9.3 ± 0.8
1:1 1.0 ± 0.1
1:5 4.3 ± 0.7
1:8 10.7 ± 1.2
1:10 7.9 ± 1.6
1:12 12.7 ± 0.9
1:14 10.4 ± 0.9
1:16 11.6 ± 1.6
Table S2. Zeta potential values (mV) of AS1411/niosome formulations at different N/P charge
ratios. Data are reported as an average of three measurements (mean ± SD).

S8
N/P charge ratio Z-average (r. nm) ± SD PdI± SD
1:1 130 ± 20 0.39 ± 0.09
1:3 116 ± 2 0.36 ± 0.01
1:5 98 ± 4 0.40 ± 0.11
1:8 91.0 ± 0.2 0.27 ± 0.01
1:10 86.5 ± 0.1 0.27 ± 0.01
1:12 83.5 ± 0.5 0.34 ± 0.05
1:14 75.7 ± 0.1 0.35 ± 0.01
1:16 60.4 ± 0.6 0.38 ± 0.01
Table S3. Z-average size (r., nm) and associated polydispersity index (PdI) values determined for
AS1411/niosome formulations at different N/P charge ratios. Data are reported as an average of
three measurements (mean ± SD).

S9
Concentration of niosome components in AS1411/niosome
1:12 N/P charge ratio formulations
niosome HoThyRu AS1411
17.5 mMa,c 672 μM 58 μM
15 mMb 576 μM 50 μM
3.5 mMc 135 μM 12 μM
175 μMc 6.7 μM 585 nM
150 μMd 5.8 μM 500 nM
125 μMd 4.8 μM 416 nM
100 μMd 3.8 μM 333 nM
75 μM d 2.9 μM 250 nM
50 μMd 1.9 μM 166 nM
25 μMd 0.95 μM 83 nM
15 μMd 0.58 μM 50 nM
7.5 μMd 285 nM 33 nM
3.5 μM d 133 nM 16 nM
1.25 μM d 48 nM 8.3 nM
Table S4. Concentrations of niosome vesicles, HoThyRu and AS1411 in niosome formulations at
the selected 1:12 oligonucleotide/lipid N/P charge ratio. aconcentration used in EPR measurements;
bconcentration used in NMR measurements;
cconcentration used in DLS particle size and storage stability measurements;
dconcentration used in biological assays.

S10
Figure S1. Size distribution by intensity of a 672 μM HoThyRu solution in PBS as a freshly
prepared sample (up) and after one week storage at 4° C (down), reported as a representative
example.
HoThyRu
ca. 120 nmca. 25 nm
ca. 80 nm
1 week storage
10 100 1000
Size (r.nm)
Inte
nsi
ty d
istr
ibu
tion

S11
Figure S2. TEM images of unfunctionalized niosomes (cationic lipid and polysorbate 80 in 3:1
molar ratio); original magnification 29.000× and 43.000× respectively for panels a and b.
a) b)
c)

S12
Figure S3. Molecular structures of (a) 5-DSA and (b) 16-DSA spin probes used in EPR
measurements. DSA = doxyl stearic acid.
a) b)
5-DSA 16-DSA
S13
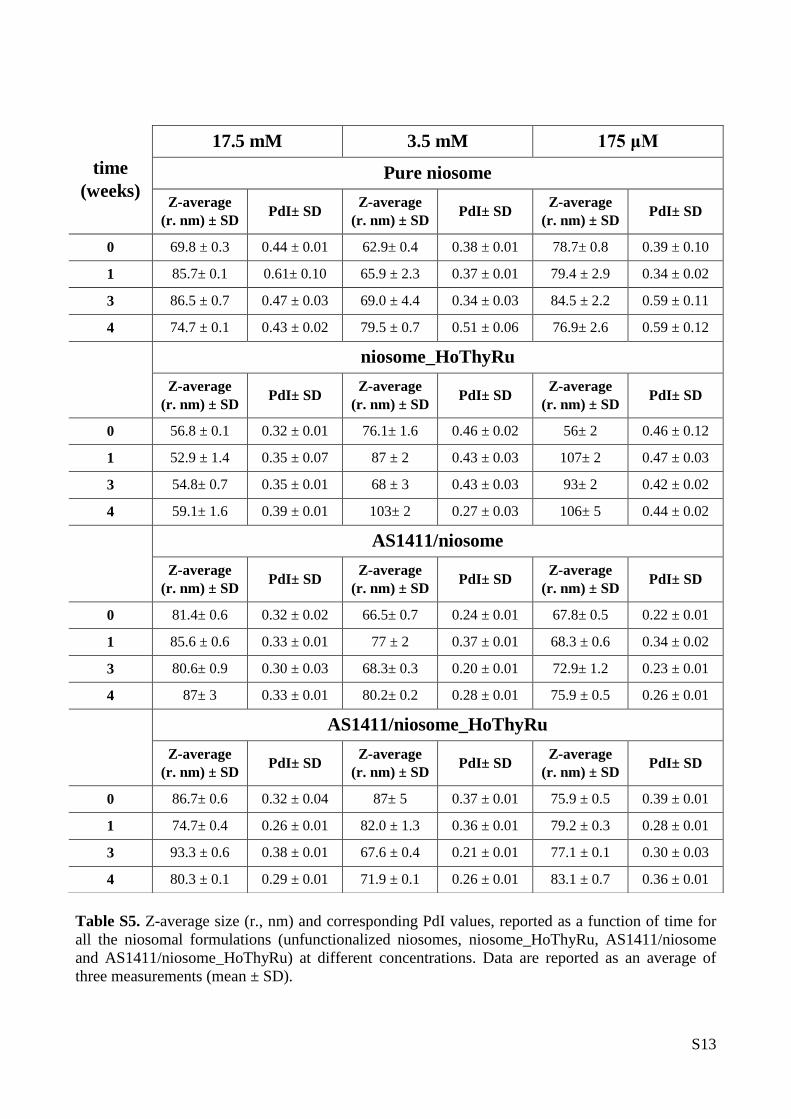
Table S5. Z-average size (r., nm) and corresponding PdI values, reported as a function of time for
all the niosomal formulations (unfunctionalized niosomes, niosome_HoThyRu, AS1411/niosome
and AS1411/niosome_HoThyRu) at different concentrations. Data are reported as an average of
three measurements (mean ± SD).
time
(weeks)
17.5 mM 3.5 mM 175 μM
Pure niosome
Z-average
(r. nm) ± SD PdI± SD
Z-average
(r. nm) ± SD PdI± SD
Z-average
(r. nm) ± SD PdI± SD
0 69.8 ± 0.3 0.44 ± 0.01 62.9± 0.4 0.38 ± 0.01 78.7± 0.8 0.39 ± 0.10
1 85.7± 0.1 0.61± 0.10 65.9 ± 2.3 0.37 ± 0.01 79.4 ± 2.9 0.34 ± 0.02
3 86.5 ± 0.7 0.47 ± 0.03 69.0 ± 4.4 0.34 ± 0.03 84.5 ± 2.2 0.59 ± 0.11
4 74.7 ± 0.1 0.43 ± 0.02 79.5 ± 0.7 0.51 ± 0.06 76.9± 2.6 0.59 ± 0.12
niosome_HoThyRu
Z-average
(r. nm) ± SD PdI± SD
Z-average
(r. nm) ± SD PdI± SD
Z-average
(r. nm) ± SD PdI± SD
0 56.8 ± 0.1 0.32 ± 0.01 76.1± 1.6 0.46 ± 0.02 56± 2 0.46 ± 0.12
1 52.9 ± 1.4 0.35 ± 0.07 87 ± 2 0.43 ± 0.03 107± 2 0.47 ± 0.03
3 54.8± 0.7 0.35 ± 0.01 68 ± 3 0.43 ± 0.03 93± 2 0.42 ± 0.02
4 59.1± 1.6 0.39 ± 0.01 103± 2 0.27 ± 0.03 106± 5 0.44 ± 0.02
AS1411/niosome
Z-average
(r. nm) ± SD PdI± SD
Z-average
(r. nm) ± SD PdI± SD
Z-average
(r. nm) ± SD PdI± SD
0 81.4± 0.6 0.32 ± 0.02 66.5± 0.7 0.24 ± 0.01 67.8± 0.5 0.22 ± 0.01
1 85.6 ± 0.6 0.33 ± 0.01 77 ± 2 0.37 ± 0.01 68.3 ± 0.6 0.34 ± 0.02
3 80.6± 0.9 0.30 ± 0.03 68.3± 0.3 0.20 ± 0.01 72.9± 1.2 0.23 ± 0.01
4 87± 3 0.33 ± 0.01 80.2± 0.2 0.28 ± 0.01 75.9 ± 0.5 0.26 ± 0.01
AS1411/niosome_HoThyRu
Z-average
(r. nm) ± SD PdI± SD
Z-average
(r. nm) ± SD PdI± SD
Z-average
(r. nm) ± SD PdI± SD
0 86.7± 0.6 0.32 ± 0.04 87± 5 0.37 ± 0.01 75.9 ± 0.5 0.39 ± 0.01
1 74.7± 0.4 0.26 ± 0.01 82.0 ± 1.3 0.36 ± 0.01 79.2 ± 0.3 0.28 ± 0.01
3 93.3 ± 0.6 0.38 ± 0.01 67.6 ± 0.4 0.21 ± 0.01 77.1 ± 0.1 0.30 ± 0.03
4 80.3 ± 0.1 0.29 ± 0.01 71.9 ± 0.1 0.26 ± 0.01 83.1 ± 0.7 0.36 ± 0.01

S14
Figure S4. Normalized cell viability for AS1411, HoThyRu and unfunctionalized niosome in the
four indicated cell lines. Cells were treated with increasing concentrations of the three tested
samples ranging from 1.25 to 150 µM. a) HEK293T, b) HeLa, c) HCC2998 and d) HTB-38. Data
are reported as mean values ± SD (error bar), for four independent experiments in triplicate (n =
15). All data are normalized to PBS used as control.