Electronic structure investigations of transition metal...
74
ACTA UNIVERSITATIS UPSALIENSIS UPPSALA 2017 Digital Comprehensive Summaries of Uppsala Dissertations from the Faculty of Science and Technology 1541 Electronic structure investigations of transition metal complexes through X-ray spectroscopy MEIYUAN GUO ISSN 1651-6214 ISBN 978-91-513-0035-1 urn:nbn:se:uu:diva-328072
Transcript of Electronic structure investigations of transition metal...
ACTAUNIVERSITATIS
UPSALIENSISUPPSALA
2017
Digital Comprehensive Summaries of Uppsala Dissertationsfrom the Faculty of Science and Technology 1541
Electronic structure investigationsof transition metal complexesthrough X-ray spectroscopy
MEIYUAN GUO
ISSN 1651-6214ISBN 978-91-513-0035-1urn:nbn:se:uu:diva-328072
Dissertation presented at Uppsala University to be publicly examined in Polhemssalen,Ång/10134, Ångströmlaboratoriet, Lägerhyddsvägen 1, Uppsala, Friday, 6 October 2017 at09:30 for the degree of Doctor of Philosophy. The examination will be conducted in English.Faculty examiner: Hélène Bolvin (The Laboratoire de Chimie et Physique Quantiques(LCPQ)).
AbstractGuo, M. 2017. Electronic structure investigations of transition metal complexes throughX-ray spectroscopy. Digital Comprehensive Summaries of Uppsala Dissertations from theFaculty of Science and Technology 1541. 73 pp. Uppsala: Acta Universitatis Upsaliensis.ISBN 978-91-513-0035-1.
Catalysts based on the first-row (3d) transition metals are commonly seen in chemical andbiological reactions. To understand the role of the transition metal in the catalyst, the elementspecific technique core level spectroscopy is used to probe the electronic structure and geometricproperties centered around the metal site. Different types of X-ray spectra can be applied toprobe the metal 3d character orbitals involved in reactions, which make it possible to identifyand characterize the reactive sites of samples in different forms. A detailed interpretation andunderstanding of the different X-ray spectra requires a unified method which can be used tomodel different types of X-ray spectra, e.g., soft and hard X-rays. In this thesis, theoreticalinvestigations of the electronic structures of 3d transition metal complexes through X-rayspectroscopy are presented. The restricted active space method (RAS) is used to successfullyreproduce different types of X-ray spectra by including all important spectral effects: multipletstructures, spin-orbit coupling, charge-transfer excitations, ligand field splitting and 3d-4porbital hybridization. Different prototypes of molecules are adopted to test the applicability ofthe RAS theory.
The metal L edge X-ray absorption (XAS) spectra of low spin complexes [Fe(CN)6]n and[Fe(P)(ImH)2]n in ferrous and ferric oxidation state are discussed. The RAS calculations on ironL edge spectra of these comparing complexes have been performed to fingerprint the oxidationstates of metal ion, and different ligand environments. The Fe(P) system has several low-lyingspin states in the ground state, which is used as a model to identify unknown species by theirspectroscopic fingerprints through RAS spectra simulations. To pave the route of understandingthe electronic structure of oxygen evolution complex of Mn4CaO5 cluster, the MnII(acac)2 andMnIII(acac)3 are adopted as prototypical Mn-complexes. The 3d partial fluorescence yield-XASare employed on the Mn L-edge in solution. Combining experiments and RAS calculations,primary questions related to the oxidation state and spin state are discussed.
The first application to simulate the metal K pre-edge XAS of mono-iron complexes andiron dimer using RAS method beyond the electric dipole is completed by implementing theapproximate origin independent calculations for the intensities. The K pre-edge spectrum ofcentrosymmetric complex [FeCl6]n– ferrous state is discussed as s and a donor model systems.The intensity of the K pre-edge increases significantly if the centrosymmetric environment isbroken, e:g:, when going from a six-coordinate to the four-coordinate site in [FeCl4]n. Distortionsfrom centrosymmetry allow for 3d-4p orbital hybridization, which gives rise to electric dipole-allowed transitions in the K pre-edge region. In order to deliver ample electronic structure detailswith high resolution in the hard X-ray energy range, the two-photon 1s2p resonant inelastic X-ray scattering process is employed. Upon the above successful applications of one-photon ironL edge and K pre-edge spectra, the RAS method is extended to simulate and interpret the 1s2presonant inelastic X-ray scattering spectra of [Fe(CN)6]n in ferrous and ferric oxidation states.The RAS applications on X-ray simulations are not restricted to the presented spectra in thethesis, it can be applied to the photon process of interest by including the corresponding coreand valence orbitals of the sample.
Keywords: transition metal complexes, x-ray spectroscopy, electronic structures
Meiyuan Guo, Department of Chemistry - Ångström, Theoretical Chemistry, Box 518,Uppsala University, SE-75120 Uppsala, Sweden.
© Meiyuan Guo 2017ISSN 1651-6214ISBN 978-91-513-0035-1urn:nbn:se:uu:diva-328072 (http://urn.kb.se/resolve?urn=urn:nbn:se:uu:diva-328072)

Home is behind, the world ahead,And there are many paths to tread
Through shadows to the edge of night,Until the stars are all alight.
Then world behind and home ahead,We will wander back and home to bed.
Mist and twilight, cloud and shade,Away shall fade! Away shall fade!
J.R.R. Tolkien

List of papers
This thesis is based on the following papers.
I Restricted active space calculations of L-edge X-ray absorption
spectra: From molecular orbitals to multiplet states
Rahul V Pinjari, Mickaël G Delcey, Meiyuan Guo, Michael Odeliusand Marcus Lundberg. J. Chem. Phys, 141,124116 (2014), DOI:10.1063/1.4896373
II Cost and sensitivity of restricted active space calculations of metal
L-edge X-ray absorption spectra
Rahul V Pinjari, Mickaël G Delcey, Meiyuan Guo, Michael Odeliusand Marcus Lundberg. J. Comput. Chem, 37, 477 (2016), DOI:10.1002/jcc.24237
III Fingerprinting electronic structures of heme using theoretical
modeling of L-edge X-ray absorption spectra
Meiyuan Guo, Erik Källman, Rahul V Pinjari, and Marcus Lundberg.Manuscript.
IV Probing the oxidation state: A case study of MnII(acac)2 and
MnIII(acac)3 on how charge and spin densities determine Mn
L-edge X-ray absorption energies
Markus Kubin*, Meiyuan Guo*, Thomas Kroll, Heike Löchel, ErikKällman, Michael L.Baker, Rolf Mitzner, Jan Kern, AlexanderFöhlisch, Alexei Erko, Uwe Bergmann, Vittal Yachandra, Junko Yano,Marcus Lundberg, Philippe Wernet. Manuscript.
V Simulations of iron K pre-edge X-ray absorption spectra using the
restricted active space method
Meiyuan Guo, Lasse Kragh Sørensen, Mickaël G Delcey, Rahul VPinjari and Marcus Lundberg. Phys. Chem. Chem. Phys, 18, 3250(2016), DOI: 10.1039/C5CP07487H
VI Applications to metal K pre-edges of transition metal dimers
illustrate the approximate origin independence for the intensities
in the length representation.
Lasse Kragh Sørensen, Meiyuan Guo, Roland Lindh, and MarcusLundberg. Mol. Phys, 115, 174 (2016), DOI:10.1080/00268976.2016.1225993

VII Molecular orbital simulations of metal 1s2p resonant inelastic
X-ray scattering
Meiyuan Guo, Erik Källman, Lasse Kragh Sørensen, Mickaël GDelcey, Rahul V Pinjari and Marcus Lundberg. J. Phys. Chem. A, 120,5848 (2016), DOI: 10.1021/acs.jpca.6b05139
*Authors contributed equally to this work.
Reprints were made with permission from the publishers.

Comments on my own contribution
I Performed the multiplet calculations, and took part in analysing the re-sults.
II Performed the calculations of convergence dependence on the number offinal states, RASPT2 calculations with correlated core orbitals and tookpart in analysing the results.
III Participated in the design of the study, had the main responsibility for theRAS calculations and the analysis, and took part in writing the manuscript.
IV Participated in the design of the study, had the main responsibility for theRAS calculations and the analysis, and took part in writing the manuscript.
V Participated in the design of the study, had the main responsibility for theRAS calculations and the analysis, and took part in writing the manuscript.
VI Participated in the design of the study, took part in discussion and analysisof results.
VII Participated in the design of the study, had the main responsibility for theRAS calculations and the analysis, and took part in writing the manuscript.
Publications that are left out of the thesis
The following is a list of papers to which I have contributed but are left outof this thesis.
1. Tungsten Hydrides with Pendant Pyridyl Functional Groups and
Their Tunable Intramolecular Proton-Coupled Electron Transfer
Tianfei Liu, Meiyuan Guo, Andreas Orthaber, Reiner Lomoth, MarcusLundberg, Sascha Ott and Leif Hammarström. Submitted.
2. L2,3-edge 3d-Partial-fluorescence yield X-ray absorption as a sensi-
tive probe of a distorted symmetry
Meiyuan Guo, Marcus Lundberg, and Piter S. Miedema. Manuscript.
3. Valence orbital interactions and d-d excitations in hard X-ray reso-
nant ineleastic X-ray scattering: Revisiting manganese hexacyanide
Meiyuan Guo, Erik Källman, Lasse Kragh Sørensen, Marcus Lundberg.Manuscript.
4. Valence electronic states of a dilute Chromium(III) complex in solu-
tion accessed by 2p-3d Cr L-edge absorption spectroscopy
Markus Kubin, Meiyuan Guo, Maria Ekimova, Vittal Yachandra, JunkoYano, Erik Nibbering, Marcus Lundberg, Philippe Wernet. Manuscript.
5. Quantifying soft x-ray dose-dependent sample damage to redox-active
Mn(III) species in solution using Mn L-edge spectroscopy
Markus Kubin, Meiyuan Guo, Jan Kern, Brian O’ Cinneide, Alexan-der Föhlisch, Vittal Yachandra, Marcus Lundberg, Junko Yano, PhilippeWernet. Manuscript.
6. Direct probing of 2p-3d x-ray absorption cross-sections of dilute Mn
complexes in solution using an in-vacuum transmission flat-jet
Markus Kubin, Maria Ekimova, Meiyuan Guo, Marcus Lundberg, VittalYachandra, Junko Yano, Erik Nibbering, Philippe Wernet. Manuscript.

Abbreviations
ADP Adenosine Di-PhosphateATP Adenosine Tri-PhosphateNADP+ Nicotinamide Adenine Dinucleotide Phosphate oxidaseHF Hartree-FockSOC Spin Orbit CouplingMCSCF Multi-Configuration Self Consistent FieldCSF Configuration State FunctionsRASSI Restricted Active Space State InteractionCAS Complete Active SpaceRAS Restricted Active SpaceXAS X-ray Absorption SpectroscopyPFY Partial Fluoresence YieldTEY Total Electron YieldRIXS Resonant Inelastic X-ray ScatteringDFT Density Functional TheoryCTM Charge Transfer MultipletROCIS Restricted Open-shell Configuration Interaction with SinglesES Excited StateGS Ground StateCS Cosine SimilarityPT2 Second-order Pertubation TheoryLMCT Ligand Metal Charge TransferMLCT Metal Ligand Charge TransferMS Multi-StateSS State SpecificPCM Polarizable Continuum ModelCCD Charge Coupled DeviceCIE Constant Incident EnergyCEE Constant Emission EnergyOEC Oxygen Evolution CatalystRCD Radial Charge DensityRSD Radial Spin Density

Contents
1 Introduction . . . . . . . . . . . . . . . . . . . . . . . . . . . . . . . . . . . . . . . . . . . . . . . . . . . . . . . . . . . . . . . . . . . . . . . . . . . . . . . . . . . . . . . . . . . . . . . . 13
2 Core level spectroscopy . . . . . . . . . . . . . . . . . . . . . . . . . . . . . . . . . . . . . . . . . . . . . . . . . . . . . . . . . . . . . . . . . . . . . . . . . . . . . 162.1 The role of metal 3d orbitals . . . . . . . . . . . . . . . . . . . . . . . . . . . . . . . . . . . . . . . . . . . . . . . . . . . . . . . . . 162.2 Probe metal 3d orbitals of catalysts . . . . . . . . . . . . . . . . . . . . . . . . . . . . . . . . . . . . . . . . . . . . . . 17
2.2.1 X-ray absorption spectroscopy . . . . . . . . . . . . . . . . . . . . . . . . . . . . . . . . . . . . . . . 172.2.2 Resonant inelastic X-ray spectroscopy . . . . . . . . . . . . . . . . . . . . . . . . . . 19
3 Computational framework . . . . . . . . . . . . . . . . . . . . . . . . . . . . . . . . . . . . . . . . . . . . . . . . . . . . . . . . . . . . . . . . . . . . . . . . 223.1 Born-Oppenheimer approximation . . . . . . . . . . . . . . . . . . . . . . . . . . . . . . . . . . . . . . . . . . . . . . . 223.2 Hartree-Fock theory . . . . . . . . . . . . . . . . . . . . . . . . . . . . . . . . . . . . . . . . . . . . . . . . . . . . . . . . . . . . . . . . . . . . . . . 233.3 Multi-configurational method . . . . . . . . . . . . . . . . . . . . . . . . . . . . . . . . . . . . . . . . . . . . . . . . . . . . . . . 25
3.3.1 Second-order perturbation . . . . . . . . . . . . . . . . . . . . . . . . . . . . . . . . . . . . . . . . . . . . . . 263.3.2 RAS method for X-ray spectra . . . . . . . . . . . . . . . . . . . . . . . . . . . . . . . . . . . . . . . 28
3.4 Charge transfer multiplet model . . . . . . . . . . . . . . . . . . . . . . . . . . . . . . . . . . . . . . . . . . . . . . . . . . . . 293.5 Other methods for modelling X-ray spectra . . . . . . . . . . . . . . . . . . . . . . . . . . . . . . . . . 30
4 Soft X-rays . . . . . . . . . . . . . . . . . . . . . . . . . . . . . . . . . . . . . . . . . . . . . . . . . . . . . . . . . . . . . . . . . . . . . . . . . . . . . . . . . . . . . . . . . . . . . . . . . 324.1 Atomic calculation of low-spin Fe3+
. . . . . . . . . . . . . . . . . . . . . . . . . . . . . . . . . . . . . . . . . . . 324.2 Metal L-edge XAS of low-spin iron complexes . . . . . . . . . . . . . . . . . . . . . . . . . . 34
4.2.1 Fingerprint the oxidation states . . . . . . . . . . . . . . . . . . . . . . . . . . . . . . . . . . . . . . 354.2.2 Fingerprint the ligand environment . . . . . . . . . . . . . . . . . . . . . . . . . . . . . . . . 364.2.3 Fingerprint the different electronic states . . . . . . . . . . . . . . . . . . . . . . 364.2.4 Cost and stability of RAS method . . . . . . . . . . . . . . . . . . . . . . . . . . . . . . . . . . 394.2.5 Summary . . . . . . . . . . . . . . . . . . . . . . . . . . . . . . . . . . . . . . . . . . . . . . . . . . . . . . . . . . . . . . . . . . . . . . . . . . 39
4.3 PFY-XAS of manganese complexes . . . . . . . . . . . . . . . . . . . . . . . . . . . . . . . . . . . . . . . . . . . . . 404.3.1 PFY-XAS of MnII(acac)2 and MnIII(acac)3 . . . . . . . . . . . . . . . . 414.3.2 Spin and charge density . . . . . . . . . . . . . . . . . . . . . . . . . . . . . . . . . . . . . . . . . . . . . . . . . . 424.3.3 Origin of the spectral shape and edge shift . . . . . . . . . . . . . . . . . . . . 444.3.4 Summary . . . . . . . . . . . . . . . . . . . . . . . . . . . . . . . . . . . . . . . . . . . . . . . . . . . . . . . . . . . . . . . . . . . . . . . . . . 44
5 Hard X-rays . . . . . . . . . . . . . . . . . . . . . . . . . . . . . . . . . . . . . . . . . . . . . . . . . . . . . . . . . . . . . . . . . . . . . . . . . . . . . . . . . . . . . . . . . . . . . . . . 465.1 Metal K pre-edge XAS . . . . . . . . . . . . . . . . . . . . . . . . . . . . . . . . . . . . . . . . . . . . . . . . . . . . . . . . . . . . . . . . . . 46
5.1.1 Multiplet structures . . . . . . . . . . . . . . . . . . . . . . . . . . . . . . . . . . . . . . . . . . . . . . . . . . . . . . . . . . 475.1.2 Hybridization of dipole and quadrupole contributions . 485.1.3 Back-donation charge transfer . . . . . . . . . . . . . . . . . . . . . . . . . . . . . . . . . . . . . . . . 505.1.4 Summary . . . . . . . . . . . . . . . . . . . . . . . . . . . . . . . . . . . . . . . . . . . . . . . . . . . . . . . . . . . . . . . . . . . . . . . . . . 51
5.2 Simulations of the metal 1s2p RIXS of [Fe(CN)6]n−
. . . . . . . . . . . . . . . . 525.2.1 The 1s2p RIXS spectra of [Fe(CN)6]
4−. . . . . . . . . . . . . . . . . . . . . . . . 53

5.2.2 The 1s2p RIXS spectra of [Fe(CN)6]3−
. . . . . . . . . . . . . . . . . . . . . . . . 555.2.3 Summary . . . . . . . . . . . . . . . . . . . . . . . . . . . . . . . . . . . . . . . . . . . . . . . . . . . . . . . . . . . . . . . . . . . . . . . . . . 56
6 Conclusion and outlook . . . . . . . . . . . . . . . . . . . . . . . . . . . . . . . . . . . . . . . . . . . . . . . . . . . . . . . . . . . . . . . . . . . . . . . . . . . . . 58
7 Sammanfattning på svenska . . . . . . . . . . . . . . . . . . . . . . . . . . . . . . . . . . . . . . . . . . . . . . . . . . . . . . . . . . . . . . . . . . . . . . 60
Acknowledgements . . . . . . . . . . . . . . . . . . . . . . . . . . . . . . . . . . . . . . . . . . . . . . . . . . . . . . . . . . . . . . . . . . . . . . . . . . . . . . . . . . . . . . . . . . 63
References . . . . . . . . . . . . . . . . . . . . . . . . . . . . . . . . . . . . . . . . . . . . . . . . . . . . . . . . . . . . . . . . . . . . . . . . . . . . . . . . . . . . . . . . . . . . . . . . . . . . . . . . 65
1. Introduction
The increasing population together with increasing living standard boosts theenergy consumptions of fossil fuels, such as coal, oil, and natural gas, whichin turn boosts the emissions of CO2, CO, NOx, and other hazardous air pollu-tants from the combustion of fossil fuels. These energy sources have limitedreserves and will dwindle in the foreseeable future. The consumptions areadversely affecting our environment and human health. The CO2 emission iswidely considered as the main factor that contributes to climate change, suchas the increased average global temperature, the increased sea level, declinedmountain glaciers and snow cover and many other observed changes. The ur-gent circumstance forces us to find alternative inexhaustible, renewable andgreen energy sources, such as hydro, biofuels, geothermal, wind, and solar en-ergy, etc. Among all these green energies, solar energy is the most attractivealternative energy source and can compete with fossil fuels.[1, 2]
H2O
2H+
+⅟₂O2
2H+
H2
2e-
H2O → ⅟₂O2 + 2H + 2e-
2H+ + 2e- → H2
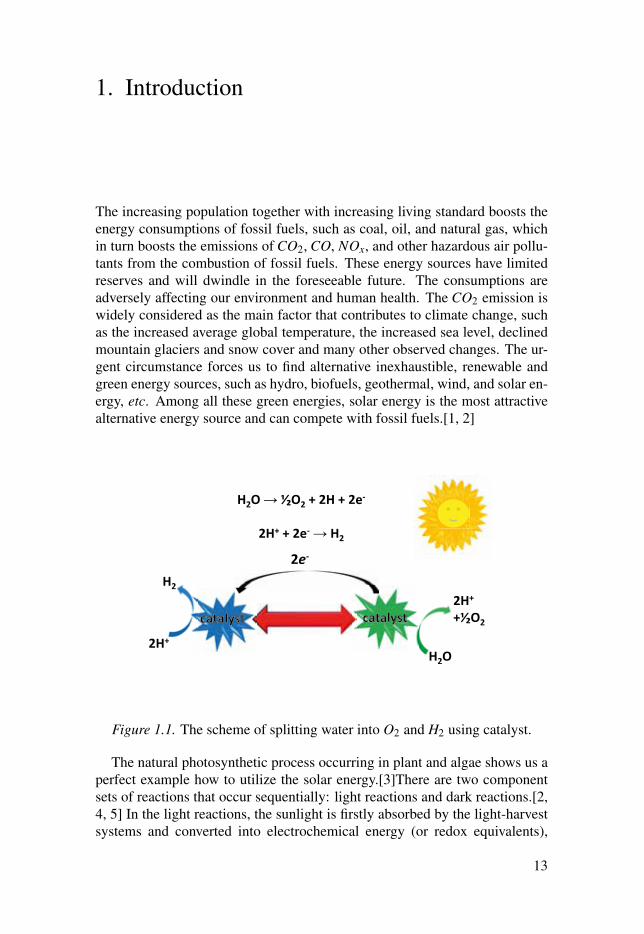
Figure 1.1. The scheme of splitting water into O2 and H2 using catalyst.
The natural photosynthetic process occurring in plant and algae shows us aperfect example how to utilize the solar energy.[3]There are two componentsets of reactions that occur sequentially: light reactions and dark reactions.[2,4, 5] In the light reactions, the sunlight is firstly absorbed by the light-harvestsystems and converted into electrochemical energy (or redox equivalents),
13
then a water oxidation complex uses this redox potential to catalyze conversionof water to O2, hydrogen ions, and electrons stored as reducing equivalents, atthe same time, the oxidizing agent NADP+ is reduced. Secondly, phosphory-lation takes place leading to the formation of ATP. This involves the captureof some part of the radiant energy by phosphorylating ADP to produce ATP.In the dark reactions, the CO2 is reduced to carbohydrate.
Inspired by the natural photosynthesis process, much effort has been dedi-cated to using sunlight directly as the energy source for water splitting.[5, 6] Insuch process, the water is oxidised to O2, and then the electrons can be usedto make fuel such as H2, methanol, methane, carbohydrates, or other fuels,which can be stored for later use.[7, 8]
When restricted to H2 and O2 evolution from water and sunlight, it fallsinto the category of light-driven water splitting.[9–12] Usually the processesare accelerated by using expensive noble metals (such as platinum, ruthenium,iridium and rhodium) acting as water oxidation catalysts and hydrogen reduc-tion catalysts.[11, 13] However, these metals are not themselves sustainableresources, and lots of suitable catalysts are required in order to generate usefulamount of hydrogen on practical timescale. So the viability of water oxida-tion and hydrogen evolution relies on the design of novel, efficient and robustcatalytic materials based on earth-abundant and cheap metals. Recently lotsof attention have been given to the design of catalysts based on the first-rowtransition metals, including nickel, cobalt, iron, copper and manganese.[13–15] However, none of the present catalysts satisfy the industrial requirementsof stability, efficiency and speed. In order to design catalysts that fulfill theabove requirements, inspiration can be drawn from the reaction and the activesite in the natural photosynthesis process, e.g, the four-electron redox reactionoccurring in the Mn4CaO5 cluster. Moreover, better knowledge about the elec-tronic structures as well as geometric information of transition metal catalyststhemselves is also required.
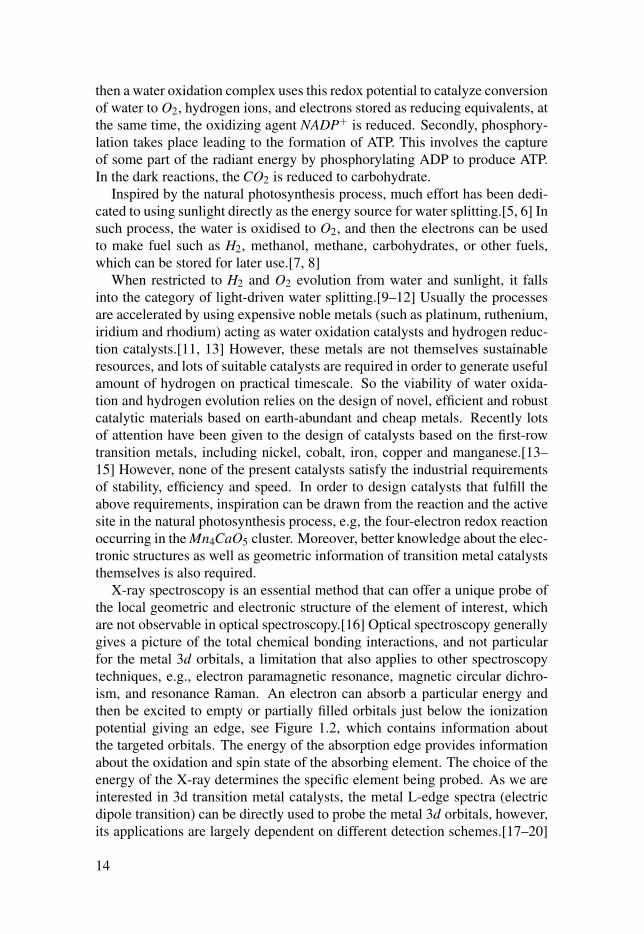
X-ray spectroscopy is an essential method that can offer a unique probe ofthe local geometric and electronic structure of the element of interest, whichare not observable in optical spectroscopy.[16] Optical spectroscopy generallygives a picture of the total chemical bonding interactions, and not particularfor the metal 3d orbitals, a limitation that also applies to other spectroscopytechniques, e.g., electron paramagnetic resonance, magnetic circular dichro-ism, and resonance Raman. An electron can absorb a particular energy andthen be excited to empty or partially filled orbitals just below the ionizationpotential giving an edge, see Figure 1.2, which contains information aboutthe targeted orbitals. The energy of the absorption edge provides informationabout the oxidation and spin state of the absorbing element. The choice of theenergy of the X-ray determines the specific element being probed. As we areinterested in 3d transition metal catalysts, the metal L-edge spectra (electricdipole transition) can be directly used to probe the metal 3d orbitals, however,its applications are largely dependent on different detection schemes.[17–20]
14
The light elements (e.g, carbon, nitrogen and oxygen) have intense K-edgeabsorption in the soft energy region, which can have strong background con-tribution to the metal L-edge spectra and increase radiation damage.[21] Toavoid the limitations of measurement on dilute samples such as catalysts, bi-ological samples, or environmental samples, X-ray absorption spectroscopy(XAS) can be measured as fluorescence yield spectra,[20, 22] or alternativelyuse hard X-rays at the metal K edge region.[23]
K pre-edge L1 L2 L3
1s (J = 0)
2s (J = 0)
2p (J = 1/2)
2p (J = 3/2)
3d
K edge
4p
L edge
Figure 1.2. The energy level diagram for K edge transitions(1s→ 3d/4p), and L-edge(L1, L2, and L3) transitions (2s/2p→ 3d). The energy levels are not drawn to scale.
A detailed interpretation and understanding of the X-ray spectra requiresaccurate simulations, which can unravel subtle spectral features. To model theX-ray spectra, one high-level method that can describe important spectral ef-fects, e.g, 2p and 3d spin orbit coupling (SOC), multiplet structures, selectionrule, and charge transfer between metal and ligands,[24–27] is required. Oneof main focus of this following thesis is to calculate and interpret the metalL-edge XAS measured as transmission and fluorescence yield spectra in gasphase and in solution. Another main focus is to model hard X-rays. For themetal K pre-edge XAS, the intensity calculations have to be implemented be-yond the electric dipole transitions. Upon successful calculations on metal Kpre-edge and metal L edge, it is possible to describe the high resolution hardX-ray spectra - 1s2p resonant inelastic X-ray scattering (RIXS). The calcu-lations of X-ray spectra in different energy regions and in different photonprocesses would be useful in interpreting X-ray spectra and fingerprinting theelectronic structures of solution catalysts and enzymes.
15
2. Core level spectroscopy
The electrons of an atom can be divided into two categories: inner shell (core)electron and outer shell (valence) electrons. The properties of the transitionmetal catalysts are dominated by the valence electrons that participate in theirchemical bond formations and interactions. The core-electrons are localizedaround the nucleus, and they do not take part in the formation of a chem-ical bond and can be considered inert. It is clear that the study of the va-lence electronic structure can offer information on the nature of the chemicalbond. However, core electrons provide a method to locally study the valenceelectronic structure and geometric properties centered around one atomic site,which is one of the unique properties of core level spectroscopy methods.
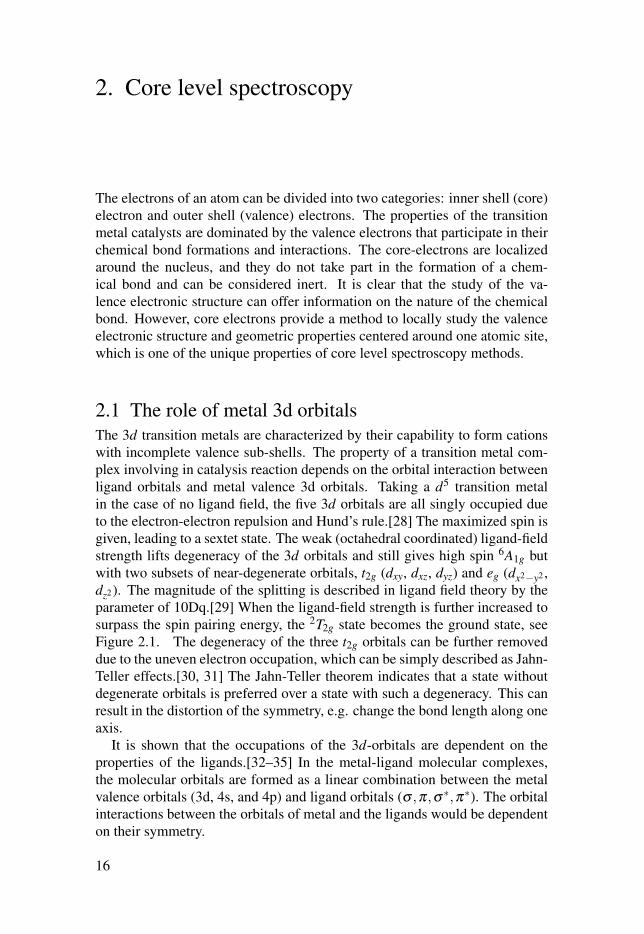
2.1 The role of metal 3d orbitalsThe 3d transition metals are characterized by their capability to form cationswith incomplete valence sub-shells. The property of a transition metal com-plex involving in catalysis reaction depends on the orbital interaction betweenligand orbitals and metal valence 3d orbitals. Taking a d5 transition metalin the case of no ligand field, the five 3d orbitals are all singly occupied dueto the electron-electron repulsion and Hund’s rule.[28] The maximized spin isgiven, leading to a sextet state. The weak (octahedral coordinated) ligand-fieldstrength lifts degeneracy of the 3d orbitals and still gives high spin 6A1g butwith two subsets of near-degenerate orbitals, t2g (dxy, dxz, dyz) and eg (dx2−y2 ,dz2). The magnitude of the splitting is described in ligand field theory by theparameter of 10Dq.[29] When the ligand-field strength is further increased tosurpass the spin pairing energy, the 2T2g state becomes the ground state, seeFigure 2.1. The degeneracy of the three t2g orbitals can be further removeddue to the uneven electron occupation, which can be simply described as Jahn-Teller effects.[30, 31] The Jahn-Teller theorem indicates that a state withoutdegenerate orbitals is preferred over a state with such a degeneracy. This canresult in the distortion of the symmetry, e.g. change the bond length along oneaxis.
It is shown that the occupations of the 3d-orbitals are dependent on theproperties of the ligands.[32–35] In the metal-ligand molecular complexes,the molecular orbitals are formed as a linear combination between the metalvalence orbitals (3d, 4s, and 4p) and ligand orbitals (σ ,π,σ∗,π∗). The orbitalinteractions between the orbitals of metal and the ligands would be dependenton their symmetry.
16
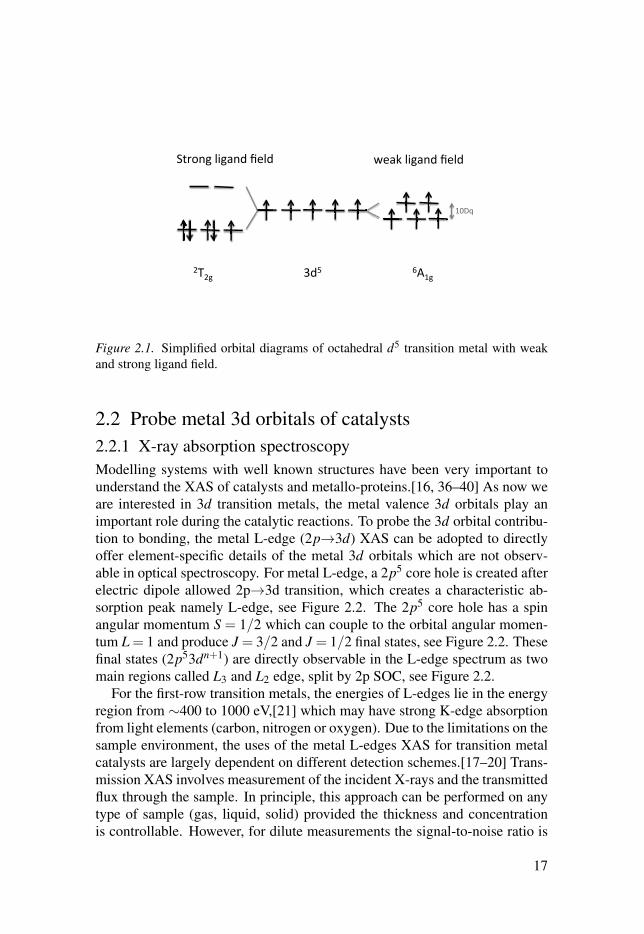
Figure 2.1. Simplified orbital diagrams of octahedral d5 transition metal with weakand strong ligand field.
2.2 Probe metal 3d orbitals of catalysts2.2.1 X-ray absorption spectroscopyModelling systems with well known structures have been very important tounderstand the XAS of catalysts and metallo-proteins.[16, 36–40] As now weare interested in 3d transition metals, the metal valence 3d orbitals play animportant role during the catalytic reactions. To probe the 3d orbital contribu-tion to bonding, the metal L-edge (2p→3d) XAS can be adopted to directlyoffer element-specific details of the metal 3d orbitals which are not observ-able in optical spectroscopy. For metal L-edge, a 2p5 core hole is created afterelectric dipole allowed 2p→3d transition, which creates a characteristic ab-sorption peak namely L-edge, see Figure 2.2. The 2p5 core hole has a spinangular momentum S = 1/2 which can couple to the orbital angular momen-tum L = 1 and produce J = 3/2 and J = 1/2 final states, see Figure 2.2. Thesefinal states (2p53dn+1) are directly observable in the L-edge spectrum as twomain regions called L3 and L2 edge, split by 2p SOC, see Figure 2.2.
For the first-row transition metals, the energies of L-edges lie in the energyregion from ∼400 to 1000 eV,[21] which may have strong K-edge absorptionfrom light elements (carbon, nitrogen or oxygen). Due to the limitations on thesample environment, the uses of the metal L-edges XAS for transition metalcatalysts are largely dependent on different detection schemes.[17–20] Trans-mission XAS involves measurement of the incident X-rays and the transmittedflux through the sample. In principle, this approach can be performed on anytype of sample (gas, liquid, solid) provided the thickness and concentrationis controllable. However, for dilute measurements the signal-to-noise ratio is
17
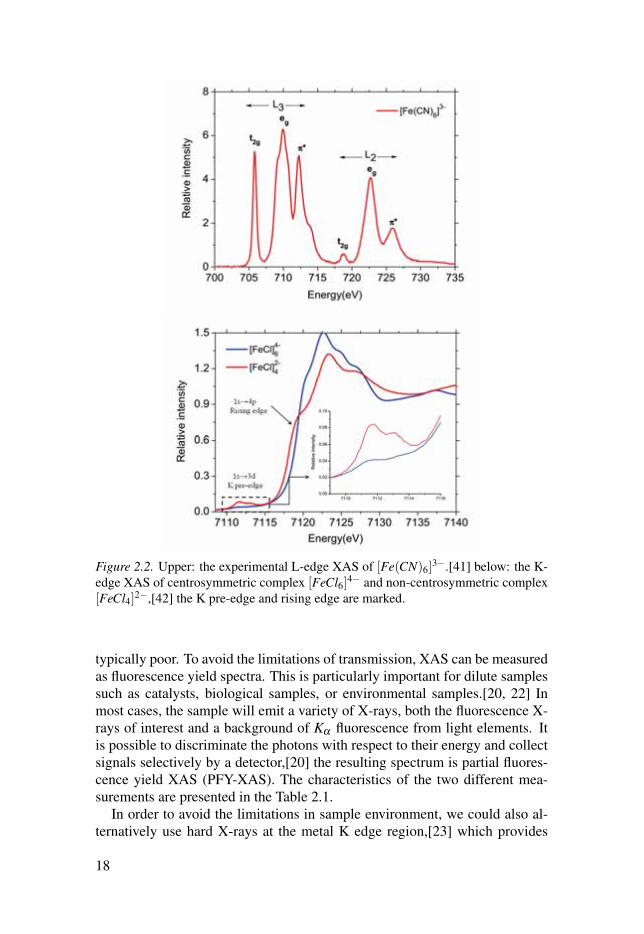
Figure 2.2. Upper: the experimental L-edge XAS of [Fe(CN)6]3−.[41] below: the K-
edge XAS of centrosymmetric complex [FeCl6]4− and non-centrosymmetric complex[FeCl4]2−,[42] the K pre-edge and rising edge are marked.
typically poor. To avoid the limitations of transmission, XAS can be measuredas fluorescence yield spectra. This is particularly important for dilute samplessuch as catalysts, biological samples, or environmental samples.[20, 22] Inmost cases, the sample will emit a variety of X-rays, both the fluorescence X-rays of interest and a background of Kα fluorescence from light elements. Itis possible to discriminate the photons with respect to their energy and collectsignals selectively by a detector,[20] the resulting spectrum is partial fluores-cence yield XAS (PFY-XAS). The characteristics of the two different mea-surements are presented in the Table 2.1.
In order to avoid the limitations in sample environment, we could also al-ternatively use hard X-rays at the metal K edge region,[23] which provides
18
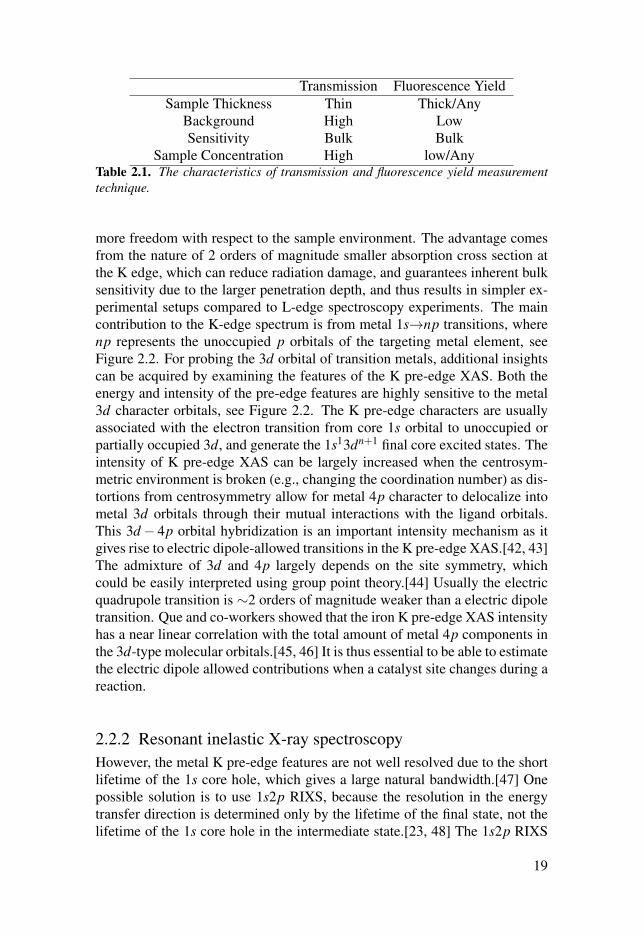
Transmission Fluorescence YieldSample Thickness Thin Thick/Any
Background High LowSensitivity Bulk Bulk
Sample Concentration High low/AnyTable 2.1. The characteristics of transmission and fluorescence yield measurementtechnique.
more freedom with respect to the sample environment. The advantage comesfrom the nature of 2 orders of magnitude smaller absorption cross section atthe K edge, which can reduce radiation damage, and guarantees inherent bulksensitivity due to the larger penetration depth, and thus results in simpler ex-perimental setups compared to L-edge spectroscopy experiments. The maincontribution to the K-edge spectrum is from metal 1s→np transitions, wherenp represents the unoccupied p orbitals of the targeting metal element, seeFigure 2.2. For probing the 3d orbital of transition metals, additional insightscan be acquired by examining the features of the K pre-edge XAS. Both theenergy and intensity of the pre-edge features are highly sensitive to the metal3d character orbitals, see Figure 2.2. The K pre-edge characters are usuallyassociated with the electron transition from core 1s orbital to unoccupied orpartially occupied 3d, and generate the 1s13dn+1 final core excited states. Theintensity of K pre-edge XAS can be largely increased when the centrosym-metric environment is broken (e.g., changing the coordination number) as dis-tortions from centrosymmetry allow for metal 4p character to delocalize intometal 3d orbitals through their mutual interactions with the ligand orbitals.This 3d− 4p orbital hybridization is an important intensity mechanism as itgives rise to electric dipole-allowed transitions in the K pre-edge XAS.[42, 43]The admixture of 3d and 4p largely depends on the site symmetry, whichcould be easily interpreted using group point theory.[44] Usually the electricquadrupole transition is ∼2 orders of magnitude weaker than a electric dipoletransition. Que and co-workers showed that the iron K pre-edge XAS intensityhas a near linear correlation with the total amount of metal 4p components inthe 3d-type molecular orbitals.[45, 46] It is thus essential to be able to estimatethe electric dipole allowed contributions when a catalyst site changes during areaction.
2.2.2 Resonant inelastic X-ray spectroscopyHowever, the metal K pre-edge features are not well resolved due to the shortlifetime of the 1s core hole, which gives a large natural bandwidth.[47] Onepossible solution is to use 1s2p RIXS, because the resolution in the energytransfer direction is determined only by the lifetime of the final state, not thelifetime of the 1s core hole in the intermediate state.[23, 48] The 1s2p RIXS
19
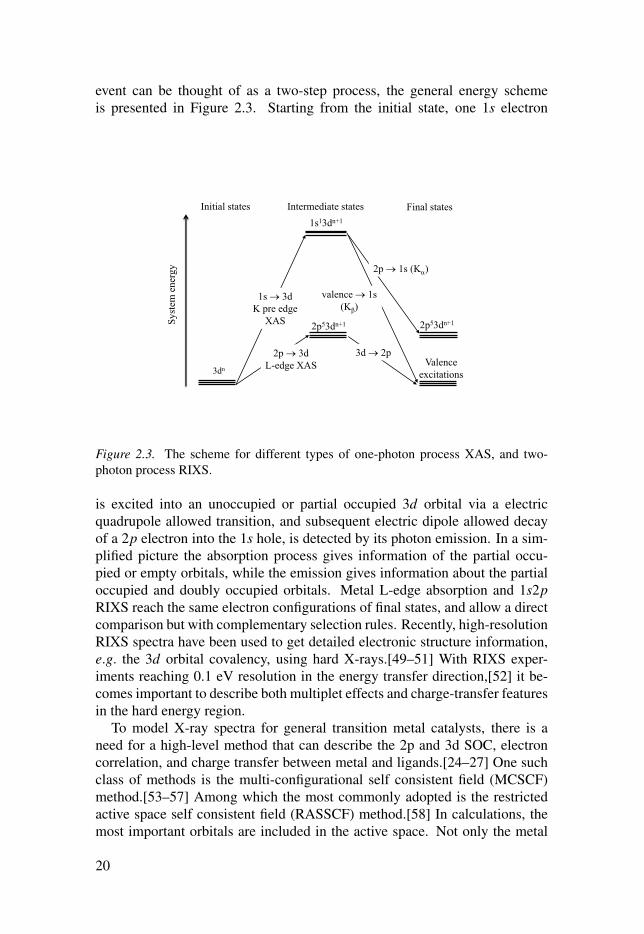
event can be thought of as a two-step process, the general energy schemeis presented in Figure 2.3. Starting from the initial state, one 1s electron
1s 3d K pre edge
XAS 2p53dn+1
2p 3d L-edge XAS 3dn
2p53dn+1
1s13dn+1
valence 1s (Kβ)
Initial states
Valence excitations
2p 1s (K )
3d 2p
Syst
em e
nerg
y
Final states Intermediate states
Figure 2.3. The scheme for different types of one-photon process XAS, and two-photon process RIXS.
is excited into an unoccupied or partial occupied 3d orbital via a electricquadrupole allowed transition, and subsequent electric dipole allowed decayof a 2p electron into the 1s hole, is detected by its photon emission. In a sim-plified picture the absorption process gives information of the partial occu-pied or empty orbitals, while the emission gives information about the partialoccupied and doubly occupied orbitals. Metal L-edge absorption and 1s2pRIXS reach the same electron configurations of final states, and allow a directcomparison but with complementary selection rules. Recently, high-resolutionRIXS spectra have been used to get detailed electronic structure information,e.g. the 3d orbital covalency, using hard X-rays.[49–51] With RIXS exper-iments reaching 0.1 eV resolution in the energy transfer direction,[52] it be-comes important to describe both multiplet effects and charge-transfer featuresin the hard energy region.
To model X-ray spectra for general transition metal catalysts, there is aneed for a high-level method that can describe the 2p and 3d SOC, electroncorrelation, and charge transfer between metal and ligands.[24–27] One suchclass of methods is the multi-configurational self consistent field (MCSCF)method.[53–57] Among which the most commonly adopted is the restrictedactive space self consistent field (RASSCF) method.[58] In calculations, themost important orbitals are included in the active space. Not only the metal
20

character core orbitals and 3d molecular orbitals, but also the important ligandmolecular orbitals.
21
3. Computational framework
The recent experimental X-ray techniques progress can provide subtle spec-tral features, which imply that advanced quantum mechanism methods arerequired to accurately simulate and interpret the core level spectra. In thischapter, the important approximations and theory used to simulate the X-rayspectroscopies are introduced.
3.1 Born-Oppenheimer approximationThe nucleus has a much larger mass and much smaller velocity compared tothe electron, assuming the motions of the nuclei can be ignored when describ-ing the electrons in a molecule, and then the electron wave function dependsupon the nuclei positions but not upon their velocities. This assumption isknown as Born-Oppenheimer approximation,[59] which make it possible tosimplify the complicated Schrödinger equation of a molecule. The nucleusand electron problems can be solved with independent wavefunctions fromthe separation of the nucleus and the electron motion.
The Schrödinger equation can be written as:
H(r,R)Ψ(r,R) = E(r,R)Ψ(r,R) (3.1)
The molecular wavefunction Ψ in the Born-Oppenheimer approximation canbe separated into a product of nuclear and electronic components:
Ψ(r,R) = ψn(R)ψe(r,R) (3.2)
where ψn(R) is a wavefunction in terms of nuclear position, ψe(r,R) is elec-tronic wavefunction in terms of the positions of electron and nuclei. The quan-tity r represents the coordinates of all electrons, and R represents coordinatesof all nuclei.
Going back to the Eq.(3.1), the total molecular Hamiltonian can be writtenas
H(r,R) = Hn(R)+ He(r,R) (3.3)
whereHn(R) = Tn +Vnn(R) (3.4)
He(r,R) = Te +Vee(r)+Ven(r,R) (3.5)
22
Here Tn is kinetic energy operator of the nuclei, Vnn(R) is nuclei-nuclei repul-sion Coulomb potential, Te is kinetic energy operator of the electron, Vee(r) iselectron-electron repulsion Coulomb potential, and Ven(r,R) is electron-nucleiattraction Coulomb potential. Now substitute these terms and the Eq.(3.2) intothe Schröding equation the Eq.(3.1), then obtain
(Tn +Vnn(R)+ Te +Vee(r)+Ven(r,R))Ψ(r,R) = E(r,R)ψn(R)ψe(r,R)(3.6)
Consider the nuclei and electron kinetic energy operator acting on the wave-function, Tn contains derivatives in terms of nuclei coordinates, it has effectson both nuclei and electron wavefunction:
Tnψn(R)ψe(r,R) = ψn(R)Tnψe(r,R)+ψe(r,R)Tnψn(R) (3.7)
Here, the Tnψe(r,R) is much smaller than Tnψn(R), hence the Eq.(3.7) can bewritten as
Tnψn(R)ψe(r,R)≈ ψe(r,R)Tnψn(R) (3.8)
Te contains derivatives in terms of electron coordinates, and hence it only haseffect on the electron wavefunction,
Teψe(r,R)ψn(R) = ψn(R)Teψe(r,R) (3.9)
Apply the same fact in the the Schröding equation the Eq.(3.1), it can be writ-ten as
ψe(r,R)Hn(R)ψn(R)+ψn(R)He(r,R)ψe(r,R) = E(r,R)ψn(R)ψe(r,R)(3.10)
Then divide the both sides of Eq. (3.10) by ψn(R)ψe(r,R), which gives
He(r,R)ψe(r,R)
ψe(r,R)= E− Hn(R)ψn(R)
ψn(R)(3.11)
The right side depends only on the coordinates of nuclei R, and can be writtencompactly as function ε(R). Substitute it in Eq(3.11) and obtain the electronicSchrödinger equation:
He(r,R)ψe(r,R) = ε(R)ψe(r,R) (3.12)
3.2 Hartree-Fock theoryThe electronic Schröding equation was obtained from the Born-Oppenheimerapproximation in section 3.1. The exact solution to the equation can onlybe reachable for one-electron systems, such as the hydrogen atom or hydro-gen like systems. As long as one uses the electronic Schröding equation to
23
deal with a many-body problem in quantum chemistry, only approximated so-lutions can be obtained. Hartree-Fock theory is the simplest approximationmethod to solve many-body electronic Schröding equation.[60] It simplifiesthe N-electron problem into N one-electron problems. Hence, it is reasonableto start the wavefunction with a general form:
Ψ(r1,r2, · · · ,rN) = ψ1(r1)ψ2(r2) · · ·ψN(rN) (3.13)
when considering the full set of coordinates including space and spin, theEq.(3.13) can be rewritten as
Ψ(X1,X2, · · · ,XN) = χ1(X1)χ2(X2) · · ·χN(XN) (3.14)
Clearly, this wavefunction can not satisfy the Pauli principle, in which thewavefunction has to be antisymmetric. In order to fulfil the antisymmetryrequirement, the wavefunction of the simplest two-electron many-body systemcan be written like below:
Ψ(X1,X2) =1√2[χ1(X1)χ2(X2)−χ1(X2)χ2(X1)] (3.15)
The wavefunction also can be represented using determinants like
Ψ(X1,X2) =1√2
χ1(X1) χ2(X1)χ1(X2) χ2(X2)
(3.16)
Now it is easy to expand the determinant for an N-electron system
Ψ(X1,X2, · · · ,XN) =1√N!
χ1(X1) χ2(X1) · · · χN(X1)χ1(X2) χ2(X2) · · · χN(X2)
......
......
χ1(XN) χ2(XN) · · · χN(XN)
(3.17)
The electronic Hamiltonian can be written in a simple way as
He = ∑i
ζ (α)+ ∑α<β
η(α,β )+Vnn(R) (3.18)
where ζ (α) represents a one-electron operator, η(α,β ) represents a two-electron operator, and Vnn(R) is a constant for the fixed set of nuclei coor-dinates R. Similarly, the electronic energy in terms of integrals can also beexpressed using one-electron and two-electron operators:
E = ∑α〈α|ζ |α〉+ 1
2 ∑αβ
([αα|ββ ]− [αβ |βα]) (3.19)
where 〈α|ζ |α〉 is one-electron integral, [αα|ββ ] is two-electron Coulomb in-tegral, [αβ |βα] is exchange integral, these integrals can be easily computed
24
by existing efficient computer algorithms. The energy difference between theexact non-relativistic energy of the system and the HF limit energy is calledcorrelation energy. The electron correlation can be separated into two compo-nents namely static correlation and dynamical correlation,[61] both of whichwill be elaborated on in the following section.
3.3 Multi-configurational methodThe static correlation can be well described by multi-configurational self con-sistent field (MCSCF) methods, among which the most widely adopted ap-proaches is complete active space SCF (CASSCF).[53] The MCSCF wavefunction is written as a linear combination of Slater determinant or configura-tion state functions (CSF):
|κ,C〉= exp(−κ)∑i
Ci|i〉 (3.20)
The CSF can be selected as all possible ones formed within a given activespace. Each CSF differs in how the electrons are placed in the molecularorbitals. The molecular orbitals are expanded in a basis of atomic orbitals.A MCSCF wavefunction is one in which both the configuration mixing co-efficients and the molecular orbitals expansison coefficients are variationallyoptimized. The number of CSF can be calculated using Weyl’s formula:
Qn,N,S =2S+1n+1
(n+1
N/2−S
)(n+1
N/2+S+1
)(3.21)
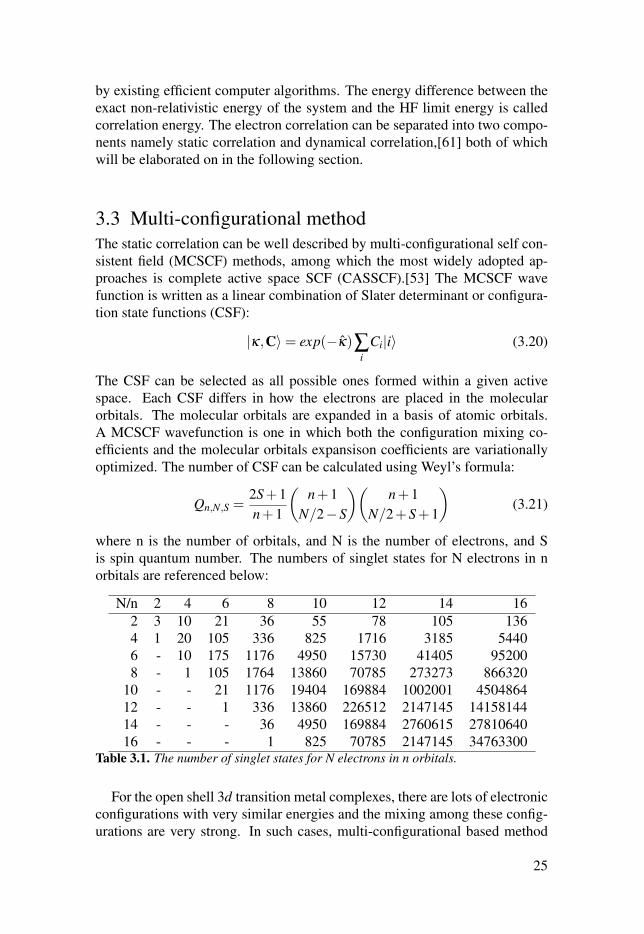
where n is the number of orbitals, and N is the number of electrons, and Sis spin quantum number. The numbers of singlet states for N electrons in norbitals are referenced below:
N/n 2 4 6 8 10 12 14 162 3 10 21 36 55 78 105 1364 1 20 105 336 825 1716 3185 54406 - 10 175 1176 4950 15730 41405 952008 - 1 105 1764 13860 70785 273273 866320
10 - - 21 1176 19404 169884 1002001 450486412 - - 1 336 13860 226512 2147145 1415814414 - - - 36 4950 169884 2760615 2781064016 - - - 1 825 70785 2147145 34763300
Table 3.1. The number of singlet states for N electrons in n orbitals.
For the open shell 3d transition metal complexes, there are lots of electronicconfigurations with very similar energies and the mixing among these config-urations are very strong. In such cases, multi-configurational based method
25
is required to describe the electronic structure. To describe this strong corre-lation, one has to incorporate these important configurations in the referencespace. The CASSCF method accounts for the most important configurationsby introducing a set of orbitals, and then all possible configurations withinthe active space are produced. The orbitals included in the active space arecalled active orbitals, and they can be doubly occupied, singly occupied orempty. These orbitals are optimized through all possible rotations between theactive orbitals and inactive orbitals, active orbitals and secondary orbitals, aswell as inactive orbitals and secondary orbitals. The computation of CASSCFbecomes demanding with the increase of the number of active orbitals, espe-cially when the number of active orbitals is close to the number of electrons.To reduce the computational cost, the active space can be partitioned into sub-spaces, namely a restricted active space SCF (RASSCF) method.[58] In thismethod, the excitation level is usually limited to one or two electrons, hencegive a limited number of excited configurations.
3.3.1 Second-order perturbationThe CAASCF/RASSCF method can describe correlation well within the cho-sen reference space, however, remaining correlation called dynamic corre-lation is still neglected. The dynamical correlation can be treated perturba-tively using CASPT2,[62–64] which uses a CASSCF reference wavefunction.For some cases where several states have strong mixing, the CASSCF wavefunction is not good reference state for the perturbation calculation, to solvethis problem, the CASPT2 calculations can be performed as multi-state (MS)-CASPT2.[65]
The small difference between H and H0 is seen merely as ’perturbation’,and all quantities of the system described by H (the perturbed system) can beexpanded as a Taylor series starting from the unperturbed quantities (those ofH0). The expansion can be solved in terms of a parameter γ:
H(r,R) = H(0)(r,R)+ γH(1)(r,R)+ γ2H(2)(r,R)+ · · · (3.22)
the wavefunction can be written as:
Ψn(r,R) = Ψ(0)n (r,R)+ γΨ(1)
n (r,R)+ γ2Ψ(2)n (r,R)+ · · · (3.23)
and the energy can be written as:
En(r,R) = E(0)n (r,R)+ γE(1)
n (r,R)+ γ2E(2)n (r,R)+ · · · (3.24)
The Ψ1n and E1
n are the first order corrections to the wavefunction and energyrespectively. Ψ2
n and E2n are the second order corrections and so on. The task
of perturbation theory is to approximate the energies and wavefunctions ofthe perturbed system by calculating corrections up to a given order. In many
26
textbooks the expansion of the Hamiltonian is terminated after the first orderterm, i.e. H(r,R) = H(0)(r,R) + γH(1)(r,R), as this is sufficient for manyphysical problems.
The chain equation can be obtained as the solution is independent on the γ:
H(0)(r,R)Ψ(0)n (r,R) = E(0)
n (r,R)Ψ(0)n (r,R) (3.25)
(H(0)(r,R)−E(0)n (r,R))Ψ(1)
n (r,R) = (E(1)n (r,R)− H(1)(r,R))Ψ(0)
n (r,R)(3.26)
(H(0)(r,R)− E(0)n (r,R))Ψ(2)
n (r,R) = (E(2)n (r,R)− H(2)(r,R))Ψ(0)
n (r,R)
+ (E(1)n (r,R)− H(1)(r,R))Ψ(1)
n (r,R)
(3.27)
To simplify the expansion from now from now on we will use bra-ket notation,representing wavefunction corrections by their state number, so Ψ(0)
n (r,R) ≡|n(0)〉, Ψ(1)
n (r,R)≡ |n(1)〉, etc.Take Eq. (3.26) in ket notation, we can derive an expression for calculating
the first order correction to the energy E(1):
(H(0)(r,R)−E(0)n (r,R))|n(1)〉= (E(1)
n (r,R)− H(1)(r,R))|n(0)〉 (3.28)
and multiply from the left by |n(0)〉 to obtain:
〈n(0)|(H(0)(r,R)−E(0)n (r,R))|n(1)〉= 〈n(0)|(E(1)
n (r,R)− H(1)(r,R))|n(0)〉(3.29)
In the end, we can get the first order correction to the energy:
E(1)n (r,R) = 〈n(0)|H(1)(r,R))|n(0)〉 (3.30)
Similarly, we can derive an expression for calculating the second order correc-tion to the energy E(2) by applying 〈n(0)| from the left to Eq. (3.27),
(3.31)E(2)n (r,R) = 〈n(0)|H(2)(r,R))|n(0)〉+ 〈n(0)|H(1)(r,R))|n(1)〉
= H(2)nn (r,R) + 〈n(0)|H(1)(r,R))|n(1)〉
Finally, the second-order correction energy can be represented as:
E(2)(r,R) = H(2)nn (r,R)+ ∑
n=k
H1nk(r,R)+H1
kn(r,R)
E0n (r,R)−E0s
k (r,R)(3.32)
By including the dynamic correlations, we could expect the CASPT2 wouldgive state a improved description of energy compared to CASSCF state. Throughthe MS-CASPT2 calculations, the strong interactions between states in samesymmetry can be well described, which might be important to describe thecharge transfer features in the X-ray spectra.
27
Fe 2p (t1u)
σ*(eg- 3dz2,x2-y2)
π (t2g- 3dxz,yz,xy)
Fe 1s (a1g)
π*
σ
RAS2
RAS3
RAS1
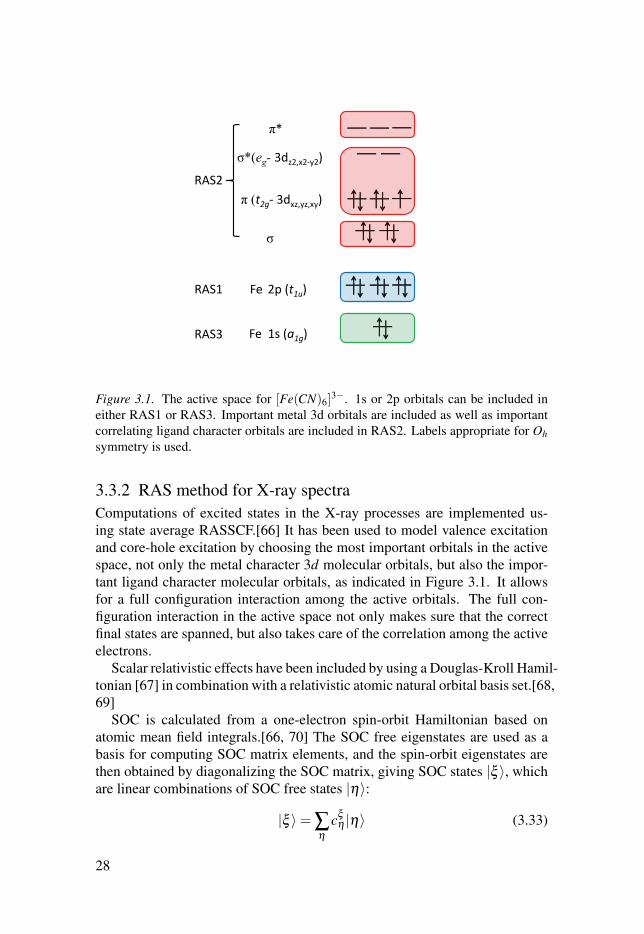
Figure 3.1. The active space for [Fe(CN)6]3−. 1s or 2p orbitals can be included in
either RAS1 or RAS3. Important metal 3d orbitals are included as well as importantcorrelating ligand character orbitals are included in RAS2. Labels appropriate for Ohsymmetry is used.
3.3.2 RAS method for X-ray spectraComputations of excited states in the X-ray processes are implemented us-ing state average RASSCF.[66] It has been used to model valence excitationand core-hole excitation by choosing the most important orbitals in the activespace, not only the metal character 3d molecular orbitals, but also the impor-tant ligand character molecular orbitals, as indicated in Figure 3.1. It allowsfor a full configuration interaction among the active orbitals. The full con-figuration interaction in the active space not only makes sure that the correctfinal states are spanned, but also takes care of the correlation among the activeelectrons.
Scalar relativistic effects have been included by using a Douglas-Kroll Hamil-tonian [67] in combination with a relativistic atomic natural orbital basis set.[68,69]
SOC is calculated from a one-electron spin-orbit Hamiltonian based onatomic mean field integrals.[66, 70] The SOC free eigenstates are used as abasis for computing SOC matrix elements, and the spin-orbit eigenstates arethen obtained by diagonalizing the SOC matrix, giving SOC states |ξ 〉, whichare linear combinations of SOC free states |η〉:
|ξ 〉= ∑η
cξη |η〉 (3.33)
28
The weight (ω) from each SOC free state can acquired from the square of thecoefficient (cξ
η)2. These eigenstates are then utilized to calculate the strength
of the transitions using the restricted active space state interaction (RASSI)approach.[66, 70] The corresponding equation for the 1st order cartesian mul-tipole moments (dipole transition moment operator, �μσδ ) is:
f D(σ→δ ) =
2me
3h2e2ΔEσδ |�μσδ |2 (3.34)
Intensities for quadrupole transitions have been calculated using an imple-mentation of the so-called origin independent quadrupole intensities, where allterms in the second-order expansion in the intensities are calculated, and notonly the terms from the zeroth and first order of the wave-vector expansion.[71]The isotropically averaged quadrupole transition intensity ( f Q
(σ→δ )) of the 1sto 3d transition consists of electric quadrupole electric quadrupole contri-bution f qq, magnetic dipole magnetic dipole contribution f mm, the electricquadrupole magnetic dipole contribution f qm, electric dipole electric octupolecontribution f μo, and electric dipole magnetic quadrupole contribution f μϖ .[71]
f Q(σ→δ ) =
me
20h4e2c2ΔE3
σδ [| �T qσδ |2 + | �T m
σδ |2 +2Re(T q,∗σδ T m
σδ )+
2Re(T μ,∗σδ T o
σδ )+2Re(T μ,∗σδ T m
σδ )](3.35)
and can be simplified as
f Q(σ→δ ) = f qq
(σ→δ ) + f mm(σ→δ ) + f qm
(σ→δ ) + f μo(σ→δ ) + f μϖ
(σ→δ ) (3.36)
where me and e are the mass and charge of the electron, respectively, h is re-duced Planck constant, c is the speed of light in atomic units, ΔEσδ is thetransition energy, and T is transition moment. The RIXS calculation is theo-retically described by the Kramers-Heisenberg formula[72]:
F(Ω,ω) = ∑f|∑
n
〈 f |Te|i〉〈i|Ta|g〉K(Γi)
|2×K(Γ f ) (3.37)
where the scattering intensity F is a function of incident energy (Ω) and emit-ted X-ray energy (ω), the |g〉, |i〉, and | f 〉 are ground, intermediate and finalstates respectively. Ta and Te are transition operators for the absorption andemission processes respectively. K(Γ) depends on the resonance energy andthe lifetime broadening Γ of each state.
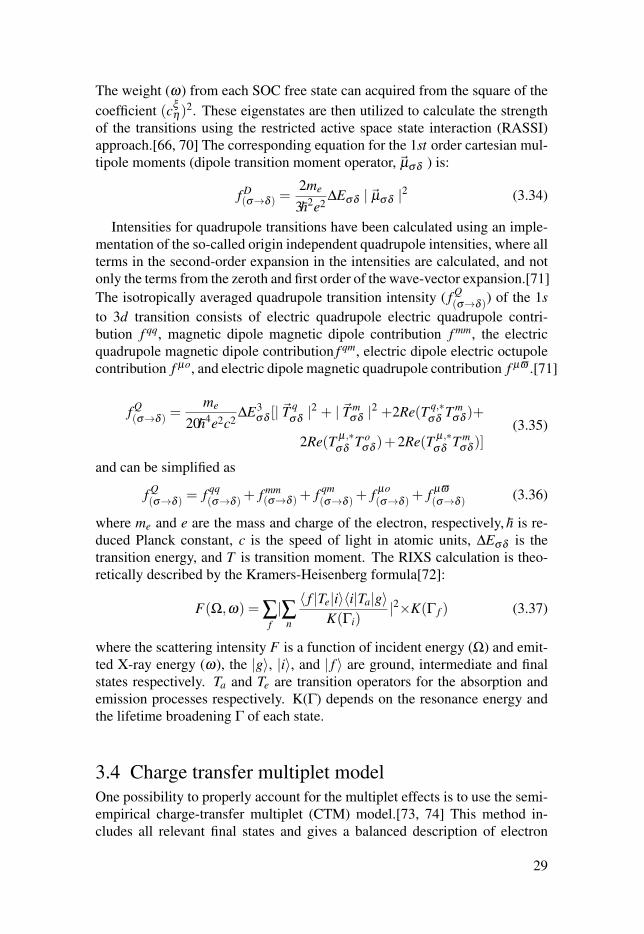
3.4 Charge transfer multiplet modelOne possibility to properly account for the multiplet effects is to use the semi-empirical charge-transfer multiplet (CTM) model.[73, 74] This method in-cludes all relevant final states and gives a balanced description of electron
29
repulsion and SOC. For a free atom without any influence from the surround-ings, the Hamiltonian for an N-electron atom can be written as:
H = ∑N
P2i
2m+∑
N
−Ze2
ri+∑
Nϑ(ri)li · si + ∑
pairs
e2
ri j(3.38)
where the first term denotes the kinetic energy of electrons, the second termdenotes the electrostatic interaction of electrons with the nucleus, the thirdterm denotes the SOC, and the last term denotes electron-electron repulsion.In a given configuration, the first two terms in the Hamiltonian represent theaverage energy of the configuration and have no contribution to the multipletsplitting. The last two terms represent the relative energy of the different termswithin configurations and have contribution to the multiplet splitting. Theligand field is treated as a perturbation to the free atomic case and is introducedby adding a new term in the atomic Hamiltonian.
For the highly covalent molecular systems, the charge transfer features areincluded by configuration interactions between the ground state (dn) and intro-duced extra LMCT configuration (dn+1L), and MLCT configurations (dn−1L−).The CTM model often achieves excellent agreement with experimental datafor highly symmetric systems through a multi-parameter fit to the electron-electron interaction, the ligand field, and the charge transfer states.[42] How-ever, the number of parameters used to describe the effects of the ligand en-vironment increases with decreasing symmetry, which makes it difficult todescribe complexes with low or no symmetry. Moreover, when both dipoleand quadrupole transitions have to be accounted for, additional parameters de-scribing the amount of mixing are required. This further makes it less straight-forward to apply and analyze the results of the CTM method for low-symmetrycomplexes.
3.5 Other methods for modelling X-ray spectraX-ray spectra that involve core holes can be described by a number of differentapproaches, e.g. multiple scattering,[75, 76], static exchange,[77] transition-potential density-functional theory (DFT),[78] Bethe-Salpeter approach,[79,80] and complex polarization propagator methods.[81] Recently, time depen-dent (TD) DFT method has been used to predict and interpret XAS.[82–85]This provides a framework to calculate transition energies and intensities withfavourable balance between accuracy and computational time. A limitation ofmany of these approaches, is that they do not incorporate the necessary physicsto correctly account for the multiplet effects arising from electron−electroncorrelations. A DFT restricted-open shell configuration interaction with sin-gles (DFT/ROCIS) approach was developed to cover all the multiplets thatarise from the atomic terms.[86–89] In this method, the ground state and a
30

number of excited states of the non-relativistic Hamiltonian are firstly cal-culated. For a ground state with total spin S, excitation to a number of ex-cited states with total spin S′ = S, S - 1, and S + 1 are calculated. The lackof doubly occupied orbitals in the DFT/ROCIS will exclude excitations fromthe core orbitals combined with simultaneous excitations from doubly occu-pied valence orbitals into empty or singly occupied valence orbitals, e.g., theshake-up transition of LMCT type. Moreover, due to its single reference char-acter, DFT/ROCIS is not applicable to molecules with an orbitally degenerateground state. The DFT/ROCIS account for dynamic correction by using DFTorbitals with specified empirical parameter, but it should be stressed that theDFT orbitals can yield improved results for covalent bonding, which make itvery useful on highly covalent transition metal complexes.
31
4. Soft X-rays
In this chapter, selected results from the RAS simulations (papers I to IV) ofmetal L-edge XAS are presented. The RAS method is firstly used to simulatethe atomic Fe3+ with charges mimic the strong ligand field, then it is extendedto calculate the metal L-edge XAS of low spin complexes [Fe(CN)6]
n (paperI and II) and [Fe(P)(ImH)2]
n (paper III) (P = porphyrin,ImH = imidazole)in ferrous and ferric oxidation state. Then the RAS calculations on [Fe(P)system have been performed to fingerprint the electronic states. In the lastsection, the two-photon process 3d-PFY-XAS as a probe of electronic structureof manganese complexes in solution are simulated and discussed (paper IV).
4.1 Atomic calculation of low-spin Fe3+
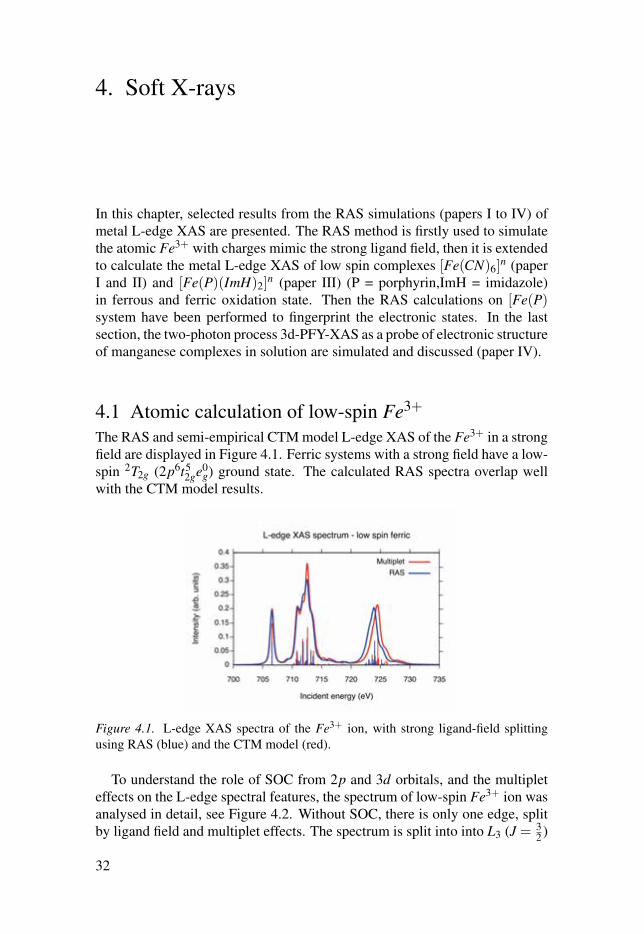
The RAS and semi-empirical CTM model L-edge XAS of the Fe3+ in a strongfield are displayed in Figure 4.1. Ferric systems with a strong field have a low-spin 2T2g (2p6t5
2ge0g) ground state. The calculated RAS spectra overlap well
with the CTM model results.
Figure 4.1. L-edge XAS spectra of the Fe3+ ion, with strong ligand-field splittingusing RAS (blue) and the CTM model (red).
To understand the role of SOC from 2p and 3d orbitals, and the multipleteffects on the L-edge spectral features, the spectrum of low-spin Fe3+ ion wasanalysed in detail, see Figure 4.2. Without SOC, there is only one edge, splitby ligand field and multiplet effects. The spectrum is split into into L3 (J = 3
2 )
32
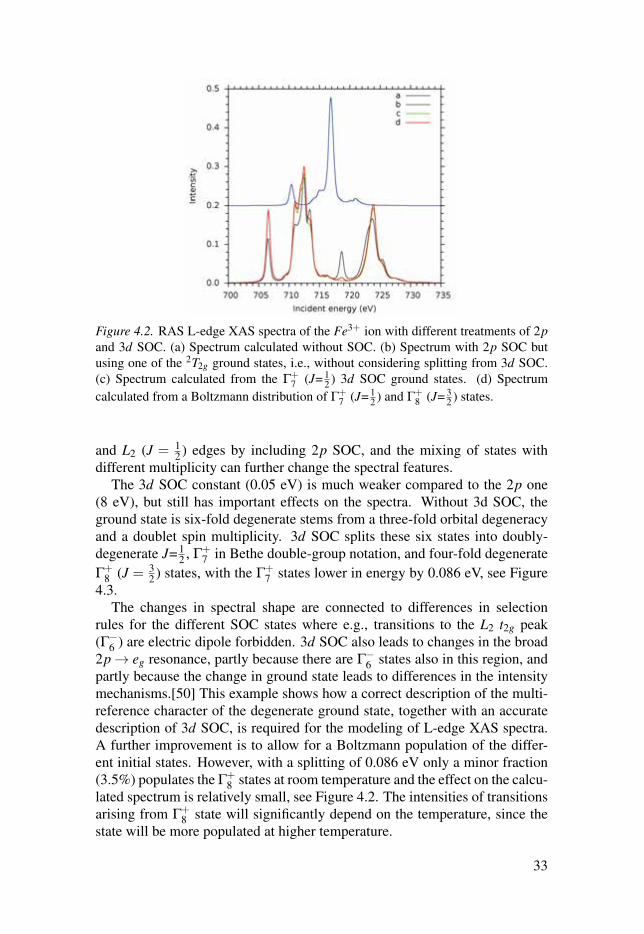
Figure 4.2. RAS L-edge XAS spectra of the Fe3+ ion with different treatments of 2pand 3d SOC. (a) Spectrum calculated without SOC. (b) Spectrum with 2p SOC butusing one of the 2T2g ground states, i.e., without considering splitting from 3d SOC.(c) Spectrum calculated from the Γ+
7 (J= 12 ) 3d SOC ground states. (d) Spectrum
calculated from a Boltzmann distribution of Γ+7 (J= 1
2 ) and Γ+8 (J= 3
2 ) states.
and L2 (J = 12 ) edges by including 2p SOC, and the mixing of states with
different multiplicity can further change the spectral features.The 3d SOC constant (0.05 eV) is much weaker compared to the 2p one
(8 eV), but still has important effects on the spectra. Without 3d SOC, theground state is six-fold degenerate stems from a three-fold orbital degeneracyand a doublet spin multiplicity. 3d SOC splits these six states into doubly-degenerate J= 1
2 , Γ+7 in Bethe double-group notation, and four-fold degenerate
Γ+8 (J = 3
2 ) states, with the Γ+7 states lower in energy by 0.086 eV, see Figure
4.3.The changes in spectral shape are connected to differences in selection
rules for the different SOC states where e.g., transitions to the L2 t2g peak(Γ−6 ) are electric dipole forbidden. 3d SOC also leads to changes in the broad2p→ eg resonance, partly because there are Γ−6 states also in this region, andpartly because the change in ground state leads to differences in the intensitymechanisms.[50] This example shows how a correct description of the multi-reference character of the degenerate ground state, together with an accuratedescription of 3d SOC, is required for the modeling of L-edge XAS spectra.A further improvement is to allow for a Boltzmann population of the differ-ent initial states. However, with a splitting of 0.086 eV only a minor fraction(3.5%) populates the Γ+
8 states at room temperature and the effect on the calcu-lated spectrum is relatively small, see Figure 4.2. The intensities of transitionsarising from Γ+
8 state will significantly depend on the temperature, since thestate will be more populated at higher temperature.
33
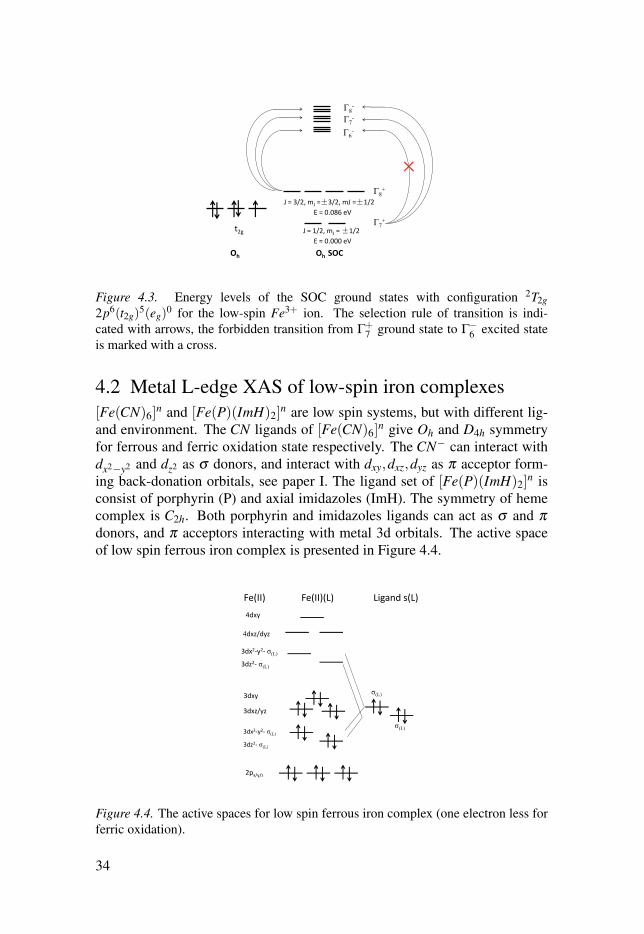
Г7+
Г8+
Г7-
Г6-
J = 3/2, mJ = 3/2, mJ = 1/2
J = 1/2, mJ = 1/2 t2g
Oh Oh SOC
E = 0.086 eV
E = 0.000 eV
Г8-
Figure 4.3. Energy levels of the SOC ground states with configuration 2T2g2p6(t2g)
5(eg)0 for the low-spin Fe3+ ion. The selection rule of transition is indi-
cated with arrows, the forbidden transition from Γ+7 ground state to Γ−6 excited state
is marked with a cross.
4.2 Metal L-edge XAS of low-spin iron complexes[Fe(CN)6]
n and [Fe(P)(ImH)2]n are low spin systems, but with different lig-
and environment. The CN ligands of [Fe(CN)6]n give Oh and D4h symmetry
for ferrous and ferric oxidation state respectively. The CN− can interact withdx2−y2 and dz2 as σ donors, and interact with dxy,dxz,dyz as π acceptor form-ing back-donation orbitals, see paper I. The ligand set of [Fe(P)(ImH)2]
n isconsist of porphyrin (P) and axial imidazoles (ImH). The symmetry of hemecomplex is C2h. Both porphyrin and imidazoles ligands can act as σ and πdonors, and π acceptors interacting with metal 3d orbitals. The active spaceof low spin ferrous iron complex is presented in Figure 4.4.
Figure 4.4. The active spaces for low spin ferrous iron complex (one electron less forferric oxidation).
34
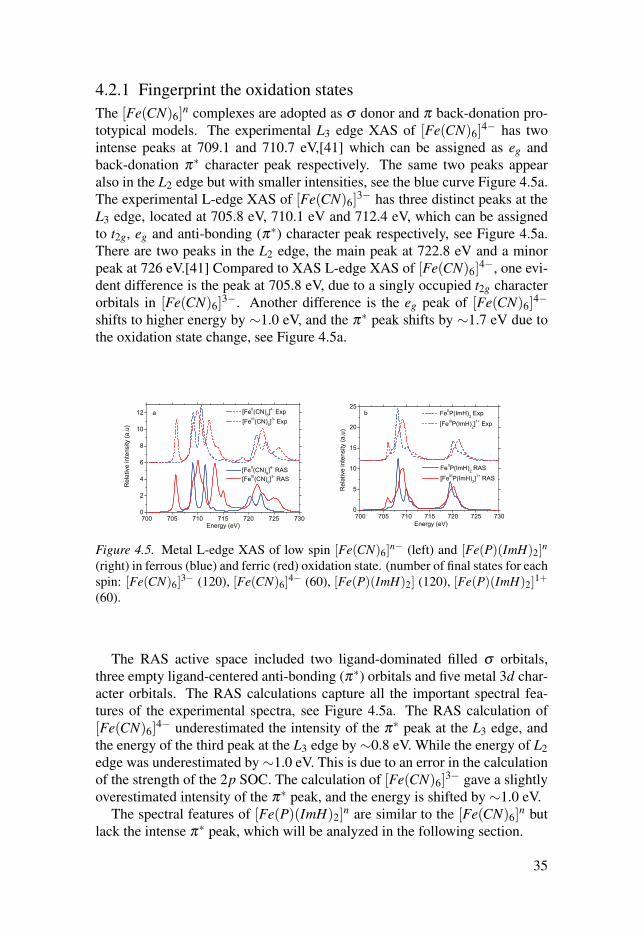
4.2.1 Fingerprint the oxidation statesThe [Fe(CN)6]
n complexes are adopted as σ donor and π back-donation pro-totypical models. The experimental L3 edge XAS of [Fe(CN)6]
4− has twointense peaks at 709.1 and 710.7 eV,[41] which can be assigned as eg andback-donation π∗ character peak respectively. The same two peaks appearalso in the L2 edge but with smaller intensities, see the blue curve Figure 4.5a.The experimental L-edge XAS of [Fe(CN)6]
3− has three distinct peaks at theL3 edge, located at 705.8 eV, 710.1 eV and 712.4 eV, which can be assignedto t2g, eg and anti-bonding (π∗) character peak respectively, see Figure 4.5a.There are two peaks in the L2 edge, the main peak at 722.8 eV and a minorpeak at 726 eV.[41] Compared to XAS L-edge XAS of [Fe(CN)6]
4−, one evi-dent difference is the peak at 705.8 eV, due to a singly occupied t2g characterorbitals in [Fe(CN)6]
3−. Another difference is the eg peak of [Fe(CN)6]4−
shifts to higher energy by ∼1.0 eV, and the π∗ peak shifts by ∼1.7 eV due tothe oxidation state change, see Figure 4.5a.
Figure 4.5. Metal L-edge XAS of low spin [Fe(CN)6]n− (left) and [Fe(P)(ImH)2]
n
(right) in ferrous (blue) and ferric (red) oxidation state. (number of final states for eachspin: [Fe(CN)6]
3− (120), [Fe(CN)6]4− (60), [Fe(P)(ImH)2] (120), [Fe(P)(ImH)2]
1+
(60).
The RAS active space included two ligand-dominated filled σ orbitals,three empty ligand-centered anti-bonding (π∗) orbitals and five metal 3d char-acter orbitals. The RAS calculations capture all the important spectral fea-tures of the experimental spectra, see Figure 4.5a. The RAS calculation of[Fe(CN)6]
4− underestimated the intensity of the π∗ peak at the L3 edge, andthe energy of the third peak at the L3 edge by ∼0.8 eV. While the energy of L2edge was underestimated by∼1.0 eV. This is due to an error in the calculationof the strength of the 2p SOC. The calculation of [Fe(CN)6]
3− gave a slightlyoverestimated intensity of the π∗ peak, and the energy is shifted by ∼1.0 eV.
The spectral features of [Fe(P)(ImH)2]n are similar to the [Fe(CN)6]
n butlack the intense π∗ peak, which will be analyzed in the following section.
35
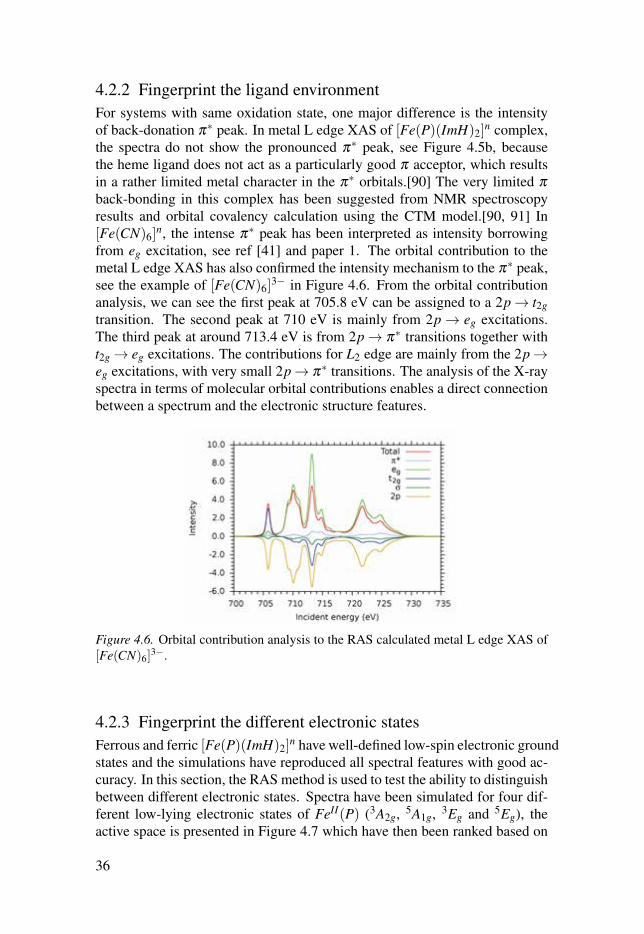
4.2.2 Fingerprint the ligand environmentFor systems with same oxidation state, one major difference is the intensityof back-donation π∗ peak. In metal L edge XAS of [Fe(P)(ImH)2]
n complex,the spectra do not show the pronounced π∗ peak, see Figure 4.5b, becausethe heme ligand does not act as a particularly good π acceptor, which resultsin a rather limited metal character in the π∗ orbitals.[90] The very limited πback-bonding in this complex has been suggested from NMR spectroscopyresults and orbital covalency calculation using the CTM model.[90, 91] In[Fe(CN)6]
n, the intense π∗ peak has been interpreted as intensity borrowingfrom eg excitation, see ref [41] and paper 1. The orbital contribution to themetal L edge XAS has also confirmed the intensity mechanism to the π∗ peak,see the example of [Fe(CN)6]
3− in Figure 4.6. From the orbital contributionanalysis, we can see the first peak at 705.8 eV can be assigned to a 2p→ t2gtransition. The second peak at 710 eV is mainly from 2p → eg excitations.The third peak at around 713.4 eV is from 2p→ π∗ transitions together witht2g → eg excitations. The contributions for L2 edge are mainly from the 2p→eg excitations, with very small 2p→ π∗ transitions. The analysis of the X-rayspectra in terms of molecular orbital contributions enables a direct connectionbetween a spectrum and the electronic structure features.
Figure 4.6. Orbital contribution analysis to the RAS calculated metal L edge XAS of[Fe(CN)6]
3−.
4.2.3 Fingerprint the different electronic statesFerrous and ferric [Fe(P)(ImH)2]
n have well-defined low-spin electronic groundstates and the simulations have reproduced all spectral features with good ac-curacy. In this section, the RAS method is used to test the ability to distinguishbetween different electronic states. Spectra have been simulated for four dif-ferent low-lying electronic states of FeII(P) (3A2g, 5A1g, 3Eg and 5Eg), theactive space is presented in Figure 4.7 which have then been ranked based on
36
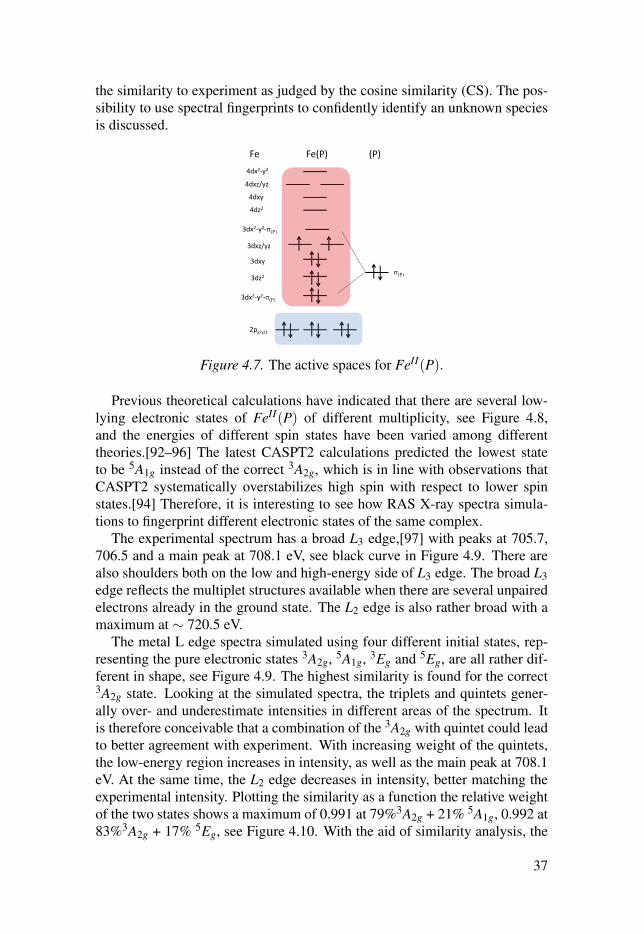
the similarity to experiment as judged by the cosine similarity (CS). The pos-sibility to use spectral fingerprints to confidently identify an unknown speciesis discussed.
Fe(P) (P)
4dx2-y2
3dx2-y2-σ(P)
3dz2
3dxy
3dxz/yz
4dz2
4dxy
4dxz/yz
3dx2-y2-σ(P)
2px/y/z
σ(P)
Fe
Figure 4.7. The active spaces for FeII(P).
Previous theoretical calculations have indicated that there are several low-lying electronic states of FeII(P) of different multiplicity, see Figure 4.8,and the energies of different spin states have been varied among differenttheories.[92–96] The latest CASPT2 calculations predicted the lowest stateto be 5A1g instead of the correct 3A2g, which is in line with observations thatCASPT2 systematically overstabilizes high spin with respect to lower spinstates.[94] Therefore, it is interesting to see how RAS X-ray spectra simula-tions to fingerprint different electronic states of the same complex.
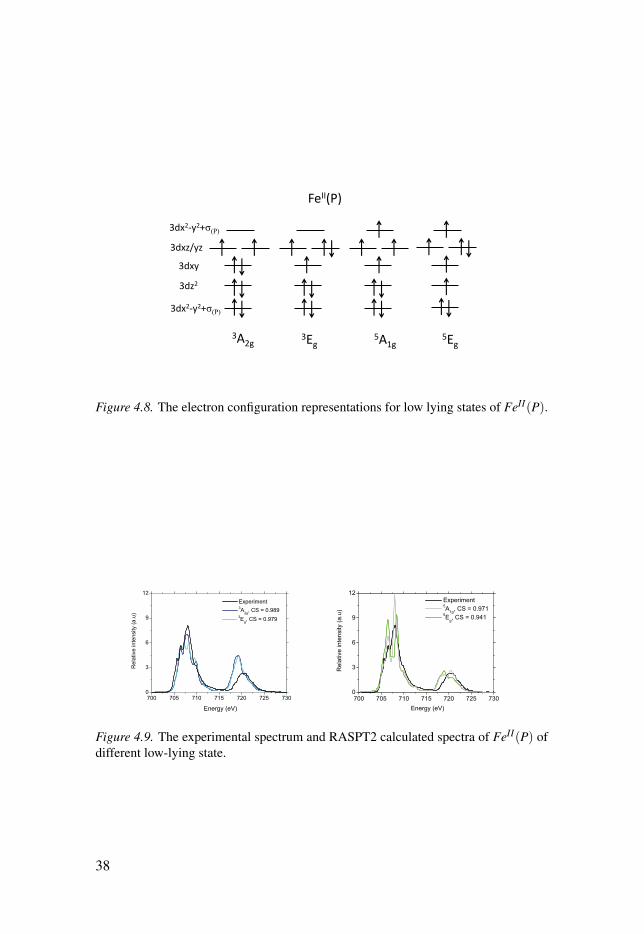
The experimental spectrum has a broad L3 edge,[97] with peaks at 705.7,706.5 and a main peak at 708.1 eV, see black curve in Figure 4.9. There arealso shoulders both on the low and high-energy side of L3 edge. The broad L3edge reflects the multiplet structures available when there are several unpairedelectrons already in the ground state. The L2 edge is also rather broad with amaximum at ∼ 720.5 eV.
The metal L edge spectra simulated using four different initial states, rep-resenting the pure electronic states 3A2g, 5A1g, 3Eg and 5Eg, are all rather dif-ferent in shape, see Figure 4.9. The highest similarity is found for the correct3A2g state. Looking at the simulated spectra, the triplets and quintets gener-ally over- and underestimate intensities in different areas of the spectrum. Itis therefore conceivable that a combination of the 3A2g with quintet could leadto better agreement with experiment. With increasing weight of the quintets,the low-energy region increases in intensity, as well as the main peak at 708.1eV. At the same time, the L2 edge decreases in intensity, better matching theexperimental intensity. Plotting the similarity as a function the relative weightof the two states shows a maximum of 0.991 at 79%3A2g + 21% 5A1g, 0.992 at83%3A2g + 17% 5Eg, see Figure 4.10. With the aid of similarity analysis, the
37
FeII(P)
3dx2-y2+σ(P)
3dz2
3dxy
3dxz/yz
3dx2-y2+σ(P)
3A2g 3Eg
5A1g 5Eg
Figure 4.8. The electron configuration representations for low lying states of FeII(P).
Figure 4.9. The experimental spectrum and RASPT2 calculated spectra of FeII(P) ofdifferent low-lying state.
38
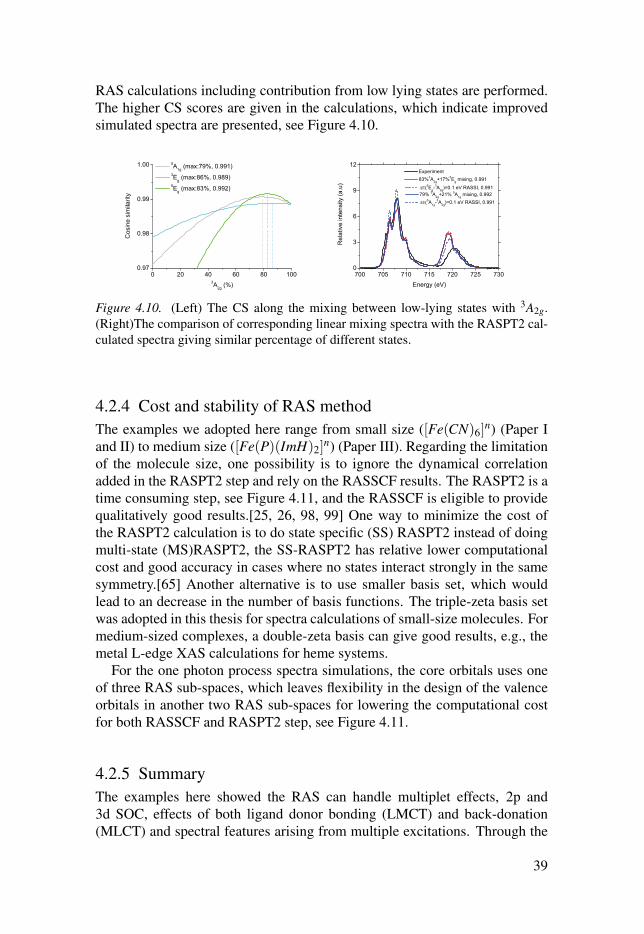
RAS calculations including contribution from low lying states are performed.The higher CS scores are given in the calculations, which indicate improvedsimulated spectra are presented, see Figure 4.10.
Figure 4.10. (Left) The CS along the mixing between low-lying states with 3A2g.(Right)The comparison of corresponding linear mixing spectra with the RASPT2 cal-culated spectra giving similar percentage of different states.
4.2.4 Cost and stability of RAS methodThe examples we adopted here range from small size ([Fe(CN)6]
n) (Paper Iand II) to medium size ([Fe(P)(ImH)2]
n) (Paper III). Regarding the limitationof the molecule size, one possibility is to ignore the dynamical correlationadded in the RASPT2 step and rely on the RASSCF results. The RASPT2 is atime consuming step, see Figure 4.11, and the RASSCF is eligible to providequalitatively good results.[25, 26, 98, 99] One way to minimize the cost ofthe RASPT2 calculation is to do state specific (SS) RASPT2 instead of doingmulti-state (MS)RASPT2, the SS-RASPT2 has relative lower computationalcost and good accuracy in cases where no states interact strongly in the samesymmetry.[65] Another alternative is to use smaller basis set, which wouldlead to an decrease in the number of basis functions. The triple-zeta basis setwas adopted in this thesis for spectra calculations of small-size molecules. Formedium-sized complexes, a double-zeta basis can give good results, e.g., themetal L-edge XAS calculations for heme systems.
For the one photon process spectra simulations, the core orbitals uses oneof three RAS sub-spaces, which leaves flexibility in the design of the valenceorbitals in another two RAS sub-spaces for lowering the computational costfor both RASSCF and RASPT2 step, see Figure 4.11.
4.2.5 SummaryThe examples here showed the RAS can handle multiplet effects, 2p and3d SOC, effects of both ligand donor bonding (LMCT) and back-donation(MLCT) and spectral features arising from multiple excitations. Through the
39
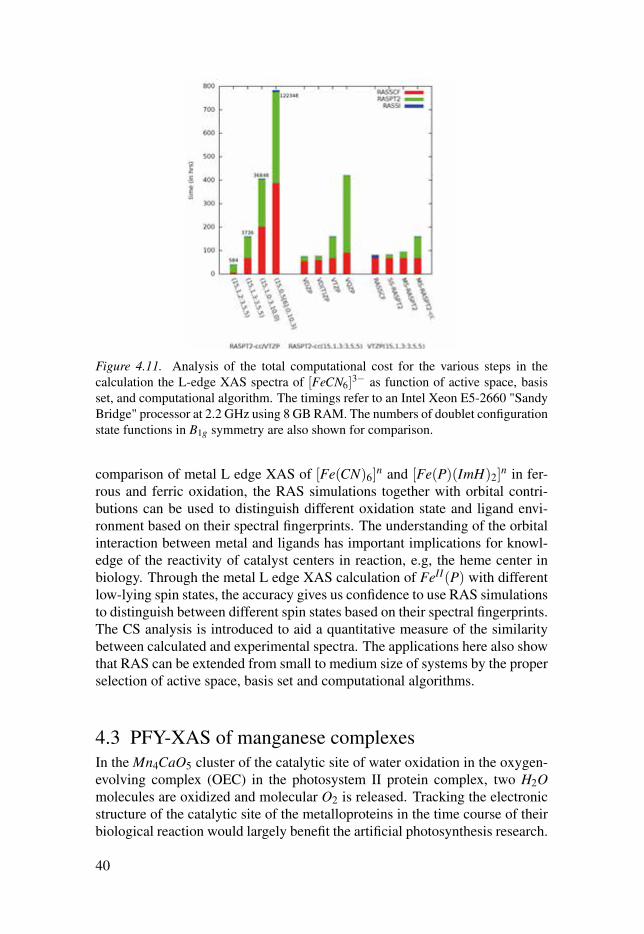
Figure 4.11. Analysis of the total computational cost for the various steps in thecalculation the L-edge XAS spectra of [FeCN6]
3− as function of active space, basisset, and computational algorithm. The timings refer to an Intel Xeon E5-2660 "SandyBridge" processor at 2.2 GHz using 8 GB RAM. The numbers of doublet configurationstate functions in B1g symmetry are also shown for comparison.
comparison of metal L edge XAS of [Fe(CN)6]n and [Fe(P)(ImH)2]
n in fer-rous and ferric oxidation, the RAS simulations together with orbital contri-butions can be used to distinguish different oxidation state and ligand envi-ronment based on their spectral fingerprints. The understanding of the orbitalinteraction between metal and ligands has important implications for knowl-edge of the reactivity of catalyst centers in reaction, e.g, the heme center inbiology. Through the metal L edge XAS calculation of FeII(P) with differentlow-lying spin states, the accuracy gives us confidence to use RAS simulationsto distinguish between different spin states based on their spectral fingerprints.The CS analysis is introduced to aid a quantitative measure of the similaritybetween calculated and experimental spectra. The applications here also showthat RAS can be extended from small to medium size of systems by the properselection of active space, basis set and computational algorithms.
4.3 PFY-XAS of manganese complexesIn the Mn4CaO5 cluster of the catalytic site of water oxidation in the oxygen-evolving complex (OEC) in the photosystem II protein complex, two H2Omolecules are oxidized and molecular O2 is released. Tracking the electronicstructure of the catalytic site of the metalloproteins in the time course of theirbiological reaction would largely benefit the artificial photosynthesis research.
40
In this section, the PFY-XAS of two prototypical models (MnII(acac)2 andMnIII(acac)3) with different oxidation states are experimentally measured insolution. Radiation-damage free spectra are obtained using a reflective zoneplate spectrometer for PFY detection.[20] In combination with RAS calcula-tions, the electronic structure details such as spin density, charge density, andoxidation states are discussed. The efforts here pave the route to an interpre-tation of the spectra obtained from the protein sample.
4.3.1 PFY-XAS of MnII(acac)2 and MnIII(acac)3
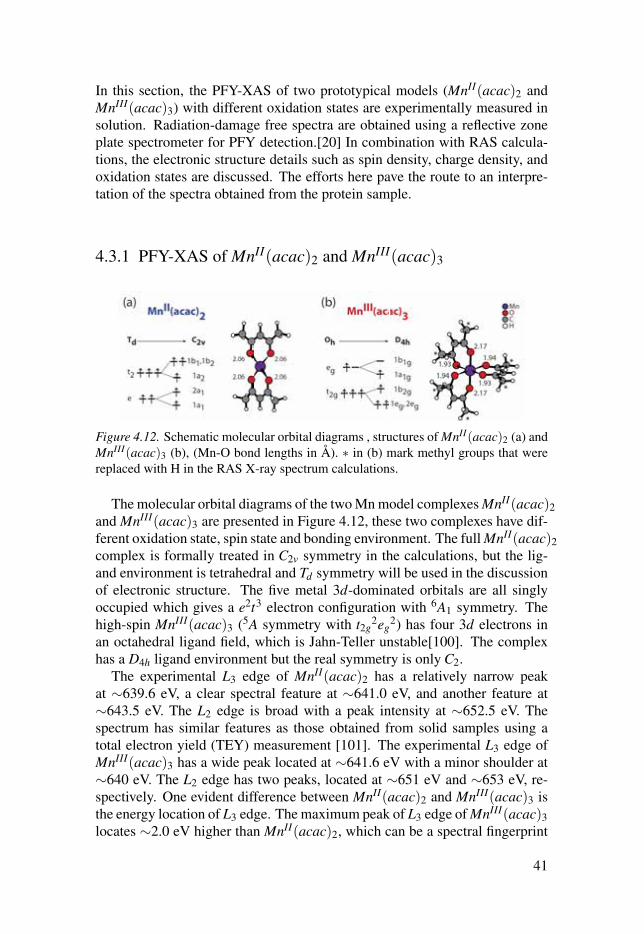
Figure 4.12. Schematic molecular orbital diagrams , structures of MnII(acac)2 (a) andMnIII(acac)3 (b), (Mn-O bond lengths in Å). ∗ in (b) mark methyl groups that werereplaced with H in the RAS X-ray spectrum calculations.
The molecular orbital diagrams of the two Mn model complexes MnII(acac)2and MnIII(acac)3 are presented in Figure 4.12, these two complexes have dif-ferent oxidation state, spin state and bonding environment. The full MnII(acac)2complex is formally treated in C2v symmetry in the calculations, but the lig-and environment is tetrahedral and Td symmetry will be used in the discussionof electronic structure. The five metal 3d-dominated orbitals are all singlyoccupied which gives a e2t3 electron configuration with 6A1 symmetry. Thehigh-spin MnIII(acac)3 (5A symmetry with t2g
2eg2) has four 3d electrons in
an octahedral ligand field, which is Jahn-Teller unstable[100]. The complexhas a D4h ligand environment but the real symmetry is only C2.
The experimental L3 edge of MnII(acac)2 has a relatively narrow peakat ∼639.6 eV, a clear spectral feature at ∼641.0 eV, and another feature at∼643.5 eV. The L2 edge is broad with a peak intensity at ∼652.5 eV. Thespectrum has similar features as those obtained from solid samples using atotal electron yield (TEY) measurement [101]. The experimental L3 edge ofMnIII(acac)3 has a wide peak located at ∼641.6 eV with a minor shoulder at∼640 eV. The L2 edge has two peaks, located at ∼651 eV and ∼653 eV, re-spectively. One evident difference between MnII(acac)2 and MnIII(acac)3 isthe energy location of L3 edge. The maximum peak of L3 edge of MnIII(acac)3locates ∼2.0 eV higher than MnII(acac)2, which can be a spectral fingerprint
41
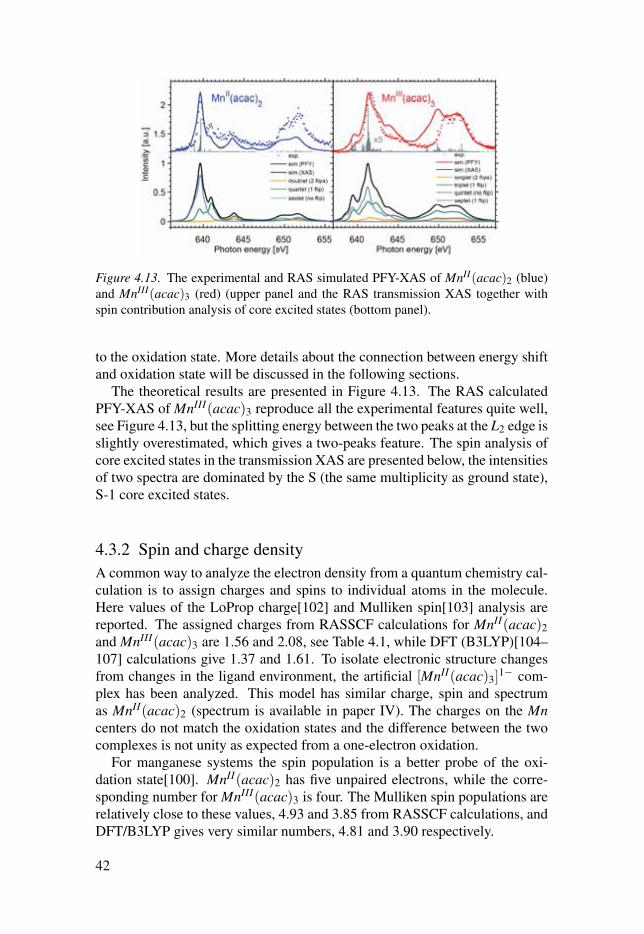
Figure 4.13. The experimental and RAS simulated PFY-XAS of MnII(acac)2 (blue)and MnIII(acac)3 (red) (upper panel and the RAS transmission XAS together withspin contribution analysis of core excited states (bottom panel).
to the oxidation state. More details about the connection between energy shiftand oxidation state will be discussed in the following sections.
The theoretical results are presented in Figure 4.13. The RAS calculatedPFY-XAS of MnIII(acac)3 reproduce all the experimental features quite well,see Figure 4.13, but the splitting energy between the two peaks at the L2 edge isslightly overestimated, which gives a two-peaks feature. The spin analysis ofcore excited states in the transmission XAS are presented below, the intensitiesof two spectra are dominated by the S (the same multiplicity as ground state),S-1 core excited states.
4.3.2 Spin and charge densityA common way to analyze the electron density from a quantum chemistry cal-culation is to assign charges and spins to individual atoms in the molecule.Here values of the LoProp charge[102] and Mulliken spin[103] analysis arereported. The assigned charges from RASSCF calculations for MnII(acac)2and MnIII(acac)3 are 1.56 and 2.08, see Table 4.1, while DFT (B3LYP)[104–107] calculations give 1.37 and 1.61. To isolate electronic structure changesfrom changes in the ligand environment, the artificial [MnII(acac)3]
1− com-plex has been analyzed. This model has similar charge, spin and spectrumas MnII(acac)2 (spectrum is available in paper IV). The charges on the Mncenters do not match the oxidation states and the difference between the twocomplexes is not unity as expected from a one-electron oxidation.
For manganese systems the spin population is a better probe of the oxi-dation state[100]. MnII(acac)2 has five unpaired electrons, while the corre-sponding number for MnIII(acac)3 is four. The Mulliken spin populations arerelatively close to these values, 4.93 and 3.85 from RASSCF calculations, andDFT/B3LYP gives very similar numbers, 4.81 and 3.90 respectively.
42
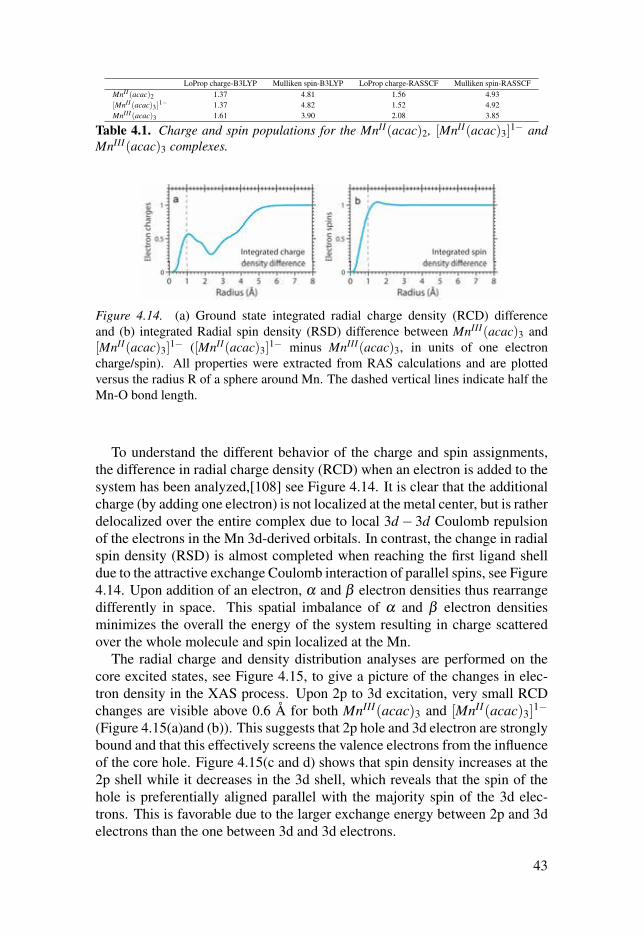
LoProp charge-B3LYP Mulliken spin-B3LYP LoProp charge-RASSCF Mulliken spin-RASSCFMnII (acac)2 1.37 4.81 1.56 4.93[MnII (acac)3 ]
1− 1.37 4.82 1.52 4.92MnIII (acac)3 1.61 3.90 2.08 3.85
Table 4.1. Charge and spin populations for the MnII(acac)2, [MnII(acac)3]1− and
MnIII(acac)3 complexes.
Figure 4.14. (a) Ground state integrated radial charge density (RCD) differenceand (b) integrated Radial spin density (RSD) difference between MnIII(acac)3 and[MnII(acac)3]
1− ([MnII(acac)3]1− minus MnIII(acac)3, in units of one electron
charge/spin). All properties were extracted from RAS calculations and are plottedversus the radius R of a sphere around Mn. The dashed vertical lines indicate half theMn-O bond length.
To understand the different behavior of the charge and spin assignments,the difference in radial charge density (RCD) when an electron is added to thesystem has been analyzed,[108] see Figure 4.14. It is clear that the additionalcharge (by adding one electron) is not localized at the metal center, but is ratherdelocalized over the entire complex due to local 3d− 3d Coulomb repulsionof the electrons in the Mn 3d-derived orbitals. In contrast, the change in radialspin density (RSD) is almost completed when reaching the first ligand shelldue to the attractive exchange Coulomb interaction of parallel spins, see Figure4.14. Upon addition of an electron, α and β electron densities thus rearrangedifferently in space. This spatial imbalance of α and β electron densitiesminimizes the overall the energy of the system resulting in charge scatteredover the whole molecule and spin localized at the Mn.
The radial charge and density distribution analyses are performed on thecore excited states, see Figure 4.15, to give a picture of the changes in elec-tron density in the XAS process. Upon 2p to 3d excitation, very small RCDchanges are visible above 0.6 Å for both MnIII(acac)3 and [MnII(acac)3]
1−(Figure 4.15(a)and (b)). This suggests that 2p hole and 3d electron are stronglybound and that this effectively screens the valence electrons from the influenceof the core hole. Figure 4.15(c and d) shows that spin density increases at the2p shell while it decreases in the 3d shell, which reveals that the spin of thehole is preferentially aligned parallel with the majority spin of the 3d elec-trons. This is favorable due to the larger exchange energy between 2p and 3delectrons than the one between 3d and 3d electrons.
43
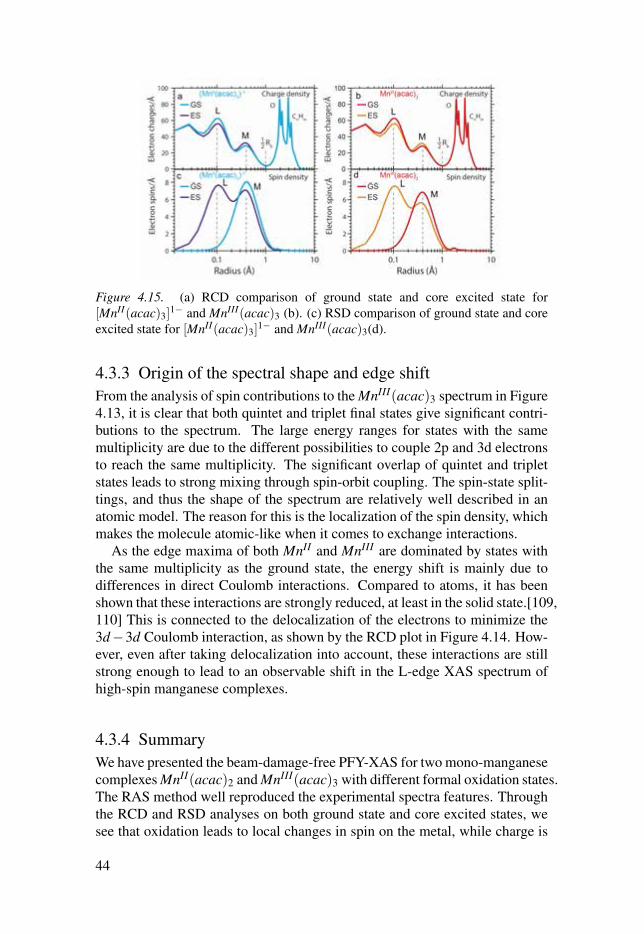
Figure 4.15. (a) RCD comparison of ground state and core excited state for[MnII(acac)3]
1− and MnIII(acac)3 (b). (c) RSD comparison of ground state and coreexcited state for [MnII(acac)3]
1− and MnIII(acac)3(d).
4.3.3 Origin of the spectral shape and edge shiftFrom the analysis of spin contributions to the MnIII(acac)3 spectrum in Figure4.13, it is clear that both quintet and triplet final states give significant contri-butions to the spectrum. The large energy ranges for states with the samemultiplicity are due to the different possibilities to couple 2p and 3d electronsto reach the same multiplicity. The significant overlap of quintet and tripletstates leads to strong mixing through spin-orbit coupling. The spin-state split-tings, and thus the shape of the spectrum are relatively well described in anatomic model. The reason for this is the localization of the spin density, whichmakes the molecule atomic-like when it comes to exchange interactions.
As the edge maxima of both MnII and MnIII are dominated by states withthe same multiplicity as the ground state, the energy shift is mainly due todifferences in direct Coulomb interactions. Compared to atoms, it has beenshown that these interactions are strongly reduced, at least in the solid state.[109,110] This is connected to the delocalization of the electrons to minimize the3d−3d Coulomb interaction, as shown by the RCD plot in Figure 4.14. How-ever, even after taking delocalization into account, these interactions are stillstrong enough to lead to an observable shift in the L-edge XAS spectrum ofhigh-spin manganese complexes.
4.3.4 SummaryWe have presented the beam-damage-free PFY-XAS for two mono-manganesecomplexes MnII(acac)2 and MnIII(acac)3 with different formal oxidation states.The RAS method well reproduced the experimental spectra features. Throughthe RCD and RSD analyses on both ground state and core excited states, wesee that oxidation leads to local changes in spin on the metal, while charge is
44

redistributed over the entire molecule. The same picture holds for both groundand excited states. The spectral shape, which is strongly affected by the ex-change interactions, reflects the local spin density. The shift in incident energybetween two oxidation states is strongly affected by the direct Coulomb inter-actions. Although these interactions are screened due to the delocalization ofcharge, they are large enough to cause a visible shift in the edge energies.
45
5. Hard X-rays
The intensities and relative energies of metal K pre-edge features have highsensitivities to both geometric and electronic structure. Metal K pre-edge isin the hard X-ray regime and the absorption spectrum can be obtained in situ,which offer large freedom for probing samples. It can be used to probe diluteenzymatic systems and working catalysts.[36, 40] The K pre-edge features arenot well resolved due to the short lifetime of the 1s core hole of the final states,which gives a relative larger bandwidth (∼ 1.25 eV for Fe) than the metal Ledge. The electronic structure details from the K pre-edge can be extracted ei-ther by the assistance of accurate theoretical calculations,(Papers V and VI) orby the use of RIXS. With the emergence of RIXS that can give high-resolutionspectral information, it has become important to find a theoretical method thataccurately simulates and interprets spectroscopy in the K edge. It requires amethod can treat the different important effects that shape the spectral fea-tures: ligand-field splitting, multiplet structures, 3d-4p orbital hybridization,and charge-transfer transitions. The RAS application on 1s2p RIXS will bediscussed in this thesis (Paper VII).
5.1 Metal K pre-edge XASHere the RAS method is introduced for the first time to calculate metal Kpre-edge spectra of open-shell transition metal systems (papers V and VI).Intensities for quadrupole transitions have been calculated using an imple-mentation of origin independent quadrupole intensities, where all terms inthe second-order expansion in the intensities are calculated, and not only theterms from the zeroth and first order of the wave-vector expansion.[71] Theperformance of the RAS method is tested by applying it to six iron com-plexes; [FeCl6]n−, [FeCl4]n−, and [Fe(CN)6]n− in ferrous and ferric oxida-tion states. The RAS calculations reproduces the spectral shape of all com-plexes with an average error for the peak splitting of only 0.1 eV, see Table5.1. The accuracy with which both intensities and relative energies can bewell reproduced, suggests that the RAS method can be used to identify andpredict changes in metal K pre-edge spectra that comes from changes in bothoxidation state and ligand environment. The results for complexes [FeCl6]4−,[FeCl4]2−, and[Fe(CN)6]
3− will be mainly discussed in this thesis, other Kpre-edge spectra of mono-metal complexes and dimer are available in Paper Vand VI.
46
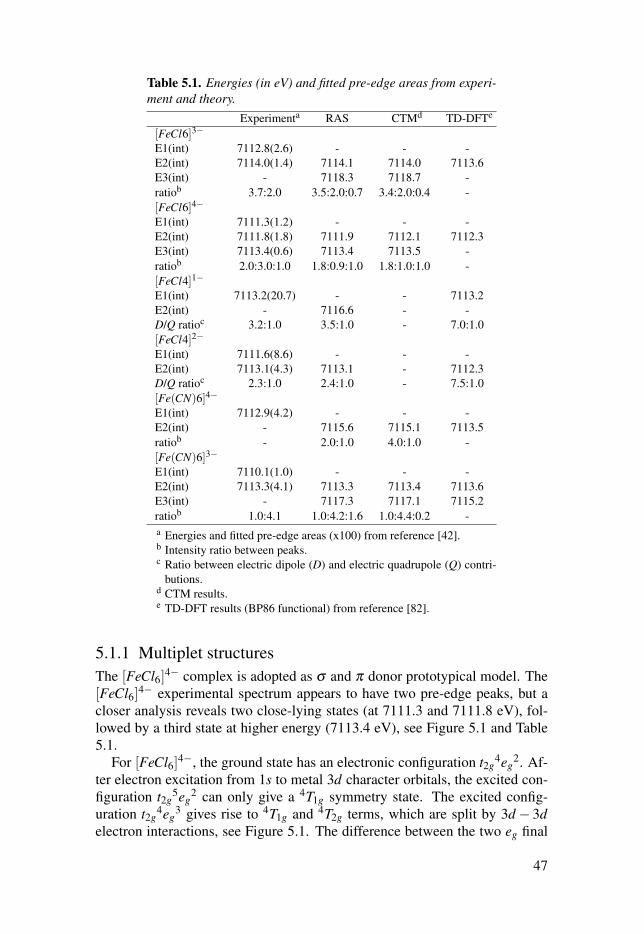
Table 5.1. Energies (in eV) and fitted pre-edge areas from experi-ment and theory.
Experimenta RAS CTMd TD-DFTe
[FeCl6]3−E1(int) 7112.8(2.6) - - -E2(int) 7114.0(1.4) 7114.1 7114.0 7113.6E3(int) - 7118.3 7118.7 -ratiob 3.7:2.0 3.5:2.0:0.7 3.4:2.0:0.4 -[FeCl6]4−E1(int) 7111.3(1.2) - - -E2(int) 7111.8(1.8) 7111.9 7112.1 7112.3E3(int) 7113.4(0.6) 7113.4 7113.5 -ratiob 2.0:3.0:1.0 1.8:0.9:1.0 1.8:1.0:1.0 -[FeCl4]1−E1(int) 7113.2(20.7) - - 7113.2E2(int) - 7116.6 - -D/Q ratioc 3.2:1.0 3.5:1.0 - 7.0:1.0[FeCl4]2−E1(int) 7111.6(8.6) - - -E2(int) 7113.1(4.3) 7113.1 - 7112.3D/Q ratioc 2.3:1.0 2.4:1.0 - 7.5:1.0[Fe(CN)6]4−E1(int) 7112.9(4.2) - - -E2(int) - 7115.6 7115.1 7113.5ratiob - 2.0:1.0 4.0:1.0 -[Fe(CN)6]3−E1(int) 7110.1(1.0) - - -E2(int) 7113.3(4.1) 7113.3 7113.4 7113.6E3(int) - 7117.3 7117.1 7115.2ratiob 1.0:4.1 1.0:4.2:1.6 1.0:4.4:0.2 -a Energies and fitted pre-edge areas (x100) from reference [42].b Intensity ratio between peaks.c Ratio between electric dipole (D) and electric quadrupole (Q) contri-
butions.d CTM results.e TD-DFT results (BP86 functional) from reference [82].
5.1.1 Multiplet structuresThe [FeCl6]4− complex is adopted as σ and π donor prototypical model. The[FeCl6]4− experimental spectrum appears to have two pre-edge peaks, but acloser analysis reveals two close-lying states (at 7111.3 and 7111.8 eV), fol-lowed by a third state at higher energy (7113.4 eV), see Figure 5.1 and Table5.1.
For [FeCl6]4−, the ground state has an electronic configuration t2g4eg
2. Af-ter electron excitation from 1s to metal 3d character orbitals, the excited con-figuration t2g
5eg2 can only give a 4T1g symmetry state. The excited config-
uration t2g4eg
3 gives rise to 4T1g and 4T2g terms, which are split by 3d− 3delectron interactions, see Figure 5.1. The difference between the two eg final
47
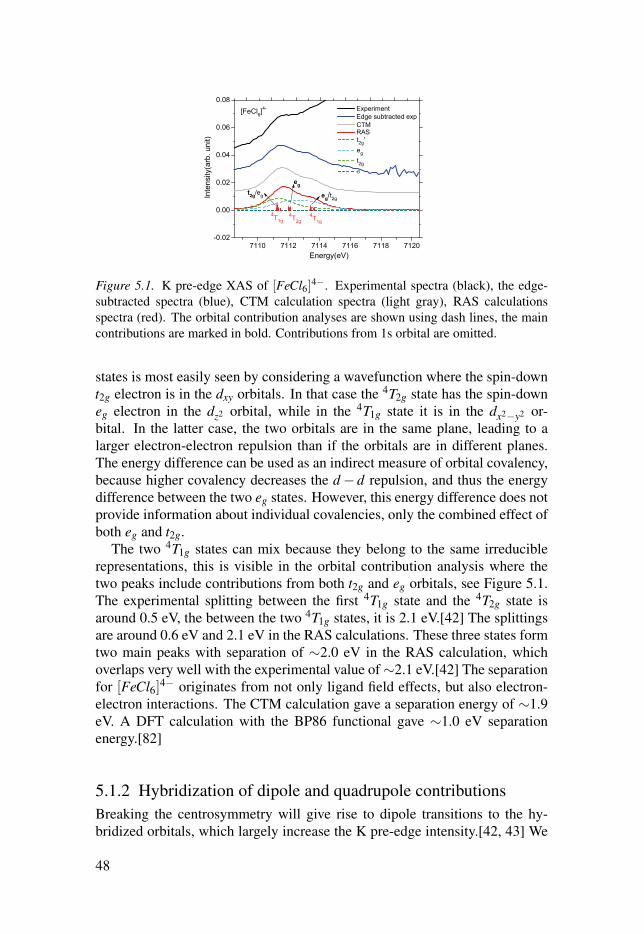
Figure 5.1. K pre-edge XAS of [FeCl6]4−. Experimental spectra (black), the edge-subtracted spectra (blue), CTM calculation spectra (light gray), RAS calculationsspectra (red). The orbital contribution analyses are shown using dash lines, the maincontributions are marked in bold. Contributions from 1s orbital are omitted.
states is most easily seen by considering a wavefunction where the spin-downt2g electron is in the dxy orbitals. In that case the 4T2g state has the spin-downeg electron in the dz2 orbital, while in the 4T1g state it is in the dx2−y2 or-bital. In the latter case, the two orbitals are in the same plane, leading to alarger electron-electron repulsion than if the orbitals are in different planes.The energy difference can be used as an indirect measure of orbital covalency,because higher covalency decreases the d− d repulsion, and thus the energydifference between the two eg states. However, this energy difference does notprovide information about individual covalencies, only the combined effect ofboth eg and t2g.
The two 4T1g states can mix because they belong to the same irreduciblerepresentations, this is visible in the orbital contribution analysis where thetwo peaks include contributions from both t2g and eg orbitals, see Figure 5.1.The experimental splitting between the first 4T1g state and the 4T2g state isaround 0.5 eV, the between the two 4T1g states, it is 2.1 eV.[42] The splittingsare around 0.6 eV and 2.1 eV in the RAS calculations. These three states formtwo main peaks with separation of ∼2.0 eV in the RAS calculation, whichoverlaps very well with the experimental value of∼2.1 eV.[42] The separationfor [FeCl6]4− originates from not only ligand field effects, but also electron-electron interactions. The CTM calculation gave a separation energy of ∼1.9eV. A DFT calculation with the BP86 functional gave ∼1.0 eV separationenergy.[82]
5.1.2 Hybridization of dipole and quadrupole contributionsBreaking the centrosymmetry will give rise to dipole transitions to the hy-bridized orbitals, which largely increase the K pre-edge intensity.[42, 43] We
48
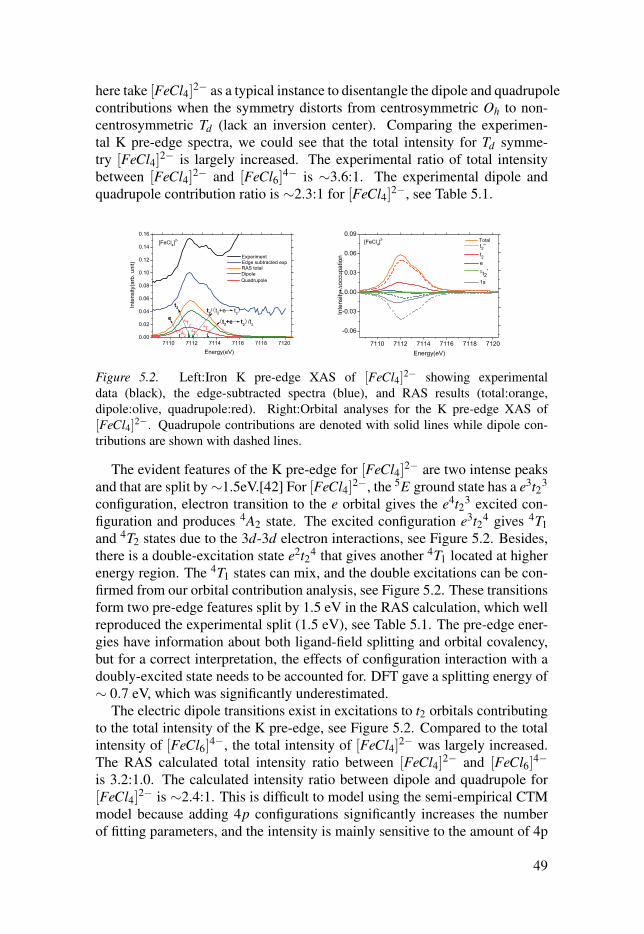
here take [FeCl4]2− as a typical instance to disentangle the dipole and quadrupolecontributions when the symmetry distorts from centrosymmetric Oh to non-centrosymmetric Td (lack an inversion center). Comparing the experimen-tal K pre-edge spectra, we could see that the total intensity for Td symme-try [FeCl4]2− is largely increased. The experimental ratio of total intensitybetween [FeCl4]2− and [FeCl6]4− is ∼3.6:1. The experimental dipole andquadrupole contribution ratio is ∼2.3:1 for [FeCl4]2−, see Table 5.1.
Figure 5.2. Left:Iron K pre-edge XAS of [FeCl4]2− showing experimentaldata (black), the edge-subtracted spectra (blue), and RAS results (total:orange,dipole:olive, quadrupole:red). Right:Orbital analyses for the K pre-edge XAS of[FeCl4]2−. Quadrupole contributions are denoted with solid lines while dipole con-tributions are shown with dashed lines.
The evident features of the K pre-edge for [FeCl4]2− are two intense peaksand that are split by∼1.5eV.[42] For [FeCl4]2−, the 5E ground state has a e3t23
configuration, electron transition to the e orbital gives the e4t23 excited con-figuration and produces 4A2 state. The excited configuration e3t24 gives 4T1and 4T2 states due to the 3d-3d electron interactions, see Figure 5.2. Besides,there is a double-excitation state e2t24 that gives another 4T1 located at higherenergy region. The 4T1 states can mix, and the double excitations can be con-firmed from our orbital contribution analysis, see Figure 5.2. These transitionsform two pre-edge features split by 1.5 eV in the RAS calculation, which wellreproduced the experimental split (1.5 eV), see Table 5.1. The pre-edge ener-gies have information about both ligand-field splitting and orbital covalency,but for a correct interpretation, the effects of configuration interaction with adoubly-excited state needs to be accounted for. DFT gave a splitting energy of∼ 0.7 eV, which was significantly underestimated.
The electric dipole transitions exist in excitations to t2 orbitals contributingto the total intensity of the K pre-edge, see Figure 5.2. Compared to the totalintensity of [FeCl6]4−, the total intensity of [FeCl4]2− was largely increased.The RAS calculated total intensity ratio between [FeCl4]2− and [FeCl6]4−is 3.2:1.0. The calculated intensity ratio between dipole and quadrupole for[FeCl4]2− is ∼2.4:1. This is difficult to model using the semi-empirical CTMmodel because adding 4p configurations significantly increases the numberof fitting parameters, and the intensity is mainly sensitive to the amount of 4p
49
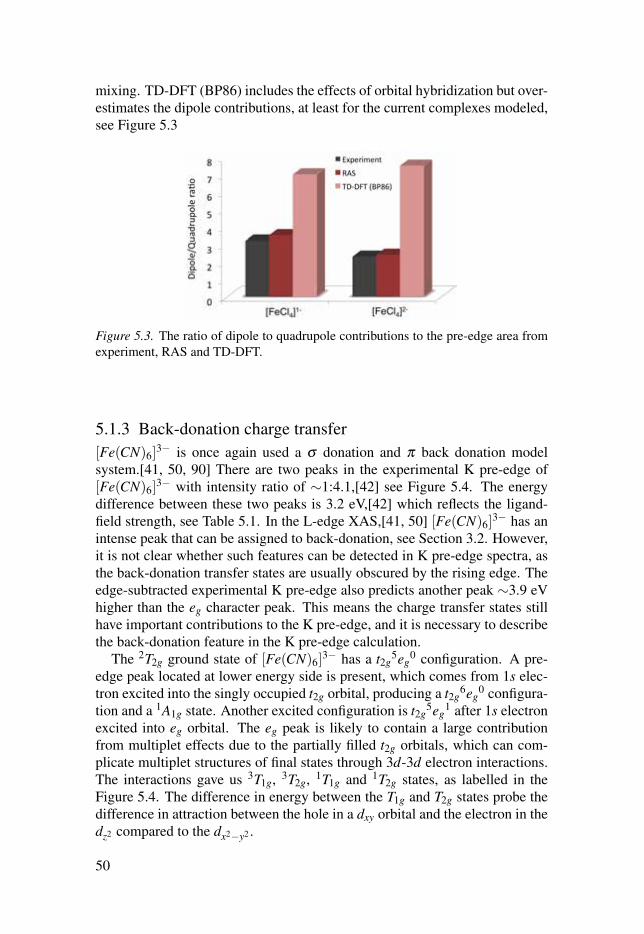
mixing. TD-DFT (BP86) includes the effects of orbital hybridization but over-estimates the dipole contributions, at least for the current complexes modeled,see Figure 5.3
Figure 5.3. The ratio of dipole to quadrupole contributions to the pre-edge area fromexperiment, RAS and TD-DFT.
5.1.3 Back-donation charge transfer[Fe(CN)6]
3− is once again used a σ donation and π back donation modelsystem.[41, 50, 90] There are two peaks in the experimental K pre-edge of[Fe(CN)6]
3− with intensity ratio of ∼1:4.1,[42] see Figure 5.4. The energydifference between these two peaks is 3.2 eV,[42] which reflects the ligand-field strength, see Table 5.1. In the L-edge XAS,[41, 50] [Fe(CN)6]
3− has anintense peak that can be assigned to back-donation, see Section 3.2. However,it is not clear whether such features can be detected in K pre-edge spectra, asthe back-donation transfer states are usually obscured by the rising edge. Theedge-subtracted experimental K pre-edge also predicts another peak ∼3.9 eVhigher than the eg character peak. This means the charge transfer states stillhave important contributions to the K pre-edge, and it is necessary to describethe back-donation feature in the K pre-edge calculation.
The 2T2g ground state of [Fe(CN)6]3− has a t2g
5eg0 configuration. A pre-
edge peak located at lower energy side is present, which comes from 1s elec-tron excited into the singly occupied t2g orbital, producing a t2g
6eg0 configura-
tion and a 1A1g state. Another excited configuration is t2g5eg
1 after 1s electronexcited into eg orbital. The eg peak is likely to contain a large contributionfrom multiplet effects due to the partially filled t2g orbitals, which can com-plicate multiplet structures of final states through 3d-3d electron interactions.The interactions gave us 3T1g, 3T2g, 1T1g and 1T2g states, as labelled in theFigure 5.4. The difference in energy between the T1g and T2g states probe thedifference in attraction between the hole in a dxy orbital and the electron in thedz2 compared to the dx2−y2 .
50
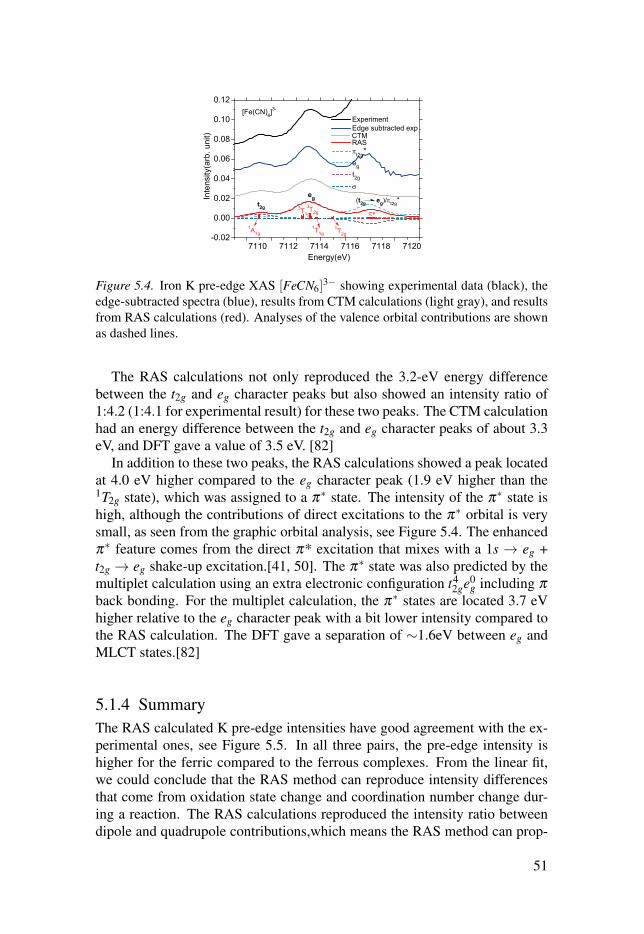
Figure 5.4. Iron K pre-edge XAS [FeCN6]3− showing experimental data (black), the
edge-subtracted spectra (blue), results from CTM calculations (light gray), and resultsfrom RAS calculations (red). Analyses of the valence orbital contributions are shownas dashed lines.
The RAS calculations not only reproduced the 3.2-eV energy differencebetween the t2g and eg character peaks but also showed an intensity ratio of1:4.2 (1:4.1 for experimental result) for these two peaks. The CTM calculationhad an energy difference between the t2g and eg character peaks of about 3.3eV, and DFT gave a value of 3.5 eV. [82]
In addition to these two peaks, the RAS calculations showed a peak locatedat 4.0 eV higher compared to the eg character peak (1.9 eV higher than the1T2g state), which was assigned to a π∗ state. The intensity of the π∗ state ishigh, although the contributions of direct excitations to the π∗ orbital is verysmall, as seen from the graphic orbital analysis, see Figure 5.4. The enhancedπ∗ feature comes from the direct π* excitation that mixes with a 1s → eg +t2g → eg shake-up excitation.[41, 50]. The π∗ state was also predicted by themultiplet calculation using an extra electronic configuration t4
2ge0g including π
back bonding. For the multiplet calculation, the π∗ states are located 3.7 eVhigher relative to the eg character peak with a bit lower intensity compared tothe RAS calculation. The DFT gave a separation of ∼1.6eV between eg andMLCT states.[82]
5.1.4 SummaryThe RAS calculated K pre-edge intensities have good agreement with the ex-perimental ones, see Figure 5.5. In all three pairs, the pre-edge intensity ishigher for the ferric compared to the ferrous complexes. From the linear fit,we could conclude that the RAS method can reproduce intensity differencesthat come from oxidation state change and coordination number change dur-ing a reaction. The RAS calculations reproduced the intensity ratio betweendipole and quadrupole contributions,which means the RAS method can prop-
51
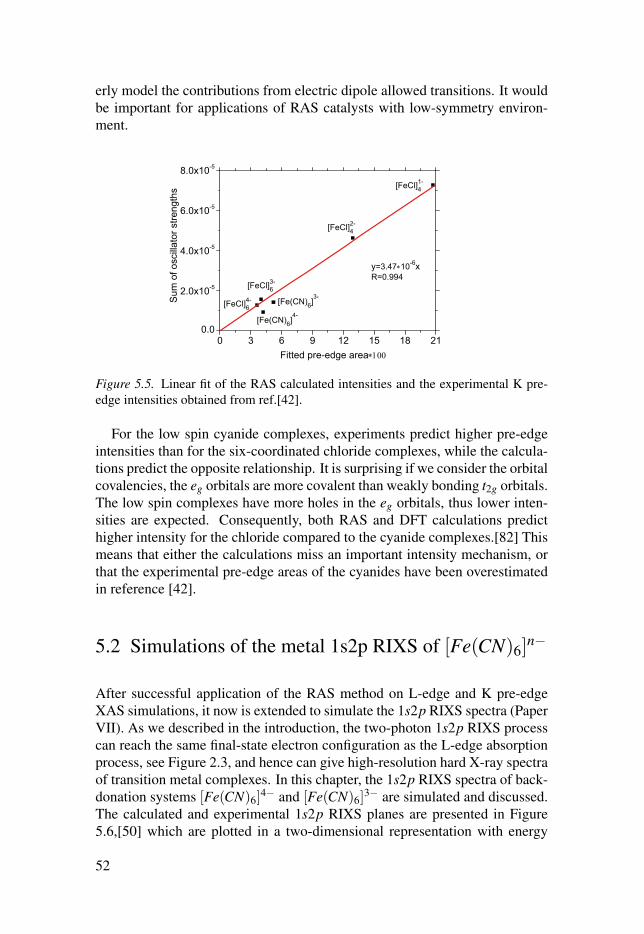
erly model the contributions from electric dipole allowed transitions. It wouldbe important for applications of RAS catalysts with low-symmetry environ-ment.
Figure 5.5. Linear fit of the RAS calculated intensities and the experimental K pre-edge intensities obtained from ref.[42].
For the low spin cyanide complexes, experiments predict higher pre-edgeintensities than for the six-coordinated chloride complexes, while the calcula-tions predict the opposite relationship. It is surprising if we consider the orbitalcovalencies, the eg orbitals are more covalent than weakly bonding t2g orbitals.The low spin complexes have more holes in the eg orbitals, thus lower inten-sities are expected. Consequently, both RAS and DFT calculations predicthigher intensity for the chloride compared to the cyanide complexes.[82] Thismeans that either the calculations miss an important intensity mechanism, orthat the experimental pre-edge areas of the cyanides have been overestimatedin reference [42].
5.2 Simulations of the metal 1s2p RIXS of [Fe(CN)6]n−
After successful application of the RAS method on L-edge and K pre-edgeXAS simulations, it now is extended to simulate the 1s2p RIXS spectra (PaperVII). As we described in the introduction, the two-photon 1s2p RIXS processcan reach the same final-state electron configuration as the L-edge absorptionprocess, see Figure 2.3, and hence can give high-resolution hard X-ray spectraof transition metal complexes. In this chapter, the 1s2p RIXS spectra of back-donation systems [Fe(CN)6]
4− and [Fe(CN)6]3− are simulated and discussed.
The calculated and experimental 1s2p RIXS planes are presented in Figure5.6,[50] which are plotted in a two-dimensional representation with energy
52
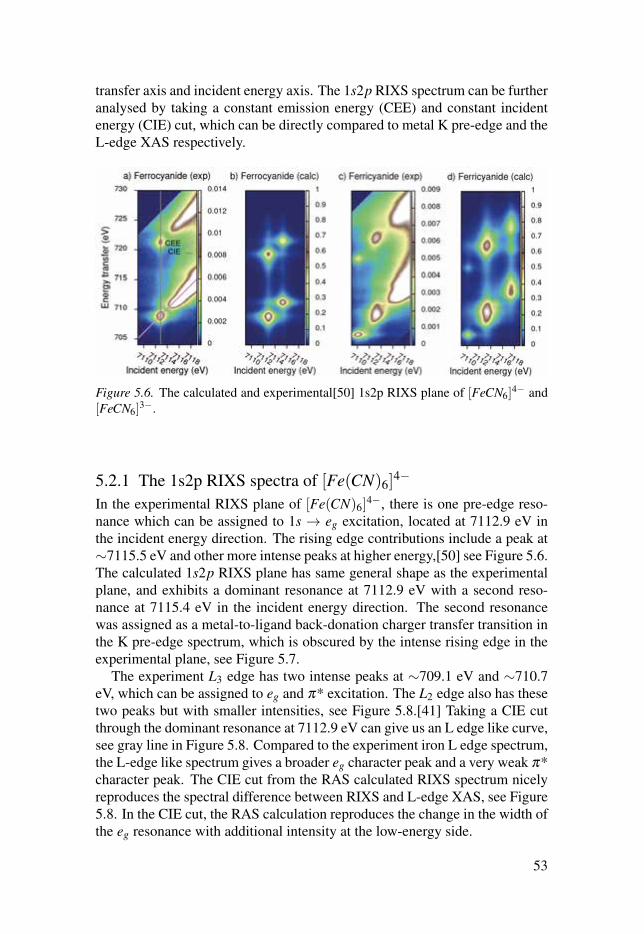
transfer axis and incident energy axis. The 1s2p RIXS spectrum can be furtheranalysed by taking a constant emission energy (CEE) and constant incidentenergy (CIE) cut, which can be directly compared to metal K pre-edge and theL-edge XAS respectively.
Figure 5.6. The calculated and experimental[50] 1s2p RIXS plane of [FeCN6]4− and
[FeCN6]3−.
5.2.1 The 1s2p RIXS spectra of [Fe(CN)6]4−
In the experimental RIXS plane of [Fe(CN)6]4−, there is one pre-edge reso-
nance which can be assigned to 1s → eg excitation, located at 7112.9 eV inthe incident energy direction. The rising edge contributions include a peak at∼7115.5 eV and other more intense peaks at higher energy,[50] see Figure 5.6.The calculated 1s2p RIXS plane has same general shape as the experimentalplane, and exhibits a dominant resonance at 7112.9 eV with a second reso-nance at 7115.4 eV in the incident energy direction. The second resonancewas assigned as a metal-to-ligand back-donation charger transfer transition inthe K pre-edge spectrum, which is obscured by the intense rising edge in theexperimental plane, see Figure 5.7.
The experiment L3 edge has two intense peaks at ∼709.1 eV and ∼710.7eV, which can be assigned to eg and π* excitation. The L2 edge also has thesetwo peaks but with smaller intensities, see Figure 5.8.[41] Taking a CIE cutthrough the dominant resonance at 7112.9 eV can give us an L edge like curve,see gray line in Figure 5.8. Compared to the experiment iron L edge spectrum,the L-edge like spectrum gives a broader eg character peak and a very weak π*character peak. The CIE cut from the RAS calculated RIXS spectrum nicelyreproduces the spectral difference between RIXS and L-edge XAS, see Figure5.8. In the CIE cut, the RAS calculation reproduces the change in the width ofthe eg resonance with additional intensity at the low-energy side.
53
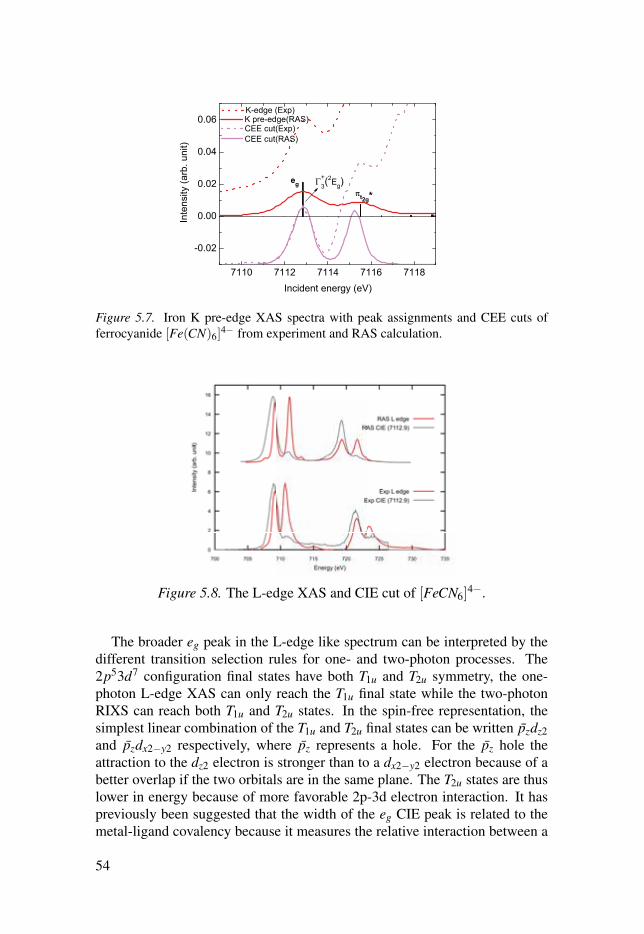
Figure 5.7. Iron K pre-edge XAS spectra with peak assignments and CEE cuts offerrocyanide [Fe(CN)6]
4− from experiment and RAS calculation.
Figure 5.8. The L-edge XAS and CIE cut of [FeCN6]4−.
The broader eg peak in the L-edge like spectrum can be interpreted by thedifferent transition selection rules for one- and two-photon processes. The2p53d7 configuration final states have both T1u and T2u symmetry, the one-photon L-edge XAS can only reach the T1u final state while the two-photonRIXS can reach both T1u and T2u states. In the spin-free representation, thesimplest linear combination of the T1u and T2u final states can be written pzdz2and pzdx2−y2 respectively, where pz represents a hole. For the pz hole theattraction to the dz2 electron is stronger than to a dx2−y2 electron because of abetter overlap if the two orbitals are in the same plane. The T2u states are thuslower in energy because of more favorable 2p-3d electron interaction. It haspreviously been suggested that the width of the eg CIE peak is related to themetal-ligand covalency because it measures the relative interaction between a
54
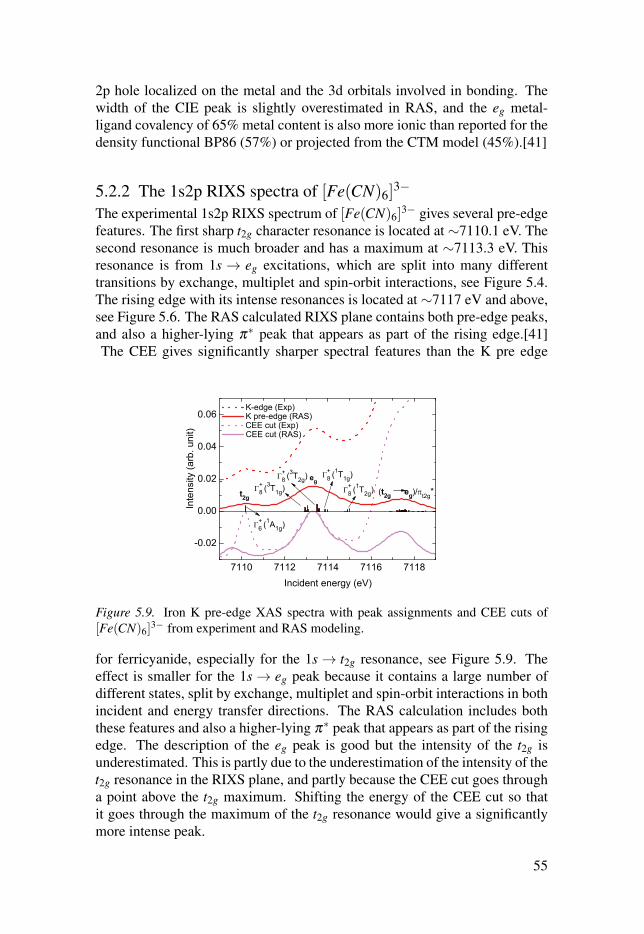
2p hole localized on the metal and the 3d orbitals involved in bonding. Thewidth of the CIE peak is slightly overestimated in RAS, and the eg metal-ligand covalency of 65% metal content is also more ionic than reported for thedensity functional BP86 (57%) or projected from the CTM model (45%).[41]
5.2.2 The 1s2p RIXS spectra of [Fe(CN)6]3−
The experimental 1s2p RIXS spectrum of [Fe(CN)6]3− gives several pre-edge
features. The first sharp t2g character resonance is located at ∼7110.1 eV. Thesecond resonance is much broader and has a maximum at ∼7113.3 eV. Thisresonance is from 1s → eg excitations, which are split into many differenttransitions by exchange, multiplet and spin-orbit interactions, see Figure 5.4.The rising edge with its intense resonances is located at ∼7117 eV and above,see Figure 5.6. The RAS calculated RIXS plane contains both pre-edge peaks,and also a higher-lying π∗ peak that appears as part of the rising edge.[41]The CEE gives significantly sharper spectral features than the K pre edge
Figure 5.9. Iron K pre-edge XAS spectra with peak assignments and CEE cuts of[Fe(CN)6]
3− from experiment and RAS modeling.
for ferricyanide, especially for the 1s → t2g resonance, see Figure 5.9. Theeffect is smaller for the 1s → eg peak because it contains a large number ofdifferent states, split by exchange, multiplet and spin-orbit interactions in bothincident and energy transfer directions. The RAS calculation includes boththese features and also a higher-lying π∗ peak that appears as part of the risingedge. The description of the eg peak is good but the intensity of the t2g isunderestimated. This is partly due to the underestimation of the intensity of thet2g resonance in the RIXS plane, and partly because the CEE cut goes througha point above the t2g maximum. Shifting the energy of the CEE cut so thatit goes through the maximum of the t2g resonance would give a significantlymore intense peak.
55
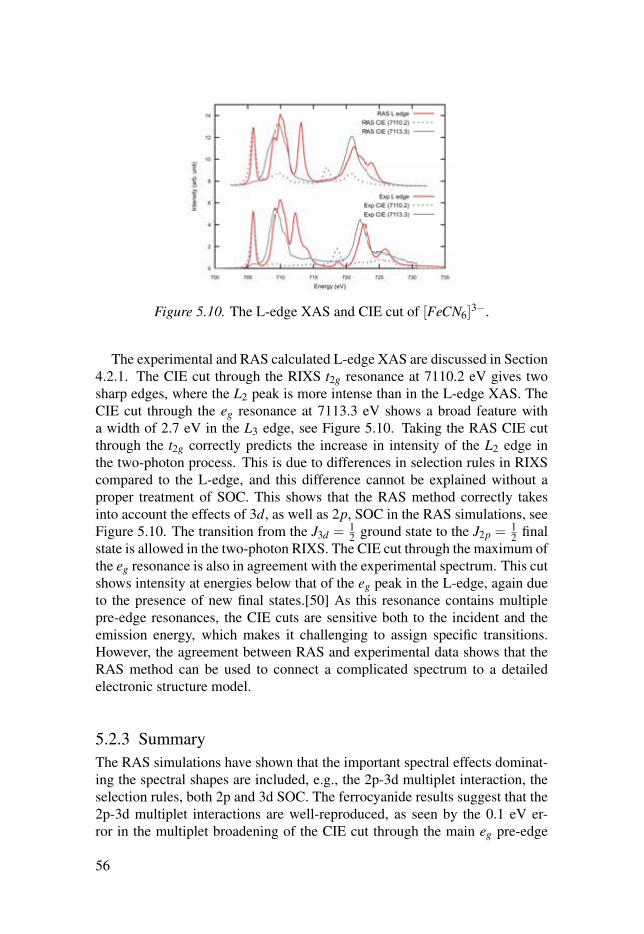
Figure 5.10. The L-edge XAS and CIE cut of [FeCN6]3−.
The experimental and RAS calculated L-edge XAS are discussed in Section4.2.1. The CIE cut through the RIXS t2g resonance at 7110.2 eV gives twosharp edges, where the L2 peak is more intense than in the L-edge XAS. TheCIE cut through the eg resonance at 7113.3 eV shows a broad feature witha width of 2.7 eV in the L3 edge, see Figure 5.10. Taking the RAS CIE cutthrough the t2g correctly predicts the increase in intensity of the L2 edge inthe two-photon process. This is due to differences in selection rules in RIXScompared to the L-edge, and this difference cannot be explained without aproper treatment of SOC. This shows that the RAS method correctly takesinto account the effects of 3d, as well as 2p, SOC in the RAS simulations, seeFigure 5.10. The transition from the J3d = 1
2 ground state to the J2p =12 final
state is allowed in the two-photon RIXS. The CIE cut through the maximum ofthe eg resonance is also in agreement with the experimental spectrum. This cutshows intensity at energies below that of the eg peak in the L-edge, again dueto the presence of new final states.[50] As this resonance contains multiplepre-edge resonances, the CIE cuts are sensitive both to the incident and theemission energy, which makes it challenging to assign specific transitions.However, the agreement between RAS and experimental data shows that theRAS method can be used to connect a complicated spectrum to a detailedelectronic structure model.
5.2.3 SummaryThe RAS simulations have shown that the important spectral effects dominat-ing the spectral shapes are included, e.g., the 2p-3d multiplet interaction, theselection rules, both 2p and 3d SOC. The ferrocyanide results suggest that the2p-3d multiplet interactions are well-reproduced, as seen by the 0.1 eV er-ror in the multiplet broadening of the CIE cut through the main eg pre-edge
56

resonance. In ferricyanide, the relative energies of the t2g and eg pre-edgeresonances are reproduced within 0.2 eV. Both examples have centrosymme-try, however, the application of RAS method is not limited to high symmetry.The primary reason for choosing symmetric systems was the possibility to un-ambiguously identify electronic states and assign transitions. In the previoussection, we have already shown that the RAS method can account for 3d-4porbital hybridization, which makes it possible to apply RAS to model hardX-ray RIXS on low-symmetry (non-centrosymmetry) complexes. The appli-cation of RAS method does not have to be restricted to the 1s2p RIXS, it canbe applied to other photon processes of interest, e.g., the electron decay to fill1s hole can be metal 3p orbitals or other ligand character valence orbitals.
57
6. Conclusion and outlook
In this thesis, the RAS method has been used to simulate and interpret themetal L-edges XAS (Papers I to III), 3d PFY-XAS (Paper IV), K pre-edges(Papers V and VI) and 1s2p RIXS (Paper VII) spectroscopies of differentmanganese and iron complexes. The experimental spectral features are wellreproduced in the RAS simulations by including a high-level description of2p and 3d SOC, ligand field, multiplet effects, 3d− 4p orbital hybridization,selection rules, as well as charge transfer between metal and ligands. These re-sults make RAS an attractive method to model different X-ray spectroscopiesof metal catalysts, particularly for the catalysts in solution environment.
More specifically, the splitting between the L3 and L2 edge is underesti-mated by∼1.0 eV (∼10% of the 2p SOC magnitude), it might be related to theorbital optimization scheme in the RAS calculation. To avoid the 2p core or-bital rotation with high-lying 3p robitals, the 2p core orbitals have been frozenin the RAS calculation. The deviation constantly exists in all the RAS calcu-lation of metal L edge spectra, and the relative energies of different peaks candeliver more useful information. Apart from 2p SOC, an accurate descriptionof 3d SOC is also essential for the modeling of metal L-edge XAS spectra.In the low spin Fe3+ case, accounting for 3d SOC leads to visible changes,which are connected to differences in selection rules for the different SOCstates. In the FeII(P), the 3d SOC is also required to describe the potentialmixing among low-lying states of different multiplicity.
The RAS method can provide an accurate way to describe multiplet struc-tures, which are important to shape the metal L-edge spectra. Through com-parison of the metal L-edge XAS of [Fe(CN)6]
n and [Fe(P)(ImH)2]n com-
plexes, the spectral fingerprints in oxidation state and ligand environmentare observed and discussed. The RAS calculations and similarity analysesof the metal L-edge XAS with different low-lying spin states are performedon Fe(P), the accuracy gives us confidence to use RAS simulations to finger-print the different spin states based on their spectral features. The combinationof experimental measurements of beam damage free 3d PFY-XAS and RASspectra simulations on MnII(acac)2 and MnIII(acac)3 paves a route to under-stand the electronic structure of Mn4CaO5 cluster in photosystem II. This isdone by connecting to spin and charge density differences between groundstate and excited state to spectral shape and incident energy shift.
In the K pre-edge XAS, the multiplet structures might be obscured by thelarge natural bandwidth, but with RIXS experiment can reach high resolutionin the energy transfer direction. Therefore, it becomes necessary to describe
58
the multiplet structures in the hard X-ray region. In the example of [FeCl6]4−,the K pre-edge XAS gives a two-peak feature, which is separated by not onlyligand field effects, but also electron electron interactions, which confirmed bythe RAS calculation and orbital contribution analysis. An important intensitymechanism for K pre-edge XAS is 3d−4p orbital hybridization, the distortionfrom centrosymmetry can give arise electric dipole transitions in the K pre-edge region due to metal 4p orbital component delocalization into the valence3d orbital. It is essential to be able to estimate the dipole contributions tocorrectly predict spectral effects when a catalyst site changes during a reaction.The RAS method enables calculations of the metal K pre-edge XAS intensitiesin the length representation and makes it adequate for systems containing morethan one transition metal element.
The charge transfer between metal and ligands can be described by includ-ing important ligand character orbitals in the active space. For example, withback-donation orbitals in the active space, the MLCT features are observed inmetal L-edge, K pre-edge and 1s2p RIXS of the ferrous- and ferricyanide com-plexes. With π donation orbitals in the active space for FeII(P)(ImH)2, theLMCT features at low energy side of L3 edge can be well described. For the3d PFY-XAS spectra calculations of Mn complexes in this thesis, the chargetransfer contributions are small, and the RAS calculations can reproduce themajor experiment spectra features without including the ligand character or-bitals in the active space.
The applications in this thesis show that RAS can be extended from smallto medium size of systems by proper selections of active space, basis set andcomputational algorithms. For the metal L-edge and K pre-edge spectra, thecore orbitals uses one of three RAS sub-spaces, which leaves flexibility in thedesign of the valence orbitals in another two RAS sub-space for lowering thecomputational cost. In the 1s2p RIXS calculation, two different types of coreorbitals are included in two RAS sub-spaces, which leaves no room to designthe valence active space. In this case, the limitation can potentially be ad-dressed by using a generalized active space approach, which can include moresub-spaces.[111–113] However, it remains challenging to apply RAS methodon multi-metal complexes, which require a large number of active orbitalsto deal with electron correlations. The density matrix renormalization grouptechnique can largely decrease the cost for large active space (up to 40 activeorbitals),[114–116] which make it a promising method to deal with compli-cate systems, such as multi-metal Mn4CaO5 cluster in photosystem II.[117]The developments of these techniques allow us to use them in the future X-rayspectroscopy calculation and interpretation.
59
7. Sammanfattning på svenska
Många kemiska reaktioner är beroende av effektiva katalysatorer gjorda avövergångsmetaller. En viktig utmaning för ett framtida hållbart energisystemär att kunna omvandla solenergin till kemisk energi i bränslen, t ex vätgas ellermetanol. Ett exempel på en välfungerande katalysator är växternas fotosyntessom effektivt katalyserar uppdelningen av vatten till syre med hjälp av man-gan. Molekylära katalysatorer baserade på järn, koppar och mangan är idealakandidater för att ersätta de ämnen som idag används så som iridium och plat-inum, vilka inte är hållbara tillgångsmässigt. De syntetiska katalysatorer somfinns idag är dock inte tillräckligt effektiva och bryts ned alldeles för lätt. Föratt framställa bättre katalysatorer är det viktigt att på detaljerad nivå kunnastudera deras struktur och egenskaper.
En vanlig metod för att undersöka en katalysators egenskaper är att sevilken typ av synligt ljus den absorberar. Den metoden är dock svår att an-vända för många system eftersom det synliga ljuset kan absorberas i andradelar systemet än just den katalytiska metallen. För att komma runt det prob-lemet används röntgenstrålning. Varje grundämne absorberar strålning somhar tillräckligt med energi för att excitera en elektron från ett av de inre elek-tronskalen. Genom att anpassa strålningens energi kan man fokusera på denövergångsmetall som utgör den aktiva delen av katalysatorn. Med röntgen-spektroskopi kan man till exempel undersöka strukturen av olika katalytiskacentra, oxidationstillstånd, och metall-ligand bindningen. Olika typer av spek-troskopi får fram olika information om systemet och det är i stort systemetsomgivning som avgör vilken spektroskopi som kan användas.
Metallprotein och metallkomplex i lösning har tradionellt studerats medhårdröntgen eftersom den inte absorberas så starkt av omgivningen. Utveck-lingen av intensiva röntgenkällor som frielektronlasrar samt nya effektiva de-tektorer gör det nu möjligt att studera sådana system med högupplöst mjukrönt-genstrålning. Framstegen för de experimentella metoderna leder till behovav teoretiska modeller som kan tolka den nya informationen. Avhandlin-gen presenterar framsteg i modellering av röntgenspektra med Restricted Ac-tive Space (RAS), som är baserad på en korrekt beskrivning av den kvant-mekaniska vågfunktionen. Metoden har använts för att analysera mjukrönt-genspektra och på vilket sätt de kan användas för att studera metallers elek-tronstruktur. Dessutom beskrivs en utvidgning av metoden för att beskrivaäven hårdröntgenspektra. Det gör att samma metod nu kan användas för attbeskriva samtliga röntgenabsorptionsprocesser som används för katalysatoreri lösning.
60
RAS-metoden kan, med god precision, ta hänsyn till alla viktiga faktorersom beskriver röntgenspektra för bundna tillstånd: multiplettstruktur, spinn-ban-koppling samt metall-ligand interaktioner. Flera modellmolekyler, proto-typer för de större katalytiska systemen, har använts för att testa RAS-metodensöverensstämmelse med experiment och dess förmåga att särskilja komplexutifrån dess elektronstruktur. Generellt är RAS-metoden väldigt flexibel ivilka system den kan hantera. Det baseras på iden av att det går att få ut godprecisionen jämfört med tyngre elektronkonfigurationsinteraktionsberäkningar,genom att välja ut de orbitaler som är viktiga för röntgenprocessen, och låtaalla elektronkonfigurationer interagera inom det rummet. Olika typer av rönt-genspektroskopiska processer kan beskrivas, om rätt orbitaler väljs och förde-las på rätt sätt i det det aktiva rummet.
Med hjälp RAS-metoden har röntgenspektrat från L-absorptionskanten, sombeskriver excitation från 2p till 3d orbitalerna, undersökts för [FeII/III(CN)6]
4−/3−i två olika oxidationstillstånd, tvåvärt och trevärt. De två systemen fungerarsom modell för σ -donation och π-bakdonation. Effekterna av multiplettstruk-turen, π bakåtdoneringseffekten, samt spinn-ban-koppling kan beskrivas medhög noggranhet. Flera tester har gjorts för att undersöka hut känsliga resul-taten är för detaljer i RAS beräkningarna. Simuleringar har också gjorts förL-absorptionskanten på hemjärn som är en viktig komponent i flera viktigaenzymer, t ex hemoglobin som transporterar syre. Hemjärn har samma typav metall-ligand bindning som [Fe(CN)6]
n− och skillnaderna i röntgenspektrakan användas för att närmare studera hur liganderna påverkar elektronstruk-turen hos järn. RAS-beräkningar har dessutom utförts för att visa hur metallersL-absorptionskant kan vara kraftfulla prober för att identifiera en elektronkon-figurationen från dessa spektroskopiska “fingeravtryck”. Ett första steg harockså tagits för att kvantitativt jämföra likheten mellan experimentella ochteoretiskt beräknade röntgenspektra.
För att bidra till förståelsen kring hur manganklustret som oxiderar vat-ten till syrgas i växternas fotosyntes kan studeras har två mangansystem medolika oxidationstillstånd, MnII(acac)2 och MnIII(acac)3, studerats med L-kantsabsorptionsspektra som detekteras med partiell fluorescens. Genom RAS-beräkningar diskuteras hur skillnaderna i experimentella resultat mellan kom-plex med olika formella oxidationstal kan relateras till förändringarna i spin-och laddningstäthet.
Utvecklingen av RAS-metoden har möjliggjort de första RAS beräkningarnaav hårdröntgenexcitation från 1s till 3d orbitaler, just före K-absorptionskanten..Det har skett bortom dipolapproximationen genom att implementera en ap-proximativt ursprungsoberoende beräkning av övergångarnas intensitet sominkluderar bland annat elektrisk kvadrupol och magnetisk dipol. Återigendiskueras spektrat för de centrosymmetriska komplexen [Fe(CN)6]
n− som mod-ellsystem för σ -donation och π-bakdonation. Intensiteten för övergångarnaökar signifikant om centrosymmetrin bryts, till exempel när systemet är tetraedrisktkoordinerat som i [FeCl4]−. Detta möjliggör för hybridisering mellan 3d och
61

4p orbitaler, vilket i sin tur leder till att urvalsregler som tidigare förbjöddipolövergångar nu hävs och dessa övergångar kan observeras även före denverkliga K-absorptionskanten. Att kunna beskriva effekten av symmetriän-dringar är avgörande för att studera en katalysprocess där geometrin ändrasunder reaktionen.
Ett problem med övergångarna i K-kanten är att de högenergitillstånd somskapas efter röntgenabsorption är väldigt kortlivade. Enligt kvantmekanikensosäkerhetsprincip blir då övergångarnas energi svårbestämda och detaljer gårförlorade. För att ge högupplösta detaljer om elektronstrukturen i energiom-rådet för hård röntgenstrålning används tvåfotonprocessen resonant inelastiskröntgenspridning. Den specifika process som studerats har samma sluttillståndsom L-absorptionskanten men med olika urvalsregler. Båda experimentenbeskrivs väl av RAS och användandet av molekylorbitalteori visar hur skill-naderna mellan experimenten kan användas för att få en detaljerad bild avorbitalerna.
Sammantaget beskriver avhandlingen framsteg i hur den multikonfigura-tionella vågfunktionsmetoden RAS kan användas för att simulera, tolka ochäven förutsäga experimentella resultat, oavsett vilken typ av röntgenspektroskopisom är av intresse. Genom detaljerad information om vilka elektronkonfigura-tioner som ingår i en specifik vågfunktion kan röntgenspektra förklaras utifrånett och samma teoretiska ramverk. I framtida studier är målet att använda dessametoder för att med god säkerhet identifiera reaktiva tillstånd samt analyseravilka faktorer som är viktiga för att uppnå effektiv katalys.
62
Acknowledgements
I never realized four-years PhD life goes so fast until I come to this section,scenes of the first days still clearly rose before my eyes. I feel so lucky tohave the opportunity to study in Sweden, and meet so many great people, andexperience different culture during this journey. I would sincerely thank allpeople come to my life, there is no chance to arrive the destination of my PhDjournal without your support, encouragement and care.
First and foremost I would like to express warmest gratitude to my super-visor, the best of the best, Marcus Lundberg, for bringing me to Sweden,guiding me to the field of X-ray spectroscopy, and encouraging me to buildinternal and external collaborations with different groups. It is luxury to haveso many meetings and discussions with you, I really enjoyed every discussionand learned a lot from you, thanks very much for your remarkable patience.The course of ’Theory of transition metal’ lectured by you is the best course Ihave attended, I benefit really a lot from this course, you should make it publicfor more students.
I would like to thank my co-supervisor and the group leader Roland Lindh,for your dedication to building positive, creative and loving working environ-ment, make us work as a team, even family. I keep in mind the words ’We doserious science’ you said at the first day we met.
I would like to thank Rongxing He, who introduced me to theoreticalchemistry as first initiation teacher, thanks for your continuous encourage-ment throughout my years of PhD study, and thanks for your advice in mystudy and life.
I would like to appreciate the help from colleagues Erik Källman andLasse Kragh Sørensen, who shared me the invaluable ideas on the projectswe have done, and comments on my thesis.
I am also grateful to all the former and present member in the theoreti-cal chemistry group, Ignacio Fernández Galván, Morgane Vacher, Hans
Karlsson, Nessima Salhi, Rahul V. Pinjari, Esko Makkonen, Liqin Xue,
Michael Stenrup, Pooria Farahani, Charlotta Bengtson, Dennis Caldwell,
Orlando Tapia, Mickaël G Delcey, Martin Agback, Piotr Froelich, andmany others, who shared many happiness in the FIKA and lunch time.
The collaboration between Philippe Wernet, Markus Kubin from HelmholtzZentrum Berlin triggered my interest in the the X-ray experiment, and I re-ally learned a lot from our hundreds of email conversion and discussions, andalso thanks very much for your host when I was at BESSYII. Thank Junko
Yano, Uwe Bergmann for your support in the position application process,
63

thank you and Thomas Kroll for the invaluable instructions in the beamtimeat LCLS, which are helpful for me to understand more about the X-ray ex-periments, especially thank Thomas Fransson for the discussions and helpduring the beamtime. Thank Leif Hammarström, Tianfei Liu for involvingme in your interesting project, I have enjoyed working with you.
I would never survive the PhD life without fresh air outside lab. A warmthank you to Chengyu Wang, Jing Chen, Ylva Gardenia Wang and cuteBao sisters for your hospitality and delicious foods in the weekends, yourmeticulous care make me feel being at home here, I will definitely miss thedesserts made by Bao. Thank Shixiong Xu, Cici, Yohan, Patrick, Brigitte,
Laura, and Jian Ren for the good time we had during my traveling and vis-iting.
To my Chinese friends who are and were in Sweden, Fengzhen Sun, Wenx-
ing Yang, Feiyan Liang, Shunguo Wang, Lichuan Wu, Yi Ren, Weijia
Yang, Song Chen, Dou Du, Liguo Wang, Jieying Cui, Shihuai Wang,
Jiefang Zhu, Shuainan Zhao, Zhaohui Wang, Hailiang Fang, Chengyu
Wen, Shuangshuang Zeng, Mingzhi Jiao, Chengjun Wu, Liyang Shi, Jiao-
jiao Yang, Changqing Ruan, Jiajie Yan, Gang Duan, Lin Li, Lei Zhang,
Jinwen Song, Jun Luo, Chenjuan Liu, Teng Zhang, Yongmei Gong, Shu
Li, Xiaowen Li, it is so nice to meet all you here, thanks for all the happinessand delicious foods we shared together.
At the final stage, I would like to express my profound gratitude to myparents and sisters, you are always there for me, thanks for the infinite under-standing and support. I would like to say a heartfelt ’thank you’ to the mostspecial person, my beloved girlfriend,Yuhan Ma, thank you for being here forthe last year of my PhD study, it is the biggest support to me. I love you!
64
References
[1] Nicola Armaroli and Vincenzo Balzani. The future of energy supply:challenges and opportunities. Angewandte Chemie International Edition, 46(1-2):52–66, 2007.
[2] Harun Tüysüz and Candace K Chan. Solar energy for fuels. Springer, 2016.[3] John Whitmarsh et al. The photosynthetic process. In Concepts in
Photobiology, pages 11–51. Springer, 1999.[4] Nathan Nelson and Charles F Yocum. Structure and function of photosystems
i and ii. Annu. Rev. Plant Biol., 57:521–565, 2006.[5] James Barber. Photosynthetic energy conversion: natural and artificial.
Chemical Society Reviews, 38(1):185–196, 2009.[6] Devens Gust, Thomas A Moore, and Ana L Moore. Solar fuels via artificial
photosynthesis. Accounts of Chemical Research, 42(12):1890–1898, 2009.[7] Tomoji Kawai and Tadayoshi Sakata. Conversion of carbohydrate into
hydrogen fuel by a photocatalytic process. Nature, 286(5772):474–476, 1980.[8] Nathan S Lewis and Daniel G Nocera. Powering the planet: Chemical
challenges in solar energy utilization. Proceedings of the National Academy ofSciences, 103(43):15729–15735, 2006.
[9] Akihiko Kudo and Yugo Miseki. Heterogeneous photocatalyst materials forwater splitting. Chemical Society Reviews, 38(1):253–278, 2009.
[10] Kazuhiko Maeda and Kazunari Domen. Photocatalytic water splitting: recentprogress and future challenges. The Journal of Physical Chemistry Letters, 1(18):2655–2661, 2010.
[11] Eugen S Andreiadis, Murielle Chavarot-Kerlidou, Marc Fontecave, andVincent Artero. Artificial photosynthesis: From molecular catalysts forlight-driven water splitting to photoelectrochemical cells. Photochemistry andPhotobiology, 87(5):946–964, 2011.
[12] Savio JA Moniz, Stephen A Shevlin, David James Martin, Zheng-Xiao Guo,and Junwang Tang. Visible-light driven heterojunction photocatalysts forwater splitting–a critical review. Energy & Environmental Science, 8(3):731–759, 2015.
[13] Pingwu Du and Richard Eisenberg. Catalysts made of earth-abundant elements(co, ni, fe) for water splitting: recent progress and future challenges. Energy &Environmental Science, 5(3):6012–6021, 2012.
[14] Vincent Artero, Murielle Chavarot-Kerlidou, and Marc Fontecave. Splittingwater with cobalt. Angewandte Chemie International Edition, 50(32):7238–7266, 2011.
[15] Isolda Roger and Mark D Symes. First row transition metal catalysts forsolar-driven water oxidation produced by electrodeposition. Journal ofMaterials Chemistry A, 4(18):6724–6741, 2016.
[16] Junko Yano and Vittal K Yachandra. X-ray absorption spectroscopy.Photosynthesis Research, 102(2-3):241, 2009.
65
[17] Wolfgang Gudat and Christof Kunz. Close similarity between photoelectricyield and photoabsorption spectra in the soft-x-ray range. Physical ReviewLetters, 29(3):169, 1972.
[18] Simon Schreck, Gianina Gavrila, Christian Weniger, and Philippe Wernet. Asample holder for soft x-ray absorption spectroscopy of liquids in transmissionmode. Review of Scientific Instruments, 82(10):103101, 2011.
[19] Maria Ekimova, Wilson Quevedo, Manfred Faubel, Philippe Wernet, andErik TJ Nibbering. A liquid flatjet system for solution phase soft-x-rayspectroscopy. Structural Dynamics, 2(5):054301, 2015.
[20] Rolf Mitzner, Jens Rehanek, Jan Kern, Sheraz Gul, Johan Hattne, TaketoTaguchi, Roberto Alonso-Mori, Rosalie Tran, Christian Weniger, HenningSchrder, et al. L-edge x-ray absorption spectroscopy of dilute systems relevantto metalloproteins using an x-ray free-electron laser. The Journal of PhysicalChemistry Letters, 4(21):3641–3647, 2013.
[21] David Attwood. Soft x-rays and extreme ultraviolet radiation. Soft X-Rays andExtreme Ultraviolet Radiation, by David Attwood, pp. 486. ISBN 0521652146.Cambridge, UK: Cambridge University Press, August 1999., page 486, 1999.
[22] Kathrin M Lange and Emad F Aziz. Electronic structure of ions and moleculesin solution: a view from modern soft x-ray spectroscopies. Chemical SocietyReviews, 42(16):6840–6859, 2013.
[23] Pieter Glatzel and Uwe Bergmann. High resolution 1s core hole x-rayspectroscopy in 3d transition metal complexes-electronic and structuralinformation. Coordination Chemistry Reviews, 249(1):65–95, 2005.
[24] Ida Josefsson, Kristjan Kunnus, Simon Schreck, Alexander Föhlisch, Frankde Groot, Philippe Wernet, and Michael Odelius. Ab initio calculations ofx-ray spectra: Atomic multiplet and molecular orbital effects in amulticonfigurational scf approach to the l-edge spectra of transition metalcomplexes. The Journal of Physical Chemistry Letters, 3(23):3565–3570,2012.
[25] Nicholas Engel, Sergey I Bokarev, Edlira Suljoti, Raul Garcia-Diez, Kathrin MLange, Kaan Atak, Ronny Golnak, Alexander Kothe, Marcus Dantz, OliverKühn, et al. Chemical bonding in aqueous ferrocyanide: experimental andtheoretical x-ray spectroscopic study. The Journal of Physical Chemistry B,118(6):1555–1563, 2014.
[26] Sergey I Bokarev, Munirah Khan, Mahmoud K Abdel-Latif, Jie Xiao, RifaatHilal, Saadullah G Aziz, Emad F Aziz, and Oliver Kühn. Unraveling theelectronic structure of photocatalytic manganese complexes by l-edge x-rayspectroscopy. The Journal of Physical Chemistry C, 119(33):19192–19200,2015.
[27] Philippe Wernet, Kristjan Kunnus, Ida Josefsson, Ivan Rajkovic, WilsonQuevedo, Martin Beye, Simon Schreck, Sebastian Grübel, Mirko Scholz,Dennis Nordlund, et al. Orbital-specific mapping of the ligand exchangedynamics of fe(co)5 in solution. Nature, 520(7545):78, 2015.
[28] Friedrich Hund et al. Linienspektren und periodisches system der elemente.1927.
[29] Tanabe Yukito Sugano Satoru and Kamimura Hiroshi. Multiplets oftransition-metal ions in crystals. Academic Press inc. New York, 1970.
66
[30] Hermann Arthur Jahn and Edward Teller. Stability of polyatomic molecules indegenerate electronic states. i. orbital degeneracy. In Proceedings of the RoyalSociety of London A: Mathematical, Physical and Engineering Sciences,volume 161, pages 220–235. The Royal Society, 1937.
[31] Malcolm Gerloch and Edwin C Constable. Transition metal chemistry: thevalence shell in d-block chemistry. Wiley Online Library, 1994.
[32] Ryutaro Tsuchida. Absorption spectra of co-ordination compounds. i. Bulletinof the Chemical Society of Japan, 13(5):388–400, 1938.
[33] Ryutaro Tsuchida. Absorption spectra of co-ordination compounds. ii.Bulletin of the Chemical Society of Japan, 13(6):436–450, 1938.
[34] Ryutaro Tsuchida and Masahisa Kobayashi. Absorption spectra ofco-ordination compounds. iii. special bands of chromium complexes. Bulletinof the Chemical Society of Japan, 13(7):471–480, 1938.
[35] Hisao Kuroya and Ryutaro Tsuchida. Absorption spectra of co-ordinationcompounds. iv. ethylenediamine cobaltic complexes. Bulletin of the ChemicalSociety of Japan, 15(10):427–439, 1940.
[36] Ward Jesse, Ollmann Emily, Maxey Evan, and A. Finney. Lydia. X-RayAbsorption Spectroscopy of Metalloproteins, pages 171–187. HumanaPress:Springer, New York, NY(USA), 2014. ISBN 978-1-62703-794-5.
[37] Pieter Glatzel, Uwe Bergmann, Junko Yano, Hendrik Visser, John H Robblee,Weiwei Gu, Frank MF de Groot, George Christou, Vincent L Pecoraro,Stephen P Cramer, et al. The electronic structure of mn in oxides, coordinationcomplexes, and the oxygen-evolving complex of photosystem ii studied byresonant inelastic x-ray scattering. Journal of the American Chemical Society,126(32):9946–9959, 2004.
[38] Kari L Stone, Rachel K Behan, and Michael T Green. X-ray absorptionspectroscopy of chloroperoxidase compound i: insight into the reactiveintermediate of p450 chemistry. Proceedings of the National Academy ofSciences of the United States of America, 102(46):16563–16565, 2005.
[39] Junko Yano, Jan Kern, Kenneth Sauer, Matthew J Latimer, Yulia Pushkar,Jacek Biesiadka, Bernhard Loll, Wolfram Saenger, Johannes Messinger,Athina Zouni, et al. Where water is oxidized to dioxygen: structure of thephotosynthetic mn4ca cluster. Science, 314(5800):821–825, 2006.
[40] Junko Yano and Vittal Yachandra. Mn4ca cluster in photosynthesis: where andhow water is oxidized to dioxygen. Chemical Reviews, 114(8):4175–4205,2014.
[41] Rosalie K Hocking, Erik C Wasinger, Frank MF de Groot, Keith O Hodgson,Britt Hedman, and Edward I Solomon. Fe l-edge xas studies of k4 [fe (cn) 6]and k3 [fe (cn) 6]: a direct probe of back-bonding. Journal of the AmericanChemical Society, 128(32):10442–10451, 2006.
[42] Tami E Westre, Pierre Kennepohl, Jane G DeWitt, Britt Hedman, Keith OHodgson, and Edward I Solomon. A multiplet analysis of fe k-edge 1s→3dpre-edge features of iron complexes. Journal of the American ChemicalSociety, 119(27):6297–6314, 1997.
[43] Serena DeBeer George, Patrick Brant, and Edward I Solomon. Metal andligand k-edge xas of organotitanium complexes: Metal 4p and 3d contributionsto pre-edge intensity and their contributions to bonding. Journal of the
67
American Chemical Society, 127(2):667–674, 2005.[44] Takashi Yamamoto. Assignment of pre-edge peaks in k-edge x-ray absorption
spectra of 3d transition metal compounds: electric dipole or quadrupole?X-Ray Spectrometry, 37(6):572–584, 2008.
[45] AL Roe, DJ Schneider, RJ Mayer, JW Pyrz, J Widom, and L Que Jr. X-rayabsorption spectroscopy of iron-tyrosinate proteins. Journal of the AmericanChemical Society, 106(6):1676–1681, 1984.
[46] Jan-Uwe Rohde, Theodore A Betley, Timothy A Jackson, Caroline T Saouma,Jonas C Peters, and Lawrence Que. Xas characterization of a nitridoiron (iv)complex with a very short fe- n bond. Inorganic chemistry, 46(14):5720–5726,2007.
[47] Manfred Otto Krause and JH Oliver. Natural widths of atomic k and l levels, kα x-ray lines and several kll auger lines. Journal of Physical and ChemicalReference Data, 8(2):329–338, 1979.
[48] Frank De Groot. High-resolution x-ray emission and x-ray absorptionspectroscopy. Chemical Reviews, 101(6):1779–1808, 2001.
[49] P Glatzel, M Sikora, and M Fernandez-Garcia. Resonant x-ray spectroscopy tostudy k absorption pre-edges in 3d transition metal compounds. The EuropeanPhysical Journal-Special Topics, 169(1):207–214, 2009.
[50] Marcus Lundberg, Thomas Kroll, Serena DeBeer, Uwe Bergmann, Samuel AWilson, Pieter Glatzel, Dennis Nordlund, Britt Hedman, Keith O Hodgson,and Edward I Solomon. Metal–ligand covalency of iron complexes fromhigh-resolution resonant inelastic x-ray scattering. Journal of the AmericanChemical Society, 135(45):17121–17134, 2013.
[51] Thomas Kroll, Ryan G Hadt, Samuel A Wilson, Marcus Lundberg, James JYan, Tsu-Chien Weng, Dimosthenis Sokaras, Roberto Alonso-Mori, DiegoCasa, Mary H Upton, et al. Resonant inelastic x-ray scattering on ferrous andferric bis-imidazole porphyrin and cytochrome c: Nature and role of the axialmethionine–fe bond. Journal of the American Chemical Society, 136(52):18087–18099, 2014.
[52] Luuk JP Ament, Michel Van Veenendaal, Thomas P Devereaux, John P Hill,and Jeroen Van Den Brink. Resonant inelastic x-ray scattering studies ofelementary excitations. Reviews of Modern Physics, 83(2):705, 2011.
[53] Björn O Roos, Peter R Taylor, Per EM Siegbahn, et al. A complete activespace scf method (casscf) using a density matrix formulated super-ci approach.Chemical Physics, 48(2):157–173, 1980.
[54] Björn O Roos and KP Lawley. Ab initio methods in quantum chemistry ii.Advances in Chemical Physics, 69:399–446, 1987.
[55] Jeppe Olsen, Björn O Roos, Poul Jørgensen, and Hans Jørgen Aa Jensen.Determinant based configuration interaction algorithms for complete andrestricted configuration interaction spaces. The Journal of Chemical Physics,89(4):2185–2192, 1988.
[56] Michael W Schmidt and Mark S Gordon. The construction and interpretationof mcscf wavefunctions. Annual Review of Physical Chemistry, 49(1):233–266, 1998.
[57] Björn O Roos, Kerstin Andersson, Markus P Fülscher, Per Åke Malmqvist,Luis Serrano-Andrés, Kristin Pierloot, and Manuela Merchán.
68
Multiconfigurational perturbation theory: Applications in electronicspectroscopy. Advances in Chemical Physics: New Methods in ComputationalQuantum Mechanics, Volume 93, pages 219–331, 2007.
[58] Per Åke Malmqvist, Alistair Rendell, and Björn O Roos. The restricted activespace self-consistent-field method, implemented with a split graph unitarygroup approach. Journal of Physical Chemistry, 94(14):5477–5482, 1990.
[59] Max Born and Robert Oppenheimer. Zur quantentheorie der molekeln.Annalen der Physik, 389(20):457–484, 1927.
[60] Charlotte Froese Fischer. General hartree-fock program. Computer PhysicsCommunications, 43(3):355–365, 1987.
[61] Per-Olov Löwdin. Quantum theory of many-particle systems. iii. extension ofthe hartree-fock scheme to include degenerate systems and correlation effects.Physical review, 97(6):1509, 1955.
[62] Kerstin Andersson, Per Åke Malmqvist, Björn O Roos, Andrzej J Sadlej, andKrzysztof Wolinski. Second-order perturbation theory with a casscf referencefunction. Journal of Physical Chemistry, 94(14):5483–5488, 1990.
[63] Kerstin Andersson, Per-Åke Malmqvist, and Björn O Roos. Second-orderperturbation theory with a complete active space self-consistent field referencefunction. The Journal of Chemical Physics, 96(2):1218–1226, 1992.
[64] Per Åke Malmqvist, Kristine Pierloot, Abdul Rehaman Moughal Shahi,Christopher J Cramer, and Laura Gagliardi. The restricted active spacefollowed by second-order perturbation theory method: Theory and applicationto the study of cuo2 and cu2o2 systems. The Journal of Chemical Physics, 128(20):204109, 2008.
[65] James Finley, Per-Åke Malmqvist, Björn O Roos, and Luis Serrano-Andrés.The multi-state caspt2 method. Chemical Physics Letters, 288(2):299–306,1998.
[66] Per Åke Malmqvist, Björn O Roos, and Bernd Schimmelpfennig. Therestricted active space (ras) state interaction approach with spin–orbitcoupling. Chemical Physics Letters, 357(3):230–240, 2002.
[67] Marvin Douglas and Norman M Kroll. Quantum electrodynamical correctionsto the fine structure of helium. Annals of Physics, 82(1):89–155, 1974.
[68] Björn O Roos, Roland Lindh, Per Åke Malmqvist, Valera Veryazov, andPer-Olof Widmark. Main group atoms and dimers studied with a newrelativistic ano basis set. The Journal of Physical Chemistry A, 108(15):2851–2858, 2004.
[69] Björn O Roos, Roland Lindh, Per-Åke Malmqvist, Valera Veryazov, andPer-Olof Widmark. New relativistic ano basis sets for transition metal atoms.The Journal of Physical Chemistry A, 109(29):6575–6579, 2005.
[70] Per Åke Malmqvist and Björn O Roos. The casscf state interaction method.Chemical Physics Letters, 155(2):189–194, 1989.
[71] Stephan Bernadotte, Andrew J Atkins, and Christoph R Jacob.Origin-independent calculation of quadrupole intensities in x-ray spectroscopy.The Journal of Chemical Physics, 137(20):204106, 2012.
[72] Hendrik A Kramers and Werner Heisenberg. Über die streuung von strahlungdurch atome. Zeitschrift für Physik A Hadrons and Nuclei, 31(1):681–708,1925.
69
[73] M-A Arrio, Stéphanie Rossano, Ch Brouder, L Galoisy, and G Calas.Calculation of multipole transitions at the fe k pre-edge through pdhybridization in the ligand field multiplet model. EPL (Europhysics Letters),51(4):454, 2000.
[74] Frank De Groot. Multiplet effects in x-ray spectroscopy. CoordinationChemistry Reviews, 249(1):31–63, 2005.
[75] Y Joly. X-ray absorption near-edge structure calculations beyond themuffin-tin approximation. Physical Review B, 63(12):125120, 2001.
[76] John J Rehr, Joshua J Kas, Fernando D Vila, Micah P Prange, and KevinJorissen. Parameter-free calculations of x-ray spectra with feff9. PhysicalChemistry Chemical Physics, 12(21):5503–5513, 2010.
[77] Hans Ågren, Vincenzo Carravetta, Olav Vahtras, and Lars GM Pettersson.Direct, atomic orbital, static exchange calculations of photoabsorption spectraof large molecules and clusters. Chemical Physics Letters, 222(1-2):75–81,1994.
[78] L Triguero, LGM Pettersson, and H Ågren. Calculations of near-edgex-ray-absorption spectra of gas-phase and chemisorbed molecules by means ofdensity-functional and transition-potential theory. Physical Review B, 58(12):8097, 1998.
[79] J Vinson, JJ Rehr, JJ Kas, and EL Shirley. Bethe-salpeter equation calculationsof core excitation spectra. Physical Review B, 83(11):115106, 2011.
[80] Andris Gulans, Stefan Kontur, Christian Meisenbichler, Dmitrii Nabok,Pasquale Pavone, Santiago Rigamonti, Stephan Sagmeister, Ute Werner, andClaudia Draxl. Exciting: a full-potential all-electron package implementingdensity-functional theory and many-body perturbation theory. Journal ofPhysics: Condensed Matter, 26(36):363202, 2014.
[81] Ulf Ekström, Patrick Norman, Vincenzo Carravetta, and Hans Ågren.Polarization propagator for x-ray spectra. Physical Review Letters, 97(14):143001, 2006.
[82] Serena DeBeer George, Taras Petrenko, and Frank Neese. Prediction of ironk-edge absorption spectra using time-dependent density functional theory. TheJournal of Physical Chemistry A, 112(50):12936–12943, 2008.
[83] Arto Sakko, Angel Rubio, Mikko Hakala, and Keijo Hämäläinen.Time-dependent density functional approach for the calculation of inelasticx-ray scattering spectra of molecules. The Journal of Chemical Physics, 133(17):174111, 2010.
[84] P Chandrasekaran, S Chantal E Stieber, Terrence J Collins, Lawrence Que Jr,Frank Neese, and Serena DeBeer. Prediction of high-valent iron k-edgeabsorption spectra by time-dependent density functional theory. DaltonTransactions, 40(42):11070–11079, 2011.
[85] Frederico A Lima, Ragnar Bjornsson, Thomas Weyhermüller, PerumalreddyChandrasekaran, Pieter Glatzel, Frank Neese, and Serena DeBeer.High-resolution molybdenum k-edge x-ray absorption spectroscopy analyzedwith time-dependent density functional theory. Physical Chemistry ChemicalPhysics, 15(48):20911–20920, 2013.
[86] G Capano, TJ Penfold, NA Besley, CJ Milne, M Reinhard, H Rittmann-Frank,P Glatzel, R Abela, U Rothlisberger, M Chergui, et al. The role of
70
hartree–fock exchange in the simulation of x-ray absorption spectra: a study ofphotoexcited [fe (bpy) 3] 2+. Chemical Physics Letters, 580:179–184, 2013.
[87] Michael Roemelt, Dimitrios Maganas, Serena DeBeer, and Frank Neese. Acombined dft and restricted open-shell configuration interaction methodincluding spin-orbit coupling: Application to transition metal l-edge x-rayabsorption spectroscopy. The Journal of Chemical Physics, 138(20):204101,2013.
[88] Michael Roemelt and Frank Neese. Excited states of large open-shellmolecules: an efficient, general, and spin-adapted approach based on arestricted open-shell ground state wave function. The Journal of PhysicalChemistry A, 117(14):3069–3083, 2013.
[89] Dimitrios Maganas, Michael Roemelt, Thomas Weyhermüller, Raoul Blume,Michael Hävecker, Axel Knop-Gericke, Serena DeBeer, Robert Schlögl, andFrank Neese. L-edge x-ray absorption study of mononuclear vanadiumcomplexes and spectral predictions using a restricted open shell configurationinteraction ansatz. Physical Chemistry Chemical Physics, 16(1):264–276,2014.
[90] Rosalie K Hocking, Erik C Wasinger, Yi-Long Yan, Frank MF deGroot, F AnnWalker, Keith O Hodgson, Britt Hedman, and Edward I Solomon. Fe l-edgex-ray absorption spectroscopy of low-spin heme relative to non-heme fecomplexes: Delocalization of fe d-electrons into the porphyrin ligand. Journalof the American Chemical Society, 129(1):113–125, 2007.
[91] Karl M Kadish, Kevin M Smith, and Roger Guilard. The PorphyrinHandbook: Inorganic, organometallic and coordination chemistry, volume 3.Elsevier, 2000.
[92] Shigeru Obara and Hiroshi Kashiwagi. A binitio mo studies of electronic statesand mössbauer spectra of high-, intermediate-, and low-spin fe (ii)-porphyrincomplexes. The Journal of Chemical Physics, 77(6):3155–3165, 1982.
[93] Yoong-Kee Choe, Takahito Nakajima, Kimihiko Hirao, Roland Lindh, et al.Theoretical study of the electronic ground state of iron (ii) porphine. ii.Journal of Chemical Physics, 111(9):3837–3845, 1999.
[94] Kristine Pierloot, Quan Manh Phung, and Alex Domingo. Spin state energeticsin first-row transition metal complexes: Contribution of (3s3p) correlation andits description by second-order perturbation theory. Journal of ChemicalTheory and Computation, 13(2):537–553, 2017.
[95] André R Groenhof, Marcel Swart, Andreas W Ehlers, and Koop Lammertsma.Electronic ground states of iron porphyrin and of the first species in thecatalytic reaction cycle of cytochrome p450s. The Journal of PhysicalChemistry A, 109(15):3411–3417, 2005.
[96] Meng-Sheng Liao, John D Watts, and Ming-Ju Huang. Assessment of theperformance of density-functional methods for calculations on iron porphyrinsand related compounds. Journal of computational chemistry, 27(13):1577–1592, 2006.
[97] Samuel A Wilson, Thomas Kroll, Richard A Decreau, Rosalie K Hocking,Marcus Lundberg, Britt Hedman, Keith O Hodgson, and Edward I Solomon.Iron l-edge x-ray absorption spectroscopy of oxy-picket fence porphyrin:experimental insight into fe–o2 bonding. Journal of the American Chemical
71
Society, 135(3):1124–1136, 2013.[98] Sergey I Bokarev, Marcus Dantz, Edlira Suljoti, Oliver Kühn, and Emad F
Aziz. State-dependent electron delocalization dynamics at the solute-solventinterface: soft-x-ray absorption spectroscopy and ab initio calculations.Physical Review Letters, 111(8):083002, 2013.
[99] Kaan Atak, Sergey I Bokarev, Malte Gotz, Ronny Golnak, Kathrin M Lange,Nicholas Engel, Marcus Dantz, Edlira Suljoti, Oliver Kühn, and Emad F Aziz.Nature of the chemical bond of aqueous fe2+ probed by soft x-rayspectroscopies and ab initio calculations. The Journal of Physical ChemistryB, 117(41):12613–12618, 2013.
[100] Margareta RA Blomberg and Per EM Siegbahn. A comparative study ofhigh-spin manganese and iron complexes. Theoretical Chemistry Accounts, 97(1-4):72–80, 1997.
[101] Melissa M Grush, Yasuji Muramatsu, JH Underwood, Eric M Gullikson,David L Ederer, Rupert CC Perera, and Thomas A Callcott. Soft x-rayemission and absorption a comparative study on the sensitivity to oxidationstate and ligand environment of transition metal complexes. Journal ofelectron spectroscopy and related phenomena, 92(1):225–229, 1998.
[102] Laura Gagliardi, Roland Lindh, and Gunnar Karlström. Local properties ofquantum chemical systems: The loprop approach. The Journal of ChemicalPhysics, 121(10):4494–4500, 2004.
[103] Robert S Mulliken. Electronic population analysis on lcao–mo molecular wavefunctions. i. The Journal of Chemical Physics, 23(10):1833–1840, 1955.
[104] Axel D Becke. Becke’s three parameter hybrid method using the lypcorrelation functional. The Journal of Chemical Physics, 98:5648–5652, 1993.
[105] Chengteh Lee, Weitao Yang, and Robert G Parr. Development of thecolle-salvetti correlation-energy formula into a functional of the electrondensity. Physical Review B, 37(2):785, 1988.
[106] Seymour H Vosko, Leslie Wilk, and Marwan Nusair. Accurate spin-dependentelectron liquid correlation energies for local spin density calculations: acritical analysis. Canadian Journal of Physics, 58(8):1200–1211, 1980.
[107] PJ Stephens, FJ Devlin, CFn Chabalowski, and Michael J Frisch. Ab initiocalculation of vibrational absorption and circular dichroism spectra usingdensity functional force fields. The Journal of Physical Chemistry, 98(45):11623–11627, 1994.
[108] Mikael P Johansson, Margareta RA Blomberg, Dage Sundholm, and MårtenWikström. Change in electron and spin density upon electron transfer to haem.Biochimica et Biophysica Acta (BBA)-Bioenergetics, 1553(3):183–187, 2002.
[109] D Van der Marel, GA Sawatzky, and FU Hillebrecht. Direct observation of theexchange-split virtual bound state in dilute mn alloys. Physical review letters,53(2):206, 1984.
[110] Loig Vaugier, Hong Jiang, and Silke Biermann. Hubbard u and hund exchangej in transition metal oxides: Screening versus localization trends fromconstrained random phase approximation. Physical Review B, 86(16):165105,2012.
[111] Dongxia Ma, Giovanni Li Manni, and Laura Gagliardi. The generalized activespace concept in multiconfigurational self-consistent field methods. The
72
Journal of Chemical Physics, 135(4):044128, 2011.[112] Konstantinos D Vogiatzis, Giovanni Li Manni, Samuel J Stoneburner, Dongxia
Ma, and Laura Gagliardi. Systematic expansion of active spaces beyond thecasscf limit: a gasscf/splitgas benchmark study. Journal of Chemical Theoryand Computation, 11(7):3010–3021, 2015.
[113] Dongxia Ma, Giovanni Li Manni, Jeppe Olsen, and Laura Gagliardi.Second-order perturbation theory for generalized active spaceself-consistent-field wave functions. Journal of Chemical Theory andComputation, 12(7):3208–3213, 2016.
[114] Garnet Kin-Lic Chan and Sandeep Sharma. The density matrixrenormalization group in quantum chemistry. Annual review of physicalchemistry, 62:465–481, 2011.
[115] Dominika Zgid and Marcel Nooijen. The density matrix renormalizationgroup self-consistent field method: Orbital optimization with the densitymatrix renormalization group method in the active space. The Journal ofchemical physics, 128(14):144116, 2008.
[116] Yuki Kurashige and Takeshi Yanai. Second-order perturbation theory with adensity matrix renormalization group self-consistent field reference function:Theory and application to the study of chromium dimer. The Journal ofchemical physics, 135(9):094104, 2011.
[117] Yuki Kurashige, Garnet Kin-Lic Chan, and Takeshi Yanai. Entangled quantumelectronic wavefunctions of the mn4cao5 cluster in photosystem ii. Naturechemistry, 5(8):660–666, 2013.
73
Acta Universitatis UpsaliensisDigital Comprehensive Summaries of Uppsala Dissertationsfrom the Faculty of Science and Technology 1541
Editor: The Dean of the Faculty of Science and Technology
A doctoral dissertation from the Faculty of Science andTechnology, Uppsala University, is usually a summary of anumber of papers. A few copies of the complete dissertationare kept at major Swedish research libraries, while thesummary alone is distributed internationally throughthe series Digital Comprehensive Summaries of UppsalaDissertations from the Faculty of Science and Technology.(Prior to January, 2005, the series was published under thetitle “Comprehensive Summaries of Uppsala Dissertationsfrom the Faculty of Science and Technology”.)
Distribution: publications.uu.seurn:nbn:se:uu:diva-328072
ACTAUNIVERSITATIS
UPSALIENSISUPPSALA
2017