Electronic Spectroscopy - Chemistry out—states and transitions Spectroscopy—transitions between...
41
Electronic Spectroscopy Chem 344 final lecture topics
-
Upload
nguyentruc -
Category
Documents
-
view
224 -
download
0
Transcript of Electronic Spectroscopy - Chemistry out—states and transitions Spectroscopy—transitions between...
Electronic Spectroscopy
Chem 344 final lecture topics

Time out—states and transitions
Spectroscopy—transitions between energy states of a
molecule excited by absorption or emission of a photon
hn = DE = Ei - Ef
Energy levels due to interactions between parts of
molecule (atoms, electrons and nucleii) as described by
quantum mechanics, and are
characteristic of components involved, i.e. electron
distributions (orbitals), bond strengths and types plus
molecular geometries and atomic masses involved
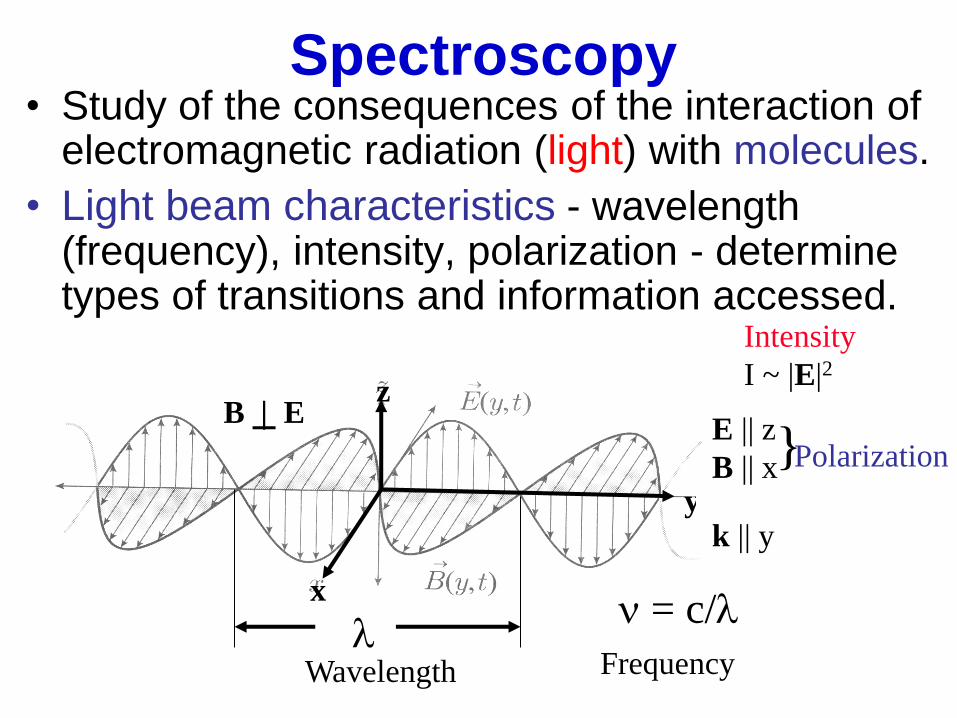
Spectroscopy • Study of the consequences of the interaction of
electromagnetic radiation (light) with molecules.
• Light beam characteristics - wavelength (frequency), intensity, polarization - determine types of transitions and information accessed.
l
E || z
B || x
n = c/l x
z
y
Wavelength Frequency
Intensity
I ~ |E|2
} Polarization
B | E
k || y
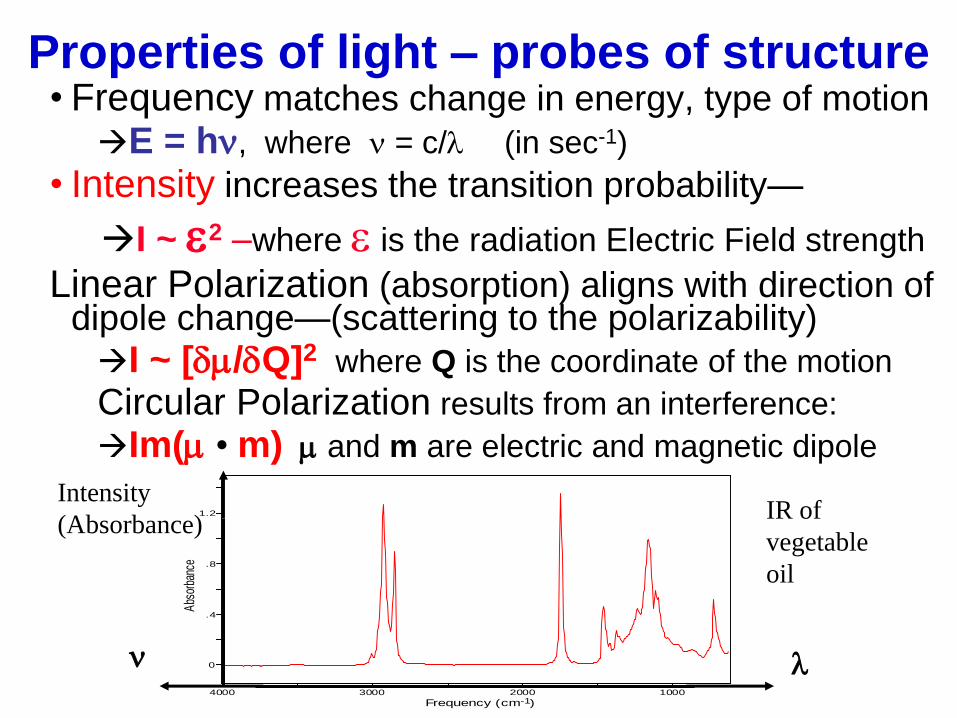
Properties of light – probes of structure • Frequency matches change in energy, type of motion
E = hn, where n = c/l (in sec-1)
• Intensity increases the transition probability—
I ~ e2 –where e is the radiation Electric Field strength
Linear Polarization (absorption) aligns with direction of dipole change—(scattering to the polarizability) I ~ [dm/dQ]2 where Q is the coordinate of the motion
Circular Polarization results from an interference:
Im(m • m) m and m are electric and magnetic dipole
0
.4
.8
1.2
4000 3000 2000 1000
Frequency (cm )
Abs
orba
nce
-1
l n
Intensity
(Absorbance) IR of
vegetable
oil
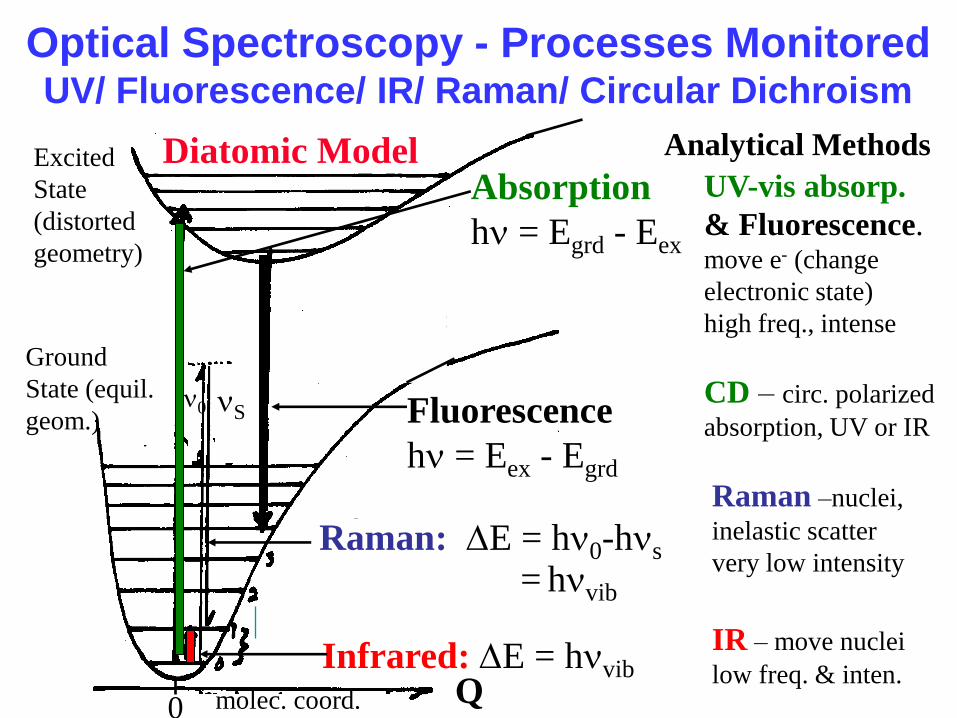
Optical Spectroscopy - Processes Monitored UV/ Fluorescence/ IR/ Raman/ Circular Dichroism
IR – move nuclei
low freq. & inten.
Raman –nuclei,
inelastic scatter
very low intensity
CD – circ. polarized
absorption, UV or IR
Raman: DE = hn0-hns
Infrared: DE = hnvib
= hnvib
Fluorescence
hn = Eex - Egrd
0
Absorption
hn = Egrd - Eex
Excited
State
(distorted
geometry)
Ground
State (equil.
geom.)
Q
n0 nS
molec. coord.
UV-vis absorp.
& Fluorescence. move e- (change
electronic state)
high freq., intense
Analytical Methods Diatomic Model

Essentially a probe technique sensing changes in the local environment of fluorophores
Optical Spectroscopy – Electronic,
Example Absorption and Fluorescence
Intrinsic fluorophores
eg. Trp, Tyr
Change with tertiary
structure, compactness e (M
-1 c
m-1
)
What do you see?
(typical protein)
Amide absorption broad,
Intense, featureless, far UV
~200 nm and below

Circular Dichroism
• Most protein secondary structure studies
use CD
• Method is bandshape dependent. Need a
different analysis
• Transitions fully overlap, peptide models
are similar but not quantitative
• Length effects left out, also solvent shifts
• Comparison revert to libraries of proteins
• None are pure, all mixed

CD is polarized differential absorption
DA = AL - AR
only non-zero for chiral molecules
Biopolymers are Chiral (L-amino acid, sugars, etc.)
Peptide/ Protein -
in uv - for amide: n-p* or p-p* in -HN-C=O-
partially delocalized p-system senses structure
in IR - amide centered vibrations most important
Nucleic Acids – base p-p* in uv, PO2-, C=O in IR
Coupled transitions between amides along chain lead to
distinctive bandshapes
Circular Dichroism

UV-vis Circular Dichroism Spectrometer
JASCO–quartz prisms disperse and linearly polarize light
Xe arc
source
Double prism
Monochromator (inc. dispersion,
dec. scatter, important in uv)
PEM
quartz
PMT
Sample Slits
This is shown to provide a comparison to VCD and ROA instruments

Amino Acids - linked by Peptide bonds
coupling yields structure sensitivity
Link is mostly planar and trans, except for Xxx-Pro
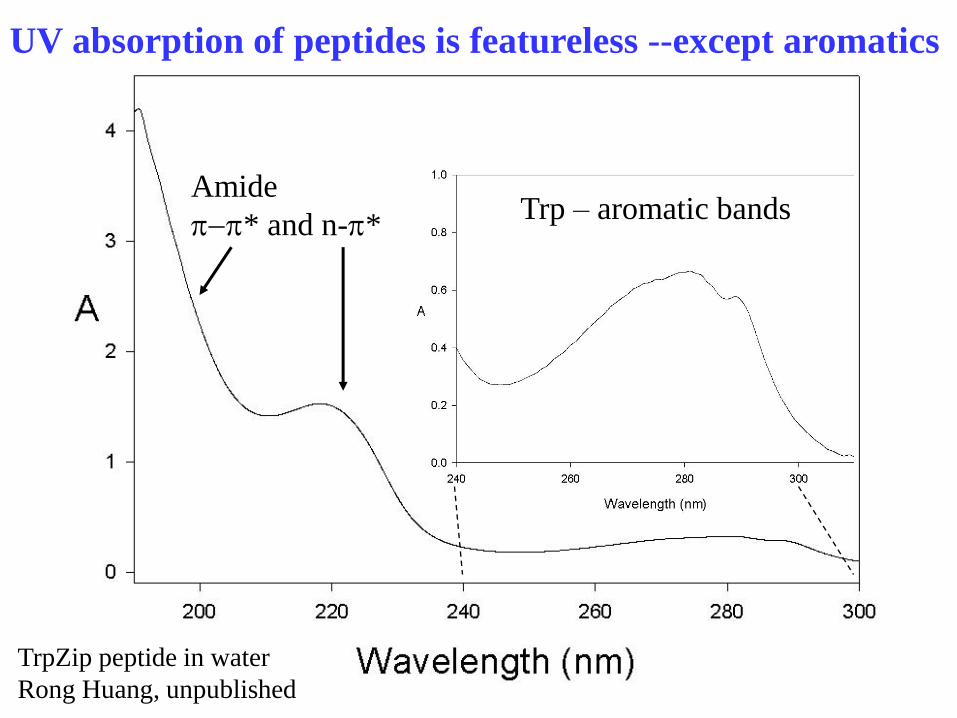
UV absorption of peptides is featureless --except aromatics
TrpZip peptide in water
Rong Huang, unpublished
Trp – aromatic bands Amide
p-p* and n-p*

a-helix - common peptide secondary structure
(ii+4)
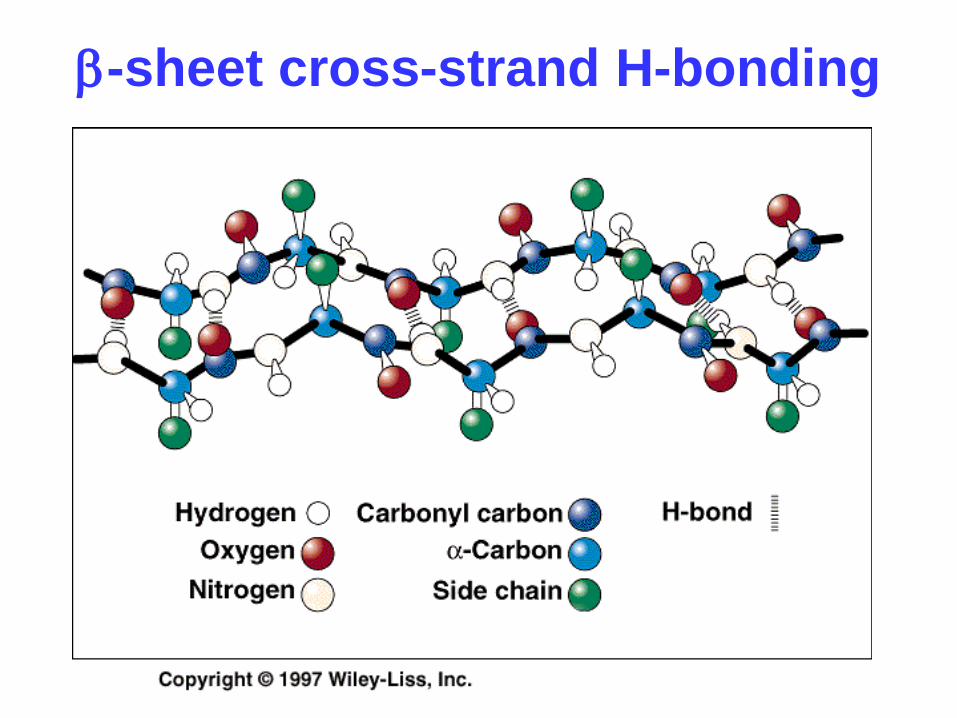
b-sheet cross-strand H-bonding
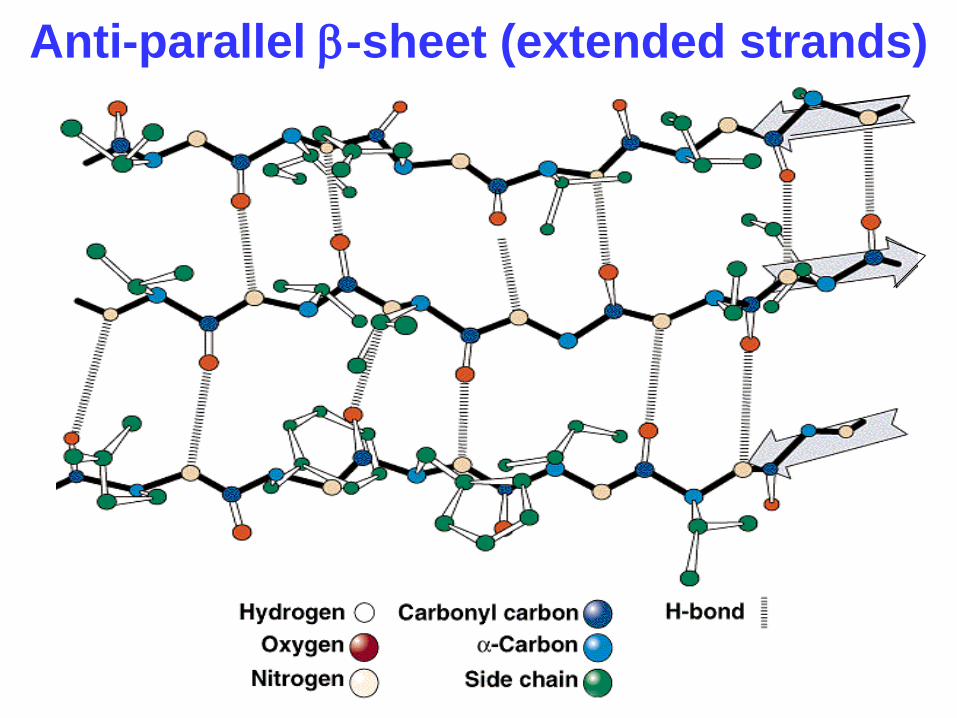
Anti-parallel b-sheet (extended strands)
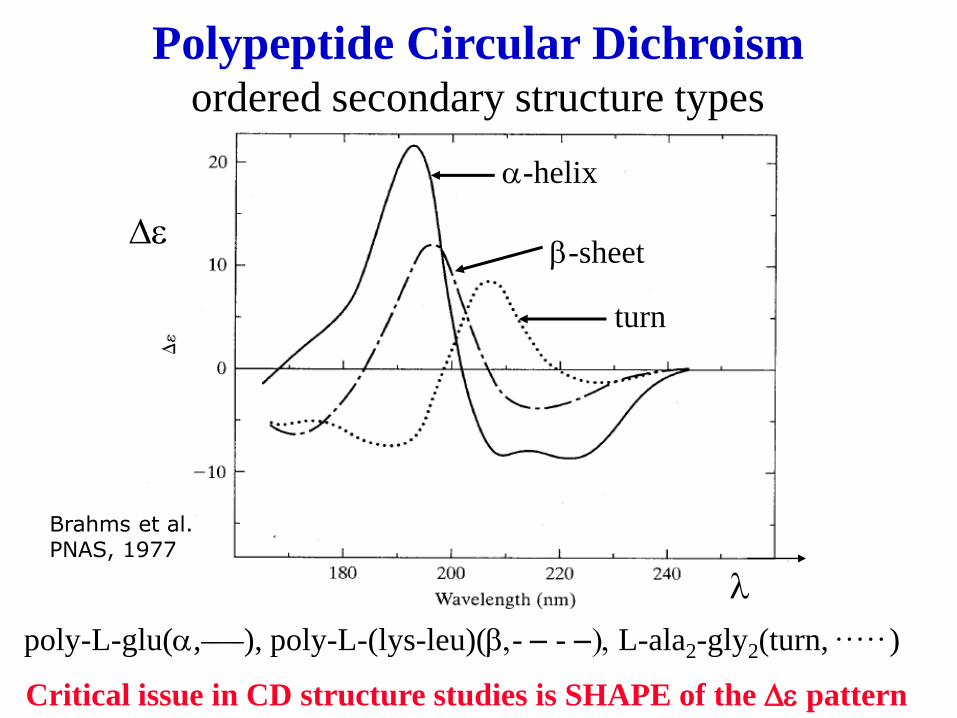
poly-L-glu(a,____), poly-L-(lys-leu)(b,- - - -), L-ala2-gly2(turn, . . . . . )
Polypeptide Circular Dichroism ordered secondary structure types
De
l
Critical issue in CD structure studies is SHAPE of the De pattern
a-helix
b-sheet
turn
Brahms et al. PNAS, 1977
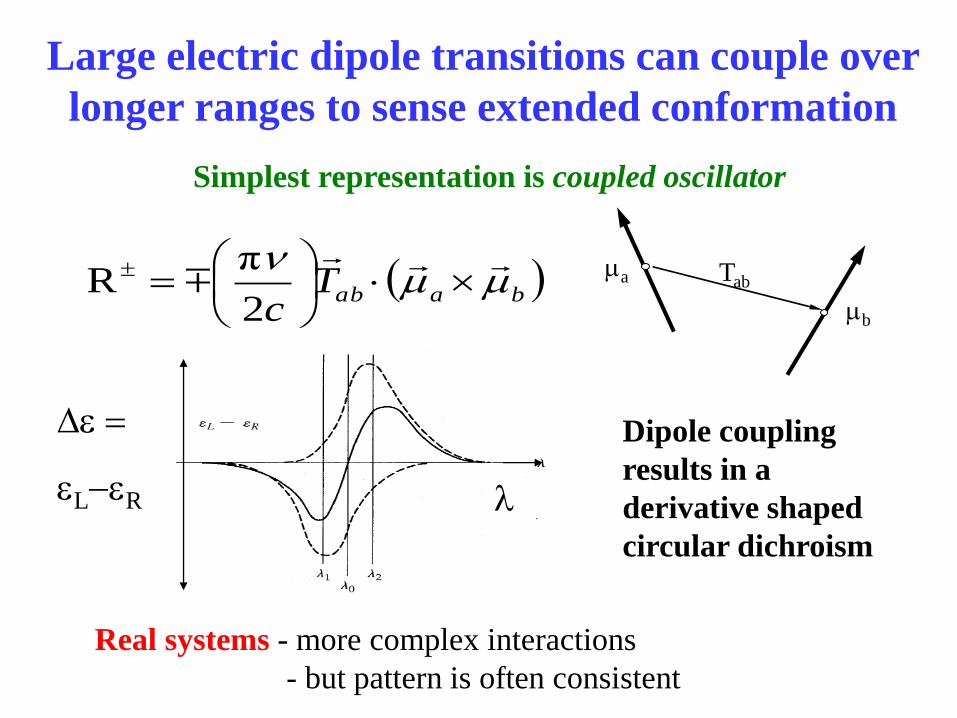
Large electric dipole transitions can couple over
longer ranges to sense extended conformation
Simplest representation is coupled oscillator
Tab ma
mb
Real systems - more complex interactions
- but pattern is often consistent
)baabTc
mmn
2
πR
Dipole coupling
results in a
derivative shaped
circular dichroism
De
eL-eR l
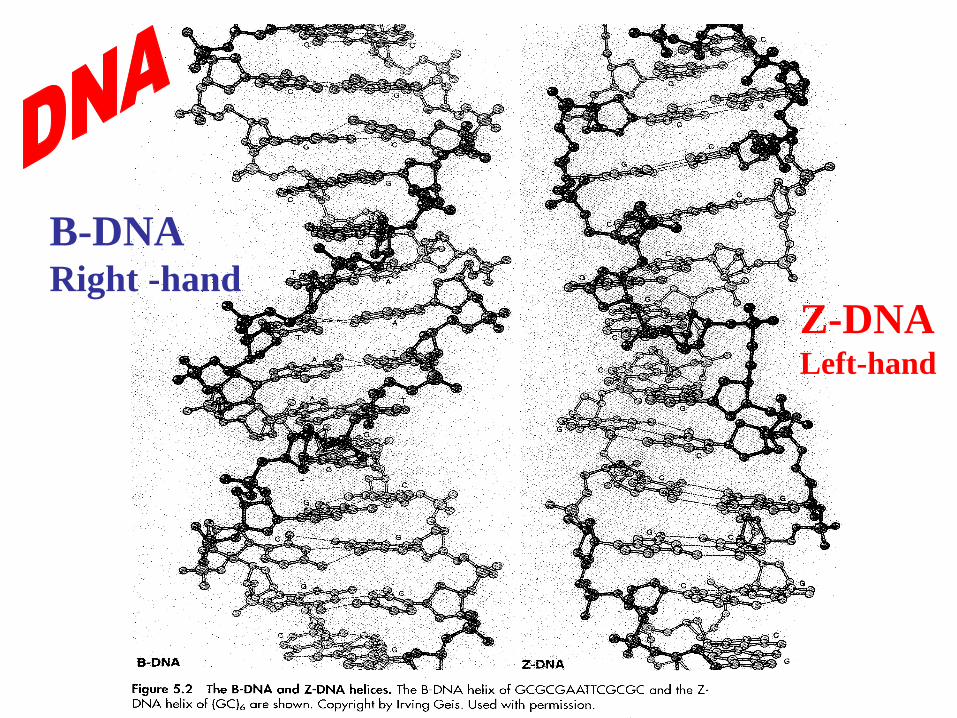
B-DNA Right -hand
Z-DNA Left-hand
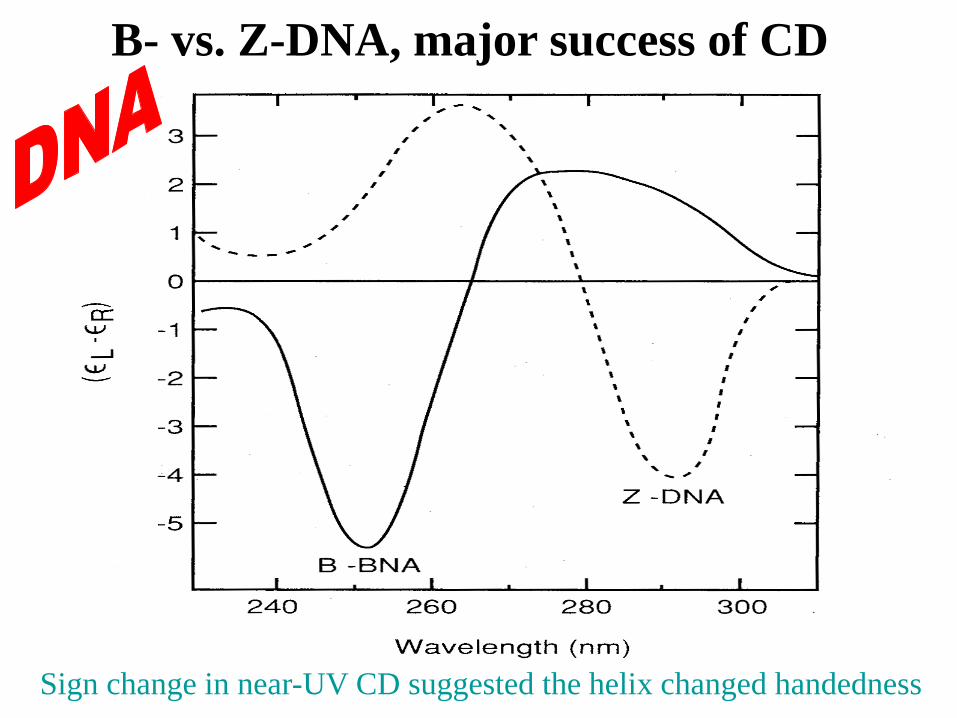
B- vs. Z-DNA, major success of CD
Sign change in near-UV CD suggested the helix changed handedness
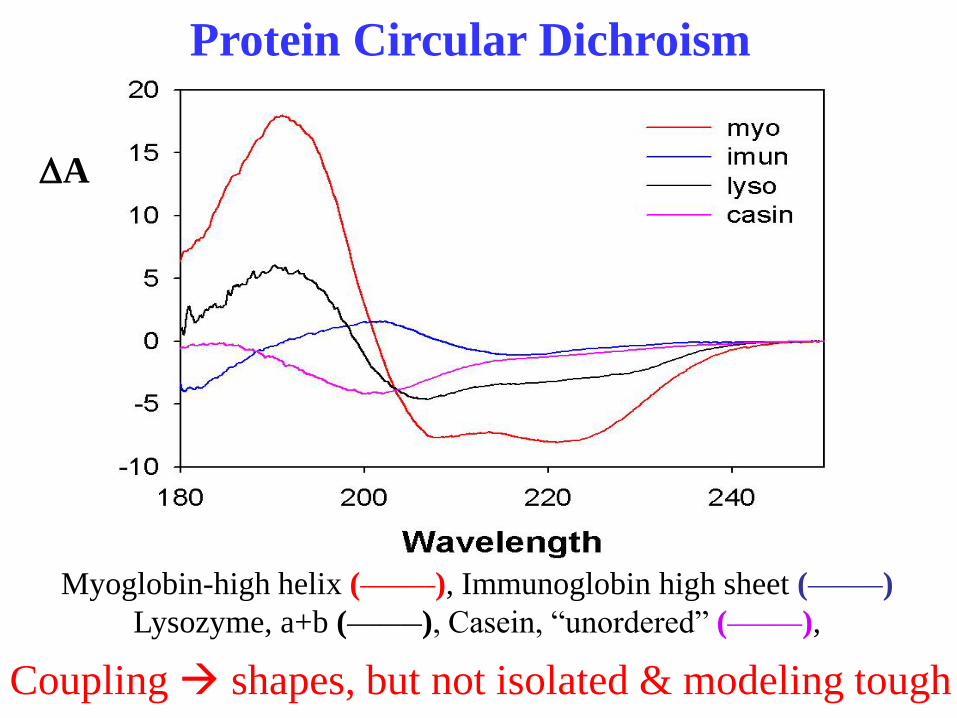
Protein Circular Dichroism
Myoglobin-high helix (_______), Immunoglobin high sheet (_______)
Lysozyme, a+b (_______), Casein, “unordered” (_______),
DA
Coupling shapes, but not isolated & modeling tough
Simplest Analyses –
Single Frequency Response
Basis in analytical chemistry Beer’s law response if isolated
Protein treated as a solution % helix, etc. is the unknown
Standard in IR and Raman,
Method: deconvolve to get components
Problem – must assign component transitions, overlap
-secondary structure components disperse freq.
Alternate: uv CD - helix correlate to negative intensity at
222 nm, CD spectra in far-UV dominated by helical contribution
Problem - limited to one factor,
-interference by chromophores]
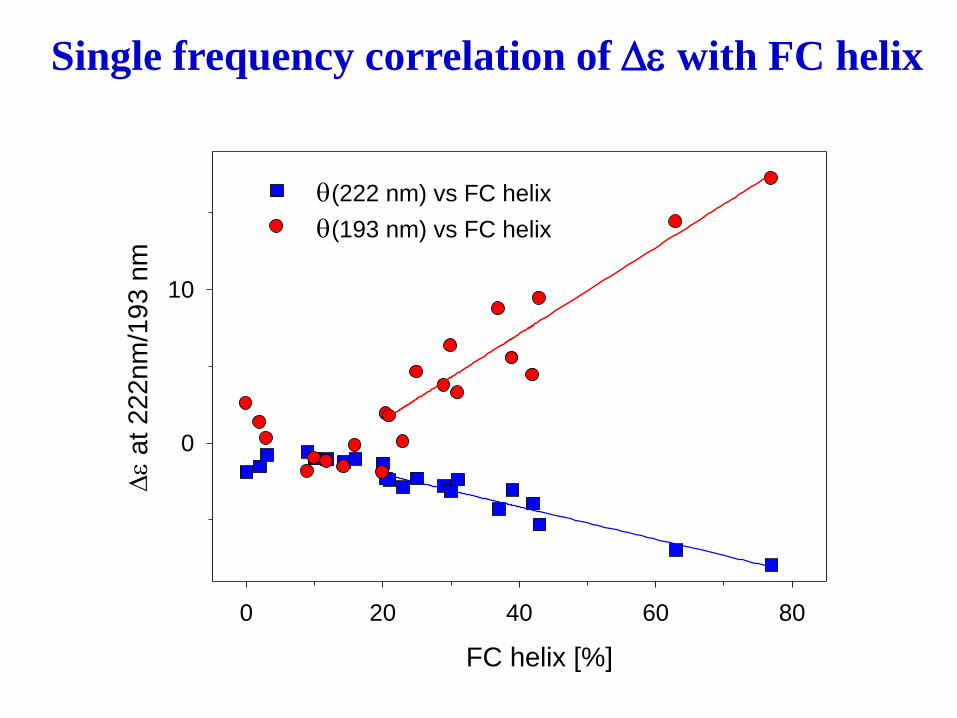
Single frequency correlation of De with FC helix
FC helix [%]
0 20 40 60 80
De
at
222nm
/193 n
m
0
10
(222 nm) vs FC helix
(193 nm) vs FC helix
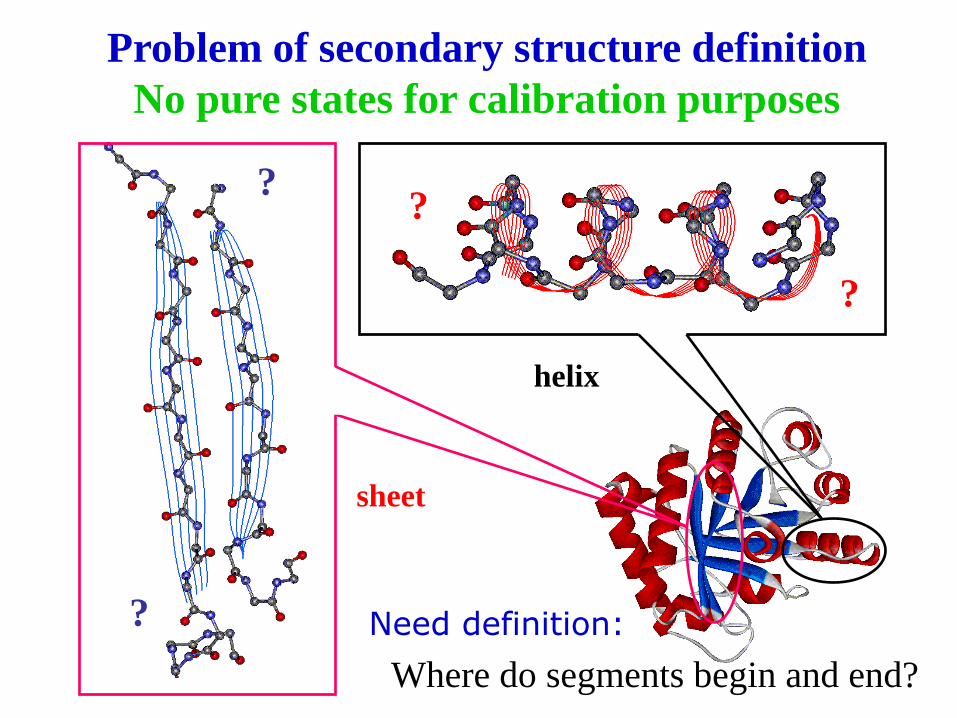
Problem of secondary structure definition
No pure states for calibration purposes
?
?
?
?
helix
sheet
Where do segments begin and end?
Need definition:

Next step - project onto model spectra
–Band shape analysis
Peptides as models
- fine for a-helix,
-problematic for b-sheet or turns - solubility and stability
-old method:Greenfield - Fasman --poly-L-lysine, vary pH
i = aifa +bifb + cifc
--Modelled on multivariate analyses
Proteins as models - need to decompose spectra
- structures reflect environment of protein
- spectra reflect proteins used as models
Basis set (protein spectra) size and form - major issue

Electronic CD spectra consistent with predicted
helix content
- 3 0 0 0 0
- 2 0 0 0 0
- 1 0 0 0 0
0
1 0 0 0 0
2 0 0 0 0
3 0 0 0 0
4 0 0 0 0
5 0 0 0 0
1 9 02 0 02 1 02 2 02 3 02 4 02 5 02 6 0
Mo
lar
Ell
ipti
city
Wavelength (nm)
190 210 230
Note helical bands, coil has residual at 222 nm, growth of 200 nm band
Electronic CD for helix to coil change in a peptide
Loss of order becomes a question --
ECD long range sensitivity cannot
determine remaining local order
Low temp helix
High temp “coil”
6 b b sheet
, 2 )
Tyr97
Tyr25
Tyr92
H1
H3 H2
Tyr76
Tyr115
Tyr73
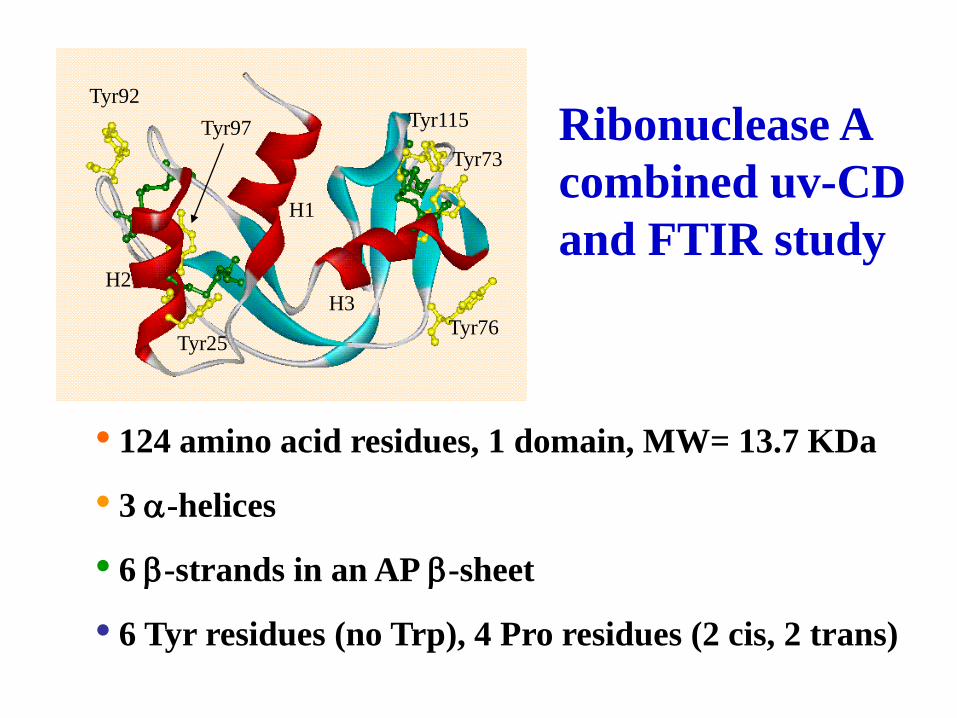
• 124 amino acid residues, 1 domain, MW= 13.7 KDa
• 3 a-helices
• 6 b-strands in an AP b-sheet
• 6 Tyr residues (no Trp), 4 Pro residues (2 cis, 2 trans)
Ribonuclease A
combined uv-CD
and FTIR study

Wavelength (nm)
260 280 300 320
Ellip
ticity
(mde
g)
-16
-14
-12
-10
-8
-6
-4
-2
0
Near-UV CD
Wavenumber (cm-1)
1600162016401660168017001720
Abso
rban
ce
0.00
0.01
0.02
0.03
0.04
0.05
0.06
FTIR
Wavelength (nm)
190 200 210 220 230 240 250
Ellip
ticity
(mde
g)
-15
-10
-5
0
5
Far-UV CD
Temperature 10-70oC
FTIR—amide I
Loss of b-sheet
RibonucleaseA
Far-uv CD Loss of a-helix
Near –uv CD Loss of tertiary
structure
Spectral Change
Stelea, et al. Prot. Sci. 2001
C i1 (x
102 )
-8.0
-7.6
-7.2
-6.8
-6.4
C i2 (x
10)
-1.0
-0.5
0.0
0.5
1.0
FTIRC i1
-17
-15
-13
-11
-9
-7
-5
C i2
-15
-10
-5
0
5
10
Near-UV CD
Temperature (oC)
0 20 40 60 80 100
C i1
-13
-12
-11
-10
C i2
-30
-25
-20
-15
-10
-5
0
5
Far-UV CD
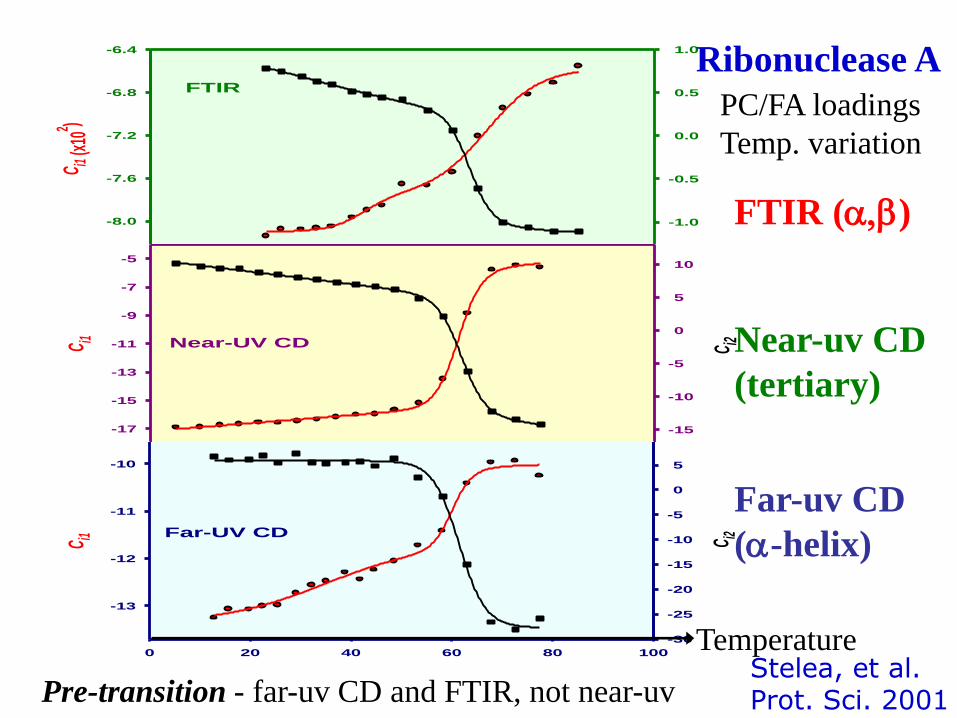
Ribonuclease A
PC/FA loadings
Temp. variation
FTIR (a,b)
Near-uv CD
(tertiary)
Far-uv CD
(a-helix)
Pre-transition - far-uv CD and FTIR, not near-uv
Temperature Stelea, et al. Prot. Sci. 2001

Changing protein conformational order by organic solvent
TFE and MeOH often used to induce helix formation
--sometimes thought to mimic membrane
--reported that the consequent unfolding can lead to
aggregation and fibril formation in selected cases
Examples presented show solvent perturbation of
dominantly b-sheet proteins
TFE and MeOH behave differently
thermal stability key to differentiating states
indicates residual partial order

3D Structure of Concanavalin A
Dimer (acidic, pH<6) Tetramer (pH=6-7)
Trp40
Trp88
Trp109
Trp182
High b-sheet structure, flat back extended, curved front
Monomer only at very low pH, 4 Trp give fluorescence
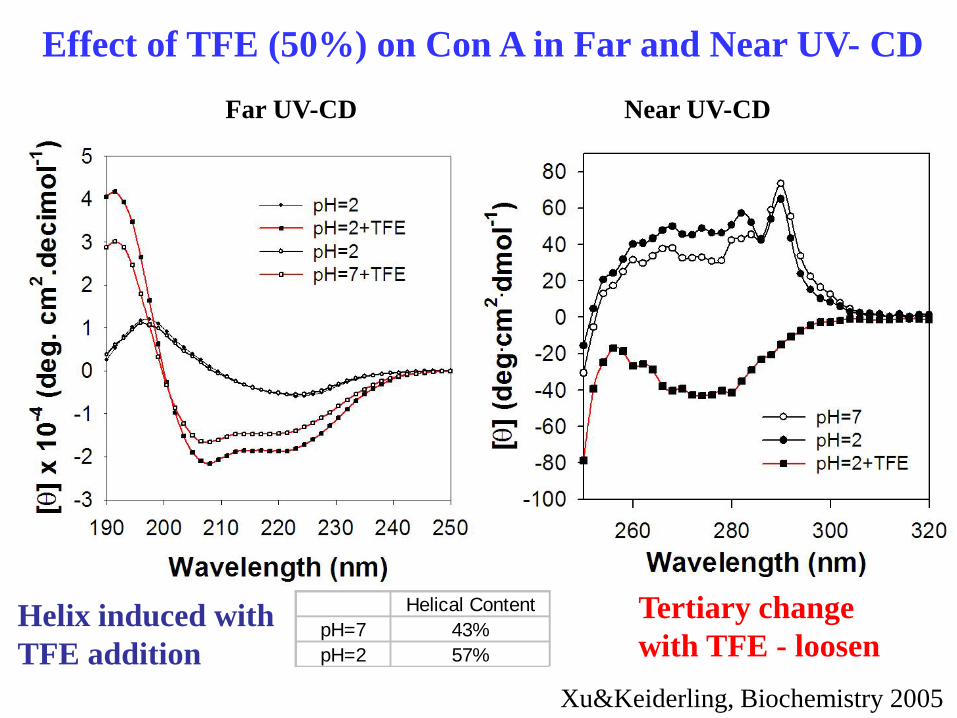
Effect of TFE (50%) on Con A in Far and Near UV- CD
Helical Content
pH=7 43%
pH=2 57%
Far UV-CD Near UV-CD
Helix induced with
TFE addition
Tertiary change
with TFE - loosen
Xu&Keiderling, Biochemistry 2005
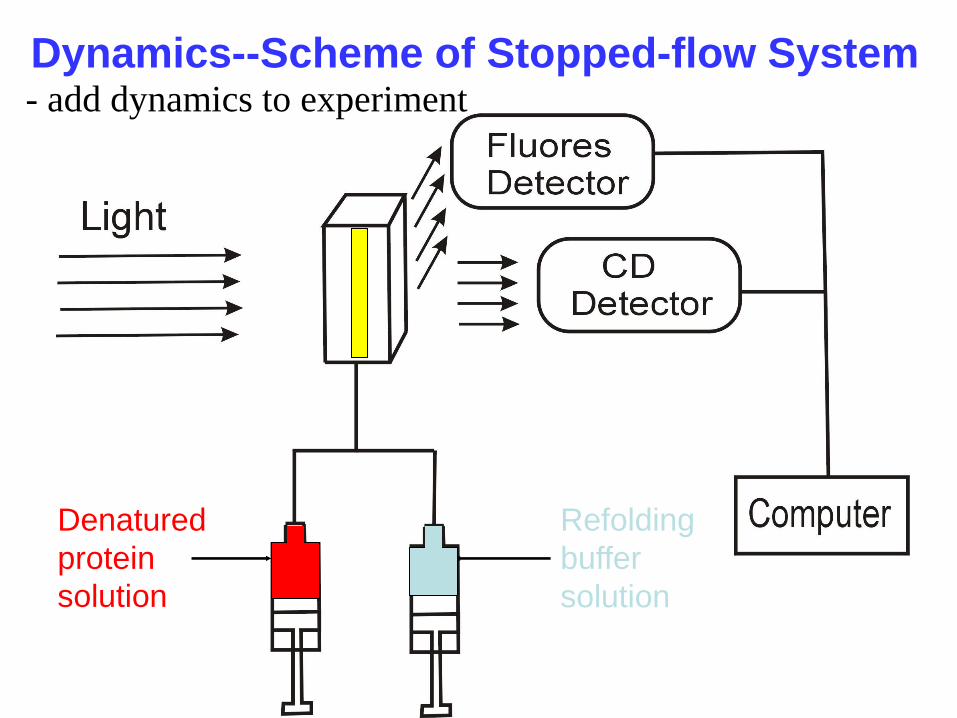
Dynamics--Scheme of Stopped-flow System
Denatured
protein
solution
Refolding
buffer
solution
- add dynamics to experiment
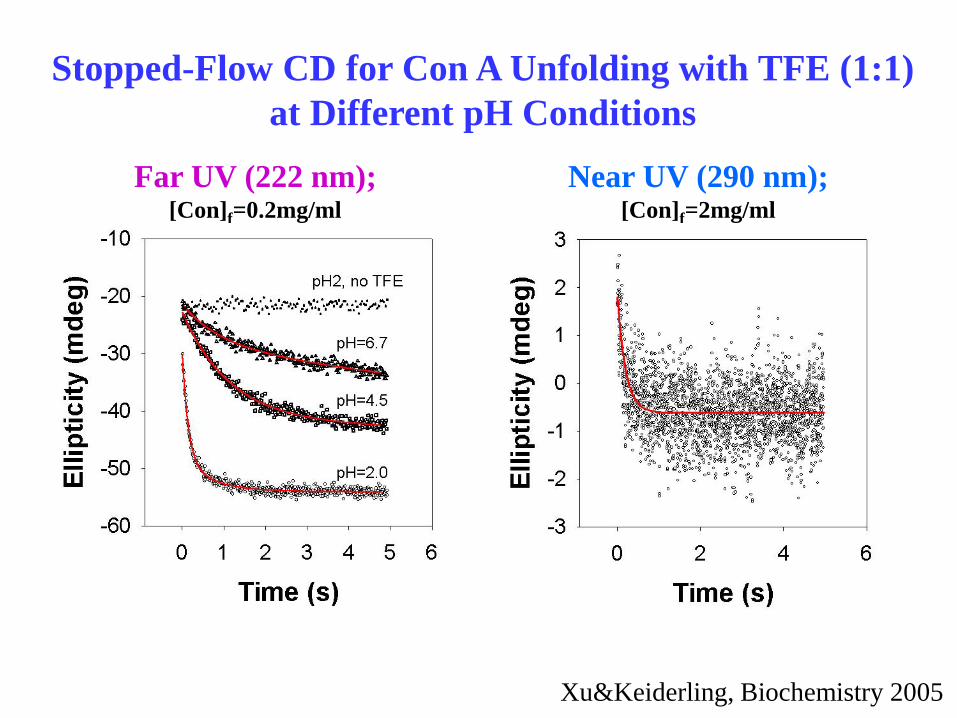
Stopped-Flow CD for Con A Unfolding with TFE (1:1)
at Different pH Conditions
Far UV (222 nm);
[Con]f=0.2mg/ml
Near UV (290 nm);
[Con]f=2mg/ml
pH=2.0
Xu&Keiderling, Biochemistry 2005
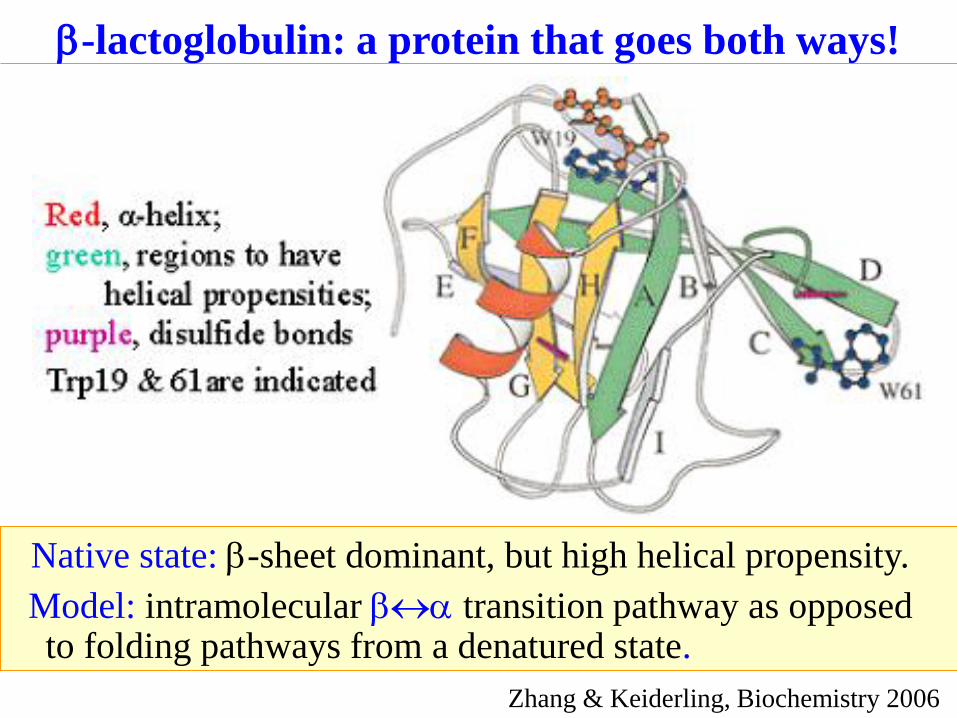
Native state: b-sheet dominant, but high helical propensity.
Model: intramolecular ba transition pathway as opposed to folding pathways from a denatured state.
b-lactoglobulin: a protein that goes both ways!
Zhang & Keiderling, Biochemistry 2006
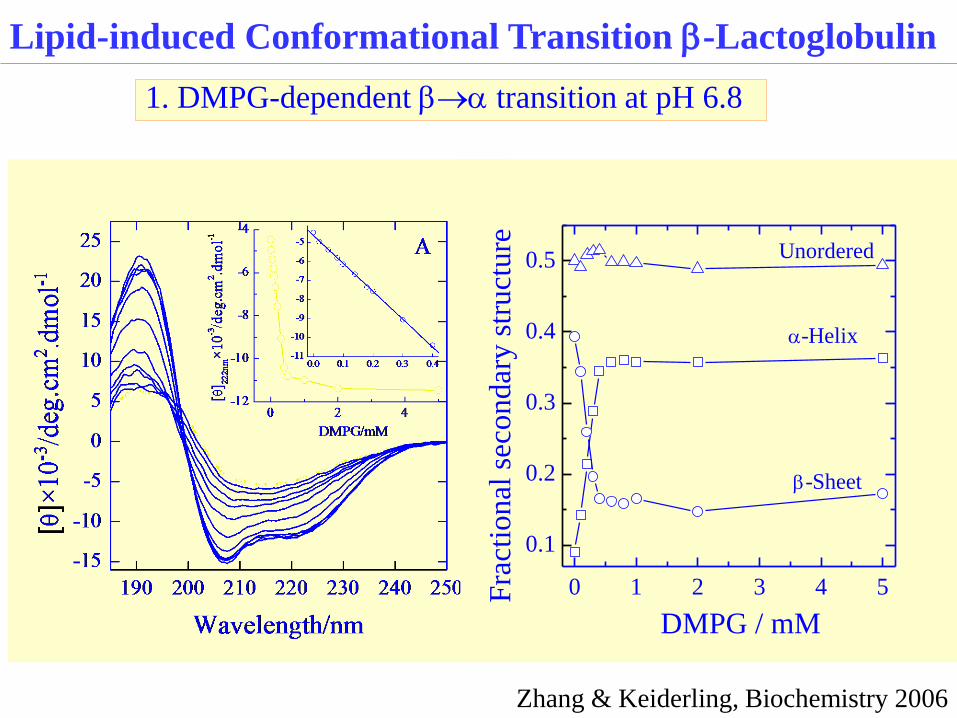
Lipid-induced Conformational Transition b-Lactoglobulin
1. DMPG-dependent ba transition at pH 6.8
0 1 2 3 4 5
0.1
0.2
0.3
0.4
0.5
b-Sheet
a-Helix
Unordered
Fra
ctio
nal
sec
on
dar
y s
tru
ctu
re
DMPG / mM
Zhang & Keiderling, Biochemistry 2006
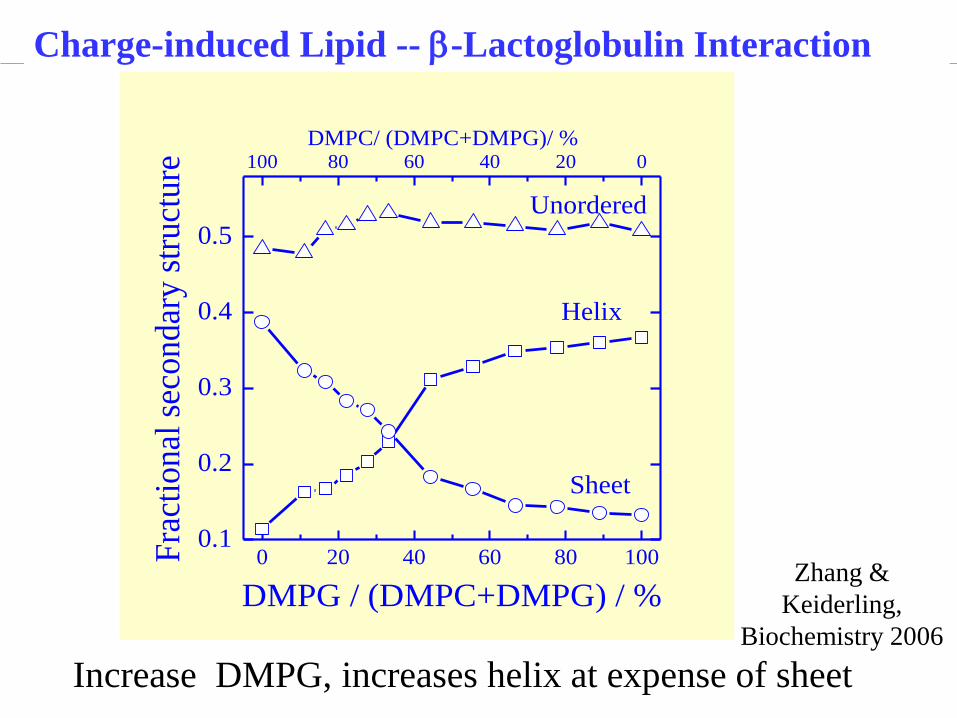
Charge-induced Lipid -- b-Lactoglobulin Interaction
0 20 40 60 80 1000.1
0.2
0.3
0.4
0.5
DMPC/ (DMPC+DMPG)/ %
Unordered
Sheet
Helix
Fra
ctio
nal
sec
ondar
y s
truct
ure
DMPG / (DMPC+DMPG) / %
100 80 60 40 20 0
Increase DMPG, increases helix at expense of sheet
Zhang &
Keiderling,
Biochemistry 2006
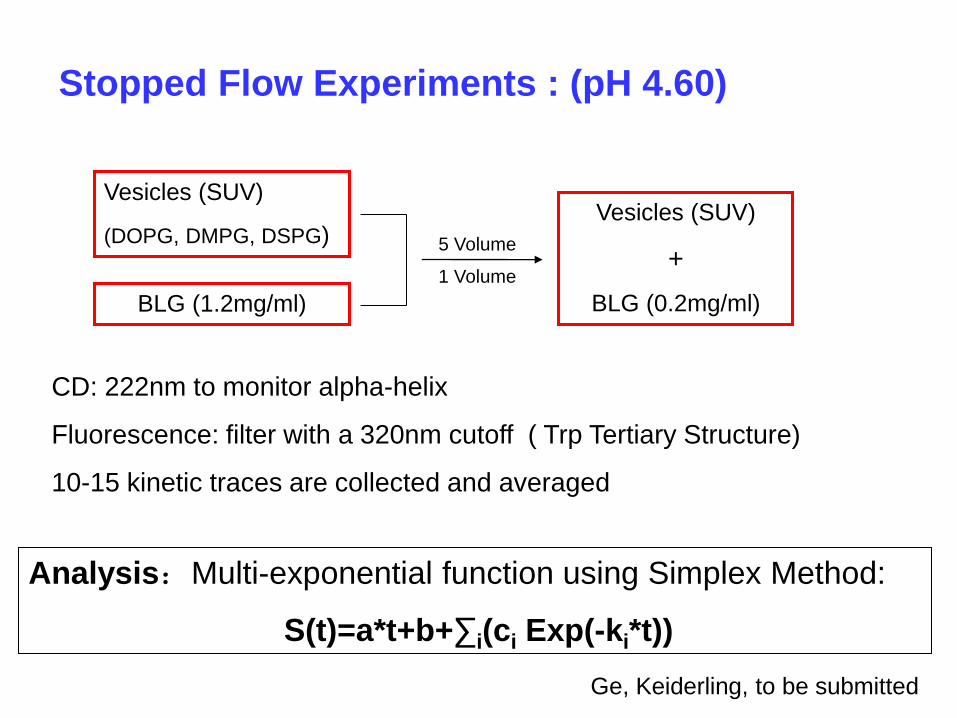
1 Volume
Vesicles (SUV)
+
BLG (0.2mg/ml)
CD: 222nm to monitor alpha-helix
Fluorescence: filter with a 320nm cutoff ( Trp Tertiary Structure)
10-15 kinetic traces are collected and averaged
5 Volume
Vesicles (SUV)
(DOPG, DMPG, DSPG)
BLG (1.2mg/ml)
Stopped Flow Experiments : (pH 4.60)
Analysis:Multi-exponential function using Simplex Method:
S(t)=a*t+b+∑i(ci Exp(-ki*t))
Ge, Keiderling, to be submitted
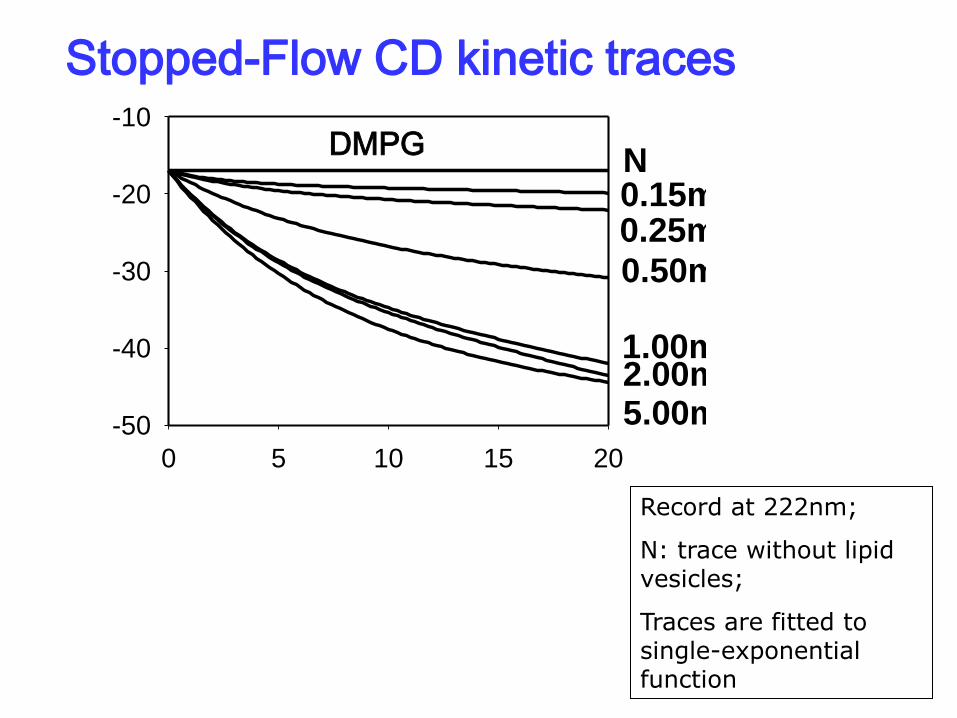
Simulated kinetics traces of BLG (0.2mg/ml) with DMPG
Time/s
0 5 10 15 20
Ellip
ticit
y(m
deg
)
-50
-40
-30
-20
-10
0.15mM DMPG
0.50mM DMPG
1.00mM DMPG2.00mM DMPG5.00mM DMPG
N
0.25mM DMPG
Stopped-Flow CD kinetic traces
DMPG
Record at 222nm;
N: trace without lipid vesicles;
Traces are fitted to single-exponential function

Kinetics traces for BLG(0.2mg/ml) with DMPG
Time/s
0 5 10 15 20
Rela
tive
In
ten
sit
y
1.0
1.2
1.4
1.6
1.8
2.0
2.2
2.4
0.15mM DMPG
0.50mM DMPG1.00mM DMPG2.00mM DMPG5.00mM DMPG
0.25mM DMPG
Stopped-Flow fluorescence kinetics
Total fluorescence >320nm;
Each trace has been divided
by kinetic trace without lipid vesicles;
Traces are fitted to two-exponential function
DMPG
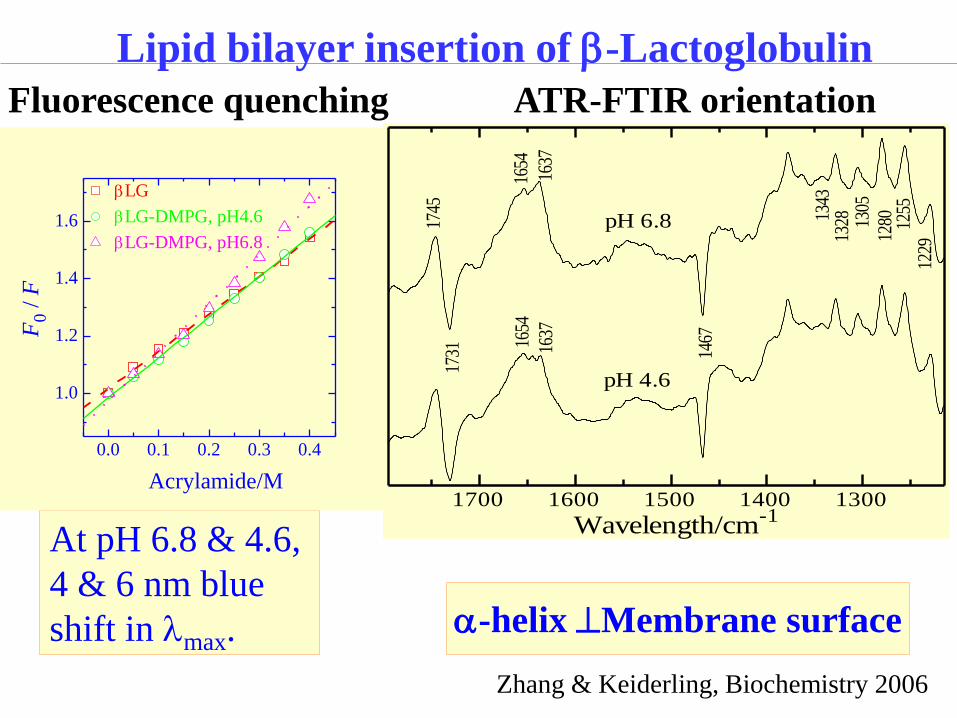
At pH 6.8 & 4.6,
4 & 6 nm blue
shift in lmax.
1700 1600 1500 1400 130016
54
1637
1745
1731
1654
1637
1467
1343
1328 13
05
1280 12
5512
29
pH 6.8
pH 4.6
Wavelength/cm-1
a-helix Membrane surface
Lipid bilayer insertion of b-Lactoglobulin
0.0 0.1 0.2 0.3 0.4
1.0
1.2
1.4
1.6
bLG
bLG-DMPG, pH4.6
bLG-DMPG, pH6.8
F0 /
F
Acrylamide/M
Zhang & Keiderling, Biochemistry 2006
ATR-FTIR orientation Fluorescence quenching
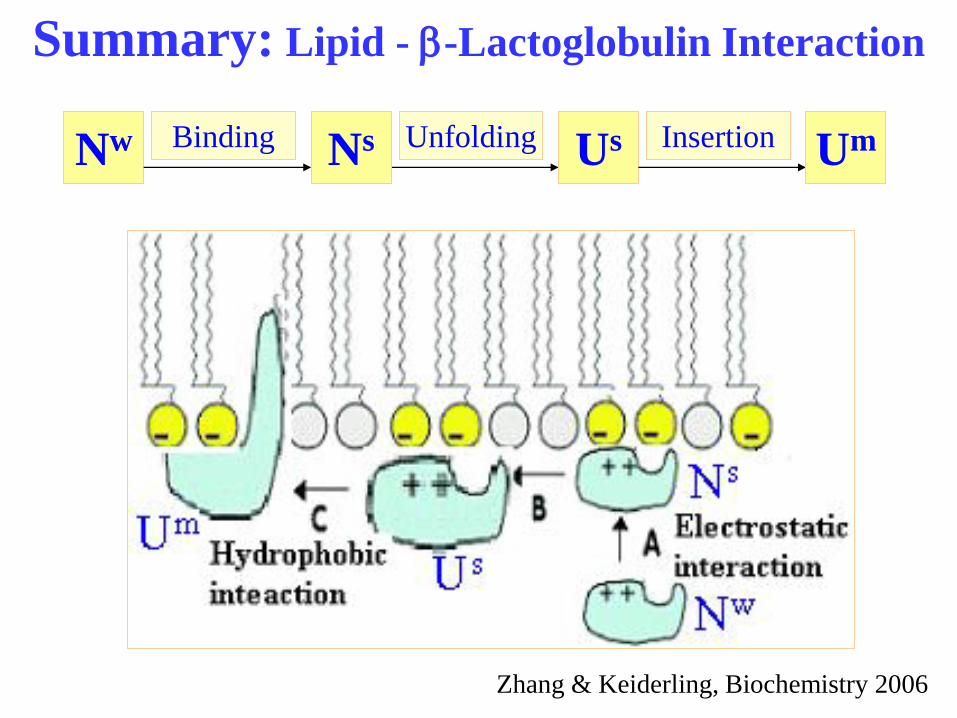
Summary: Lipid - b-Lactoglobulin Interaction
Nw Ns Unfolding Us Insertion Um Binding
Zhang & Keiderling, Biochemistry 2006

• Continued in Part b