Electronic Devices Business Strategies - Fuji · PDF fileBusinesses Major products Application...
24
©2017 Fuji Electric Co., Ltd. All rights reserved. May 25, 2017 Fuji Electric Co., Ltd. Electronic Devices Business Group Electronic Devices Business Strategies
Transcript of Electronic Devices Business Strategies - Fuji · PDF fileBusinesses Major products Application...
©2017 Fuji Electric Co., Ltd. All rights reserved.
May 25, 2017Fuji Electric Co., Ltd.
Electronic Devices Business Group
Electronic Devices Business Strategies
©2017 Fuji Electric Co., Ltd. All rights reserved.
Business Overview
Review of FY2016
FY2017 Management Plan
2
Contents
・Business Policies・Business Plan・Market Trends・Priority Measures・Capital Investment / Research and Development
©2017 Fuji Electric Co., Ltd. All rights reserved.
Business Overview
3

©2017 Fuji Electric Co., Ltd. All rights reserved. 4
Businesses Major products Application
PhotoconductorsCopiers
Printers
Inverters
UPS
PCS
Air conditioners
Automobiles
Power supplies
Magnetic disks
Aluminum substratemagnetic disks
Glass substrate magnetic disks
ハードディスクドライブ
HDD
Production bases
【Front-end processes】・Fuji Electric Matsumoto Factory・Fuji Electric Yamanashi Factory・Fuji Electric Tsugaru Semiconductor Co., Ltd.・Fuji Electric (Malaysia) Sdn. Bhd.【Back-end processes】・Fuji Electric Power Semiconductor Co., Ltd.・Fuji Electric (Shenzhen) Co .,Ltd.・Fuji Electric Philippines, Inc.・Fuji Electric (Malaysia) Sdn. Bhd.
・Fuji Electric (Shenzhen) Co .,Ltd.
・Fuji Electric (Malaysia) Sdn. Bhd.
Semi-conductors
Power semiconductors
Electronic Devices Business Overview
* UPS:Uninterruptible power system * PCS:Power conditioning sub-systems
©2017 Fuji Electric Co., Ltd. All rights reserved.
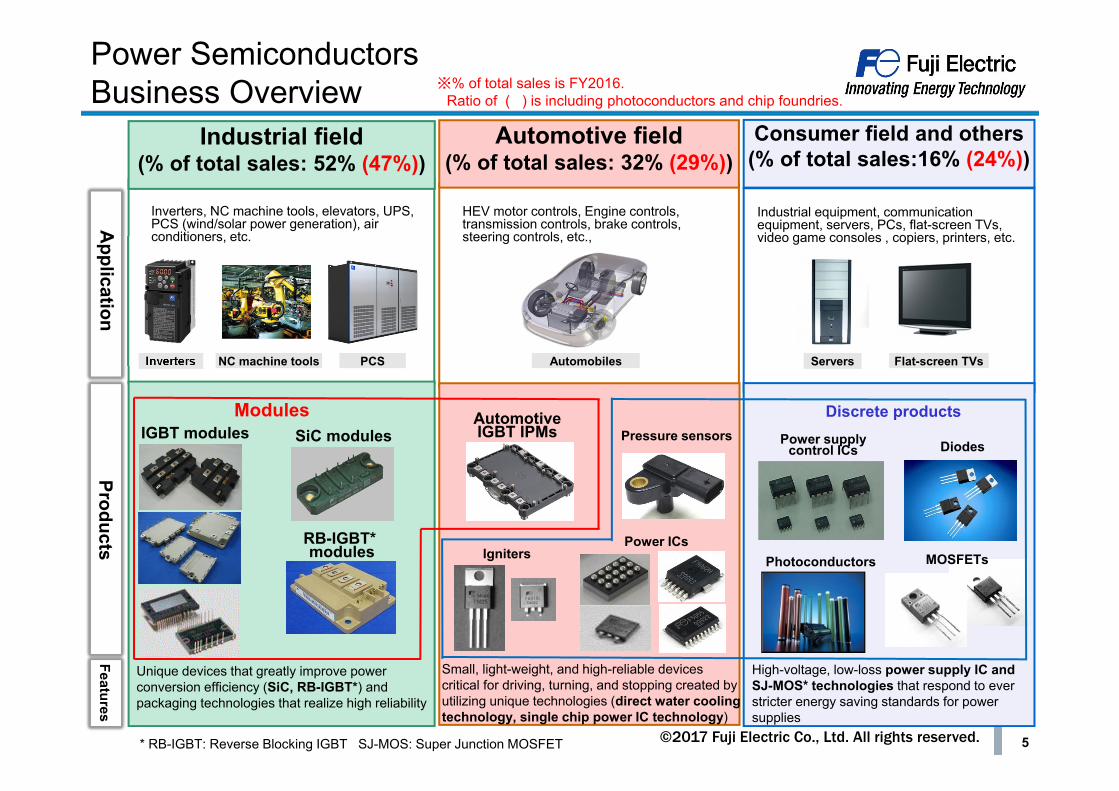
Consumer field and others(% of total sales:16% (24%))
Industrial field(% of total sales: 52% (47%))
Automotive field(% of total sales: 32% (29%))
Servers Flat-screen TVs
Unique devices that greatly improve power conversion efficiency (SiC, RB-IGBT*) and packaging technologies that realize high reliability
High-voltage, low-loss power supply IC and SJ-MOS* technologies that respond to ever stricter energy saving standards for power supplies
Small, light-weight, and high-reliable devices critical for driving, turning, and stopping created by utilizing unique technologies (direct water cooling technology, single chip power IC technology)
PCSInverters NC machine tools Automobiles
Application
* RB-IGBT: Reverse Blocking IGBT SJ-MOS: Super Junction MOSFET
Inverters, NC machine tools, elevators, UPS, PCS (wind/solar power generation), air conditioners, etc.
HEV motor controls, Engine controls, transmission controls, brake controls, steering controls, etc.,
Industrial equipment, communication equipment, servers, PCs, flat-screen TVs, video game consoles , copiers, printers, etc.
Discrete productsIGBT modules SiC modules
RB-IGBT*modules
Modules AutomotiveIGBT IPMs Pressure sensors
IgnitersPower ICs
MOSFETs
Power supply control ICs Diodes
ProductsFeatures
Power Semiconductors Business Overview
Photoconductors
※% of total sales is FY2016.Ratio of ( ) is including photoconductors and chip foundries.
5

©2017 Fuji Electric Co., Ltd. All rights reserved.
Review of FY2016
6

©2017 Fuji Electric Co., Ltd. All rights reserved.
Review of FY2016
2015年度
実績
2016年度
実績
2015年度
実績
2016年度
実績
Magnetic Disks
Semi-conductors
120.2 118.5
9.8(8.1%) 8.0
(6.8%)
95.0 97.0
Overall Experienced YoY decreases in sales and income as
semiconductor sales were unable to compensate for the impacts of lower demand for magnetic disks
Semiconductors Achieved YoY increases in sales and income centered on
products for the industrial and consumer fields Commenced integrated operation increasing flexibility in
areas spanning from R&D to sales (completed consolidation of sales, R&D, and manufacturing divisions)
Step up efforts to have our proposed specifications for automotive IGBT modules accepted
Promoted local design, production, and consumption
Magnetic Disks Minimized impacts of customer structure reforms
implemented in response to market condition downturns Compensated for declines in magnetic disk sales with
substrate sales Advanced development of new products together with
customers
25.2 21.5
Change
-1.7
-3.7
+2.0
-1.7
Net Sales by Subsegment (Billion yen)
Magnetic Disks
Semi-conductors
Change
FY2015Results
FY2016Results
FY2015Results
FY2016Results
7
Operating Income / Income Margin (Billion yen)

©2017 Fuji Electric Co., Ltd. All rights reserved.
FY2017 Management Plan
8

©2017 Fuji Electric Co., Ltd. All rights reserved.
FY2017 Business Policies
Secure income through business operation methods that minimize the impacts of market fluctuations
Solidify industry position with world-leading technologies and products
【Semiconductors】Accelerate development of new products, bolster 8-inch
wafer production capacity, and invest in production equipment for new products to achieve targets of FY2018 Medium-Term Management
【Magnetic Disks】Secure stable sales volumes and maintain profitability
amidst contraction of HDD market9
©2017 Fuji Electric Co., Ltd. All rights reserved.
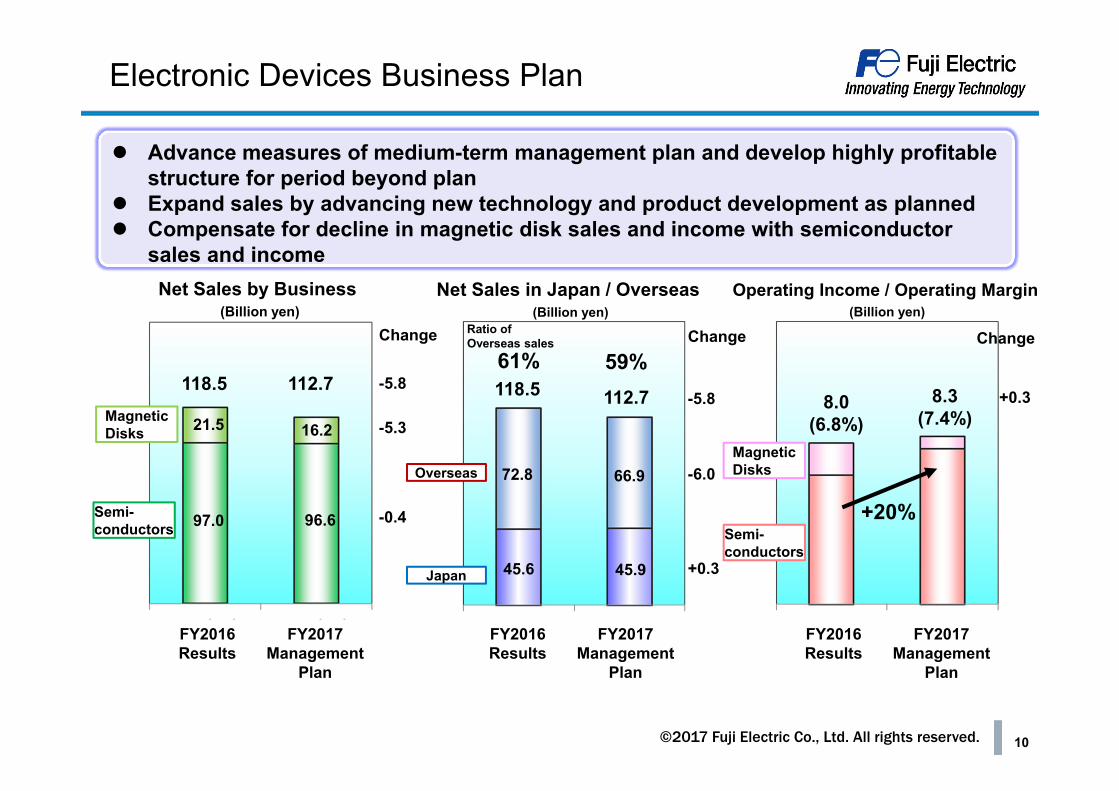
Electronic Devices Business Plan
Magnetic Disks
Semi-conductors
118.5 112.78.0
(6.8%)8.3
(7.4%)118.5 112.7
Japan
OverseasMagnetic Disks
Semi-conductors
Net Sales by Business (Billion yen)
Operating Income / Operating Margin(Billion yen)
Net Sales in Japan / Overseas (Billion yen)
61% 59%
97.0
Advance measures of medium-term management plan and develop highly profitable structure for period beyond plan
Expand sales by advancing new technology and product development as planned Compensate for decline in magnetic disk sales and income with semiconductor
sales and income
96.6
21.5 16.2
+20%
72.8 66.9
45.6 45.9
Change
-5.8
-5.3
-0.4
+0.3
Ratio of Overseas sales
-6.0
+0.3
-5.8
FY2017Management
Plan
FY2016Results
FY2017Management
Plan
FY2016Results
FY2017Management
Plan
FY2016Results
Change Change
10
©2017 Fuji Electric Co., Ltd. All rights reserved.
Semiconductors
11
©2017 Fuji Electric Co., Ltd. All rights reserved.
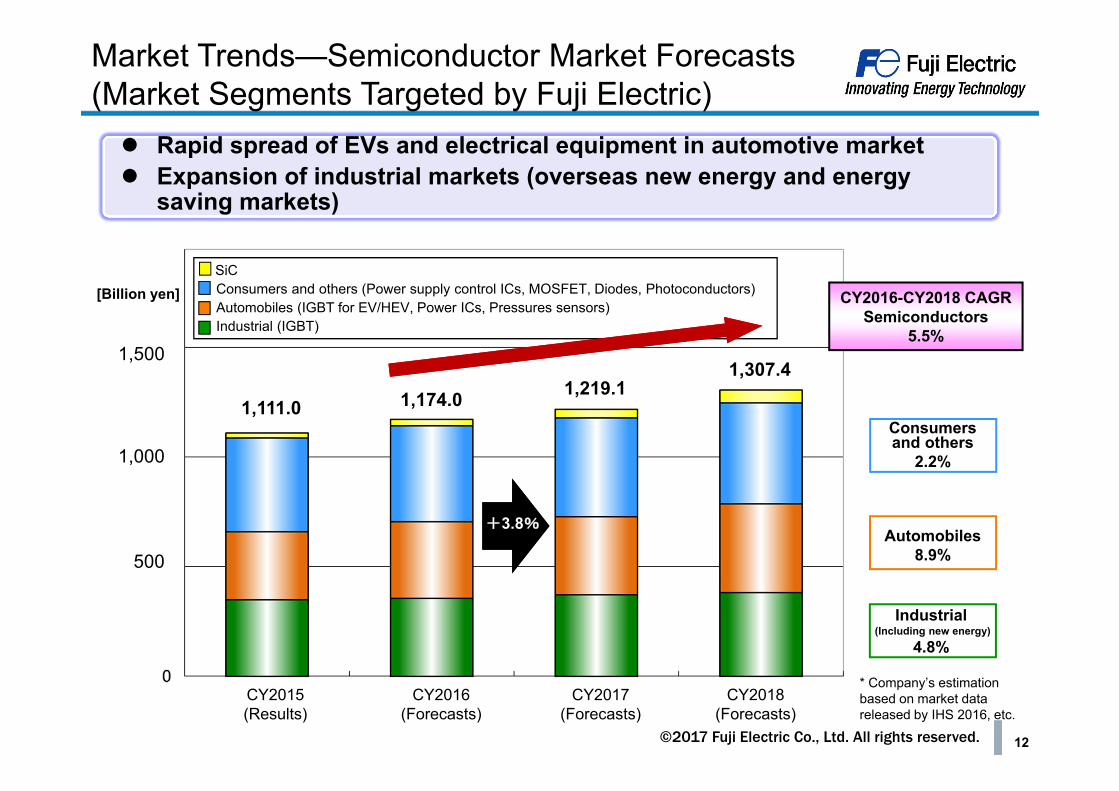
Market Trends—Semiconductor Market Forecasts(Market Segments Targeted by Fuji Electric)
CY2016-CY2018 CAGRSemiconductors
5.5%
Consumers and others
2.2%
Automobiles8.9%
Industrial(Including new energy)
4.8%
[Billion yen]
Rapid spread of EVs and electrical equipment in automotive market Expansion of industrial markets (overseas new energy and energy
saving markets)
(実績) (予測) (予測) (予測)
+3.8%
SiCConsumers and others (Power supply control ICs, MOSFET, Diodes, Photoconductors)Automobiles (IGBT for EV/HEV, Power ICs, Pressures sensors)Industrial (IGBT)
1,500
1,000
500
1,111.0 1,174.0 1,219.11,307.4
CY2015(Results)
CY2016(Forecasts)
CY2017(Forecasts)
CY2018(Forecasts)
* Company’s estimation based on market data released by IHS 2016, etc.
12
©2017 Fuji Electric Co., Ltd. All rights reserved.
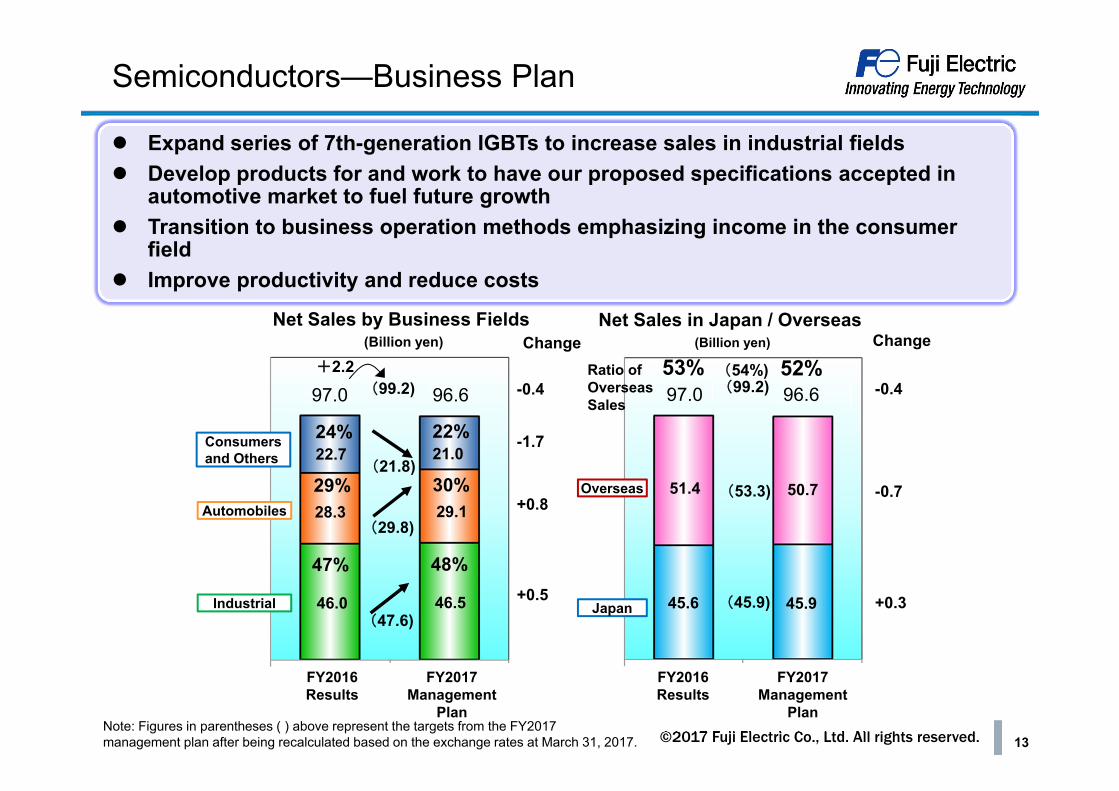
Semiconductors—Business Plan
Consumers and Others
Industrial Japan
OverseasAutomobiles
53% 52%
47% 48%
29% 30%
Expand series of 7th-generation IGBTs to increase sales in industrial fields Develop products for and work to have our proposed specifications accepted in
automotive market to fuel future growth Transition to business operation methods emphasizing income in the consumer
field Improve productivity and reduce costs
45.6 45.9
51.4 50.7
Change
-0.7
Change
28.3 29.1
46.0 46.5
+0.8
+0.5
-0.4
22.724%
21.022% -1.7
Ratio of Overseas Sales
+0.3
-0.4
(47.6)
(29.8)
(21.8)
(99.2)+2.2
(99.2)
(53.3)
(45.9)
(54%)
Net Sales by Business Fields (Billion yen)
Net Sales in Japan / Overseas (Billion yen)
FY2017Management
Plan
FY2016Results
Note: Figures in parentheses ( ) above represent the targets from the FY2017 management plan after being recalculated based on the exchange rates at March 31, 2017.
FY2017Management
Plan
FY2016Results
13
97.0 96.697.0 96.6
©2017 Fuji Electric Co., Ltd. All rights reserved.
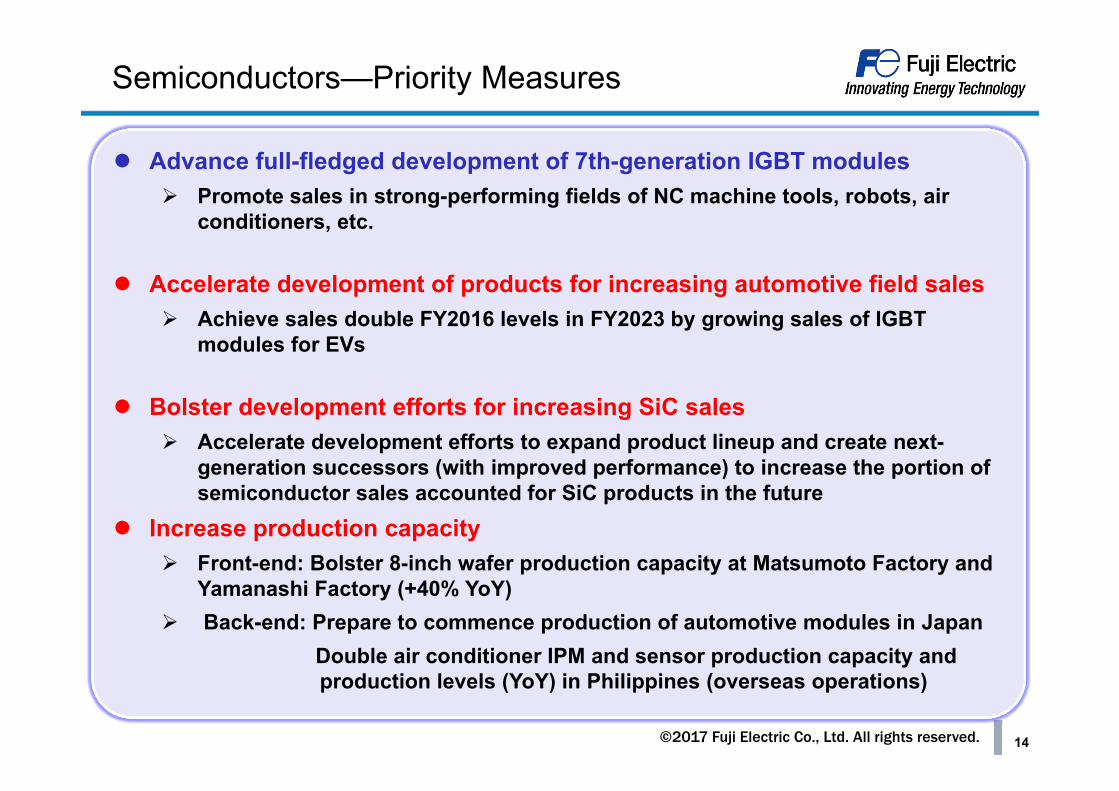
Semiconductors—Priority Measures
Advance full-fledged development of 7th-generation IGBT modules Promote sales in strong-performing fields of NC machine tools, robots, air
conditioners, etc.
Accelerate development of products for increasing automotive field sales Achieve sales double FY2016 levels in FY2023 by growing sales of IGBT
modules for EVs
Bolster development efforts for increasing SiC sales Accelerate development efforts to expand product lineup and create next-
generation successors (with improved performance) to increase the portion of semiconductor sales accounted for SiC products in the future
Increase production capacity Front-end: Bolster 8-inch wafer production capacity at Matsumoto Factory and
Yamanashi Factory (+40% YoY) Back-end: Prepare to commence production of automotive modules in Japan
Double air conditioner IPM and sensor production capacity and production levels (YoY) in Philippines (overseas operations)
14

©2017 Fuji Electric Co., Ltd. All rights reserved.
Automotive Field Business Plan and Module Performance Improvement Increase sales of high-value-added module products Utilize cutting-edge chip, package, and cooling technologies to realize
top levels of output electric power density
2010 2015 2020 2025
Outpu
t electric
pow
er den
sity Ratio
*2
1
5
3rd-gen. Al direct liquid-
cooling
4th-gen. Al direct liquid-cooling
2nd-gen. Cu direct liquid-
cooling
1st-gen. Al direct liquid-cooling
2nd-gen. Al direct liquid-
cooling
Industrial-use 7th gen.
Si IGBT automotive module
Competitor A
Competitor B
SiC automotive module
Commence mass production in Oct. 2017
Plan for enhancing performance of modules for xEV power trains
15
*1. In comparison to FY2016 sales*2. Output electric power density ratio: Output electric power density of each generation with 1st-
generation Al direct liquid-cooling indexed to 1Output electric power density (kVA/L) = Maximum power output (kVA) ÷ Module volume (L)

©2017 Fuji Electric Co., Ltd. All rights reserved.
Redoubling of Development Efforts for Increasing SiC Sales Step up product development utilizing results of R&D ventures
conducted to date Accelerate development of trench MOSFET technologies to achieve
world-leading performanceSiC Market Trends
Reasons for delays in SiC market expansion・High costs of SiC wafers・Frequent quality deficiencies of SiCwafers
・Slow expansion of sales volumes
More than 20% lower (target)
1st-gen. Fuji product
2nd-gen. Fuji product
Latest Company A product
Latest Company B product
Performance and Market Positon of Fuji Electric Products
* Per unit area on-resistance (mΩcm2) under gate drive conditions recommended by each company with Fuji Electric’s 1st-generation trench MOSFET indexed to 1
* Source for market trend data: IHS, 2016
1,200 V SiC trench MOSFETVth=5V
Approx. 30% lower
Approx. 15% lower
(Billion yen)
Forecast in 2012
Forecast in 2013
Forecast in 2014
Forecast in 2016
Loss
inde
x*
Fiscal Year
200Market Scale (Forecasts)
150
100
50
14 15 16 17 18 19 20 (CY)
16
Better

©2017 Fuji Electric Co., Ltd. All rights reserved.
Malaysia
Japan (Matsumoto)
Japan (Tsugaru)
Japan (Yamanashi)
・Increase 8-inch wafer production capacity (9,000 wafers → 12,000 wafers)
・Expand range of automotive application IGBT series manufactured
・Commence production of 7th-generation IGBTs
Japan (3 bases)
Malaysia
Philippines
China (Shenzhen)
・Increase ratio of power semiconductor production (50% → 80%)
・Expand range of IGBT (FWD), power IC, and MOS series manufactured
・Transfer production of products for automotive applications
・Increase 8-inch wafer production capacity (3,000 wafers → 5,000 wafers)
・Move to full-fledged mass production as SiC device production base
・Expand range of 6th-generation IGBT series manufactured
・Bolster facilities for producing automotive IGBT modules
・Manufacture products for domestic customers
・Function as mother bases
Front-end processes
Back-end processes
・Expand range of IGBT module models manufactured
(Currently planning to manufacture industrial-use IPMs)
・Double air conditioner IPM production capacity
・Bolster production capacity of products for power supplies and pressure sensors for automotive applications
Increase ratio of large-diameter wafer fabrication and improve productivity
Expand range of models produced overseas
Plans for Production Capacity Expansion
・Expand range of IGBT module models manufactured
(Currently planning to manufacture large-capacity modules)
17

©2017 Fuji Electric Co., Ltd. All rights reserved.
Magnetic Disks
18

©2017 Fuji Electric Co., Ltd. All rights reserved.
Total Shipped Data Volumes
Source : Trend Focus, Feb 2017CE= Consumer Electronics, Trad. Ent.= Traditional Enterprise
Overall data volume to continue to increase, HDD expected to cover majority of data demand
Large growth in data volume from nearline models for cloud servers and CE models for surveillance cameras in HDD field
NAND全体
Data shipment volumes as HDD, SSD and NAND Memory HDD Data Shipment Volumes
CY2015-2018 Total CAGR: +21.9%CY2015-2018 CAGR: +5.7%
All NAND
19
NAND (SSD) NAND (non-SSD)
©2017 Fuji Electric Co., Ltd. All rights reserved.
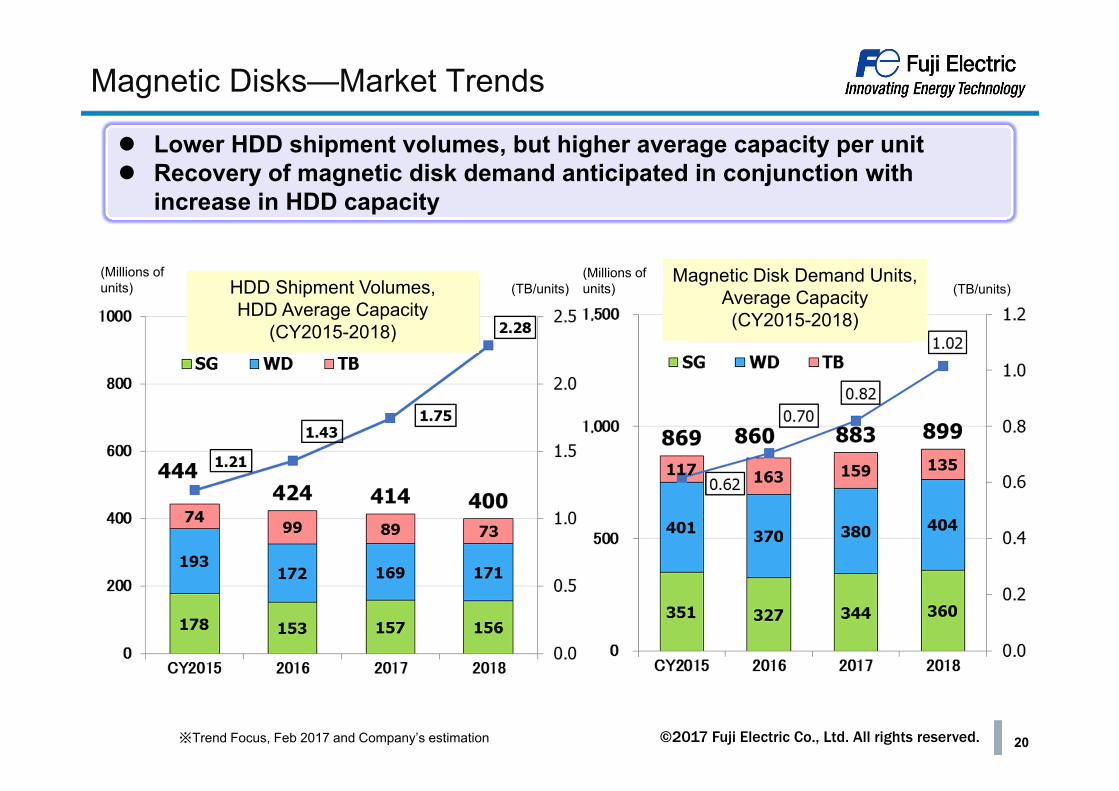
Magnetic Disks—Market Trends
Lower HDD shipment volumes, but higher average capacity per unit Recovery of magnetic disk demand anticipated in conjunction with
increase in HDD capacity
※Trend Focus, Feb 2017 and Company’s estimation
HDD Shipment Volumes, HDD Average Capacity
(CY2015-2018)
Magnetic Disk Demand Units, Average Capacity (CY2015-2018)
(Millions of units) (TB/units)
(Millions of units) (TB/units)
20

©2017 Fuji Electric Co., Ltd. All rights reserved.
Priority MeasuresSecure sales and income
Secure sales through new products Increase cost competitiveness by reducing costs
Advance R&D Promote joint-development with customers
Magnetic Disks—Business Plan
Reinforce constitution to secure income as sales decrease
約40%/
約60%
67%/
33%
34%/
66%
41%/
59%
(Billion yen)
40
30
20
10
29.0 25.2
21.5 16.2
approx. 40%
/60%
FY2014 FY2015 FY2016 FY2017
HDD
External sale substrate
FY2014
Aluminum substrate/
Glass substrate
21

©2017 Fuji Electric Co., Ltd. All rights reserved.
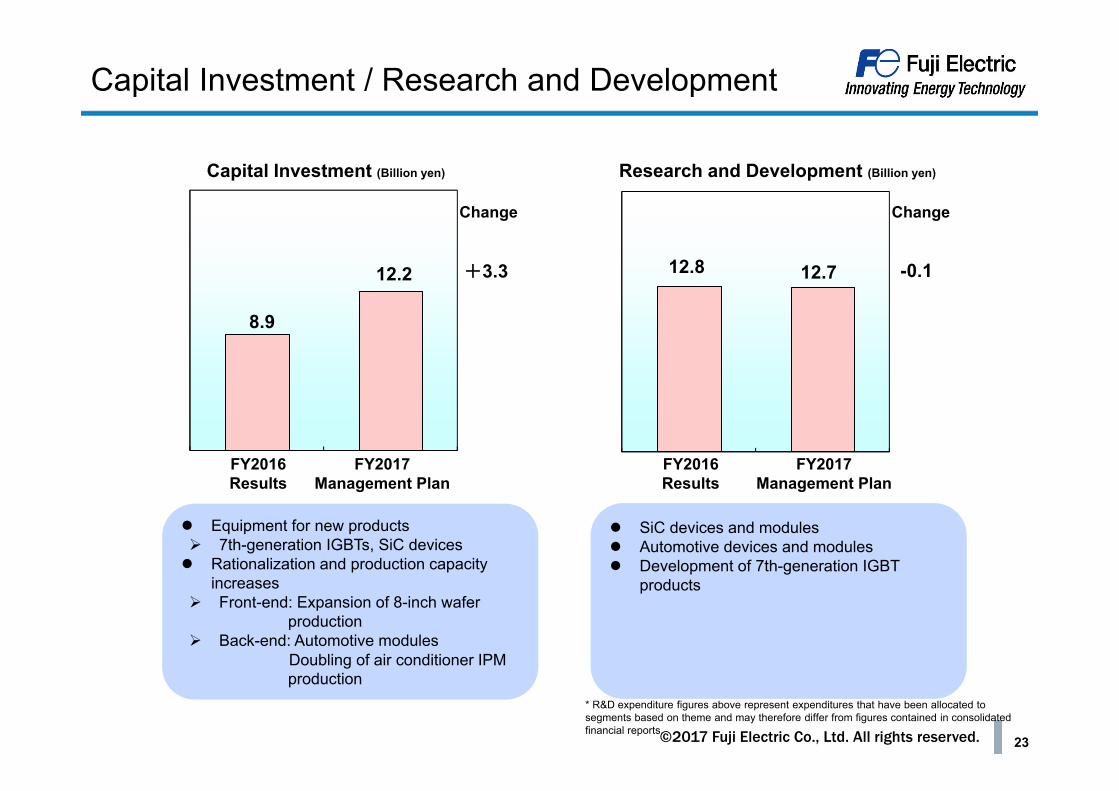
Capital Investment / Research and Development
22
©2017 Fuji Electric Co., Ltd. All rights reserved.
Equipment for new products 7th-generation IGBTs, SiC devices Rationalization and production capacity
increases Front-end: Expansion of 8-inch wafer
production Back-end: Automotive modules
Doubling of air conditioner IPMproduction
SiC devices and modules Automotive devices and modules Development of 7th-generation IGBT
products
8.9
12.2 +3.3
FY2017 Management Plan
FY2016Results
12.8 12.7 -0.1
Change Change
* R&D expenditure figures above represent expenditures that have been allocated to segments based on theme and may therefore differ from figures contained in consolidated financial reports.
Capital Investment / Research and Development
Capital Investment (Billion yen) Research and Development (Billion yen)
FY2017 Management Plan
FY2016Results
23
©2017 Fuji Electric Co., Ltd. All rights reserved.
Disclaimer
1. Statements made in this documents or in the presentation to which they pertainregarding estimates or projections are forward-looking statements based on the company’s judgments and assumptions in light of information currently available. Actual results may differ materially from those projected as a result of uncertaintiesinherent in such judgments and assumptions, as well as changes in businessoperations or other internal or external conditions. Accordingly, the company gives noguarantee regarding the reliability of any information contained in these forward-looking statements.
2. These documents are for information purpose only, and do not constitute an inducement by the company to make investments.
3. Unauthorized reproduction of these documents, in part or in whole, is prohibited.
24