
High harmonic generation in a large-volume capillary for seeding of free-electron lasers
Upload
truongdangCategory
view
227download
0
Instructions for use
Title Electron trajectory selection for high harmonic generation inside a short hollow fiber
Author(s) Igarashi, Hironori; Makida, Ayumu; Sekikawa, Taro
Citation Optics express, 21(18): 20632-20640
Issue Date 2013-09-09
Doc URL http://hdl.handle.net/2115/53624
Rights
This paper was published in Optics Express and is made available as an electronic reprint with the permission of OSA.The paper can be found at the following URL on the OSA website:[http://www.opticsinfobase.org/view_article.cfm?gotourl=http%3A%2F%2Fwww.opticsinfobase.org%2FDirectPDFAccess%2F228328E9-9198-7963-464D808931F962DB_260720%2Foe-21-18-20632.pdf%3Fda%3D1%26id%3D260720%26seq%3D0%26mobile%3Dno&org=]. Systematic or multiplereproduction or distribution to multiple locations via electronic or other means is prohibited and is subject to penaltiesunder law.
Type article
File Information oe-21-18-20632.pdf
Hokkaido University Collection of Scholarly and Academic Papers : HUSCAP

Electron trajectory selection for high harmonic generation inside a short hollow fiber
Hironori Igarashi, Ayumu Makida, and Taro Sekikawa* Department of Applied Physics, Hokkaido University, Kita 13 Nishi 8, Kita-ku, Sapporo 060-8628, Japan
Abstract: The 19th harmonic beam divergences from a Ti:sapphire laser generated using a gas jet and 10-mm-long hollow fibers with bore diameters of 300 and 200 μm were investigated. The beam quality factor M2 of the harmonic beam generated in a 300-μm hollow fiber was found to be better than the gas jet using the phase match including the atomic dipole phase induced by the short trajectory. On the other hand, a 200-μm hollow fiber was found to generate a more divergent beam with a larger M2 because of the long trajectory. The electron trajectory contributing to high harmonic generation was selected using the phase-matching process inside a short hollow fiber.
©2013 Optical Society of America
OCIS codes: (190.4160) Multiharmonic generation; (020.2649) Strong field laser physics.
References and links
1. M. Hentschel, R. Kienberger, C. Spielmann, G. A. Reider, N. Milosevic, T. Brabec, P. Corkum, U. Heinzmann, M. Drescher, and F. Krausz, “Attosecond metrology,” Nature 414(6863), 509–513 (2001).
2. T. Sekikawa, A. Kosuge, T. Kanai, and S. Watanabe, “Nonlinear optics in the extreme ultraviolet,” Nature 432(7017), 605–608 (2004).
3. E. Goulielmakis, M. Schultze, M. Hofstetter, V. S. Yakovlev, J. Gagnon, M. Uiberacker, A. L. Aquila, E. M. Gullikson, D. T. Attwood, R. Kienberger, F. Krausz, and U. Kleineberg, “Single-Cycle Nonlinear Optics,” Science 320(5883), 1614–1617 (2008).
4. J. Seres, E. Seres, A. J. Verhoef, G. Tempea, C. Streli, P. Wobrauschek, V. Yakovlev, A. Scrinzi, C. Spielmann, and F. Krausz, “Souce of coherent kiloelectronvolt x-rays,” Nature 433, 596 (2005).
5. T. Popmintchev, M.-C. Chen, D. Popmintchev, P. Arpin, S. Brown, S. Ališauskas, G. Andriukaitis, T. Balčiunas, O. D. Mücke, A. Pugzlys, A. Baltuška, B. Shim, S. E. Schrauth, A. Gaeta, C. Hernández-García, L. Plaja, A. Becker, A. Jaron-Becker, M. M. Murnane, and H. C. Kapteyn, “Bright Coherent Ultrahigh Harmonics in the keV X-ray Regime from Mid-Infrared Femtosecond Lasers,” Science 336(6086), 1287–1291 (2012).
6. A. Rundquist, C. G. Durfee III, Z. Chang, C. Herne, S. Backus, M. M. Murnane, and H. C. Kapteyn, “Phase-matched generation of coherent soft x-rays,” Science 280(5368), 1412–1415 (1998).
7. Y. Tamaki, J. Itatani, Y. Nagata, M. Obara, and K. Midorikawa, “Highly efficient, phase-matched high-hramonic generation by a self-guided laser beam,” Phys. Rev. Lett. 82(7), 1422–1425 (1999).
8. Y. Tamaki, Y. Nagata, M. Obara, and K. Midorikawa, “Phase-matched high-order-harmonic generation in a gas-filled hollow fiber,” Phys. Rev. A 59(5), 4041–4044 (1999).
9. E. T. F. Rogers, S. L. Stebbings, A. M. Paula, C. A. Froud, M. Praeger, B. Mills, J. Grant-Jacob, W. S. Brocklesby, and J. G. Frey, “Spatiotemporal phase-matching in capillary high-harmonic generation,” J. Opt. Soc. Am. B 29(4), 806–812 (2012).
10. H. Igarashi, A. Makida, M. Ito, and T. Sekikawa, “Pulse compression of phase-matched high harmonic pulses from a time-delay compensated monochromator,” Opt. Express 20(4), 3725–3732 (2012), http://www.opticsinfobase.org/oe/abstract.cfm?URI=oe-20-4-3725.
11. P. Villoresi, “Compensation of optical path lengths in extreme-ultraviolet and soft-x-ray monochromators for ultrafast pulses,” Appl. Opt. 38(28), 6040–6049 (1999).
12. L. Nugent-Glandorf, M. Scheer, D. A. Samuels, V. M. Bierbaum, and S. R. Leone, “A laser-based instrument for the study of ultrafast chemical dynamics by soft x-ray-probe photoelectron spectroscopy,” Rev. Sci. Instrum. 73(4), 1875–1886 (2002).
13. L. Poletto, P. Villoresi, E. Benedetti, F. Ferrari, S. Stagira, G. Sansone, and M. Nisoli, “Intense femtosecond extreme ultraviolet pulses by using a time-delay-compensated monochromator,” Opt. Lett. 32(19), 2897–2899 (2007).
14. M. Ito, Y. Kataoka, T. Okamoto, M. Yamashita, and T. Sekikawa, “Spatiotemporal characterization of single-order high harmonic pulses from time-compensated toroidal-grating monochromator,” Opt. Express 18(6), 6071–6078 (2010), http://www.opticsinfobase.org/oe/abstract.cfm?URI=oe-18-6-6071.
15. P. Salières, A. L’Huillier, and M. Lewenstein, “Coherence Control of High-Order Harmonics,” Phys. Rev. Lett. 74(19), 3776–3779 (1995).
#189582 - $15.00 USD Received 29 Apr 2013; revised 22 Jul 2013; accepted 8 Aug 2013; published 27 Aug 2013(C) 2013 OSA 9 September 2013 | Vol. 21, No. 18 | DOI:10.1364/OE.21.020632 | OPTICS EXPRESS 20632
16. P. Balcou, P. Salieres, A. L'Huillier, and M. Lewenstein, “Generalized phase-matching conditions for high harmonics:The role of field-gradient forces,” Phys. Rev. A 55(4), 3204–3210 (1997).
17. D. Yoshitomi, J. Nees, N. Miyamoto, T. Sekikawa, T. Kanai, G. Mourou, and S. Watanabe, “Phase-matched enhancements of high-harmonic soft X-rays by adaptive wave-front control with a genetic algorithm,” Appl. Phys. B 78(3-4), 275–280 (2004).
18. M. Lewenstein, P. Salières, and A. L’Huillier, “Phase of the atomic polarization in high-order harmonic generation,” Phys. Rev. A 52(6), 4747–4754 (1995).
19. M. B. Gaarde, F. Salin, E. Constant, P. Balcou, K. J. Schafer, K. C. Kulander, and A. L'Huillier, “Spatiotemporal separation of high harmonic radiation into two quantum path components,” Phys. Rev. A 59(2), 1367–1373 (1999).
20. M. B. Gaarde and K. J. Schafer, “Quantum path distributions for high-order harmonics in rare gas atoms,” Phys. Rev. A 65(3), 031406 (2002).
21. M. V. Ammosov, N. B. Delone, and V. P. Krainov, “Tunnel ionization of complex atoms and of atomic ions in an alternating electromagnetic field,” Sov. Phys. JETP 64, 1191–1194 (1986).
22. M. Lewenstein, P. Balcou, M. Y. Ivanov, A. L’Huillier, and P. B. Corkum, “Theory of high-harmonic generation by low-frequency laser fields,” Phys. Rev. A 49(3), 2117–2132 (1994).
1. Introduction
High harmonics generated by nonlinear interactions between intense laser fields and atoms or molecules are coherent ultrashort table-top light sources in the extreme ultraviolet (XUV) and soft-x-ray regions. The shortest pulse duration achieved for these sources are in attosecond range [1–3] with the photon energy reaching hard x-rays [4, 5]. Thus, high harmonics are promising light sources that can be used to investigate ultrafast phenomena in extreme conditions. However, one drawback of high harmonics is the relatively low conversion efficiency from the driving laser pulses, which is on the order of 10−5 to 10−7. To increase the conversion efficiency, the phase-matching conditions for high harmonic generation have been extensively investigated [6–8]. Even today the phase matching for high harmonic generation is still an interesting and important topic [9]. One approach for the phase matching is to use a gas-filled hollow fiber to confine the laser beam longer than the confocal parameter [6, 8, 9]. Another approach is to employ the loose focus of the laser beam, which causes the confocal parameter itself to become longer [7].
In a previous study [10], we enhanced the conversion efficiency by a factor of 7 at the 19th harmonic (H19) by using a hollow fiber to make the interaction length longer and evaluated the saturation condition of the harmonic intensity in relation to gas pressure. After the selection of a single harmonic using a time-delay compensated monochromator (TDCM) with the temporal duration preserved [10–14], the output photon fluxes at 23.4, 26.5 29.6, 32.8, and 35.9 eV were 1.8 × 10⁹, 4.0 × 10⁹, 7.1 × 10⁹, 5.7 × 10⁹, and 6.4 × 10⁹ photons/s, respectively [10]. These were comparable to the photon fluxes at synchrotron radiation facilities. Consequently, a promising tunable high harmonic beam line was developed at our facility to be used as an ultrashort XUV light source.
For design of optical systems such as spectrometers and TDCMs, both photon flux and beam divergence are important parameters of the high harmonic beam. By using a gas jet for high harmonic generation, it has been found that the beam divergence depends on the position of the gas jet owing to phase matching, including the atomic dipole phase [15]. On the other hand, for a longer fiber, only the harmonic beam propagating along the fiber survives and should be collimated. However, we found that the optimum fiber length for increasing the photon flux was 10 mm when the confocal parameter was 6 mm [10], although the 10-mm-long fiber length is shorter than the lengths used in the preceding works (3–6 cm) [6, 8, 9]. In our case, the 20-mm-long propagation inside a fiber did not lead to efficient harmonic generation. As a result, we concluded that the relatively lower conversion efficiency was due to the worse phase-matching condition caused by the coupling loss to the fiber [10]. Therefore, we are interested in the beam divergence and the quality factor M 2 of a high harmonic beam from a relatively short hollow fiber. The effect of a short fiber on the phase-matching condition has rarely been investigated so far. We will discuss the beam divergence, taking into account the 2-dimensional phase-matching condition.
#189582 - $15.00 USD Received 29 Apr 2013; revised 22 Jul 2013; accepted 8 Aug 2013; published 27 Aug 2013(C) 2013 OSA 9 September 2013 | Vol. 21, No. 18 | DOI:10.1364/OE.21.020632 | OPTICS EXPRESS 20633
2. Experiment
The H19 from the Ti:sapphire (TiS) laser was generated by focusing the 700-μJ, 30-fs laser pulses into an argon gas medium with a 0.5-m focal length. The beam diameters on the focusing mirror and at focus were 18 mm and 116 μm, respectively. This resulted in a M 2 of 4.3. The confocal parameter was 6 mm. The peak intensity at focus was 2.2 × 10¹⁴ W/cm2.
We used three types of gas targets: a gas jet with a 1-mm nozzle diameter and 10-mm-long hollow fibers with bore diameters of 300 and 200 μm. Since the focused fundamental beam diameter was 220 μm at the edge of the hollow fiber, the laser beam traveled through the 300-μm fiber as though it was free space and the fiber worked as a static gas cell. On the other hand, the laser beam traveling through the 200-μm fiber was truncated and the peak intensity inside the fiber was reduced by about 60%. Consequently, we measured the beam divergences generated in the following three interaction schemes: the 1-mm-long (nozzle diameter of the gas jet), 10-mm-long interactions of Gaussian beams with peak intensities of 2.2 × 10¹⁴ W/cm2 (300-μm fiber) and 1.3 × 10¹⁴ W/cm2 (200-μm fiber).
The H19 beam divergence was measured as follows: The high harmonic beam was dispersed using a toroidal grating (HORIBA JOBIN YVON, 54000910) to separate the harmonic order in the horizontal direction. The beam profile was measured both at 0th-order reflection and at 1st-order diffraction by rotating the grating to examine the focal aberration of the toroidal grating. Then, the beam was converted to visible light using a cerium-doped yttrium aluminum garnet (Ce:YAG) plate placed at various points along the focal plane of the grating. The beam radius, defined by 1/e2 points, was determined using the spot size in the vertical direction measured by a charge coupled device (CCD) camera [14]. To evaluate the beam divergence precisely, it is more appropriate to measure the horizontal direction simultaneously. However, since all high harmonics are generated collinearly, only the vertical direction was evaluated in this work.
3. Results
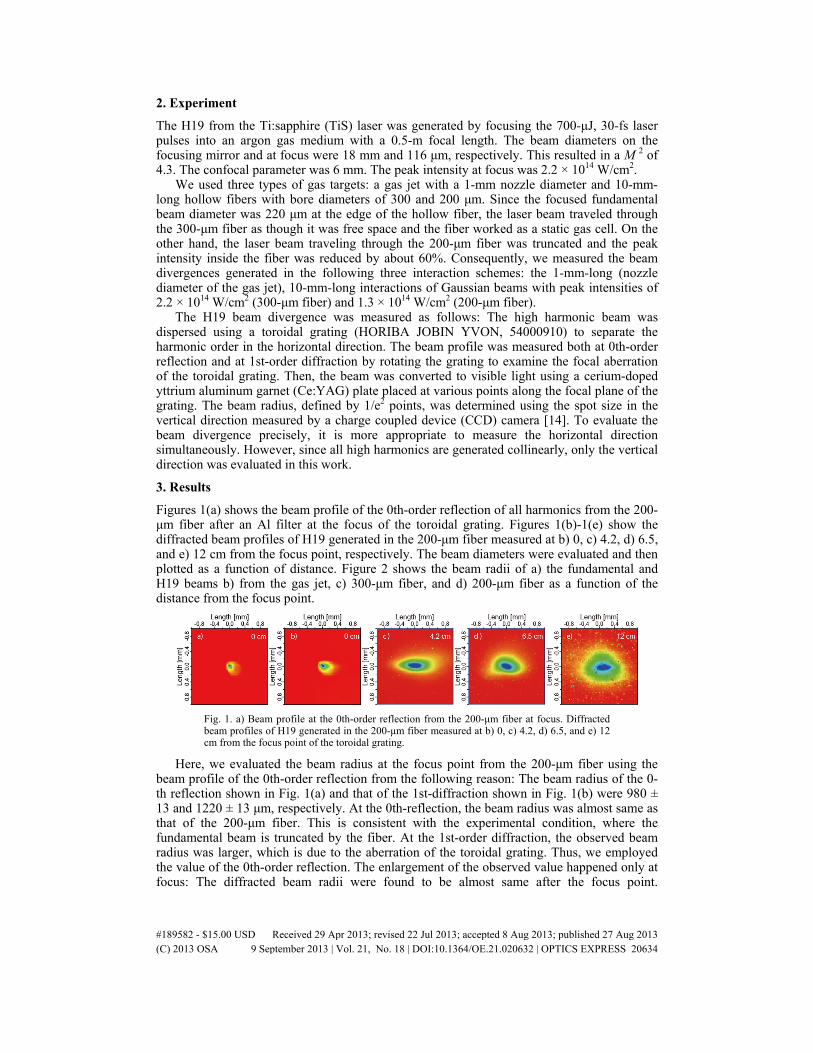
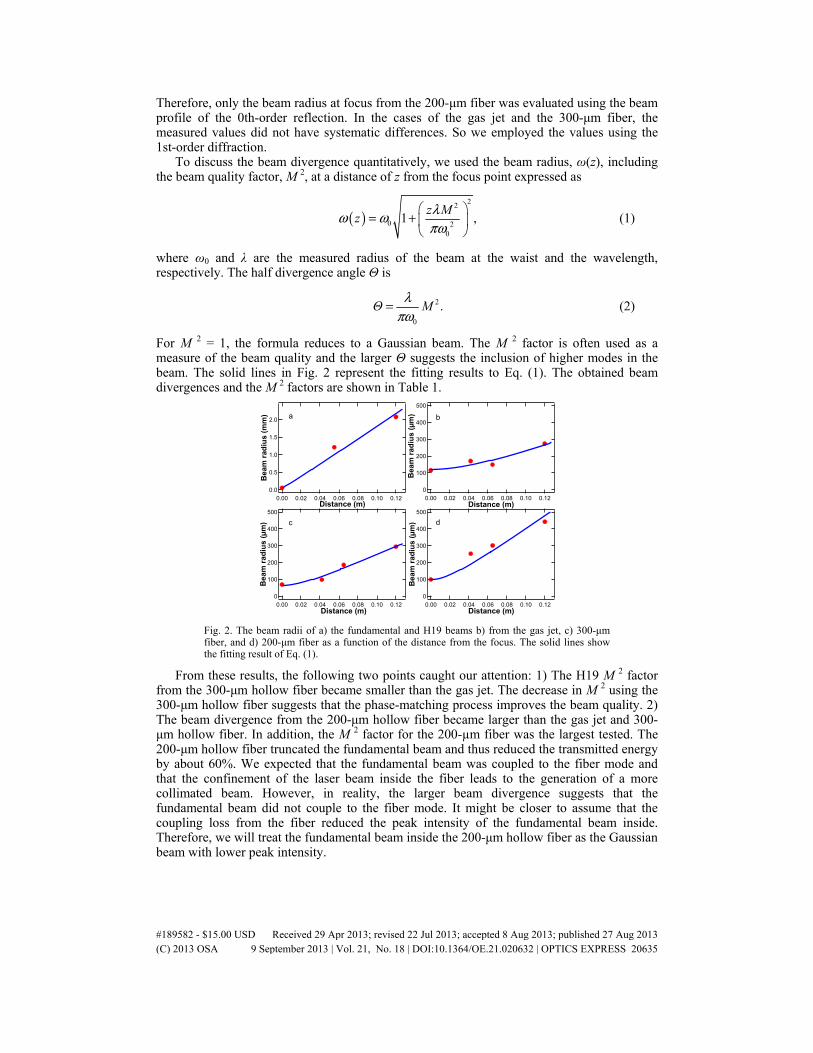
Figures 1(a) shows the beam profile of the 0th-order reflection of all harmonics from the 200-μm fiber after an Al filter at the focus of the toroidal grating. Figures 1(b)-1(e) show the diffracted beam profiles of H19 generated in the 200-μm fiber measured at b) 0, c) 4.2, d) 6.5, and e) 12 cm from the focus point, respectively. The beam diameters were evaluated and then plotted as a function of distance. Figure 2 shows the beam radii of a) the fundamental and H19 beams b) from the gas jet, c) 300-μm fiber, and d) 200-μm fiber as a function of the distance from the focus point.
Fig. 1. a) Beam profile at the 0th-order reflection from the 200-μm fiber at focus. Diffracted beam profiles of H19 generated in the 200-μm fiber measured at b) 0, c) 4.2, d) 6.5, and e) 12 cm from the focus point of the toroidal grating.
Here, we evaluated the beam radius at the focus point from the 200-μm fiber using the beam profile of the 0th-order reflection from the following reason: The beam radius of the 0-th reflection shown in Fig. 1(a) and that of the 1st-diffraction shown in Fig. 1(b) were 980 ± 13 and 1220 ± 13 μm, respectively. At the 0th-reflection, the beam radius was almost same as that of the 200-μm fiber. This is consistent with the experimental condition, where the fundamental beam is truncated by the fiber. At the 1st-order diffraction, the observed beam radius was larger, which is due to the aberration of the toroidal grating. Thus, we employed the value of the 0th-order reflection. The enlargement of the observed value happened only at focus: The diffracted beam radii were found to be almost same after the focus point.
#189582 - $15.00 USD Received 29 Apr 2013; revised 22 Jul 2013; accepted 8 Aug 2013; published 27 Aug 2013(C) 2013 OSA 9 September 2013 | Vol. 21, No. 18 | DOI:10.1364/OE.21.020632 | OPTICS EXPRESS 20634
Therefore, only the beam radius at focus from the 200-μm fiber was evaluated using the beam profile of the 0th-order reflection. In the cases of the gas jet and the 300-μm fiber, the measured values did not have systematic differences. So we employed the values using the 1st-order diffraction.
To discuss the beam divergence quantitatively, we used the beam radius, ω(z), including the beam quality factor, M 2, at a distance of z from the focus point expressed as
( )22
0 20
1 ,z Mz λω ωπω
= +
(1)
where ω0 and λ are the measured radius of the beam at the waist and the wavelength, respectively. The half divergence angle Θ is
2
0
.Θ Mλπω
= (2)
For M 2 = 1, the formula reduces to a Gaussian beam. The M 2 factor is often used as a measure of the beam quality and the larger Θ suggests the inclusion of higher modes in the beam. The solid lines in Fig. 2 represent the fitting results to Eq. (1). The obtained beam divergences and the M 2 factors are shown in Table 1.
a b
c d
2.0
1.5
1.0
0.5
0.0
Bea
mra
dius
(mm
)
0.120.100.080.060.040.020.00Distance (m)
500
400
300
200
100
0
Bea
mra
dius
(µm
)
0.120.100.080.060.040.020.00Distance (m)
500
400
300
200
100
0
Bea
mra
dius
(µm
)
0.120.100.080.060.040.020.00Distance (m)
500
400
300
200
100
0
Bea
mra
dius
(µm
)
0.120.100.080.060.040.020.00Distance (m)
Fig. 2. The beam radii of a) the fundamental and H19 beams b) from the gas jet, c) 300-μm fiber, and d) 200-μm fiber as a function of the distance from the focus. The solid lines show the fitting result of Eq. (1).
From these results, the following two points caught our attention: 1) The H19 M 2 factor from the 300-μm hollow fiber became smaller than the gas jet. The decrease in M 2 using the 300-μm hollow fiber suggests that the phase-matching process improves the beam quality. 2) The beam divergence from the 200-μm hollow fiber became larger than the gas jet and 300-μm hollow fiber. In addition, the M 2 factor for the 200-µm fiber was the largest tested. The 200-μm hollow fiber truncated the fundamental beam and thus reduced the transmitted energy by about 60%. We expected that the fundamental beam was coupled to the fiber mode and that the confinement of the laser beam inside the fiber leads to the generation of a more collimated beam. However, in reality, the larger beam divergence suggests that the fundamental beam did not couple to the fiber mode. It might be closer to assume that the coupling loss from the fiber reduced the peak intensity of the fundamental beam inside. Therefore, we will treat the fundamental beam inside the 200-μm hollow fiber as the Gaussian beam with lower peak intensity.
#189582 - $15.00 USD Received 29 Apr 2013; revised 22 Jul 2013; accepted 8 Aug 2013; published 27 Aug 2013(C) 2013 OSA 9 September 2013 | Vol. 21, No. 18 | DOI:10.1364/OE.21.020632 | OPTICS EXPRESS 20635
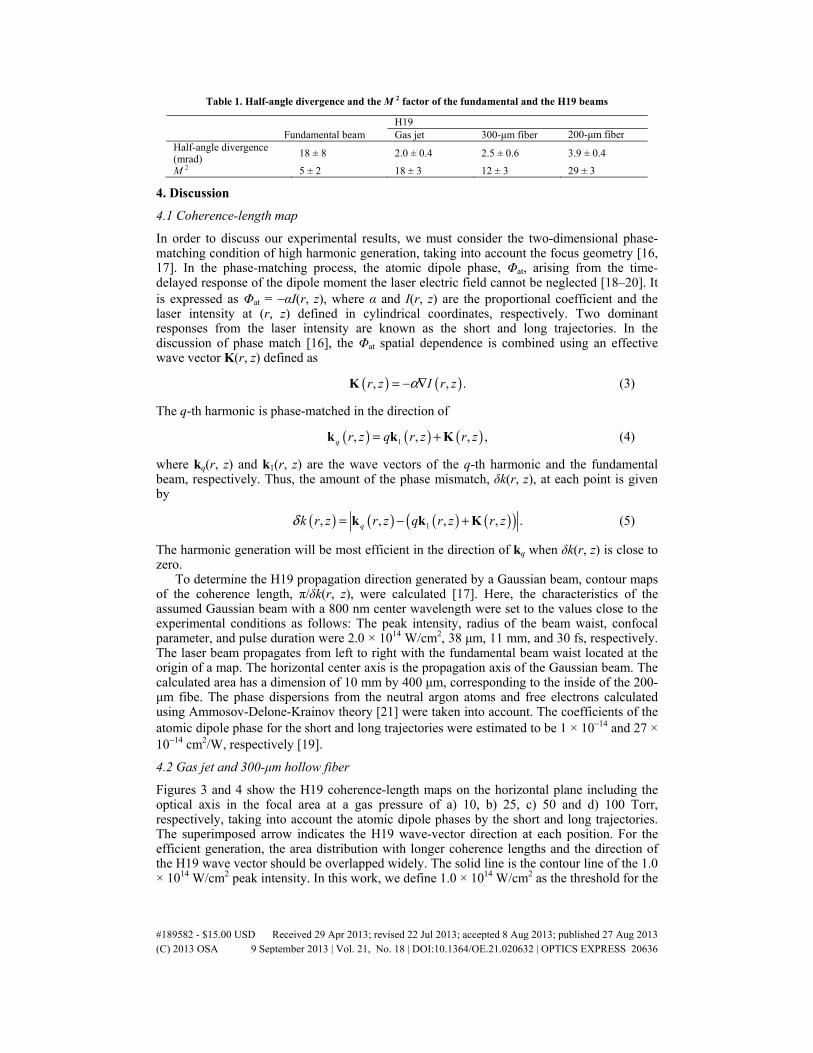
Table 1. Half-angle divergence and the M 2 factor of the fundamental and the H19 beams
Fundamental beamH19Gas jet 300-μm fiber 200-μm fiber
Half-angle divergence (mrad) 18 ± 8 2.0 ± 0.4 2.5 ± 0.6 3.9 ± 0.4
M 2 5 ± 2 18 ± 3 12 ± 3 29 ± 3
4. Discussion
4.1 Coherence-length map
In order to discuss our experimental results, we must consider the two-dimensional phase-matching condition of high harmonic generation, taking into account the focus geometry [16, 17]. In the phase-matching process, the atomic dipole phase, Φat, arising from the time-delayed response of the dipole moment the laser electric field cannot be neglected [18–20]. It is expressed as Φat = −αI(r, z), where α and I(r, z) are the proportional coefficient and the laser intensity at (r, z) defined in cylindrical coordinates, respectively. Two dominant responses from the laser intensity are known as the short and long trajectories. In the discussion of phase match [16], the Φat spatial dependence is combined using an effective wave vector K(r, z) defined as
( ) ( ), , .r z I r zα= − ∇K (3)
The q-th harmonic is phase-matched in the direction of
( ) ( ) ( )1, , , ,q r z q r z r z= +k k K (4)
where kq(r, z) and k1(r, z) are the wave vectors of the q-th harmonic and the fundamental beam, respectively. Thus, the amount of the phase mismatch, δk(r, z), at each point is given by
( ) ( ) ( ) ( )( )1, , , , .qk r z r z q r z r zδ = − +k k K (5)
The harmonic generation will be most efficient in the direction of kq when δk(r, z) is close to zero.
To determine the H19 propagation direction generated by a Gaussian beam, contour maps of the coherence length, π/δk(r, z), were calculated [17]. Here, the characteristics of the assumed Gaussian beam with a 800 nm center wavelength were set to the values close to the experimental conditions as follows: The peak intensity, radius of the beam waist, confocal parameter, and pulse duration were 2.0 × 10¹⁴ W/cm2, 38 μm, 11 mm, and 30 fs, respectively. The laser beam propagates from left to right with the fundamental beam waist located at the origin of a map. The horizontal center axis is the propagation axis of the Gaussian beam. The calculated area has a dimension of 10 mm by 400 μm, corresponding to the inside of the 200-μm fibe. The phase dispersions from the neutral argon atoms and free electrons calculated using Ammosov-Delone-Krainov theory [21] were taken into account. The coefficients of the atomic dipole phase for the short and long trajectories were estimated to be 1 × 10⁻¹⁴ and 27 × 10−14 cm2/W, respectively [19].
4.2 Gas jet and 300-μm hollow fiber
Figures 3 and 4 show the H19 coherence-length maps on the horizontal plane including the optical axis in the focal area at a gas pressure of a) 10, b) 25, c) 50 and d) 100 Torr, respectively, taking into account the atomic dipole phases by the short and long trajectories. The superimposed arrow indicates the H19 wave-vector direction at each position. For the efficient generation, the area distribution with longer coherence lengths and the direction of the H19 wave vector should be overlapped widely. The solid line is the contour line of the 1.0 × 10¹⁴ W/cm2 peak intensity. In this work, we define 1.0 × 10¹⁴ W/cm2 as the threshold for the
#189582 - $15.00 USD Received 29 Apr 2013; revised 22 Jul 2013; accepted 8 Aug 2013; published 27 Aug 2013(C) 2013 OSA 9 September 2013 | Vol. 21, No. 18 | DOI:10.1364/OE.21.020632 | OPTICS EXPRESS 20636
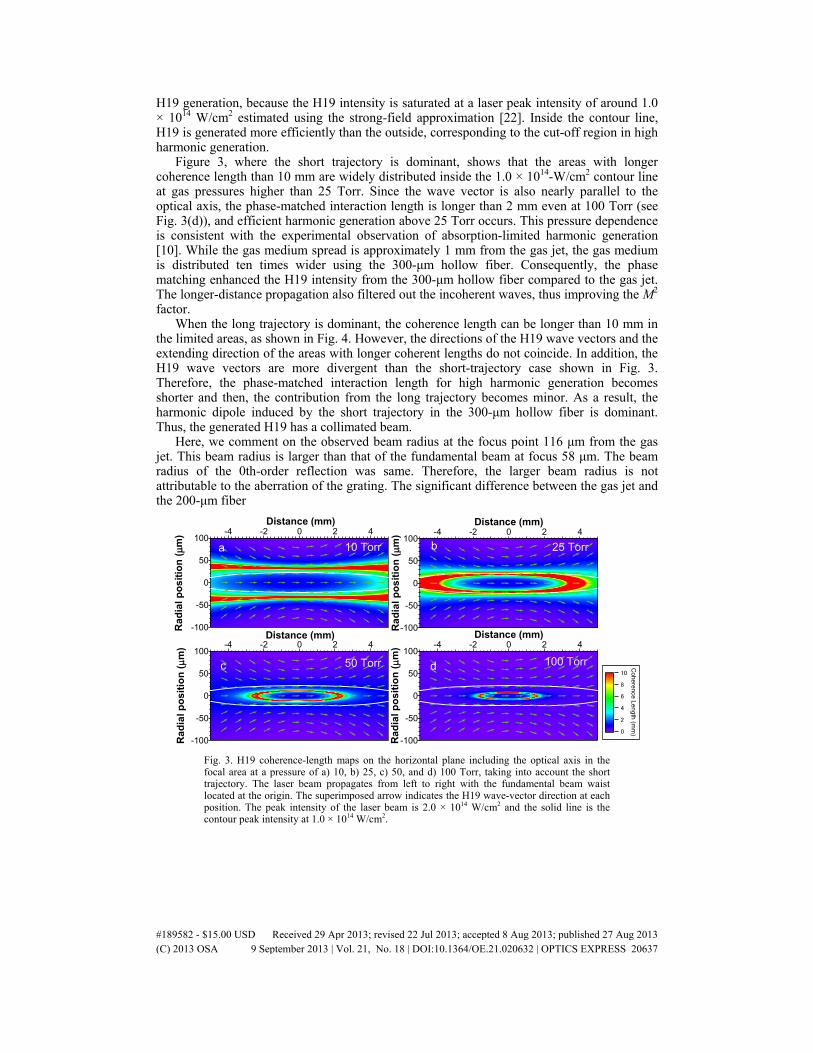
H19 generation, because the H19 intensity is saturated at a laser peak intensity of around 1.0 × 10¹⁴ W/cm2 estimated using the strong-field approximation [22]. Inside the contour line, H19 is generated more efficiently than the outside, corresponding to the cut-off region in high harmonic generation.
Figure 3, where the short trajectory is dominant, shows that the areas with longer coherence length than 10 mm are widely distributed inside the 1.0 × 10¹⁴-W/cm2 contour line at gas pressures higher than 25 Torr. Since the wave vector is also nearly parallel to the optical axis, the phase-matched interaction length is longer than 2 mm even at 100 Torr (see Fig. 3(d)), and efficient harmonic generation above 25 Torr occurs. This pressure dependence is consistent with the experimental observation of absorption-limited harmonic generation [10]. While the gas medium spread is approximately 1 mm from the gas jet, the gas medium is distributed ten times wider using the 300-μm hollow fiber. Consequently, the phase matching enhanced the H19 intensity from the 300-μm hollow fiber compared to the gas jet. The longer-distance propagation also filtered out the incoherent waves, thus improving the M2 factor.
When the long trajectory is dominant, the coherence length can be longer than 10 mm in the limited areas, as shown in Fig. 4. However, the directions of the H19 wave vectors and the extending direction of the areas with longer coherent lengths do not coincide. In addition, the H19 wave vectors are more divergent than the short-trajectory case shown in Fig. 3. Therefore, the phase-matched interaction length for high harmonic generation becomes shorter and then, the contribution from the long trajectory becomes minor. As a result, the harmonic dipole induced by the short trajectory in the 300-μm hollow fiber is dominant. Thus, the generated H19 has a collimated beam.
Here, we comment on the observed beam radius at the focus point 116 μm from the gas jet. This beam radius is larger than that of the fundamental beam at focus 58 μm. The beam radius of the 0th-order reflection was same. Therefore, the larger beam radius is not attributable to the aberration of the grating. The significant difference between the gas jet and the 200-μm fiber
-100
-50
0
50
100
Rad
ialp
ositi
on (
m) -4 -2 0 2 4
Distance (mm)
-100
-50
0
50
100
Rad
ialp
ositi
on (
m) -4 -2 0 2 4
Distance (mm)
-100
-50
0
50
100
Rad
ialp
ositi
on (
m) -4 -2 0 2 4
Distance (mm)
-100
-50
0
50
100
Rad
ialp
ositi
on (
m) -4 -2 0 2 4
Distance (mm)
10
8
6
4
2
0
Co
heren
ceL
eng
th(m
m)
10 Torr 25 Torr
100 Torr50 Torr
ba
c d
Fig. 3. H19 coherence-length maps on the horizontal plane including the optical axis in the focal area at a pressure of a) 10, b) 25, c) 50, and d) 100 Torr, taking into account the short trajectory. The laser beam propagates from left to right with the fundamental beam waist located at the origin. The superimposed arrow indicates the H19 wave-vector direction at each position. The peak intensity of the laser beam is 2.0 × 10¹⁴ W/cm2 and the solid line is the contour peak intensity at 1.0 × 10¹⁴ W/cm2.
#189582 - $15.00 USD Received 29 Apr 2013; revised 22 Jul 2013; accepted 8 Aug 2013; published 27 Aug 2013(C) 2013 OSA 9 September 2013 | Vol. 21, No. 18 | DOI:10.1364/OE.21.020632 | OPTICS EXPRESS 20637

-100
-50
0
50
100
Rad
ialp
ositi
on (
m) -4 -2 0 2 4
Distance (mm)
-100
-50
0
50
100
Rad
ialp
ositi
on (
m) -4 -2 0 2 4
Distance (mm)-100
-50
0
50
100
Rad
ialp
ositi
on (
m) -4 -2 0 2 4
Distance (mm)
-100
-50
0
50
100
Rad
ialp
ositi
on (
m) -4 -2 0 2 4
Distance (mm)
10
8
6
4
2
0
Coherence
Length
(mm
)
10 Torr 25 Torr
100 Torr50 Torr
ba
c d
Fig. 4. H19 Coherence-length maps on the horizontal plane including the optical axis in the focal area at a pressure of a) 10, b) 25, c) 50, and d) 100 Torr, taking into account the long trajectory. The laser beam propagates from left to right with fundamental beam waist located at the origin. The superimposed arrow indicates the H19 wave-vector direction at each position. The peak intensity of the laser beam is 2.0 × 10¹⁴ W/cm2 and the solid line is the contour peak intensity 1.0 × 10¹⁴ W/cm2.
is the beam divergence as demonstrated in Fig. 2 and Table 1. The beam with smaller divergence irradiates the smaller part of the grating, resulting in the smaller aberration in focusing the beam. Hence, we suspect the larger beam radius is due to the shift of the gas jet from the focus point of the fundamental beam, making the emitting area larger. The radius of the fundamental beam becomes 114 μm at 5 mm from the focus. High harmonics are phase-matched efficiently, when a gas jet is placed after the focus. Thus, to generate H19 more efficiently, the gas jet position was slightly shifted and, then, the emitting beam profile became larger than the focus profile.
4.3 200-μm hollow fiber
Then, why are the divergence and M 2 factor from the 200-μm fiber larger than the others? We note that the laser beam transmittance of the hollow fiber was about 60%. Since the phase-matching condition depends on the peak intensity through the density of free electrons, the coherence-length maps should be different from Figs. 3 and 4. Thus, we calculated the coherence maps at a peak intensity of 1.2 × 10¹⁴ W/cm2, as shown in Figs. 5 and 6, for the short and long trajectories, respectively.
Three significant changes from Figs. 3 and 4 can be raised: 1) Fig. 5 shows that the coherence length becomes immediately shorter with an increase in gas pressures above 25 Torr for short trajectories. This is due to the smaller free electron density, compensating for the neutral atom dispersion. 2) Although the broad area with a longer coherence length appears at 25 Torr, that area is outside of the 1.0 × 10¹⁴-W/cm2 contour line. H19 is only efficiently generated inside this line for the short trajectories. Thus, compared with Fig. 3, the harmonic intensity from the short trajectory should be weaker. 3) However, Fig. 6 shows that the area with a longer coherence length at the given pressure is distributed inside the contour line for the long trajectory even at 50 Torr and the H19 wave vector directions are divergent. Taking 2) and 3) into account, the H19 generated from the 1.2 × 10¹⁴-W/cm2 beam is caused by the long trajectory and therefore more divergent. This prediction by the coherence-length map is qualitatively consistent with the experimental result from the 200-μm fiber. Thus, the dipole moment from the long trajectory is favored in the case of the 200-μm hollow fiber.
Figure 6 suggests that the emitting area is smaller than the observed beam diameter 200 μm. However, the H19 wave vector is divergent and part of the beam is truncated and
#189582 - $15.00 USD Received 29 Apr 2013; revised 22 Jul 2013; accepted 8 Aug 2013; published 27 Aug 2013(C) 2013 OSA 9 September 2013 | Vol. 21, No. 18 | DOI:10.1364/OE.21.020632 | OPTICS EXPRESS 20638
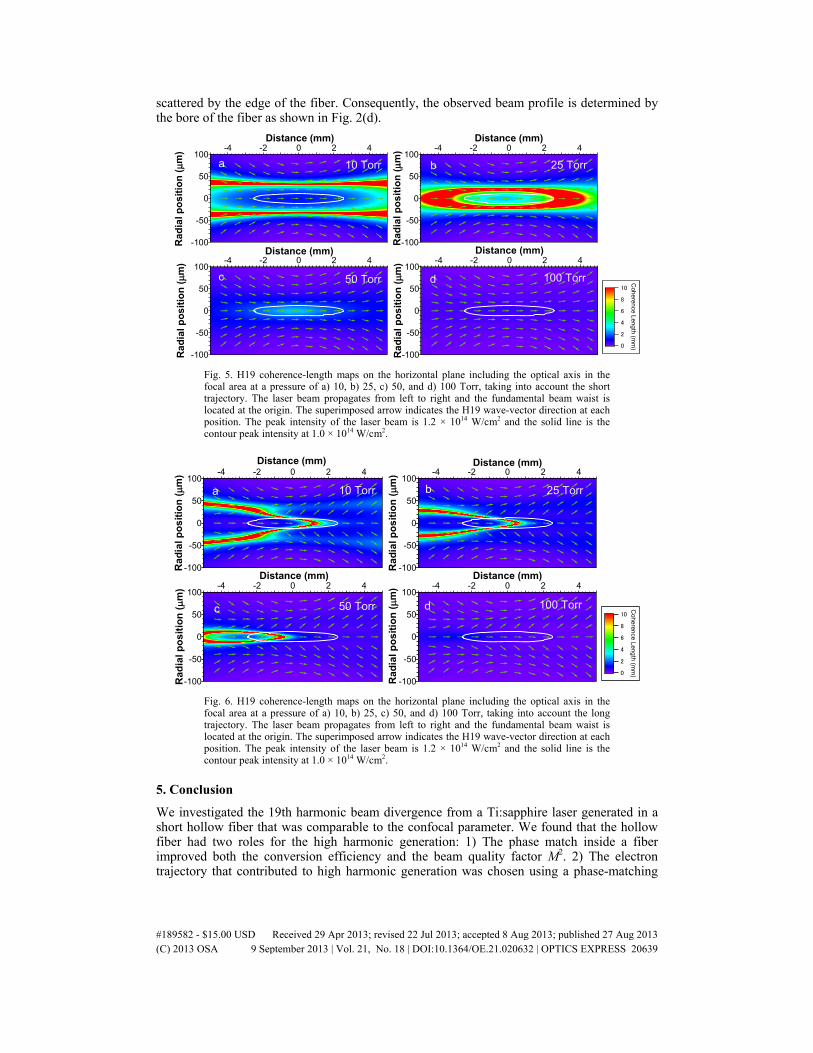
scattered by the edge of the fiber. Consequently, the observed beam profile is determined by the bore of the fiber as shown in Fig. 2(d).
-100
-50
0
50
100
Rad
ialp
ositi
on (
m) -4 -2 0 2 4
Distance (mm)
-100
-50
0
50
100
Rad
ialp
ositi
on (
m) -4 -2 0 2 4
Distance (mm)
-100
-50
0
50
100
Rad
ialp
ositi
on (
m) -4 -2 0 2 4
Distance (mm)
10
8
6
4
2
0
Cohe
rence
Length(m
m)
-100
-50
0
50
100
Rad
ialp
ositi
on (
m) -4 -2 0 2 4
Distance (mm)
a
c d
10 Torr 25 Torr
100 Torr50 Torr
b
Fig. 5. H19 coherence-length maps on the horizontal plane including the optical axis in the focal area at a pressure of a) 10, b) 25, c) 50, and d) 100 Torr, taking into account the short trajectory. The laser beam propagates from left to right and the fundamental beam waist is located at the origin. The superimposed arrow indicates the H19 wave-vector direction at each position. The peak intensity of the laser beam is 1.2 × 10¹⁴ W/cm2 and the solid line is the contour peak intensity at 1.0 × 10¹⁴ W/cm2.
-100
-50
0
50
100
Rad
ialp
ositi
on (
m) -4 -2 0 2 4
Distance (mm)
-100
-50
0
50
100
Rad
ialp
ositi
on (
m) -4 -2 0 2 4
Distance (mm)
-100
-50
0
50
100
Rad
ialp
ositi
on (
m) -4 -2 0 2 4
Distance (mm)
-100
-50
0
50
100
Rad
ialp
ositi
on (
m) -4 -2 0 2 4
Distance (mm)
10
8
6
4
2
0
Cohe
rence
Leng
th(m
m)
d
10 Torr 25 Torr
100 Torr50 Torr
ba
c
Fig. 6. H19 coherence-length maps on the horizontal plane including the optical axis in the focal area at a pressure of a) 10, b) 25, c) 50, and d) 100 Torr, taking into account the long trajectory. The laser beam propagates from left to right and the fundamental beam waist is located at the origin. The superimposed arrow indicates the H19 wave-vector direction at each position. The peak intensity of the laser beam is 1.2 × 10¹⁴ W/cm2 and the solid line is the contour peak intensity at 1.0 × 10¹⁴ W/cm2.
5. Conclusion
We investigated the 19th harmonic beam divergence from a Ti:sapphire laser generated in a short hollow fiber that was comparable to the confocal parameter. We found that the hollow fiber had two roles for the high harmonic generation: 1) The phase match inside a fiber improved both the conversion efficiency and the beam quality factor M2. 2) The electron trajectory that contributed to high harmonic generation was chosen using a phase-matching
#189582 - $15.00 USD Received 29 Apr 2013; revised 22 Jul 2013; accepted 8 Aug 2013; published 27 Aug 2013(C) 2013 OSA 9 September 2013 | Vol. 21, No. 18 | DOI:10.1364/OE.21.020632 | OPTICS EXPRESS 20639

process. This was concluded based on the coherent-length map, taking account of the atomic dipole phase.
Acknowledgments
This work was supported by KAKENHI (23340116 and 23654140), the MATSUO FOUNDATION, the Research Foundation for Opto-Science and Technology, and the ZE Research Program, IAE, Kyoto University ZE25B-35.
#189582 - $15.00 USD Received 29 Apr 2013; revised 22 Jul 2013; accepted 8 Aug 2013; published 27 Aug 2013(C) 2013 OSA 9 September 2013 | Vol. 21, No. 18 | DOI:10.1364/OE.21.020632 | OPTICS EXPRESS 20640


![i .] APPROXIMATING HARMONIC FUNCTIONS 499€¦ · APPROXIMATING HARMONIC FUNCTIONS 499 THE APPROXIMATION OF HARMONIC FUNCTIONS BY HARMONIC POLYNOMIALS AND BY HARMONIC RATIONAL FUNCTIONS*](https://static.fdocuments.in/doc/165x107/5f0873ba7e708231d42214c2/i-approximating-harmonic-functions-499-approximating-harmonic-functions-499-the.jpg)